Back to Journals » Drug Design, Development and Therapy » Volume 12
Formulation design and development of matrix diffusion controlled transdermal drug delivery of glimepiride
Authors Akram MR ![]() , Ahmad M
, Ahmad M ![]() , Abrar A, Sarfraz RM
, Abrar A, Sarfraz RM ![]() , Mahmood A
, Mahmood A
Received 23 July 2017
Accepted for publication 22 December 2017
Published 21 February 2018 Volume 2018:12 Pages 349—364
DOI https://doi.org/10.2147/DDDT.S147082
Checked for plagiarism Yes
Review by Single anonymous peer review
Peer reviewer comments 3
Editor who approved publication: Professor Jianbo Sun
Muhammad Rouf Akram,1 Mahmood Ahmad,1 Asad Abrar,1 Rai Muhammad Sarfraz,2 Asif Mahmood3
1Faculty of Pharmacy & Alternative Medicine, The Islamia University of Bahawalpur, Bahawalpur, Pakistan; 2Faculty of Pharmacy, University of Sargodha, Sargodha, Pakistan; 3Faculty of Pharmacy, University of Lahore, Lahore, Pakistan
Background: The present work was conducted to prepare and evaluate transdermal patches with optimization of suitable polymeric blend of poly(meth) acrylates (Eudragit®) (Ammonio Methacrylate Copolymer Ph Eur) for sustained transdermal delivery of glimepiride.
Method: Polymeric matrix transdermal films were prepared by using Ammonio Methacrylate Copolymer Ph Eur RL 100 and Ammonio Methacrylate Copolymer Ph Eur RS 100 as the film former, and dibutyl phthalate (30% w/w) as the plasticizer. Patches were characterized by physical appearance, thickness, weight variation, folding endurance, percentage erosion, swelling index, moisture content, and moisture uptake capacity. Fourier transform infrared spectroscopic studies and differential scanning calorimetry analysis of physical mixtures of contents were performed to identify any chemical and physical interaction between drug and excipients. Five different enhancers (isopropyl myristate [IPM], Span® 80, Tween® 20, eucalyptus oil, and limonene) were employed at three different concentrations of polymer (2%, 5%, and 10% w/w) in order to enhance permeation through rabbit skin. In vitro drug release studies were performed at pH 7.4, and scanning electron microscopy was conducted to elucidate surface morphology before and after the drug release. In vitro permeation studies through rabbit skin were performed on Franz diffusion cells and permeation kinetics followed the Higuchi model.
Results: Results of in vitro permeation studies revealed that these enhancers not only increased drug release but also augmented the skin permeation of glimepiride.
Conclusion: IPM was the most effective enhancer with the highest permeation flux of 51.763 μg/cm2/hr, and the enhancement effect of different enhancers on glimepiride permeation through rabbit skin was in the rank order of IPM > eucalyptus oil > Span® 80 > Tween® 20> limonene.
Keywords: transdermal patches, polymers, transdermal, permeation enhancers, glimepiride
Introduction
Diabetes mellitus, an endocrine disorder affecting glucose metabolism, has been crippling mankind for the past two centuries. In spite of all the advancements, currently available therapeutic options are a long way from a satisfactory cure.1 In 2012 and 2013, diabetes had resulted in 1.5–5.1 million deaths per year, making it the 8th leading cause of mortality worldwide. If this disease trend continues, by 2035, approximately 592 million people, or one adult in ten, will have diabetes mellitus.2
At present, six classes of oral antidiabetic drugs are available for the treatment of diabetes mellitus type 2. The drawbacks of the conventional drug delivery systems demand the need to use other routes. Attempts have been made to develop transdermal systems, thereby avoiding the shortcomings of conventional drug delivery of antidiabetic drugs. The biggest challenge in the development of transdermal systems is to reduce the barrier property of skin without causing harm and local irritation to the skin.3,4
Glimepiride (Gm) is a third-generation oral antidiabetic sulfonylurea. This drug is frequently prescribed to patients with type 2 diabetes. However, its oral therapy has bioavailability problems due to its poor solubility, leading to variable clinical response, in addition to adverse effects like dizziness and gastric disturbances. For convenient, safe and effective antidiabetic therapy, a transdermal delivery system for Gm should be tried.5
Skin acts as a barrier for transdermal delivery of drugs. Penetration enhancers reduce stratum corneum integrity by temporarily and reversibly disrupting skin’s highly ordered structure.6 Ideally, a permeation enhancer should be safe, nonirritant, and nontoxic, and produce a reversible, temporary enhancement in skin permeability.7
For the effective permeation of drugs through the skin, various penetration enhancers are tried in the formulations. In this study, along with the therapeutic agent for improving the permeation through the skin. Only those enhancers which have been generally recognized as safe agents by the US Food and Drug Administration, ie, terpenes and essential oils, should be used for developing transdermal drug delivery systems. In the present study, five permeation enhancers were used from different chemical classes. Isopropyl myristate (IPM) is a suitable lipid, present in European Pharmacopoeia and has been adopted as a drug penetration enhancer in transdermal formulations.8 Span® 80 and Tween® 20 are non-ionic surfactants and are used as permeation enhancers because these are pharmacologically inactive, less irritant, and non-toxic compared to ionic and cationic surfactants. Limonene belongs to the terpenes, which are naturally occurring volatile oils; it can be a promising candidate for a clinically acceptable permeation enhancer.9
The purpose of the present study was to develop and study the impact of five different enhancers, at three different concentrations of each, on the permeation and release of Gm etc., and to discover the best possible polymeric ratio that offers the optimum permeation effect in the presence of a suitable concentration of a single, or combination of, permeation enhancer(s). So, it therefore can be proposed that selected enhancers, designed formulations and polymeric combinations will potentiate bioavailability of Gm through transdermal route.
Experimental details
Materials
Gm was supplied as a gift sample from Sanofi Aventis (Bridgewater, NJ, USA). Eudragit® (Ammonio Methacrylate Copolymer Ph Eur) RL 100 and Ammonio Methacrylate Copolymer Ph Eur RS 100 were purchased from Evonik Rohm Gmbh, Pharma Polymers (Darmstadt, Germany). Dibutyl phthalate (Merck KGaA, Darmstadt, Germany), methanol, chloroform (Merck) and polyvinyl alcohol (PVA; M.W. 75,000, PanReac AppliChem, Barcelona, Spain) were purchased. All other reagents used were of analytical grade. IPM and eucalyptus oil were purchased from Sigma-Aldrich Co. (St Louis, MO, USA). Span® 80 and Tween® 20 were purchased from Merck. Distilled water was obtained from the water distillation assembly in the research laboratory of the Faculty of Pharmacy and Alternative Medicine, The Islamia University of Bahawalpur (Bahawalpur, Pakistan).
Preparation of transdermal patches
Transdermal matrix patches of Gm were prepared by the solvent evaporation technique. PVA transparent film as backing membrane was prepared by pouring PVA (4% w/v) solution into Petri plates and drying in a hot air oven at 40°C. Different ratios of polymers, drug, and plasticizer (dibutyl phthalate) were dissolved in chloroform and methanol mixture (9:1 v/v) by sonication. The composition of polymeric films is given in Table 1. Polymeric combinations were dried at a temperature of 35°C for 48 hours in a hot air oven. Similarly, Gm, Ammonio Methacrylate Copolymer Ph Eur RL 100: Ammonio Methacrylate Copolymer Ph Eur RS 100 (350 mg, in ratio of 7:3) solution was prepared in a chloroform and methanol mixture.10 Five different enhancers (2%, 5%, or 10% w/w) were also added to the polymer solution. The resultant matrix solution was poured into glass Petri dishes already containing backing membranes and allowed to evaporate for 48 hours in hot air oven at 35°C. For controlled evaporation, Petri dishes were covered with inverted funnels. After drying, patches were taken out of the Petri dishes, wrapped with aluminum foil, and stored separately in desiccators at room temperature for further analysis.
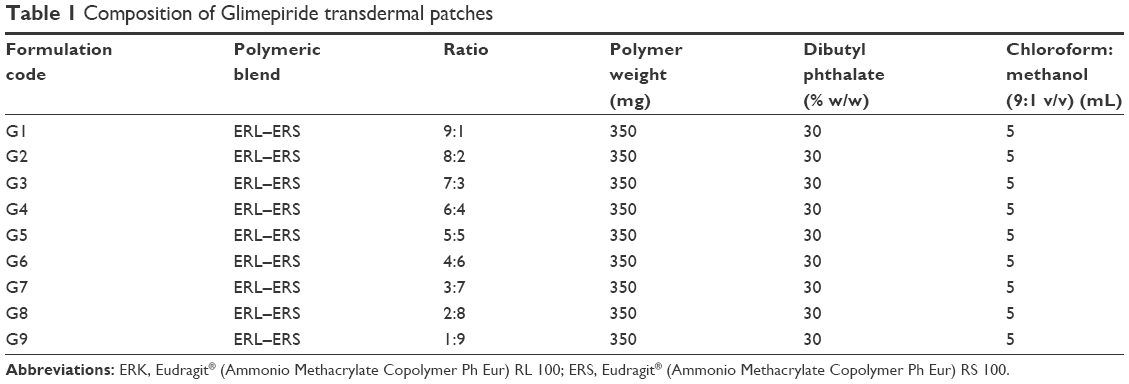 | Table 1 Composition of Glimepiride transdermal patches |
Physical examination of patches
All the formulated polymeric Gm patches were evaluated visually for appearance in terms of surface smoothness, brittleness, transparency, stickiness, flexibility, and homogeneous appearance.
Weight variation
Weight variation was tested by selecting three patches randomly out of each formulation and weight uniformity of dried and cut patches was checked on a digital weight balance (Shimadzu AUX220, Shimadzu Corp., Kyoto, Japan). Average weight of three patches of 1.5 cm2 from each formulation provided information regarding weight variation among different formulations.11
Thickness
The thickness of transdermal patches was determined using a micrometer screw gauge (Sharp fine Type-A, Zhejiang, China). Three random samples of each formulation were selected for the thickness test. The thickness value was noted at three different points of the same patch and the mean thickness was calculated. The same procedure was repeated for two other patches and their means were calculated.12
Folding endurance
The folding endurance of patches was evaluated by folding repeatedly a polymeric film of 2×2 cm at the same point until it broke. The 2×2 cm of film was taken from the center as well as from edge of the patch. The test was conducted on three randomly selected patches from each formulation.13 The average and standard deviation were calculated using SPSS software (IBM SPSS statistics, version 20.0; IBM Corporation, Armonk, NY, USA).
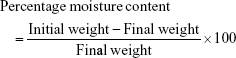
Percentage moisture content
The percentage moisture content was determined for each formulation. A film of 1×1 cm was taken from each patch. These films were weighed individually using a digital weight balance. These polymeric films were then placed in labeled Petri dishes and stored in a desiccator containing silica beads at 25°C. The films were weighed for 5 days or until invariable weight was achieved. The percentage moisture content was calculated using the following formula:14
|
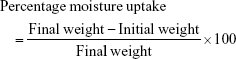
Percentage moisture uptake
The percentage moisture uptake was determined for each formulation. Transdermal film of 1×1 cm was cut from each patch. Films were weighed individually by using a digital weighing balance. These films were then placed in labeled Petri dishes and stored at 25°C in a desiccator15 containing 200 mL saturated solution of potassium chloride for 84% relative humidity (RH).14 The transdermal films were continuously weighed for 5 days of storage or until constant weight was achieved. The percentage moisture uptake was calculated using the following formula:
|
Water vapor transmission rate
The water vapor transmission rate was estimated for each formulation. Three films of 1×1 cm were cut from the patch. The transdermal films were fixed in 5 mL vials and 1 g of CaC12 was placed in each of these vials. The vials were then individually weighed and then kept in the desiccator at 25°C containing 200 mL saturated solution of potassium chloride for 84% relative humidity. These vials were weighed for 5 days using a digital weight balance and the weight was noted. The water vapor transmission was calculated using the formula:16
|
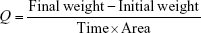
where Q = water vapor transmission rate.
Water vapor permeability
Three films of 1×1 cm with known weight and thickness were fixed in a 5 mL vial having silica beads as desiccant. Vials were weighed individually and kept in an incubator containing saturated solution of potassium chloride to attain 84% relative humidity at 30°C. These vials were weighed for 24 hours and the weight was noted. The water vapor permeability was calculated using the following formula:17
|
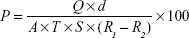
where: P = permeability; Q = amount of water vapor absorbed (mg) at time T; d = film thickness (cm); A = area (cm2); S = saturated water vapor pressure at test temperature (Pa); R1 = relative humidity (RH) in the chamber (84% RH), R2 = relative humidity inside the vial (0% RH).
Swelling index and percentage weight increase
The swelling index was determined for each formulation. Three films of 1×1 cm size were cut from a patch. These films were fixed on preweighed cover slips and reweighed. These films were then placed in labeled Petri dishes. Distilled water was poured into each Petri dish until these polymeric films were absolutely immersed in water. After intervals of 5, 10, 30 and 60 minutes, the cover slips were removed, blotted to remove excess of water and weighed immediately. In cases where transdermal films exhibited any sign of disintegration or began to dissolve, the experiment was immediately discontinued. The swelling index and percentage weight increase due to swelling was calculated using the following formulas:18
|
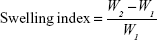
|
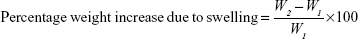
where: W1 = initial weight of the film before swelling; W2 = weight of the film after time t after swelling.
Erosion studies
Weight loss due to erosion was determined for each formulation. Patches of 1×1 cm dimensions were cut and dried overnight at 40°C±2°C. These films were fixed on preweighed cover slips and weighed on a digital weighing balance. The cover slips were placed in properly labeled large Petri dishes. Distilled water was poured into the Petri dishes until the polymeric films were fully immersed in water. After 60 minutes, the cover slips were removed from the Petri dishes, blotted to remove excess of water and weighed on a digital weighing balance. Films that had completely disintegrated after 60 minutes were discarded without any attempt at weighing. The percentage erosion was calculated using the following formula:18
|
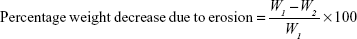
where, W1 = initial weight of film before erosion; W2 = weight of the film after time t.
FTIR spectroscopy analysis
In order to evaluate any possible interaction between Gm and polymeric materials, FTIR analysis was performed. IR spectra for Gm, Ammonio Methacrylate Copolymer Ph Eur RS 100, Ammonio Methacrylate Copolymer Ph Eur RL 100, and their physical mixture were recorded. Samples were directly placed in a sample holder and scanning was performed in the range of 4,000–600 cm−1 by using Attenuated Total Reflectance Shimadzu Fourier transform infrared (FTIR) (Shimadzu IR Prestige 21, Shimadzu). Opus data collection software (Bruker, Germany) was used for analysis.19,20
Differential scanning calorimetry (DSC) analysis
In order to determine a possible interaction between ingredients, DSC studies were carried out to record DSC thermograms of Gm, Ammonio Methacrylate Copolymer Ph Eur RS 100, Ammonio Methacrylate Copolymer Ph Eur RL 100, and their physical mixture. DSC studies were conducted using a differential scanning calorimeter (SDT Q600, TA Instruments, New Castle, DE, USA). Samples (2.5–5.0 mg) were placed in an aluminum crucible cell, firmly crimped with the lid to provide an adequate seal. Samples were scanned at 20°C/min over the temperature range 0°C–800°C under the nitrogen environment.
Scanning electron microscopy (SEM)
Surface morphology of polymeric patches after drug release was examined by electron microscope (Quanta 250) using Maker FEI® software (Hillsboro, Oregon, USA).
X-ray diffraction (XRD) studies
X-ray diffraction patterns of pure drug (Gm), placebo films and Gm loaded matrix films were obtained using a XRD Xpert-pro with software PAN analytical (PANanalytical X’Pert HighScore Plus, Amsterdam, the Netherlands), in order to confirm nature ie, crystalline or amorphous. Measurement conditions were comprised of a target Cu-Ka radiation anode of voltage 30 kV and current 15 mA. Diffractograms were captured using a step width of 0.02° 2θ between 2° and 60° at a rate of 2° min−1 at ambient temperature.
In vitro release studies
Dissolution studies were performed to investigate the effect of polymers and polymeric blends in in vitro release of Gm from matrix patches by using the paddle over disk method. After 3 days of storage in a desiccator, a patch of area 1.5 cm2 was placed in the disc assembly in such a way that the release surface was facing upward. The disc assembly (composed of watch glass, 125 μm stainless steel mesh and clips) was used to hold the patch at the bottom of dissolution vessel.9 Five hundred mL of a phosphate buffer solution (pH 7.4) was stirred at 50 rpm, and the temperature was maintained at 32°C±1°C.20 Three mL of the sample was withdrawn at different time intervals (0, 0.5, 1, 1.5, 2, 3, 4, 6, 8, 12, and 24 hours) using an automated fraction collector (Pharma Test, Nuremberg, Germany) after filtering through Millipore filters. Each time the sample volume was replaced by fresh buffer solution to maintain sink conditions. Samples were then analyzed without dilution on an UV-Vis Spectrophotometer (IRMCO U2020; IRMECO, Geesthacht, Germany) at 228 nm for Gm by using a phosphate buffer as a blank. All the measurements were made in triplicate. Release data were subjected to various kinetic models, ie, zero order, first order, Higuchi plot and Korsmeyer–Peppas model, to find out the best fit model and mechanism of drug release.
Kinetic modeling on drug release from transdermal patches
After in vitro dissolution and ex vivo permeation of transdermal patches containing Gm, mathematical models were applied to discover the kinetics of drug release from the transdermal patches. Quantitative analysis of data obtained in dissolution and permeation studies was easier when mathematical formulae were used to describe the process. Mathematical models ultimately helped to optimize the design of the transdermal system.
To study the drug release from transdermal formulation, data obtained from in vitro drug dissolution and ex vivo permeation studies were plotted as log cumulative percentage drug release versus log time.21 The Korsmeyer–Peppas model can be represented as:
|

where: Mt/M∞ = fraction of drug released at time t; Mt = total amount which was released at time t; M∞ = total amount of drug present in the patches; t = release time in hours; K = kinetic constant; n = release exponent indicative of operating release mechanism.
If the value of n is approaching 0.5, then drug release from developed polymeric patches will follow Fickian diffusion. If it approaches 1, then zero order is the release mechanism. If n=0.5 or between 0.5 and 1, the release behavior will be non-Fickian.22,23
Ex vivo skin permeation studies
Preparation of rabbit skin
Rabbits used in the study were provided by the animal house of the Faculty of Pharmacy and Alternative Medicine, the Islamia University of Bahawalpur (Bahawalpur, Pakistan). The study and experiment protocols were reviewed and approved by the Pharmacy Research Ethics Committee (PREC) vide notification no 96 – 2015/PREC. Moreover, PREC guidelines were followed for the welfare of experimental animals. Rabbits of weight 1–1.2 kg were used in permeation experiments. Long hairs were cut with scissors. Depilatory cream (Anne French, Karachi, Pakistan) was applied for 10 min to remove hairs from the abdominal region. The hairless skin of the abdomen was excised after 2 days with a surgical sharp-edged blade.24 Rabbits were sacrificed, and the full thickness skin was excised.25 Rabbit skin was selected for permeation studies because it has been utilized previously, as it offers passive permeability comparable to human skin.26 Freshly excised skin was placed for 1 min in distilled water maintained at 55°C to remove fats and subcutaneous tissues. The skin was washed with fresh distilled water and dipped in a phosphate buffer at pH 7.4 for 5 min. The excised skin was carefully checked visually for integrity. Any damaged skin was rejected. The prepared skin was wrapped in aluminum foil, stored at −20°C and used within 2 weeks of storage.27
Permeation experiments
Permeation studies on rabbit skin were performed on a vertical type of diffusion cell, ie, Franz diffusion cell (Perme Gear, Bethlehem, PA, USA). Franz diffusion cells consist of two compartments with an outer jacket. The outer jacket was connected to a water bath (Brookfield, WI, USA) at 37°C in order to provide a temperature of 32°C±1°C in the receptor compartment. The receptor compartment had a volume of 12 mL and a diffusion area of 1.5 cm2. Before the experiment, the stored skin was allowed to maintain a temperature of 32°C by placing the skin in a phosphate buffer of pH 7.4 for 1 hour. The receptor compartment was filled with a phosphate buffer pH 7.4.28 The rabbit skin was mounted between the donor and the receptor compartments in such a way that the stratum corneum was facing towards the donor compartment. A piece of patch of an area 1.5 cm2 was cut from a larger patch with the help of a stainless steel cutter. A circular patch was placed on the skin with the releasing side facing towards the mounted skin. The receptor fluid was continuously stirred at a speed of 120 rpm with magnetic bars on a magnetic stirrer (VELP Scientifica, Usmate, Italy) to provide sink conditions. At predetermined intervals of 0.5, 1, 1.5, 2, 3, 4, 6, 8, 12, and 24 hrs, 1 mL of receptor fluid was withdrawn from the sampling port with the help of a long needle syringe. The receptor fluid was replaced with fresh phosphate buffer. Care was taken during sampling to avoid any bubble formation in the receptor compartment, because trapped air may reduce the permeation area. In case of air entrapment, the Franz diffusion cell was tilted to remove the trapped air through the sampling port. The donor compartment was covered with aluminum foil. After appropriate dilution, samples were analyzed on a UV spectrophotometer. Each formulation was subjected to permeation experiments three times.
Ex vivo permeation data analysis
The amount of drug permeated Qn (μg/cm2) at each sampling point was calculated using following equation:
|

where: S = permeation area of the Franz cell, ie, 1.5 cm2.
A 1 mL sample was withdrawn from the Franz diffusion cell at particular time intervals for 24 hours and the volume of the cell was kept constant by replacing an equal volume of receptor fluid at each sampling time. To evaluate the actual amount of drug permeated through the skin membrane, correction of the drug concentration for the dilution and sampling effect is needed. The corrected drug concentration can be determined by following equation:29
|

where: Q’n is the corrected concentration of nth samples; Cn is the measured concentration of nth samples; Vt is the volume of receptor compartment; Vs is the sample withdrawn; Qn–1 is the corrected concentration of (n–1)th samples; and Cn–1 is the measured concentration of drug in (n–1)th samples.
The permeation profile was obtained by plotting the cumulative amount permeated against time. The permeation flux (J μg/cm2/h) was calculated from the slope of linear portion of plotted curve.30
Statistical analysis
Results of in vitro release and ex vivo permeation studies were analyzed statistically using SPSS software (version 15). One-way analysis of variance was performed followed by post hoc multiple comparison using least square difference, with α=0.05 and α=0.01 taken as the level of significance for release and permeation data respectively.
Results and discussion
Physical characterization
Results of physical characterization are summarized in Table 2. All polymeric films were found to be flexible and non-brittle. Polymer films containing Ammonio Methacrylate Copolymer Ph Eur RL 100 and Ammonio Methacrylate Copolymer Ph Eur RS 100 in combination were sticky in nature and had the desired physical appearance. Blank patches were less sticky as compared to patches containing the drug. The backing membrane was firmly attached to the matrix layer. All Gm formulations showed a thickness of 710–725 μm and an average weight range for a 1.5 cm2 patch was 32.3–33.7 mg. The weight variation and thickness of patches was evaluated by the method reported by El-Gendy et al31 Folding endurance values of transdermal patches were found to be satisfactory, which indicates that formulated patches had optimum flexibility and were not brittle. Drug content ranged from 97.25% to 101.98%. Moisture content, ie, 3.39%–4.89%, was low for polymeric films, which could be helpful in the stability of formulation.14 With an increase in concentration of hydrophobic polymer Ammonio Methacrylate Copolymer Ph Eur RS 100, the moisture uptake was decreased.32 Ammonio Methacrylate Copolymer Ph Eur RS 100 has low swelling index due to that fact that minimum pores were formed in the matrix, so minimum moisture uptake occurred from environment. Moisture uptake in the patches ranged from 4.47% to 7.16%. It increased the stickiness of Ammonio Methacrylate Copolymer Ph Eur patches.10 Similarly, use of hydrophobic polymer Ammonio Methacrylate Copolymer Ph Eur RS 100 restricts the increase in water vapor permeability transmission. An increase in Ammonio Methacrylate Copolymer Ph Eur RS 100 in formulation decreases the water vapor permeability and transmission rate. The swelling index remained in the range 0.839 to 1.337. Lower moisture content in the formulations helps them to remain stable, while moisture protects the material from microbial contamination and bulkiness.
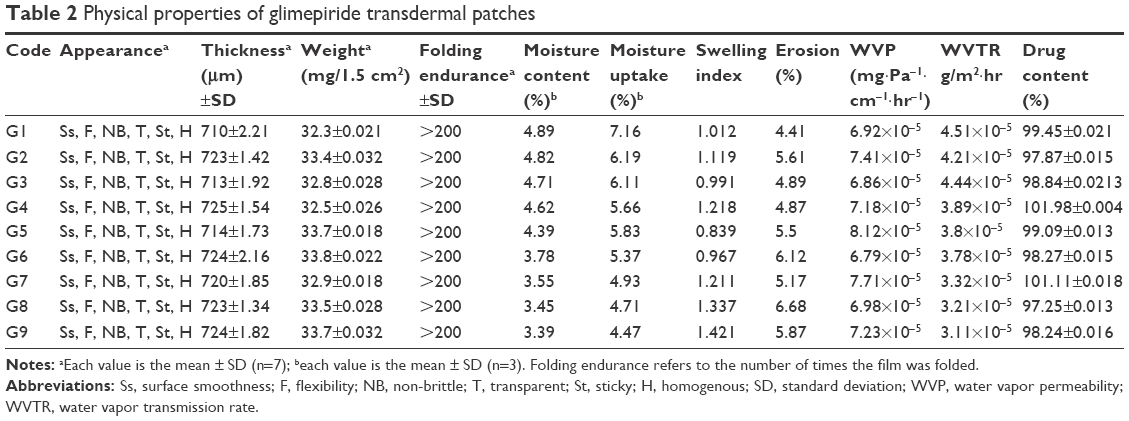 | Table 2 Physical properties of glimepiride transdermal patches |
FTIR spectroscopic analysis
FTIR spectroscopy was performed for Gm, Ammonio Methacrylate Copolymer Ph Eur RL 100, Ammonio Methacrylate Copolymer Ph Eur RS 100, and prepared patches of polymer blends to find any physical and chemical interaction between polymers and the drug. Spectra are shown in Figure 1. The FTIR spectra of pure Gm had characteristic peaks at 3,369 cm−1 and 3,288 cm−1 corresponding to N-H stretching, 1,707 cm−1 and 1,674 cm−1 due to carbonyl stretching, 1,345 cm−1 describing C-N stretching, and 1,153 showing S=O vibration.33 These characteristic peaks of Gm were also found in prepared patches of polymeric blends. The results of FTIR spectroscopic analysis indicate that there was no chemical incompatibility between Gm and the polymers (Ammonio Methacrylate Copolymer Ph Eur RL 100 and Ammonio Methacrylate Copolymer Ph Eur RS 100) used.
 | Figure 1 FTIR spectra of (A) Glimepiride, (B) Eudragit® (Ammonio Methacrylate Copolymer Ph Eur) RL 100, (C) Ammonio Methacrylate Copolymer Ph Eur RS 100, (D) physical mixture of polymers plus drug. |
SEM
The surface morphology of optimized formulation of Gm was examined after drug release under electron microscope. The surface showed the formation of irregular-shaped gaps due to leaching of water soluble polymer. The findings from SEM images of Ammonio Methacrylate Copolymer Ph Eur RL 100 and Ammonio Methacrylate Copolymer Ph Eur RS 100 blended patches were in accordance with findings of Mutalik et al,34 where pores were observed on the patch surface after drug (glipizide) release from patch. In another study Kumar et al35 observed that, after release of stavudine from an Ammonio Methacrylate Copolymer Ph Eur patch, the distorted portion of membrane maintained elasticity in the affected area, with little effect on other parts of transdermal membrane. The findings of SEM images were in contrast to findings of Yaqoob et al,10 where patch surface morphology was non-porous after drug release. From SEM results of Gm, it was observed that the formulation maintained the elastic nature of the film after release of drug molecules without affecting other parts of the patch. SEM photographs are shown in Figure 2.
 | Figure 2 Scanning electron microscopy micrographs (A) before drug release at 200 μm, (B) after drug release at 200 μm, (C) after drug release at 100 μm, (D) after drug release at 50 μm. |
XRD studies
X-ray diffraction studies were undertaken to confirm the physicochemical characteristics of Gm in the polymeric matrix of transdermal patches. The pure Gm exhibited sharp peaks of diffraction at an angle of 2θ value of 13.52°, 18.23°, and 21.18°, etc. X-ray diffractograms are shown in Figure 3, which indicate the presence of crystalline Gm. Previously, Mokale et al33 observed that the diffraction spectra of pure Gm showed sharp and intense peaks of crystallinity. Diffractograms of the physical mixture of Gm and Ammonio Methacrylate Copolymer Ph Eur RL 100 plus Ammonio Methacrylate Copolymer Ph Eur RS 100 similarly showed some broader peaks with lesser intensity, while in diffractograms of the Gm patch fused peaks were present instead of sharp, intense peaks. The lack of characteristic peaks of Gm confirmed that the drug was molecularly dispersed and converted into amorphous form in the polymeric films.
 | Figure 3 X-ray diffractograms of (A) glimepiride loaded polymeric patches, (B) physical mixture, glimepiride, Eudragit® (Ammonio Methacrylate Copolymer Ph Eur) RS 100, and Ammonio Methacrylate Copolymer Ph Eur RL 100, and (C) pure glimepiride. |
DSC
Differential scanning calorimetry was performed to confirm the identity and purity of the drug. The DSC thermogram of pure Gm exhibited an endothermic peak at 234.14°C (Figure 4), which started to melt at 228.26°C, corresponding to its melting point reported in the literature. In a study by Mokale et al,33 the thermogram of Gm also showed a sharp endothermic peak at 234°C. The physical mixture of Gm plus Ammonio Methacrylate Copolymer Ph Eur RL 100 and Ammonio Methacrylate Copolymer Ph Eur RS 100 showed an endothermic peak at 233.71°C, nearly the same temperature, indicating no interaction between drug and excipients.
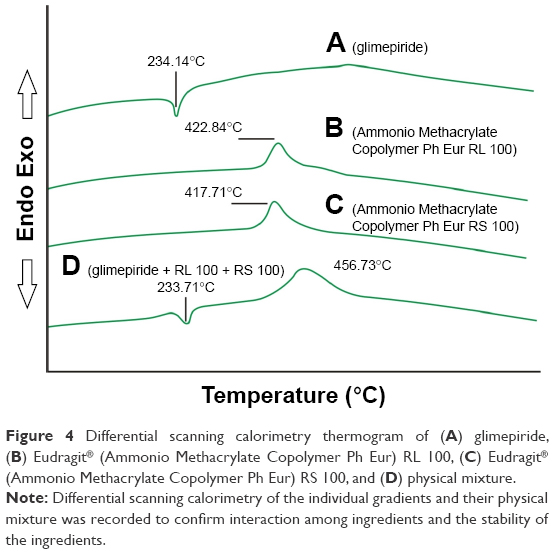 | Figure 4 Differential scanning calorimetry thermogram of (A) glimepiride, (B) Eudragit® (Ammonio Methacrylate Copolymer Ph Eur) RL 100, (C) Eudragit® (Ammonio Methacrylate Copolymer Ph Eur) RS 100, and (D) physical mixture. |
In vitro release studies
Dissolution studies were performed in USP dissolution apparatus 5 to evaluate the effects of polymeric blends on the release of Gm from matrix patches and to screen out the best one for sustained delivery of Gm for 24 hrs. Dissolution experiments were conducted for 24 hours and samples were obtained at various time points by automated fraction collector (Pharma Test). These samples were analyzed for quantification of Gm. The percentage amount of drug released from transdermal patches G1–G9 was calculated in Microsoft Excel 2007 using standard calibration curves. The cumulative drug release (%) was plotted against time. Formulation G3 with a polymeric ratio 7:3 of Ammonio Methacrylate Copolymer Ph Eur RL 100 and Ammonio Methacrylate Copolymer Ph Eur RS 100 showed maximum drug release compared to the other polymeric blends. The effects of different concentrations of Ammonio Methacrylate Copolymer Ph Eur RL 100 and Ammonio Methacrylate Copolymer Ph Eur RS 100 on the Gm release profile are shown in Figure 5.
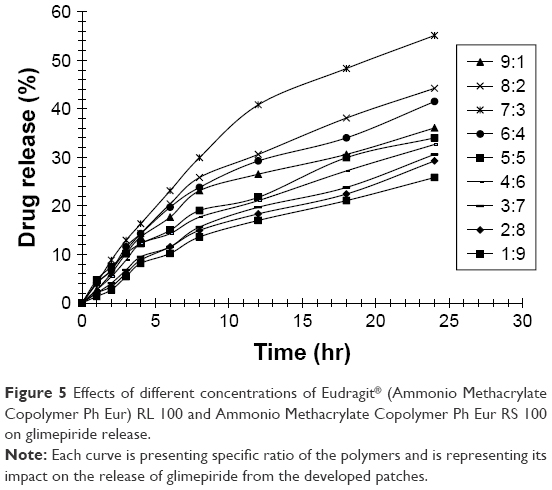 | Figure 5 Effects of different concentrations of Eudragit® (Ammonio Methacrylate Copolymer Ph Eur) RL 100 and Ammonio Methacrylate Copolymer Ph Eur RS 100 on glimepiride release. |
For Ammonio Methacrylate Copolymer Ph Eur RL 100 and Ammonio Methacrylate Copolymer Ph Eur RS 100 patches, Ammonio Methacrylate Copolymer Ph Eur RS 100 has low permeability and release ability. The release was found to be dependent on the Ammonio Methacrylate Copolymer Ph Eur polymer RL 100, and the release rate increased as the Ammonio Methacrylate Copolymer Ph Eur RL 100 content in the patches increased. This water permeable polymer may be responsible for the slow and constant release of Gm up to 24 hours. For the patches prepared using a higher percentage of Ammonio Methacrylate Copolymer Ph Eur RS 100, it was found that the drug release decreased significantly (p<0.025).
Transdermal formulations having a polymeric combination of Ammonio Methacrylate Copolymer Ph Eur RL 100 and Ammonio Methacrylate Copolymer Ph Eur RS 100 in 7:3 (w/w) with three different concentrations of enhancers were prepared and evaluated. Release profiles of Gm transdermal patches with enhancers were determined by performing dissolution studies. Dissolution studies showed an increase in concentration of Gm in dissolution medium with the passage of time. The percentage amount of Gm released from transdermal patches with five enhancers (IPM, Span® 80, Tween® 20, eucalyptus oil, and limonene) with their three different levels at various time points are shown in Figure 6A–E, respectively. Figure 6F explains different enhancers levels showing paramount Gm release from matrix patches. The rate and extent of drug release from a transdermal drug delivery system was greatly influenced by physicochemical properties of drug, polymers, and other excipients used to formulate the transdermal system, as shown in Figure 6E and F.
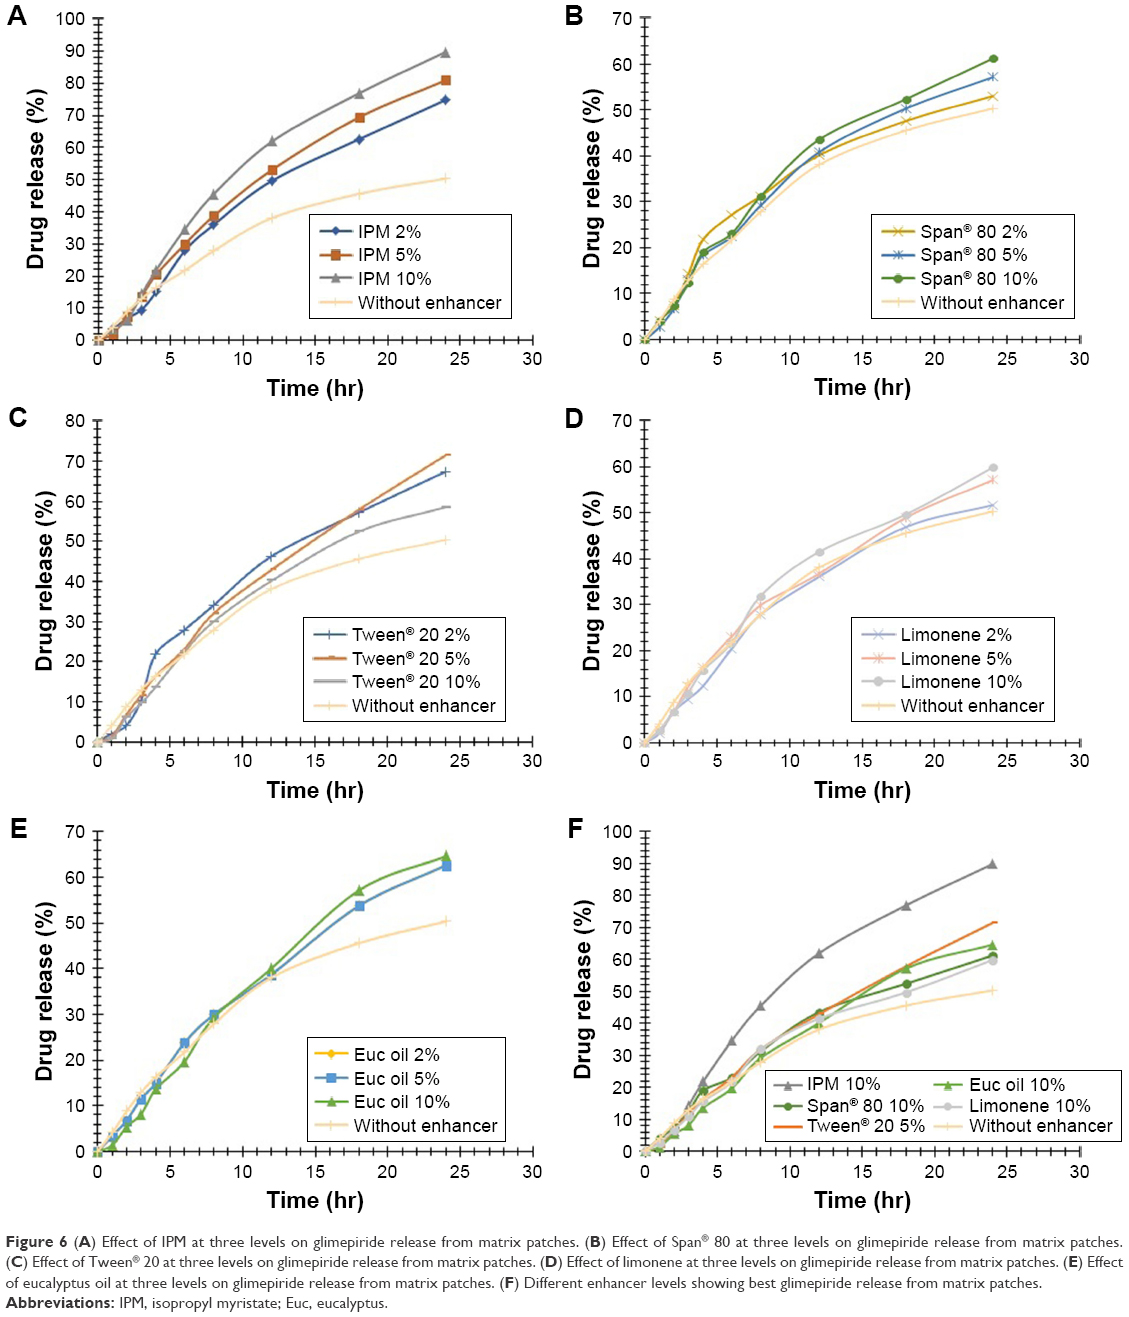 | Figure 6 (A) Effect of IPM at three levels on glimepiride release from matrix patches. (B) Effect of Span® 80 at three levels on glimepiride release from matrix patches. (C) Effect of Tween® 20 at three levels on glimepiride release from matrix patches. (D) Effect of limonene at three levels on glimepiride release from matrix patches. (E) Effect of eucalyptus oil at three levels on glimepiride release from matrix patches. (F) Different enhancer levels showing best glimepiride release from matrix patches. |
All newly prepared transdermal formulations of Ammonio Methacrylate Copolymer Ph Eur RL 100 and Ammonio Methacrylate Copolymer Ph Eur RS 100 with different enhancers showed higher amounts of drug released at a constant rate. Release of Gm was extended up to 24 hours at a controlled rate. The highest amount of Gm (89.82%) was released from the formulation containing IPM 10% (w/w) as the permeability enhancer (p=0.012). The lowest amount of Gm (50.35%) was released from the formulation without an enhancer.
The mechanism of drug release from a polymeric device was explained by various researchers.10,38 Ammonio Methacrylate Copolymer Ph Eur polymers produce polymeric films having comparatively larger gaps. These large channelized gaps were produced by irregular arrangements of polymeric molecules. It causes an increase in space among the molecules followed by increased uptake of external volume and decreased density of polymeric matrix. This phenomenon provides huge channels for penetration of dissolution medium. In addition, presence of Ammonio Methacrylate Copolymer Ph Eur RL 100 causes leaching out of the drug and formation of porous membranes. The porous patch membrane provides a distended area for the external solvent to diffuse, resulting in rapid release of the drug from the polymeric matrix.
The release mechanisms of the drug from controlled release systems are either purely erosion controlled or purely diffusion controlled. In many cases, release may follow both mechanisms. Results of kinetic analysis of release data for first order, zero order, Higuchi plot and Korsmeyer–Peppas model are summarized in Table 3. The correlation coefficient (R obs–pre, r2) values obtained from analysis of the data using DD Solver® (Springer, China) showed that release followed the Higuchi and Korsmeyer–Peppas model. This means that release was by diffusion of the drug. Values of the Higuchi rate constant are significantly different for different blends of polymeric ratios. Moreover, the highest value of the Higuchi rate constant was obtained for formulation G3 having the polymeric ratio 7:3 of Ammonio Methacrylate Copolymer Ph Eur RL 100 and Ammonio Methacrylate Copolymer Ph Eur RS 100. Value of n exponent obtained from the Korsmeyer–Peppas model was between 0.5–1 that confirmed that drug release from patches followed a non-Fickian diffusion mechanism of release. Polymeric films followed the Higuchi model of release; formulation G3 (7:3) showed the highest value of Higuchi rate constant and was chosen for permeation studies through rabbit skin.
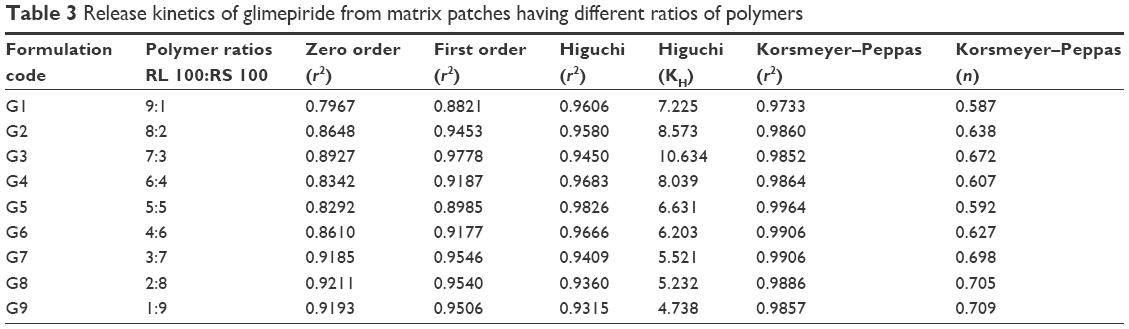 | Table 3 Release kinetics of glimepiride from matrix patches having different ratios of polymers |
Drug release kinetics
The percentage cumulative amounts of drug released was further explored to assess the mechanism of drug release from formulated transdermal drug delivery systems. Data obtained from dissolution study of transdermal patches were fitted into different kinetic equations, like zero order kinetics, first order kinetics, and the Higuchi square root equation, as well as Korsmeyer–Peppas model by using DD Solver® Excel based add-in program. Coefficients of correlation were computed for individual drugs and compared for release data of each formulation. A goodness of fit test gives an idea about the most appropriate model for drug release data. Results obtained from the kinetic study conclude the mechanism of drug release from formulated transdermal patches.
Curve fitting for various models was in the order of Higuchi > Korsmeyer–Peppas > zero order > first order. As the formulations followed the Higuchi model (correlation coefficient R=0.9629–0.9979), release was by diffusion of the drug from the matrix patches.
The Higuchi rate constant (KH) was increased by incorporation of isopropyl myristate. To understand behavior of release, exponent n was calculated from a Korsmeyer–Peppas plot for each formulation. The value of n was 4.5<0.89 as shown in Table 4 (0.601–0.869), indicating release was by non-Fickian transport.
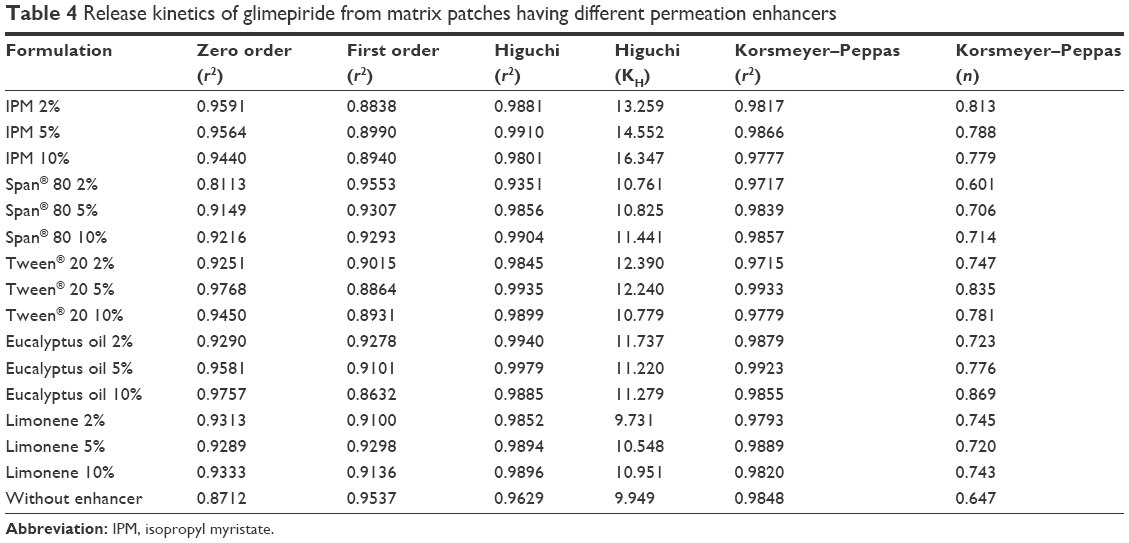 | Table 4 Release kinetics of glimepiride from matrix patches having different permeation enhancers |
Ex vivo permeation study
Ex vivo permeation studies of the transdermal therapeutic system helps to predict the in vivo absorption of the drug. Permeation studies were performed using a Franz diffusion cell to evaluate the effects of different enhancers on the penetration of Gm through excised rabbit skin. Permeation profiles of Gm with five enhancers (IPM, Span® 80, Tween® 20, eucalyptus oil and Limonene) with their three different levels from prepared transdermal patches are shown in Figure 7A–E, respectively. Different enhancer levels showing the best Gm permeation from matrix patches are revealed in Figure 7F.
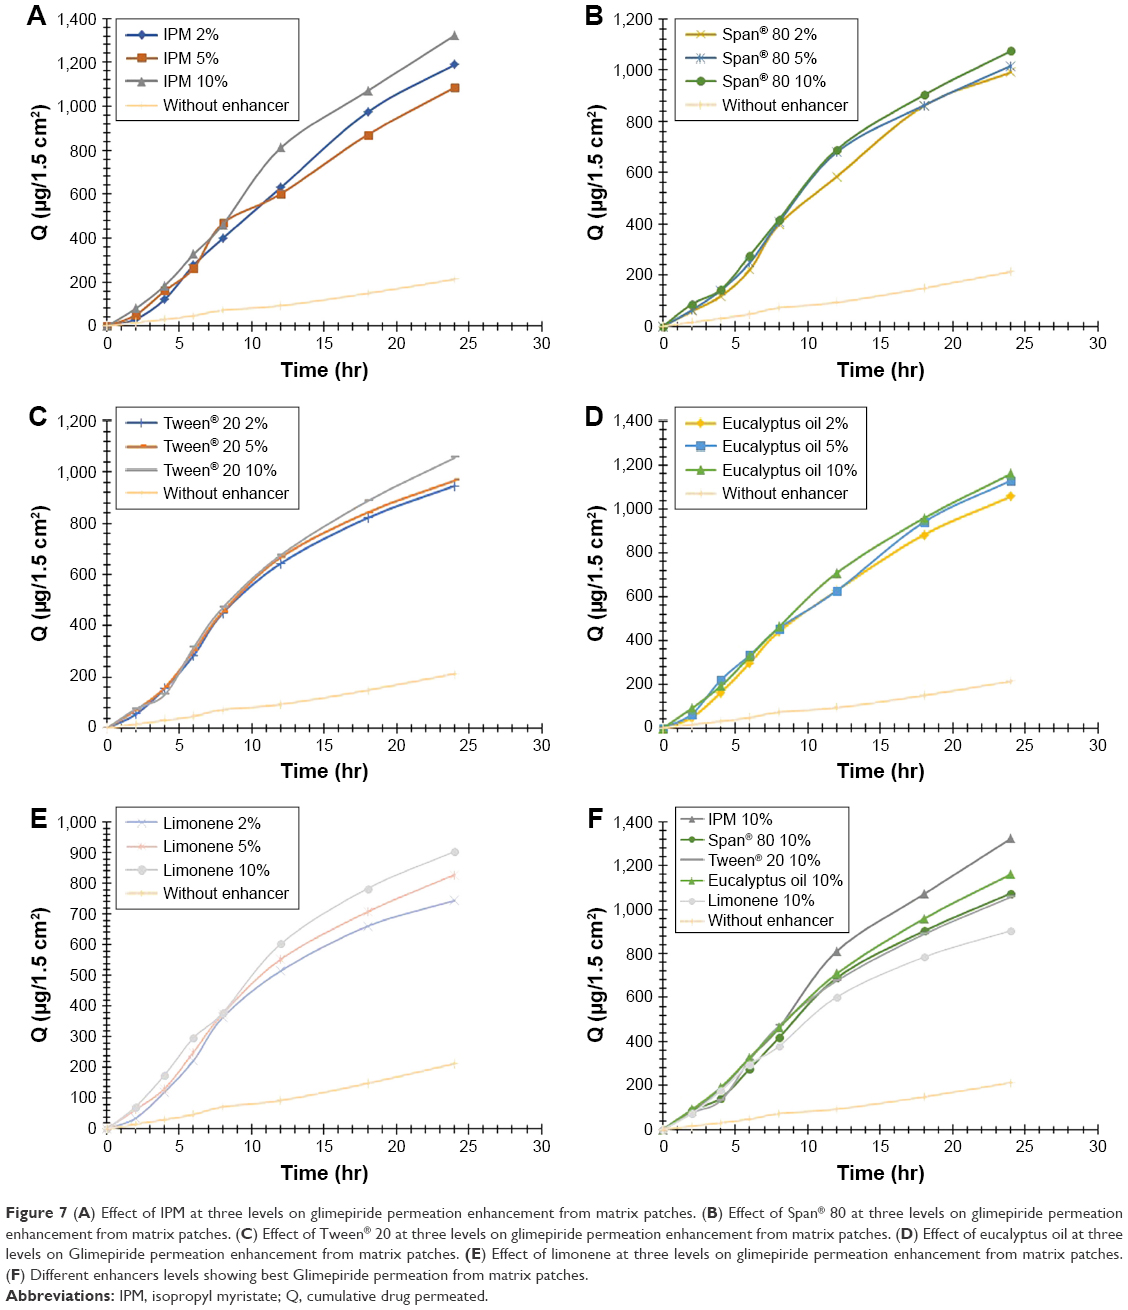 | Figure 7 (A) Effect of IPM at three levels on glimepiride permeation enhancement from matrix patches. (B) Effect of Span® 80 at three levels on glimepiride permeation enhancement from matrix patches. (C) Effect of Tween® 20 at three levels on glimepiride permeation enhancement from matrix patches. (D) Effect of eucalyptus oil at three levels on Glimepiride permeation enhancement from matrix patches. (E) Effect of limonene at three levels on glimepiride permeation enhancement from matrix patches. (F) Different enhancers levels showing best Glimepiride permeation from matrix patches. |
Effect of different enhancers on ex vivo permeation of Gm
The amount of drug permeated per square centimeter per hour is called the flux, represented by J.
The permeation flux, J, cumulative amount permeated across rabbit skin in the receptor compartment after 24 hr (Q24), and enhancement factor (EF) of Gm for patches are summarized in Table 5. The permeation profiles of Gm through rabbit skin in the presence of three different concentrations of each enhancer are shown in Figure 7. The permeation of Gm was enhanced in the presence of different enhancers, as expressed by EF. In the present study, the most effective enhancer was IPM (10%), with a 5.75 times increase in permeation flux of Gm in comparison to the control (p<0.05). In addition to providing the highest EF, the formulation containing 10% IPM also provided the highest Q24 (1,322.282 μg/cm2) (p=0.023). The enhancement effect of different enhancers on Gm permeation at 2% (w/w) concentration was in the order of IPM > eucalyptus oil > Span® 80> Tween® 20> limonene, as shown in Figure 8. The enhancement effect of various enhancers on Gm permeation at 5% (w/w) concentration was in the order eucalyptus oil > IPM > Span® 80> Tween® 20> limonene, as presented in Figure 9. Moreover, the enhancement effect of different enhancers on Gm permeation at 10% (w/w) concentration was in the order IPM > eucalyptus oil > Span® 80> Tween® 20> limonene (Figure 10).
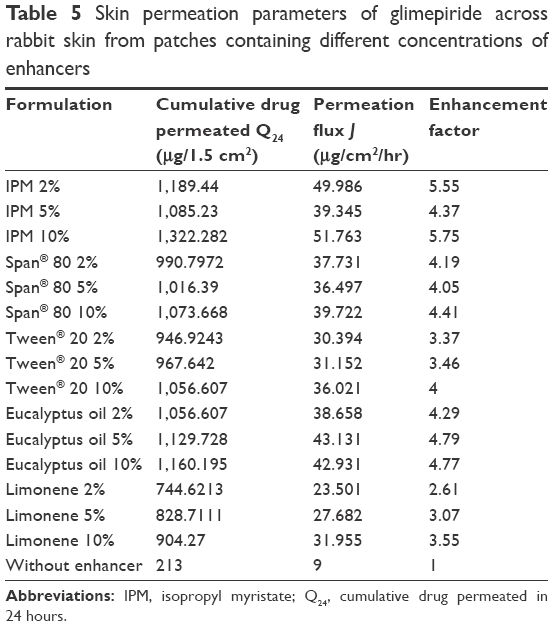 | Table 5 Skin permeation parameters of glimepiride across rabbit skin from patches containing different concentrations of enhancers |
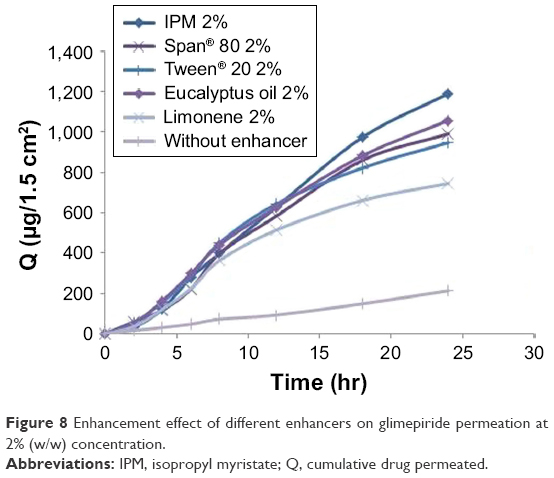 | Figure 8 Enhancement effect of different enhancers on glimepiride permeation at 2% (w/w) concentration. |
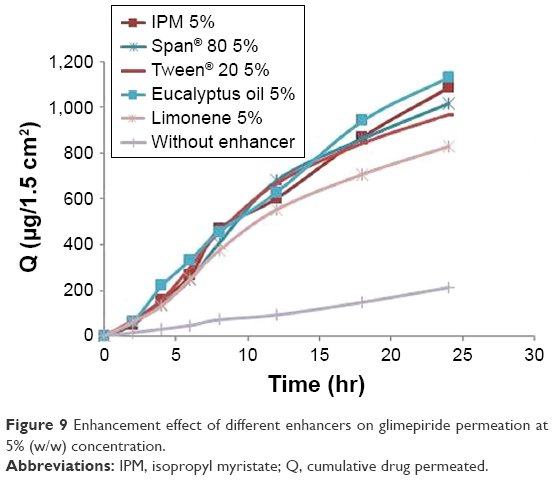 | Figure 9 Enhancement effect of different enhancers on glimepiride permeation at 5% (w/w) concentration. |
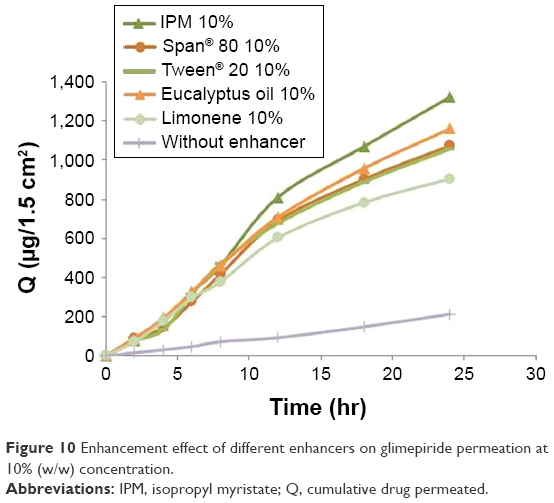 | Figure 10 Enhancement effect of different enhancers on glimepiride permeation at 10% (w/w) concentration. |
IPM is a well-tolerated permeation enhancer for topical formulations and is widely used as a nonvolatile solvent in the cosmetic and pharmaceutical industry. IPM is supposed to exert its effects as a permeation enhancer by disrupting the highly ordered lipid structure of skin, thus altering Gm permeability in skin. IPM is lipophilic in nature, and thus has an innate ability to interact with bilayers of skin.15 IPM has an intermediate polar nature, so can also partition into polar phase (proteins) of skin.4,9 IPM belongs to the class of aliphatic esters, and this class of penetration enhancers tends to increase the partition coefficient of Gm for skin, as well as by increasing its diffusivity to skin.
Results of permeation studies show that eucalyptus oil and Span® 80 were very effective for Gm. In a study by Williams and Barry,9 eucalyptus oil had increased permeation of 5-florouracil up to thirty-fold. Span® 80, which is a more hydrophobic surfactant and has a lower HLB number, enhanced the Gm skin penetration, probably due to alteration in the barrier properties of the skin and in the vehicle stratum–corneum partition coefficient.36,37
Tween® 20 is a nonionic surfactant that exerts its effects by increase in skin hydration, resulting in increased drug partitioning across skin and leading to penetration of Gm through rabbit skin. Limonene as a hydrocarbon, non-polar compound is a good enhancer for lipophilic drug. The mechanism of permeability enhancement by limonene is lipid extraction causing improved drug partitioning.
Conclusion
Transdermal antidiabetic patches of Gm were successfully made by using different concentrations of polymers Ammonio Methacrylate Copolymer Ph Eur RS 100 and Ammonio Methacrylate Copolymer Ph Eur RL 100. The formulation comprising of Ammonio Methacrylate Copolymer Ph Eur RL 100 and Ammonio Methacrylate Copolymer Ph Eur RS 100 in ratio 7:3 fulfilled the requirement of a good transdermal drug delivery system. Among five different enhancers, isopropyl myristate was the most successful at concentration 10% w/w of polymer. Drug release kinetics revealed that formulations followed the Higuchi model. Use of these Ammonio Methacrylate Copolymer Ph Eur polymers with different penetration enhancers showed sufficient amount of drug release at a controlled rate. So, the use of such approaches is very promising in the treatment of diabetes and in formulating a delivery system in the pharmaceutical industry. Moreover, IPM containing Gm patches significantly enhanced drug penetration across skin. Gm transdermal patches can specifically be used in unconscious diabetic patients who had been taking Gm tablets.
Limitations of the study
There is considerable interest in the use of skin as a site of drug absorption, both for local and systemic effect. However, the skin, in particular the stratum corneum, poses a formidable barrier to drug penetration, thereby limiting topical and transdermal bioavailability.
Disclosure
The authors report no conflicts of interest in this work.
References
Rao R, Mahant S, Chhabra L, Nanda S. Transdermal innovations in diabetes management. Curr Diabetes Rev. 2014;10(6):343–359. | ||
Tao Z, Shi A, Zhao J. Epidemiological perspectives of diabetes. Cell Biochem Biophys. 2015;73(1):181–185. | ||
Ahad A, Al-Saleh AA, Akhtar N, Al-Mohizea AM, Al-Jenoobi FI. Transdermal delivery of antidiabetic drugs: formulation and delivery strategies. Drug Discov Today. 2015;20(10):1217–1227. | ||
Arry BW. Penetration enhancer classification. In: Smith E, Maibach HI, editors. Percutaneous Penetration Enhancers. 2nd ed. CRC Press; 1996:3–15. | ||
Ammar HO, Salama HA, El-Nahhas SA, Elmotasem H. Design and evaluation of chitosan films for transdermal delivery of glimepiride. Curr Drug Delivery. 2008;5(4):290–298. | ||
Magnusson BM, Walters KA, Roberts MS. Veterinary drug delivery: potential for skin penetration enhancement. Adv Drug Deliv Rev. 2001;50(3):205–227. | ||
Alexander A, Dwivedi S, Giri TK, Saraf S, Saraf S, Tripathi DK. Approaches for breaking the barriers of drug permeation through transdermal drug delivery. J Control Release. 2012;164(1):26–40. | ||
Suh H, Jun H. Physicochemical and release studies of naproxen in poloxamer gels. Int J Pharm. 1996;129(1–2):13–20. | ||
Williams AC, Barry BW. Terpenes and the lipid–protein–partitioning theory of skin penetration enhancement. Pharm Res. 1991;8(1):17–24. | ||
Yaqoob A, Ahmad M, Mahmood A, Sarfraz RM. Comparative study of polymeric films for sustained transdermal delivery of metoprolol: preparation, in vitro and ex vivo characterization. Lat Am J Pharm. 2016;35(9):2171–2179. | ||
Saxena M, Mutalik S, Reddy MS. Formulation and evaluation of transdermal patches of metoclopramide hydrochloride. Indian Drugs Bombay. 2006;43(9):740. | ||
El-Gendy NA, Sabry NA, El-Attar M, Omar E, Mahmoud M. Transdermal patch incorporating salbutamol sulphate: in vitro and clinical characterization. Drug Discov Ther. 2008;2(4):219–228. | ||
Shabbir M, Ali S, Farooq M, et al. Formulation factors affecting in vitro and ex vivo permeation of bisoprolol fumarate from a matrix transdermal patch. Advances in Polymer Technology. 2016;35(3):237–247. | ||
Bagyalakshmi J, Vamsikrishna RP, Manavalan R, Ravi TK, Manna PK. Formulation development and in vitro and in vivo evaluation of membrane-moderated transdermal systems of ampicillin sodium in ethanol: pH 4.7 buffer solvent system. AAPS Pharm Sci Tech. 2007;8(1):7. | ||
Limpongsa E, Umprayn K. Preparation and evaluation of diltiazem hydrochloride diffusion-controlled transdermal delivery system. AAPS Pharm Sci Tech. 2008;9(2):464–470. | ||
Jaydatt J, Sreenivas SA. Formulation & in vitro evaluation of drug reservoir transdermal patches of piroxicam using polymers HPMC E15, PVP K30 & Eudragit L100. Int J Pharm Innovation. 2013;3(5):67–80. | ||
Zhang X, Wang Y, Wang J, Wang Y, Li S. Effect of pore former on the properties of casted film prepared from blends of Eudragit® NE 30 D and Eudragit® L 30 D-55. Chem Pharm Bull (Tokyo). 2007;55(8):1261–1263. | ||
Pichayakorn W, Suksaeree J, Boonme P, Taweepreda W, Ritthidej GC. Preparation of deproteinized natural rubber latex and properties of films formed by itself and several adhesive polymer blends. Ind Eng Chem Res. 2012;51(41):13393–13404. | ||
Pichayakorn W, Suksaeree J, Boonme P, Amnuaikit T, Taweepreda W, Ritthidej GC. Nicotine transdermal patches using polymeric natural rubber as the matrix controlling system: effect of polymer and plasticizer blends. J Membr Sci. 2012;411–412:81–90. | ||
Sohail M, Ahmad M, Minhas MU, Ali L, Khalid I, Rashid H. Controlled delivery of valsartan by cross-linked polymeric matrices: Synthesis, in vitro and in vivo evaluation. Int J Pharm. 2015;487(1–2):110–119. | ||
Dash S, Murthy PN, Nath L, Chowdhury P. Kinetic modeling on drug release from controlled drug delivery systems. Acta Pol Pharm. 2010;67(3):217–223. | ||
Costa P, Lobo JM. Modeling and comparison of dissolution profiles. Eur J Pharma Sci. 2001;13(2):123–133. | ||
Samani SM, Montaseri H, Kazemi A. The effect of polymer blends on release profiles of diclofenac sodium from matrices. Eur J Pharm Biopharm. 2003;55(3):351–355. | ||
Lee JW, Park JH, Prausnitz MR. Dissolving microneedles for transdermal drug delivery. Biomaterials. 2008;29(13):2113–2124. | ||
Sachdeva MS, Patlolla R, inventors; Florida Agricultural, Mechanical University, assignee. Nanoparticle formulations for skin delivery. United States patent 8715736. 2014 May 6. | ||
Nicoli S, Padula C, Aversa V, et al. Characterization of rabbit ear skin as a skin model for in vitro transdermal permeation experiments: histology, lipid composition and permeability. Skin Pharmacol Physiol. 2008;21(4):218–226. | ||
Davaran S, Rashidi MR, Khandaghi R, Hashemi M. Development of a novel prolonged-release nicotine transdermal patch. Pharmacol Res. 2005;51(3):233–237. | ||
Nokhodchi A, Nazemiyeh H, Ghafourian T, Hassan-Zadeh D, Valizadeh H, Bahary LA. The effect of glycyrrhizin on the release rate and skin penetration of diclofenac sodium from topical formulations. Farmaco. 2002;57(11):883–888. | ||
Hayton WL, Chen T. Correction of perfusate concentration for sample removal. J Pharm Sci. 1982;71(7):820–821. | ||
Panchagnula R, Salve PS, Thomas NS, Jain AK, Ramarao P. Transdermal delivery of naloxone: effect of water, propylene glycol, ethanol and their binary combinations on permeation through rat skin. Int J Pharm. 2001;219(1–2):95–105. | ||
El-Gendy NA, Sabry NA, El-Attar M, Omar E, Mahmoud M. Transdermal patch incorporating salbutamol sulphate: in vitro and clinical characterization. Drug Discov Ther. 2008;2(4):219–228. | ||
Aqil M, Sultana Y, Ali A. Matrix type transdermal drug delivery systems of metoprolol tartrate: in vitro characterization. Acta Pharm. 2003;53(2):119–125. | ||
Mokale VJ, Naik JB, Verma U, Yadava SK. Preparation and characterization of biodegradable limepiride loaded PLA nanoparticles by o/w solvent evaporation method using high pressure homogenizer: a factorial design approach. SAJ Pharm Pharmacol. 2014;1(1):1–10. | ||
Mutalik S, Udupa N. Pharmacological evaluation of membrane-moderated transdermal system of glipizide. Clin Exp Pharmacol Physiol. 2006;33(1–2):17–26. | ||
Kumar SS, Behury B, Sachinkumar P. Formulation and evaluation of transdermal patch of Stavudine. Dhaka Uni J Pharm Sci. 2013;12(1):63–69. | ||
Lee J, Kellaway IW. Combined effect of oleic acid and polyethylene glycol 200 on buccal permeation of [D-Ala 2, D-Leu 5] enkephalin from a cubic phase of glyceryl monooleate. Int J Pharm. 2000;204(1–2):137–144. | ||
Lee PJ, Ahmad N, Langer R, Mitragotri S, Shastri VP. Evaluation of chemical enhancers in the transdermal delivery of lidocaine. Int J Pharm. 2006;308(1–2):33–39. | ||
Rao PR, Diwan PV. Formulation and in vitro evaluation of polymeric films of diltiazem hydrochloride and indomethacin for transdermal administration. Drug Dev Ind Pharm. 1998;24(4):327–336. |
 © 2018 The Author(s). This work is published and licensed by Dove Medical Press Limited. The
full terms of this license are available at https://www.dovepress.com/terms
and incorporate the Creative Commons Attribution
- Non Commercial (unported, 3.0) License.
By accessing the work you hereby accept the Terms. Non-commercial uses of the work are permitted
without any further permission from Dove Medical Press Limited, provided the work is properly
attributed. For permission for commercial use of this work, please see paragraphs 4.2 and 5 of our Terms.
© 2018 The Author(s). This work is published and licensed by Dove Medical Press Limited. The
full terms of this license are available at https://www.dovepress.com/terms
and incorporate the Creative Commons Attribution
- Non Commercial (unported, 3.0) License.
By accessing the work you hereby accept the Terms. Non-commercial uses of the work are permitted
without any further permission from Dove Medical Press Limited, provided the work is properly
attributed. For permission for commercial use of this work, please see paragraphs 4.2 and 5 of our Terms.