")
Back to Journals » International Journal of Nanomedicine » Volume 18
Formulation and Evaluation of Pravastatin Sodium-Loaded PLGA Nanoparticles: In vitro–in vivo Studies Assessment
Authors Elsayed SI, Girgis GNS , El-Dahan MS
Received 2 November 2022
Accepted for publication 29 January 2023
Published 13 February 2023 Volume 2023:18 Pages 721—742
DOI https://doi.org/10.2147/IJN.S394701
Checked for plagiarism Yes
Review by Single anonymous peer review
Peer reviewer comments 2
Editor who approved publication: Dr Yan Shen
Seham I Elsayed, Germeen N S Girgis, Marwa S El-Dahan
Department of Pharmaceutics, Faculty of Pharmacy, Mansoura University, Mansoura, Dakahlia, Egypt
Correspondence: Seham I Elsayed, Department of Pharmaceutics, Faculty of Pharmacy, Mansoura University, El-Gomhoria Street, Mansoura, Dakahlia, Egypt, Tel +201066300417, Fax +20504730097, Email [email protected]
Purpose: Pravastatin sodium (PVS) is a hypolipidemic drug which suffers from extensive first-pass metabolism and short half-life. Poly(
Methods: PVS-loaded PLGA nanoparticles (PVS–PLGA-NPs) were prepared by double emulsion method using a full 32 factorial design. The in vitro release and the physical stability studies of the optimized PVS–PLGA-NPs (F5) were performed. Finally, both hypolipidemic and hepatoprotective activities of the optimized F5 NPs were studied and compared to PVS solution.
Results: All the studied physical parameters of the prepared NPs were found in the accepted range. The particle size (PS) ranged from 90 ± 0.125 nm to 179.33 ± 4.509 nm, the poly dispersity index (PDI) ranged from 0.121 ± 0.018 to 0.158 ± 0.014. The optimized NPs (F5) have the highest entrapment efficiency (EE%) (51.7 ± 5%), reasonable PS (168.4 ± 2.506 nm) as well as reasonable zeta potential (ZP) (− 28.3 ± 1.18mv). Solid-state characterization indicated that PVS is well entrapped into NPs. All NPs have distinct spherical shape with smooth surface. The prepared NPs showed a controlled release profile. F5 showed good stability at 4 ± 2°C during the whole storage period of 3 months. In vivo study and histopathological examination indicated that F5 NPs showed significant increase in PVS hypolipidemic as well as hepatoprotective activity compared to PVS solution.
Conclusion: The PVS–PLGA-NPs could be considered a promising model to evade the first-pass effect and showed improvement in the hypolipidemic and hepatoprotective activities compared to PVS solution.
Keywords: pravastatin sodium, PLGA, nanoparticles, hypolipidemic and hepatoprotective activity
Introduction
Hyperlipidemia is defined as an elevated level of lipids, especially low-density lipoproteins (LDL), cholesterol, triglycerides in the blood, so it is considered a significant risk factor for atherosclerosis and, consequently many heart disease.1 Statins are one of the most common medications prescribed for treating hyperlipidemia. They are a group of drugs that act by inhibiting 3-hydroxy-3-methylglutaryl coenzyme A (HMG-CoA) reductase that stimulates the conversion of 3-hydroxy-3-methylglutaryl coenzyme A(HMG-CoA) to mevalonate, which helps in cholesterol synthesis later.2 Statins are extremely efficacious in reducing elevated lipid level in the blood.
PVS is one of the statins that effectively reduces cholesterol biosynthesis. It is a freely water-soluble compound.3 PVS is a ring opened dihydroxy acid with a 6\ -hydroxyl group that does not need to be activated in the body as shown in Figure 1 and was obtained from microbial transformation of mevastatin.4,5 PVS is structurally identical to the endogenous substrate of (HMG-CoA) reductase.6 PVS inhibits biosynthesis of very low-density lipoprotein (VLDL) in the liver which is considered a precursor for LDL, so it works in two different ways to decrease cholesterol levels. However, PVS is broken down by the influence of first-pass effect in the liver so it has poor bioavailability (17%).7
 |
Figure 1 Chemical structure of pravastatin sodium. |
In the recent times, many nanocarriers such as polymeric nanoparticles as well as lipid-based formulation have been used as carriers for different statins.8,9 Examples of statins that have been loaded into PLGA include atorvastatin calcium which was incorporated into PLGA nanoparticles and proved to be a successful ocular anti-inflammatory,10 rosuvastatin-loaded PLGA nanocapsules which showed a promising treatment for liver cancer11 and pitavastatin-loaded nanoparticles that were proved to be a good candidate drug carriers for ocular drug delivery.12
PLGA is a promising synthetic copolymer that has been permitted by the Food and Drug Administration (FDA) in several drug delivery systems. PLGA has a brilliant safety profile, so it is commonly used to obtain NPs of different pharmaceutical agents. PLGA is a biodegradable and biocompatible, as it is degraded to water-soluble monomers (lactic and glycolic acids), which are eliminated by the body in the form of water and carbon dioxide.13,14 Furthermore, the degradation rate of PLGA is greatly affected by controlling the molar ratios of two monomers in the polymer chain, the molecular weight and stereo-chemistry of the polyester, as well as the degree of crystallinity.15 Hence, PLGA has been widely used as a drug carrier to enhance the efficacy of different pharmaceutical agents.13 PLGA also protects the drugs from premature degradation and hepatic pass metabolism. Various drugs are encapsulated into PLGA nanoparticles (PLGA-NPs) to extend the drug release, reduce the frequency of administration and improve the efficacy of drug as well as patient compliance.16,17 Our study aims to prepare PVS–PLGA-NPs to avoid the first-pass effect and improve both the efficacy and hepatoprotective activities of PVS.
In this work, PVS was incorporated into PLGA-NPs and evaluated. The selected optimum formula (F5) showed reasonable physical properties, protection against the first-pass effect and hepatoprotective activity against poloxamer-induced hyperlipidemia in rats.
Materials and Methods
Materials
PVS was gifted by Delta Pharm pharmaceutical Co, Cairo, Egypt. HPLC grade dichloromethane (DCM) was purchased from Fischer Scientific UK. PLGA (LA:GA=50:50) (purasorb PDLGA® 50/50, molecular weight of 10,000) was gifted by Purac Biomaterials Holland. Poloxamer 407 was obtained from BASF SE, Germany. Bovine serum albumin (BSA) was bought from MP Biomedical LLC, France. Kits for total cholesterol (TC), triglyceride (TGs) and high-density lipoprotein (HDL) analysis were purchased from Spinreact company in Spain. Kits for serum alkaline phosphatase (ALP) were purchased from Biodiagnostic, Giza, Egypt. Kits for serum aspartate aminotransferase (AST), alanine aminotransferase (AST) and albumin were obtained from Diamond Diagnostics, Holliston MA, USA.
Preparation of PVS–PLGA-NPs
PVS–PLGA-NPs were prepared using a double emulsion-solvent evaporation method18,19 adopting 32 full factorial design.20 Briefly, PVS was dissolved in 0.3 mL of deionized water as an internal aqueous phase (w1), PLGA was dissolved in 4 mL of DCM as an organic phase (o), then both phases were emulsified using an ultrasonic homogenizer (Ultrasonic homogenizer, 4710 Series, Cole-Parmer Instrument Co., Chicago, USA) in an ice bath at 90% amplitude for 2 minutes to form the primary emulsion (w1/o). Three different ratios between PVS: PLGA (1:1, 1:10, 1:20) were used.
This primary emulsion was added to 8 mL of bovine serum albumin (BSA) aqueous solution using three different concentrations (1%, 1.5%, and 3% w/v) as an external aqueous phase. Then, the solution was emulsified under the same conditions to form a double emulsion. The obtained double emulsion was poured dropwise into 20 mL aqueous phase, magnetically stirred at 1000 rpm for 1 h at room temperature (magnetic stirrers, Thermolyne Corporation, Dubuque Iowa, USA) to permit evaporation of DCM. NPs were collected by cooling centrifugation at 13,000 rpm/min at 4°C for 2 h (CE16-4X100RD, Acculab, USA), washed with deionized water and then lyophilized (Freeze dryer, SIM FD8-8T, SIM international, USA). Finally, the freeze-dried NPs were kept at 4°C for further characterization. Plain NPs were also prepared to be used as a blank (without PVS).
Design of Experiment and Statistical Analysis (DOE)
This design approach was employed to study the relationships between certain variables and their effect on the characteristics of the prepared NPs to produce a mathematical correlation between factors and responses. Several trials were investigated prior, to establish the current optimization study by selecting many independent variables as drug:polymer ratio (A) and surfactant concentration (B). Afterward PVS–PLGA-NPs were prepared following 32 randomized full factorial design (Design Expert12 (Stat-Ease, Minneapolis, MN, USA) to study the major effects of independent variables on the characteristics of the formulated PVS–PLGA-NPs. Hence, nine possible formulations of experimental trials, each with three runs, were prepared (Table 1). A with three levels (1:1, 1:10, and 1:20) and B with three levels (1%, 1.5%, and 3% w/v) were selected as two critical processes parameters (CPPs) as shown in Table 2. The three responses which were selected to be studied were PS, EE and ZP as in Table 3. The polynomial regression equation is expressed as in equation (1).

 |
Table 1 Formulation Code for Preparation of Various Polymeric Nanoparticles Compositions |
 |
Table 2 Levels of Independent Variables and Their Levels Applied Using the Experimental Design |
 |
Table 3 Independent & Dependent Variables |
Where Y corresponding to the studied response, b0 is the intercept, b1 to b5 show regression coefficients, A and B parallel to the main factor “AB” indicates an interaction term between main factor. A2 and B2 are polynomial terms. The drug:polymer ratio (A) and the surfactant concentration (B) indicate the mean result when varying one factor from its low to high value. Both polynomial terms A2 and B2 are used to analyze the non-linearity model. Statistical analysis of the obtained results was performed by ANOVA provided by Design expert12 software. Two-dimensional (2D) contour plots and three-dimensional response-surface plots (3D) were used to illustrate the volume of different responses.21
Characterization of PVS–PLGA-NPs Formulations
All NPs of the nine formulations were subjected to evaluation in terms of PS, PDI, EE% and ZP.
Particle Size (PS) and Polydispersity Index (PDI)
PS and PDI values of all freshly prepared formulations were measured after proper dilution with deionized water using photon correlation spectroscopy (Malvern Instruments Ltd., Malvern, Worcestershire, UK). All samples were determined in triplicate.
Entrapment Efficiency Percent (EE%)
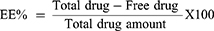
EE% was determined by the previously reported indirect method.22,23 In this method, the unentrapped or the free amount of PVS was estimated in the supernatant of all formulations after centrifugation. The amount of free PVS was measured at 238 nm spectrophotometrically (Spectro UV-VIS double beam, Labomed Inc., USA). The EE% was calculated using equation (2):
Zeta Potential (ZP)
Zeta potential values were determined using Zetasizer nanoseries (Malvern Instruments Limited, UK) which detect the electrophoretic movement of PVS–PLGA-NPs at 25°C in an electric field.
Selection of the Optimized Formula
Based on the design expert version 12 response surface, User Defined design type with prediction goal fixed at maximized both EE% and ZP and minimized PS, F5 was selected as optimized formula with desirability factor of 92% as it has the highest EE% besides a reasonable PS as well as reasonable ZP. The optimized formula (F5) was prepared at medium level for both A and B to be subjected to further evaluations.
Evaluation of the Optimized Formula (F5) of PVS–PLGA-NPs
Transmission Electron Microscope (TEM)
The morphological characterization of F5 NPs was conducted by TEM (JEOL JEM −2100, JEOL Ltd, Tokyo, Japan) after proper dilution with deionized water using soft imaging viewer software. The diluted sample was placed on carbon-coated copper grid, then the excess sample was wiped off. The image was captured after complete drying of the gird at room temperature.
Scanning Electron Microscope (SEM)
The surface morphology of the the freeze-dried F5 NPs was examined by SEM (JSM-6510V, JOEL, Tokyo, Japan). A metal sub with dual-sided adhesive carbon tapes was used to place samples on it, then covered with a layer of gold and photographed at 20KV.
Fourier-Transform Infrared Spectroscopy (FT-IR)
FT-IR spectra of PVS, PLGA, BSA, physical mixture corresponding to F5 NPs, freeze-dried medicated and plain of F5 NPs were obtained using FT-IR spectrophotometer (Thermo Fisher Scientific iS10 Nicolet) by potassium bromide pellet method. Samples were homogeneously mixed with KBr and pressed into disks. The scanning range was 500 to 4000 cm−1.
Differential Scanning Calorimetry (DSC)
DSC experiments were carried out for PVS, PLGA, BSA, physical mixture corresponding to F5 NPs, freeze-dried medicated and plain of F5 NPs. Thermal analysis of the samples was studied using DSC apparatus (Shimadzu DSC 50, Tokyo, Japan). The applied heating rang was 35–300°C and the heating rate was 10°C/min under a constant dry nitrogen atmosphere, purging at 20 mL/min flow rate.
Powder X-Ray Diffractometry (PX-RD)
PX-RD analysis is used to inspect the changes in the crystallinity of all ingredients during the formulation process.24 X-ray diffractograms of PVS, PLGA, BSA, physical mixture corresponding to F5 NPs, freeze-dried medicated and plain of F5 NPs were obtained using X-ray diffractometer (Diano, Woburn, MA, USA) operated at a current of 9 mA and a voltage of 45 kV at 2Ꝋ angle.
The in vitro PVS Release Study
The in vitro release profile of PVS from F5 NPs was studied and compared with free PVS as a control using USP apparatus II (paddle method) (Dissolution Apparatus USP Standards, Scientific DA-6D, Bombay, India). PVS release was made in three different pH values as simulated gastrointestinal fluids, 0.1N HCl (pH 1.2), phosphate buffer (pH 6.8) and phosphate buffer (pH 7.4). Ten mg of free PVS and the corresponding from the freeze-dried F5 NPs, were introduced into the dissolution cells. The dissolution media in each cell was 900 mL, stirred at 100 rpm at 37°C ± 0.5. Aliquots (3 mL) were withdrawn from the dissolution media at time intervals (0.5, 1, 2, 3, 4, 5, and 6 h). An equal volume of fresh dissolution media was replaced in each cell after sampling. The aliquots were filtered through 0.45-µm Millipore filter (EMD Millipore, Billerica, MA, USA) and all samples were measured spectrophotometrically using blank of plain NPs treated likewise. Each experiment was conducted three times to calculate the average percentage PVS release from F5 NPs.25
Release Kinetics
Zero order and first order26 as well as Higuchi models27 were used to mathematically analyze in vitro release data. The model with the greatest correlation coefficient (R2) is the predominant model of PVS release from F5 NPs. The Korsmeyer–Peppas model was used for further analysis to verify the release mechanism.28
Stability Study of F5 NPs
The stability study of PVS–PLGA-NPs (F5 NPs) was evaluated as previously reported.29 An aqueous dispersion of F5 was prepared and stored at refrigerator (4 ± 2°C) and room (25 ± 3°C) temperature for 3 months. NPs were assessed regarding PS, PDI, ZP and EE% at zero-time, 1, 2 weeks, 1, 2 and 3 months. Plain NPs of F5 were prepared and utilized as controls.
In vivo Assessment Study
In vivo experiments were conducted to study both pharmacodynamics and hepatoprotective activities of the optimized formula PVS–PLGA-NPs (F5) as compared to free PVS solution.
Experimental Animals
The animal protocol was approved by the Ethical Committee of Faculty of Pharmacy, Mansoura university, Egypt for the Care and use of Laboratory Animals (Code number: 2020–150). Sprague Dawley rats weighing (250–300 g) were permitted to acclimatize to the conditions of the experiments such as temperature and humidity 1 week before initiating the experiments, then they were fed a standard rat pellet diet. The rats were kept at ambient temperature and allowed free access to water during the study. Twenty-four healthy male rats were used in this study and divided into four groups, six animals in each group.
Group 1: Normal control (Negative control)
Group 2: Nontreated hyperlipidemic rats (Positive control group)
Group 3: Orally treated hyperlipidemic rats by PVS solution (10 mg/kg/day)
Group 4: Orally treated hyperlipidemic rats by (F5) PVS–PLGA-NPs (corresponding to 10 mg of PVS).
Induction of Hyperlipidemia
Before beginning the experiment, rats were fasted during the night with free access to water. Their lipid profile was measured before the experiment to exclude rats with hyperlipidemia. Hyperlipidemia was stimulated by a single intraperitoneal injection of poloxamer 407 solution (1g/Kg).30 The induction of hyperlipidemia in rats was ascertain after 12 hours of poloxamer injection, so the rats were orally treated with multiple doses of free PVS solution (10 mg/kg/day)31 and the equivalent from F5 NPs after 12 hours of the poloxamer injection for 1 week (dose=10 mg/kg). Blood samples were collected 3, 4, 5 days and 1 week after the start of treatment.
Collection of Blood and Tissues Samples
After completing the treatment period, samples of blood were collected from the retro–orbital vein from each rat using non-heparinized micro-hematocrit capillary tubes under ketamine (12.5mg/kg) and xylazine (1.5mg/kg) anesthesia.32,33 Blood samples were left to clot, then cooling centrifugation was used at 3000 rpm for 20 min to collect the serum which was stored at −20 °C until the analysis was done. The lipid level was estimated in all groups using in vitro diagnostic kits.
Histopathological Examination
Rats were sacrificed and undergone immediate laparotomy then, portions of liver and quadriceps muscles were collected and fixed in 10% buffered formalin for histopathological examination.34 Sections of liver and quadriceps muscles were fixed on slides, deparaffinized, stained with hematoxylin and eosin (H and E) and visualized under light microscope as previously reported.35
Statistical Data Analysis
The data were analyzed using one-way ANOVA followed by Tukey–Krumer multiple comparisons, for in vitro data and Student’s-t-test (unpaired) for in vivo ones using GraphPad prism software version 8 (GraphPad soft-ware, San Diego, CA, USA) at p < 0.05. The applied experimental design (32 randomized factorial design) was estimated in terms of statistical significance using ANOVA by Design Expert12.
Results and Discussion
Characterization and Optimization of PVS–PLGA-NPs Formulations
Double emulsion technique is a widely used method for encapsulation of hydrophilic drugs.36,37 Drugs that are hydrophilic suffer from low entrapment efficiency because of their diffusion into the continuous phase during the formation or they are not possible to get to dissolution in the organic phase.20 In the double emulsion method, the hydrophilic drug is dissolved within the inner phase (w1) of emulsion. This method shows high drug loading efficiency and prolonged drug release.38 Hence, the (w/o/w) double emulsion method has been employed for the preparation of PVS- PLGA- NPs, where the internal primary emulsion (w/o) would be distributed in an external aqueous phase in the presence of a stabilizer.39
Analysis of PS
The PS of the prepared PVS–PLGA-NPs ranged from 90 ± 0.125 nm to 179.33 ± 4.509 nm as shown in Table 4 and the polydispersity index (PDI) ranged from 0.121 ± 0.018 to 0.158 ± 0.014 which indicated that the samples were uniformly distributed. Particle size distribution of F5 NPs is displayed in Figure 2A. The resulted P values recommended “quadratic model” for PS analysis which increases both the adjusted R2 and the predicted R2 as shown in Table 5. Equations 3 indicates regression coefficients for PS (Y1) as follows:

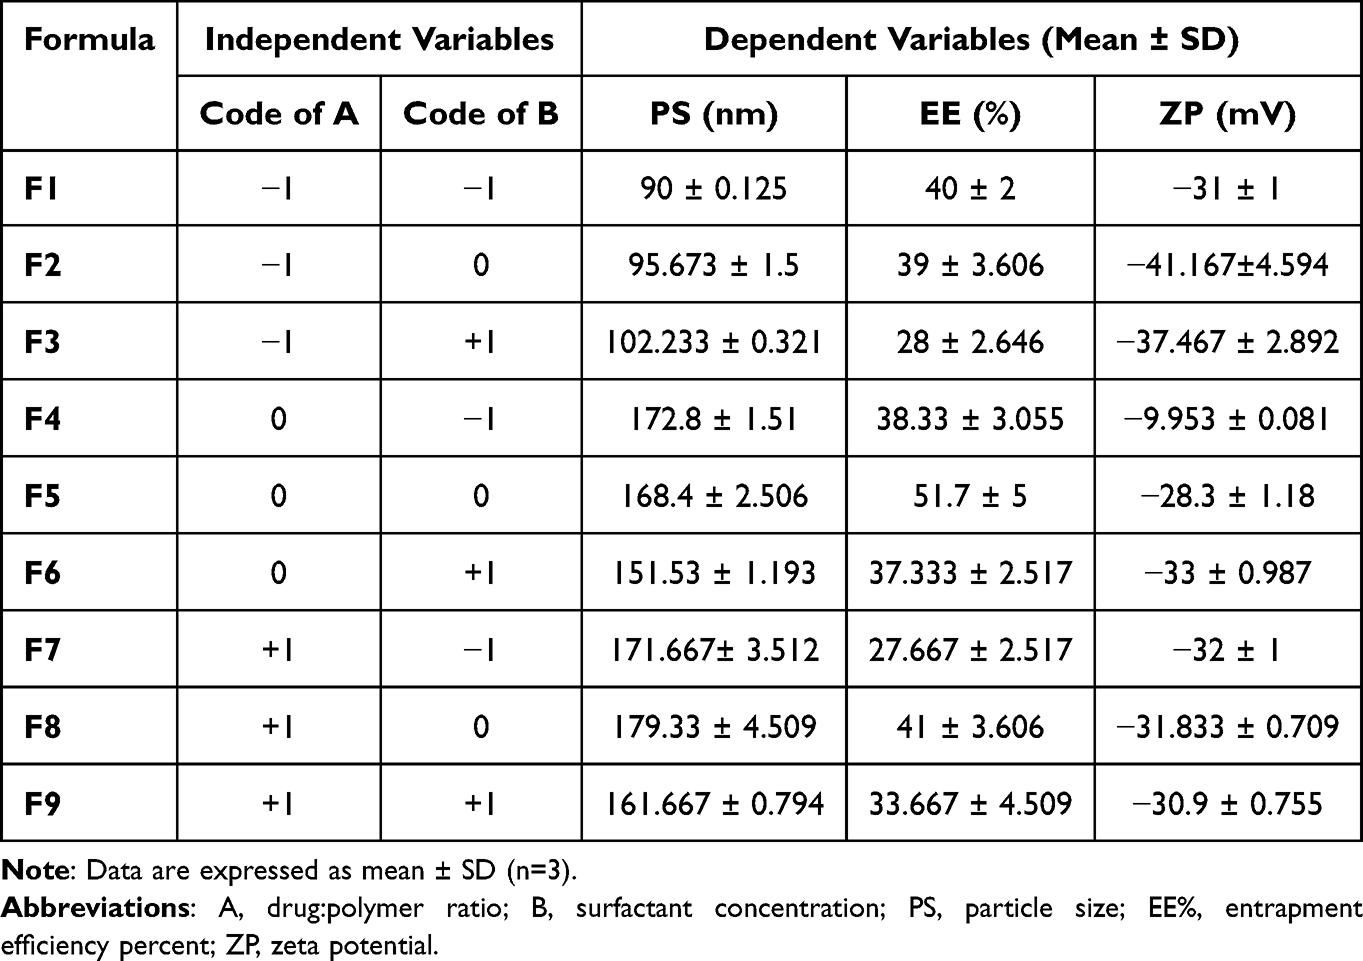 |
Table 4 Coded Independent Variables and Properties of PVS -PLGA-NPs |
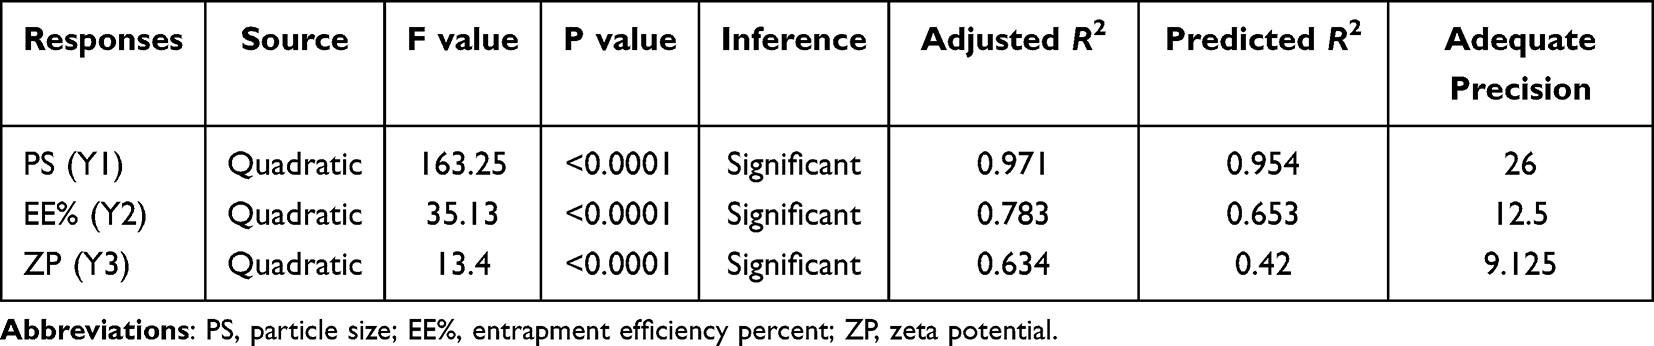 |
Table 5 ANOVA Results for Responses Provided by Design Expert |
 |
Figure 2 Particle size distribution graph (A) and zeta potential distribution graph (B). |
The polynomial equation in terms of certain factors is used to predict the response for certain levels of each factor. The positive sign of regression coefficients signifies a positive outcome. It means that, by increasing drug:polymer ratio in the PLGA-NPs system, leading to larger PS. The major factor affecting positively the above response was the drug:polymer ratio. The increase in PS with increasing A may be due to the aggregation of more particles. Also, increasing the polymer concentration leads to an increase in solution viscosity, so the diffusion ratio of NPs into the aqueous phase decreased leading to the formation of larger NPs as previously reported.40,41 Drug:polymer ratio has a positive effect on PS by increasing the ratio form 1:1 to 1:20, PS increased as shown in Table 4. On the contrary, when the BSA concentration is increased the PS decreases. This may be due to higher surfactant concentration leading to stabilization of smaller NPs by minimizing interfacial tension between the organic phase and the aqueous phase, so prevent the coalescence of the smaller particles into bigger ones.40 Lower concentration of BSA is insufficient to stabilize the NPs and it is unable to cover the dispersed NPs completely so leading to bigger PS.
Analysis of EE%
EE% of PVS–PLGA-NPs ranged from 27.667 ± 2.517% to 51.7 ± 5% as overviewed in Table 4. Highest EE% was observed at the medium levels of A (0) and B (0). The obtained polynomial equation (Equation 4) is expressed as follows:

From the previous equation, we concluded that both A and B have a negative effect on EE%. This may be attributed to high concentrations of BSA will lead to smaller NPs, that cannot encapsulate more drug which would pass into the aqueous phase leaving less amount of PVS to be encapsulated in PLGA -NPs. It has been reported that hydrophilic drugs show poor EE%, because of drug diffusion or rapid partitioning out from the organic dispersed phase into the aqueous continuous phase leading to NPs with poor loading efficiency.42 Higher surfactant concentration may lead to decrease EE% even if the PLGA concentration is increased.41,43
Analysis of ZP
ZP values help predict the storage stability of colloidal dispersion. In general, higher ZP values of nanoparticulate system are essential for the stability of colloidal dispersion.44 ZP values of PVS–PLGA-NPs ranged between −9.953 ± 0.081 to −41.167 ± 4.594 mv (Table 4) and a representative sample for ZP of F5 NPs is shown in Figure 2B. The polynomial equation (Equation 5) of ZP (Y3) is expressed as follows:

It was found that, ZP of all formulations was frequently negative and upon careful examination of its equation, we concluded that ZP increases with increasing BSA concentration. This may be due to the adsorption of negatively charged BSA. The negative charge on the surface of BSA in its aqueous solution originates from carboxyl group (COOH).45,46
Figure 3 Continued. Figure 3 Contour plots (A, C and E) and three-dimensional surface plots (B, D and F) representing the effect of interaction between drug:polymer ratio (A) and surfactant concentration (B) on particle size, entrapment efficiency percent and zeta potential, respectively.
The regression analysis for the studied responses (PS, EE% and ZP) is illustrated in Table 5. Based on the experimental design, F5 NPs was selected as an optimum formula with the highest EE% (51.7± 5) reasonable PS (168.4 ± 2.5) as well as reasonable ZP (28.3 ± 1.18) as shown in Table 6 with desirability factor 92%.
 |
Table 6 Adjusted Levels of Independent Variables, Predicted and Observed Responses for Optimized Formula |
In this design, the selection of the model maximizes the adjusted R2, predicted R2, as well as F values, which indicates effective modeling of the results employing adopted design where the model is not aliased. The signal-to-noise ratio was measured by adequate precision, which is desirable when its value is higher than 4. All of our ratios indicate an adequate signal to navigate the design space. P values < 0.05 indicate model terms are significant, but P values ˃ 0.1 indicate the model terms are not significant. If there are many insignificant model terms they are not counting and model reduction in this case may improve the result.
Evaluation of the Optimized Formula (F5) of PVS–PLGA-NPs
Morphological Evaluation of the Optimized Formula (F5)
Transmission Electron Microscope (TEM)
The surface morphology of F5 NPs was uniform in size, showed small spherical particles that can encapsulate large amount of PVS, with narrow size diameter,4 smooth surface and a core of PLGA enriched with PVS as well as a shell of BSA as shown in Figure 4.18,47
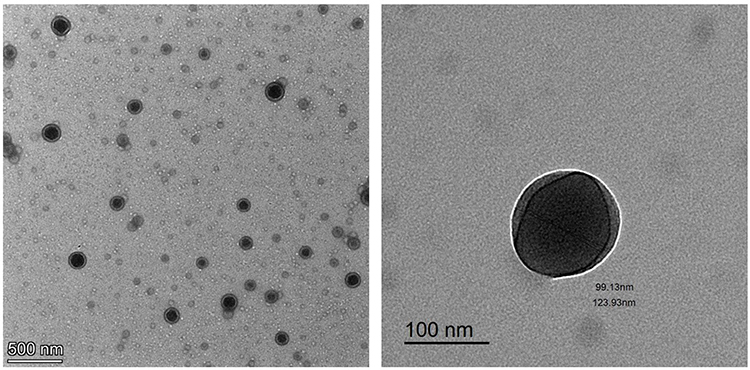 |
Figure 4 Transmission electron microscope (TEM) of F5 NPs. |
Scanning Electron Microscope (SEM)
The photomicrograph of the SEM showed nanostructures of spherical shape (Figure 5). The smooth surface of the particles confirms the suitability of the parameters selected for NP preparation.19,48
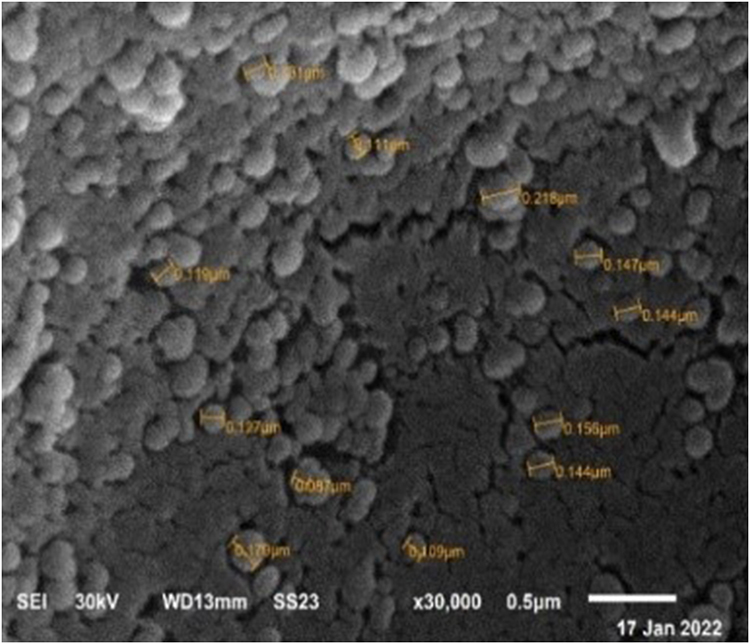 |
Figure 5 Scanning electron microscope (SEM) of F5 NPs. |
Fourier-Transform Infrared Spectroscopy (FT-IR)
The possibility of interactions between PVS and the polymers used in NPs production was studied by FT-IR spectroscopy. Figure 6A represents the FT-IR spectra of PVS, PLGA, BSA, their physical mixture of F5 NPs, medicated and plain NPs for F5. The spectrum of PVS (I) displays the distinctive peaks of PVS. The peak at 3419 cm−1 is correlated to stretching hydroxyl bond (O-H), the peak at 1727 cm−1 is correlated to stretching carboxyl bond (C=O) and the peak at 1569 cm−1 is due to stretching alkenes (C=C) which are characteristic peaks of PVS.3,49,50 The spectrum of PLGA (II) shows the characteristic peaks for PLGA. The peaks around 3523–3654 cm−1 are correlated to OH stretching, the peaks between 2884 and 3000 cm−1 are due to CH, CH2, and CH3 stretching vibration, the peak at 1754 cm−1 is due to the ester bond, the peaks at 846–1459 cm−1 is due to (C–H) bending.51,52 The spectrum of BSA (III)) shows characteristic peaks at 1657, 1543, and 1242 cm−1 which are as a result of flexural vibration adsorption of amide I (-NH2), amide II (-NH-), and amide III (C-N), respectively.53 The spectrum of F5 physical mixture (IV) shows the characteristic peaks of PVS, PLGA and BSA, but with reduced intensities as the outcome of dilution effect. The spectrum of medicated F5 (V) shows the absence of the characteristic absorption peaks of PVS, verifying its entrapment in the NPs. The characteristic peaks of PVS, PLGA and BSA were present in FT-IR spectra of their physical mixture and FT-IR spectra of PVS, BSA and PLGA alone; thus, there was no interaction between PVS, PLGA and BSA.
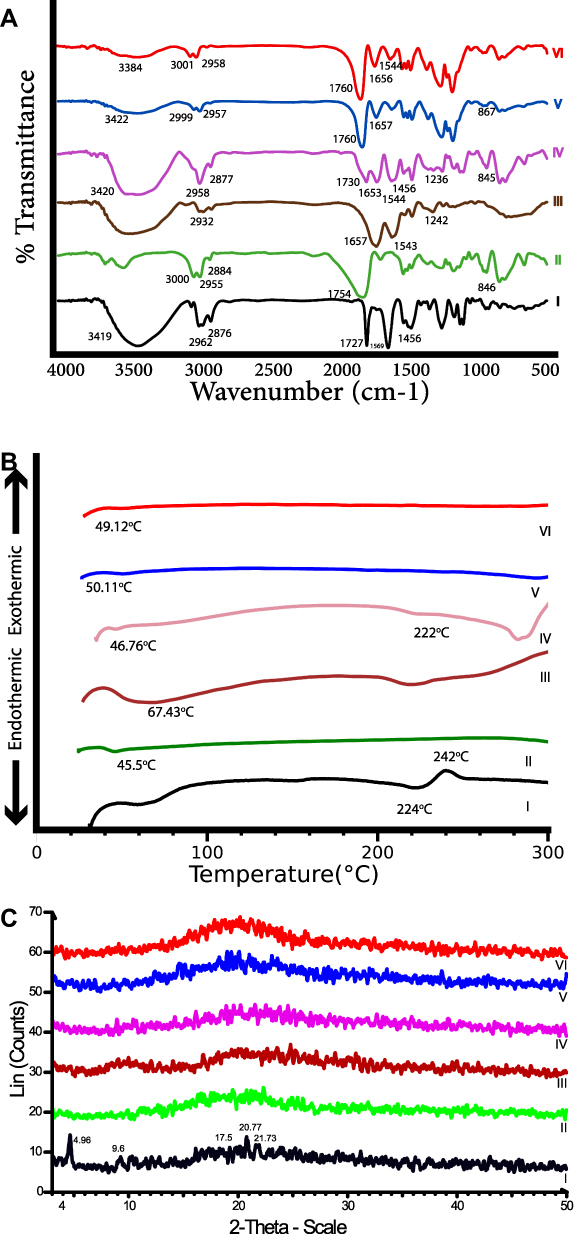 |
Figure 6 Solid characterizations of the optimized formula (F5), FTIR spectra (A), DSC thermograms (B) and PXRD patterns (C) of (I) PVS, (II) PLGA, (III) BSA, (IV) physical mixture, (V) optimized F5 and (VI) plain F5. Abbreviations: FT-IR, Fourier-transform infrared spectroscopy; DSC, differential scanning calorimetry; PXRD, powder X-ray diffractometry; PVS, pravastatin sodium; PLGA, poly(d,l-lactide-co-glycolide); BSA, bovine serum albumin. |
Differential Scanning Calorimetry Analysis (DSC)
Thermal analysis is used to study the compatibility between PVS and other NPs ingredients. Figure 6 B shows DSC thermograms of PVS, PLGA, BSA, their physical mixture, medicated F5 as well as plain F5. The DSC thermogram of pure PVS (I) exhibits an endothermic peak at 224 °C and exothermic peak at 242°C due to the melting process of the anhydrous crystalline form of the drug.3 The thermogram of PLGA shows an endothermic peak at 45.5°C (II). This peak referred to the glass transition temperature (Tg).54 The thermograms of BSA (III) show an endothermic peak near 67.43°C.55 In the thermogram of F5 physical mixture (IV), the presence of distinctive peak of PVS and PLGA verify that there is no drug–polymer interaction; however, the endothermic peak of PVS was shifted to a lower temperature this may be due to solvation of PVS in the molten PLGA or any possible decrease in the drug crystallinity or heat-induced interaction between PVS and PLGA.56 This disappearance of melting peaks of PVS from the medicated NPs formulation thermograms (V) indicated that PVS was likely entrapped in the amorphous state and molecularly dispersed in the polymeric matrix.57,58
Powder X-Ray Diffractometry (PX-RD)
PX-RD patterns of PVS, PLGA, BSA, physical mixture, medicated F5 and plain F5 are presented in Figure 6C. The PX-RD pattern of PVS (I) shows intense diffraction peaks at angles; 4.96°, 17.5°, 20.77°, 21.733° and 23.94° (2θ) angle, indicating the crystallinity of PVS.3,50 The amorphous nature of both PLGA and BSA was ascertained by the absence of diffraction bands in their diffractograms (II) and (III),51,59 respectively. PVS distinct peaks still appear in the diffractograms of its physical mixture with PLGA and BSA. The loss of most characteristic peaks of PVS in the PX-RD pattern of medicated F5 NPs (V) was notable which suggested that PVS encapsulation in the polymer matrix in an amorphous state has several advantages like larger surface area, higher solubility and improved bioavailability.24
In vitro Drug Release Study
Figure 7 demonstrates PVS dissolution profiles from F5 NPs which are significantly different from the profile of PVS alone in different pH values. Drug release can be controlled by several parameters such as the drug solubility, the PS of the prepared NPs and the pH of the dissolution media. The dissolution profile of PVS in acidic pH (Figure 7A) lower than that in basic pH (Figure 7B and C); this was attributed to PVS is weak acidic and its pKa value is 4.2. However in the presence of alkali media, the release rate was faster due to phosphate ions.7,60 The release of PVS from F5 NPs was a biphasic, initial burst release at the first 2 h was followed by a controlled release phase till 4 h. This is may be due to the spontaneous partitioning of PVS into the dissolution medium upon addition of the freeze-dried F5 NPs due to its higher water solubility besides the presence of a quantity on the surface of PLGA-NPs explaining the burst release observed.61 The controlled release phase could be attributed to the drug entrapped in the NPs that could be released in a regulated manner.62 The rapid drug release may achieve the therapeutic drug concentration that could be preserved by the controlled drug release which decreases the number of doses improving the patient compliance. Similar results were previously reported.63,64
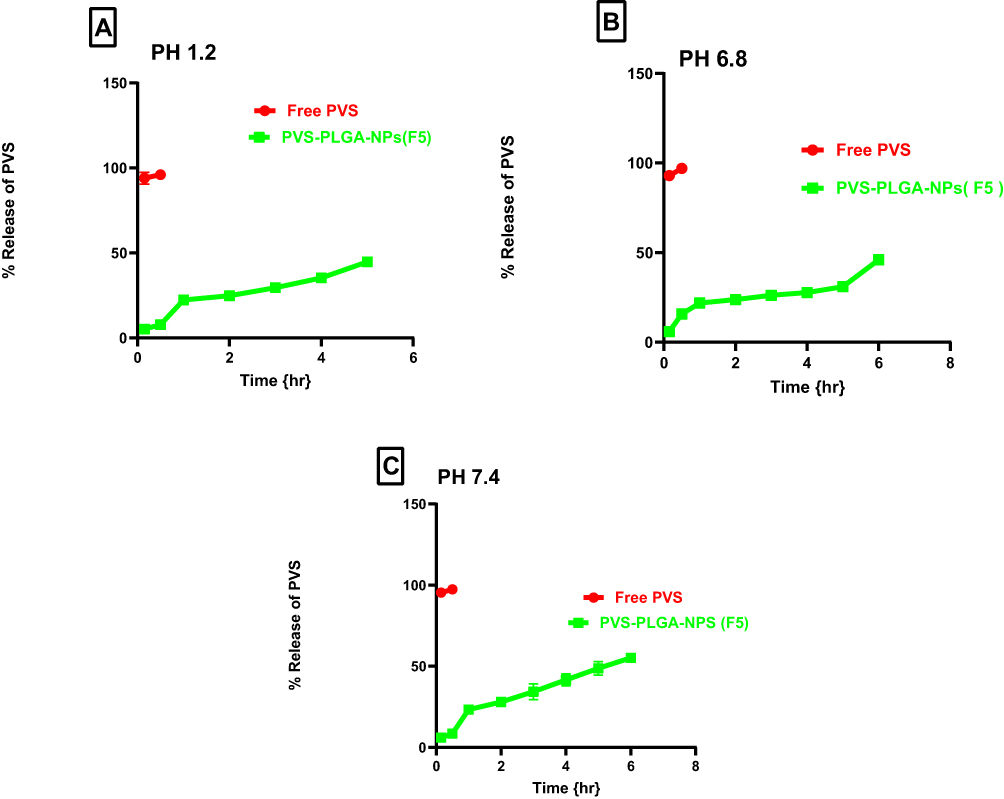 |
Figure 7 In vitro release profile of free PVS and the optimized formula F5 in 0.1 N HCL pH 1.2 (A), phosphate buffer pH 6.8 (B) and phosphate buffer pH 7.4 (C). Abbreviation: PVS, pravastatin sodium. |
Release Kinetics
Kinetics analysis of the release data (Table 7) was depended on the form of PVS (free or entrapped in PLGA - NPs) and the medium pH. The in vitro release data in different PH values were best fitted with Higuchi model for F5 which indicated diffusion-controlled drug release. Further examination using the Korsmeyer–Peppas model indicated that the diffusional exponent (n) values for F5 NPs at pH 1.2 were 0.566, indicating a non-Fickian mechanism, while at pH 6.8 were 0.45, indicating a Fickian and at pH 7.4 were 0.619 indicating a non-Fickian which described the drug release during the rapid release phase that is controlled by both diffusion and erosion. Similar kinetic release behavior was previously reported.51
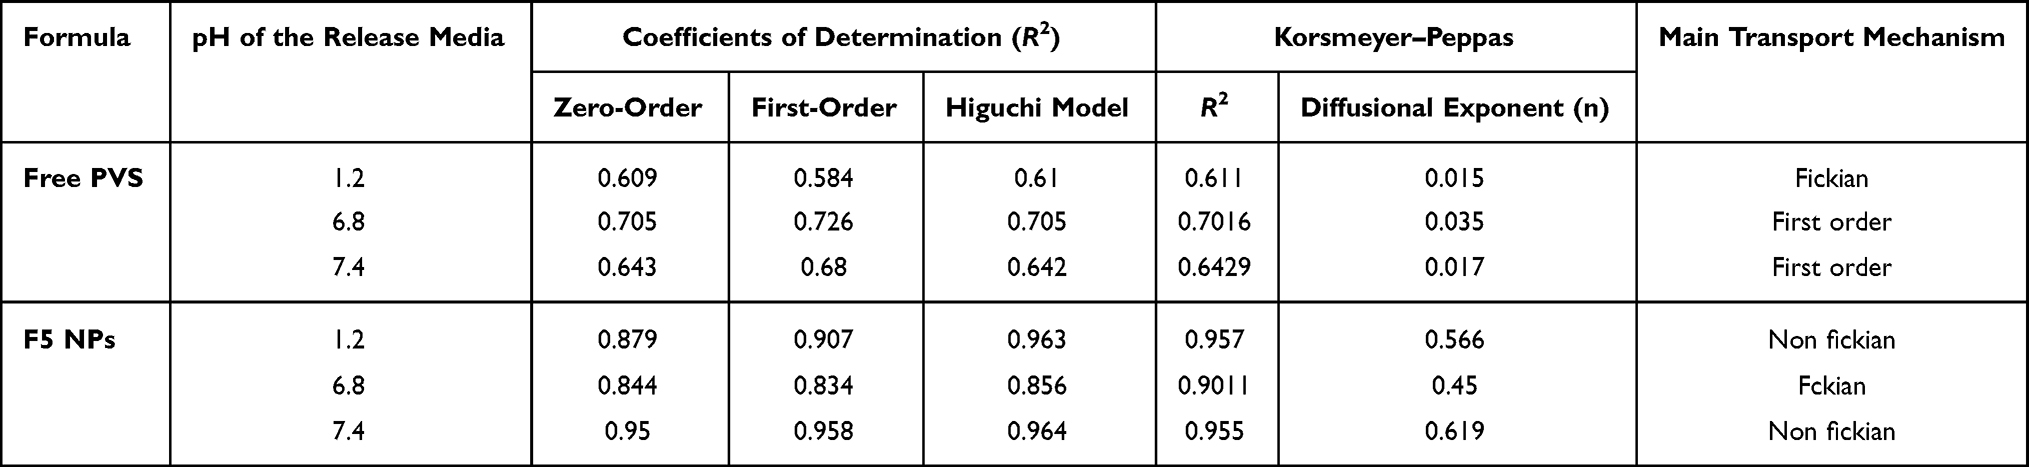 |
Table 7 Kinetic Analysis of Drug Release Data |
Stability Studies
Stability studies of F5 NPs were conducted by examining the physical appearance, PS, PDI, ZP and EE% for a period of 3 months in the refrigerator at (4 ± 2°C) and at room temperature (25 ± 2°C). The present study showed that, PVS–PLGA-NPs (F5) did not exhibit any physical changes in color, odor or shape over the whole storage period. Table 8 represents the results of the stability studies at refrigerated and at room temperatures over a period of 3 months. There was an insignificant (p > 0.05) change in the average PS, PDI, ZP mv and EE% at the beginning of the storage period in refrigerator except that there was a significant (p < 0.05) increase in the average PS from the second month and decrease in ZP at the second month when compared to those initially prepared. In contrast, at ambient temperature there was a significant decrease in ZP from the second week and a significant increase in PS from the second month, but no phase separation was observed. This may be attributed to sedimentation and agglomeration of the colloidal suspension leading to larger PS and lower ZP.65,66 According to the results regarding PS and ZP in both refrigerated and ambient temperature, it was considered that 4°C is very suitable for PVS–PLGA-NPs which exhibited physical stability at this temperature compared to room temperature.67 The percentage of PVS remaining in PLGA-NPs were not significantly changed during the whole storage period in the refrigerator, but showed a significant decrease at room temperature. These results suggest that PLGA-NPs showed excellent stability for encapsulation of PVS at refrigerated compared to ambient temperature. Similar findings were declared previously.51,68
 |
Table 8 PS, PDI, ZP, EE% of PVS–PLGA-NPs Aqueous Dispersion (F5) Stored at Refrigerated (4 ± 2°C) and at Ambient Condition (25 ± 2°C) |
In vivo Assessment Study
Biomarker Assessment
Effects on Serum Lipid Profile
Hyperlipidemia is generally managed by lowering the serum concentration of total cholesterol (TC), triglycerides (TG) and low-density lipoprotein cholesterol (LDL-C) and improve high-density lipoprotein cholesterol (HDL-C) level.69 PVS is a potent hypolipidemic drug that inhibits bad cholesterol biosynthesis in the liver, thus reducing the incidence of cardiovascular diseases. Therefore, the effect of the optimized formula (F5) and PVS solution on the lipid level was assessed. After 12 hours of poloxamer 407 injection, the lipid profiles were assessed and there was a significant elevation in the serum level of TC, TG, HDL and LDL in all groups compared to the normal one (negative control) as illustrated in Table 9. This increase in lipid profile was attributed to the effect of poloxamer 407 which is a non-ionic surfactant that can induce hyperlipidemia when administered to rats through indirect stimulation of HMG-CoA reductase, that is involved in cholesterol biosynthesis.30,70 There was a significant difference in the serum level of all the studied lipid (TC, TGs, HDL and LDL) between normal control and negative control groups. Once the treatment was initiated, the lipid level was gradually decreased in the PVS-treated group and the F5 NPs-treated group. After a week of treatment, there was a significant difference between the PVS-treated group and the F5 NPs-treated group as illustrated in Figure 8. The unusual increase in the serum level of HDL in the positive control group was a characteristic feature of poloxamer 407 in rats.71 F5 NPs showed pronounced reduction in serum TC, TG and LDL. Hence, PLGA–NPs showed better in vivo performance than PVS solution in improving lipid profile which is primarily attributed to encapsulation of PVS into the hydrophobic polymer leading to minimizing the first-pass effect and improving its hypolipidemic activity.8,12 These results are in accordance with.71–73
 |
Table 9 Effect of Optimized Formula (F5) and PVS Solution on Serum Lipid Profile |
 |
Figure 8 The serum level of the examined lipid biomarker after the end of treatment period (1 week) with F5 NPs and PVS solution. Notes: Values were expressed as means ± SEM (n=6 rats) *Significantly different from normal control value; $Significantly different from positive control value; #Significantly different from PVS value and @Significantly different from F5 NPs value. The statistical analysis was performed at p < 0.05 using Student's t-test (unpaired). |
Effects on Liver Functions
Hyperlipidemia has been considered to be a major cause of fatty liver, a condition that can lead to liver cirrhosis. A vital role in the metabolism of both lipid and lipoprotein is played by the liver, through its role in the biosynthesis of cholesterol as well as lipoprotein homeostasis.74 It has been reported that there is a relationship between hyperlipidemia and the elevated liver enzyme especially in patients with heart problems.75 In the present study, there was a significant increase in liver enzymes (alanine aminotransferase (ALT), aspartate aminotransferase (ALT), alkaline phosphatase (ALP)) and significant reduction in serum albumin due to injection of the poloxamer 407 (hyperlipidemic animals) as illustrated in Figure 9. Treatment with PVS solution showed a significant decrease in the previous liver enzymes and a slight increase in albumin level without restoration their normal level. F5 NPs-treated group showed a significant decrease in liver serum enzymes and a significant increase in albumin level besides having the ability to restore their normal level and enhance the liver function as shown in Table 10 Similar results were found in the literatures.71,76
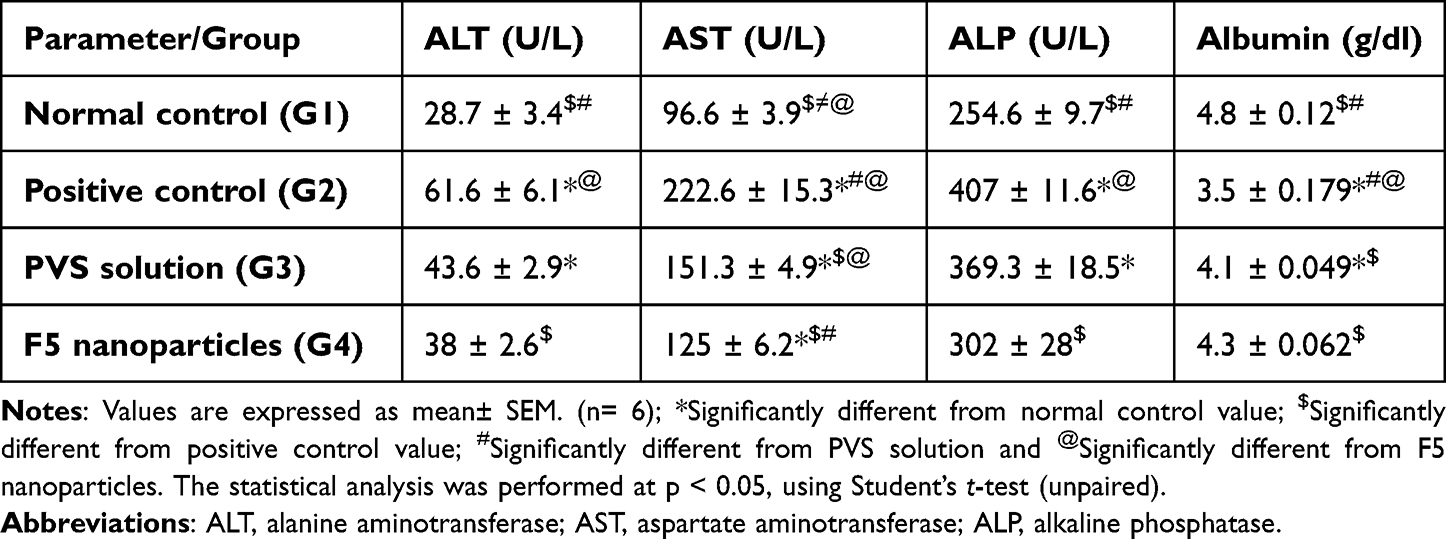 |
Table 10 Effect of F5 NPs and PVS Solution on Serum Liver Function Test, Albumin and Alkaline Phosphatase |
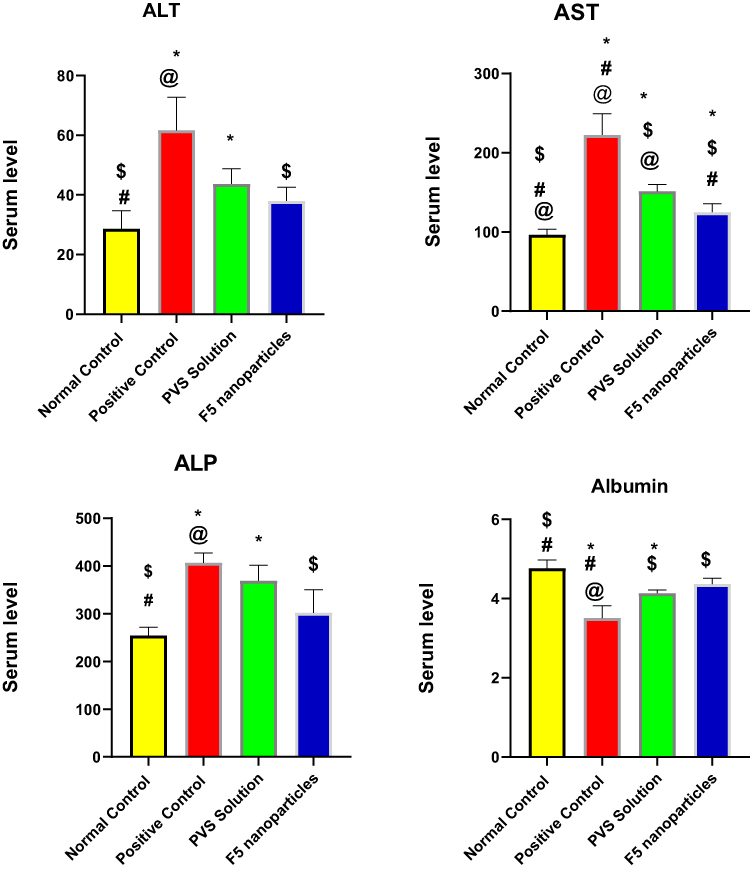 |
Figure 9 Effect of F5 NPs and PVS solution on serum liver function. Abbreviations: ALT, alanine aminotransferase; AST, aspartate aminotransferase; ALP, alkaline phosphatase. Notes: Values are expressed as mean± SEM (n= 6); *Significantly different from normal control value; $Significantly different from positive controlvalue #Significantly different from PVS solution and @Significantly different from F5 nanoparticles. The statistical analysis was performed at p < 0.05, using Student's t-test (unpaired). |
Histopathological Examination
Hyperlipidemia increases the incidence of many diseases mainly fatty liver and myopathy.77 In this study, the effect of the prepared F5 NPs on liver cells and muscle structure was studied. The histopathological examinations confirm the biochemical results in this study. Sections of the liver tissue were obtained from the negative control group and examined by light microscopic, showed the normal histological structure of the central vein (CV) and the surrounding hepatocytes (Figure 10A1 and A2). The liver section of the positive control group showed a few inflammatory cells, fatty change in a diffuse manner around hepatocytes as well as congested CV, dilated sinusoids and bile duct dilation (Figure 10 B1 and B2). Liver tissues of the animals treated with PVS solution showed fewer fat vacuoles in hepatocytes, dilated sinusoids, mild congestion that was detected around the portal area and mild bile duct dilation (Figure 10 C1 and C2). While the animals treated with F5 NPs showed restored normal organization of hepatic cords around CV with normal portal area and sinusoids (Figure 10 D1 and D2). Microscopic examination of quadriceps muscles of the negative control group showed the normal histological structure of both longitudinal and crossed sections of the bundles (Figure 11A1 and A2), respectively. While the positive control group showed hyaline degeneration in some sections, deposition of the fat droplets between the atrophied myocytes and mild mononuclear cells infiltration (Figure 11B1 and B2). The animals treated with PVS solution showing moderate lipid infiltration in the muscle fibers (Figure 11C1 and C2). The animals treated with F5 NPs show very mild lipid infiltration in muscle fibers (Figure 11D1 and D2). Finally, we observed that treatment with F5 NPs resulted in increased hypolipidemic, hepatoprotective activity of PVS and reduced myopathy. Similar findings were declared previously.33,71
 |
Figure 10 Microscopic pictures of H&E-stained hepatic sections showing normal organization of hepatic cords H around central veins (CV) with normal portal areas (PA) and sinusoids (S) in the negative control group (A1 and A2). Hepatic sections from positive control group (B1 and B2) showing congested central veins (CV, red arrow), fat vacuoles (black arrows) in hepatocytes (H), dilated sinusoids (S), mononuclear cells infiltration in portal areas (PA, yellow arrows), bile duct dilation (arrowheads). Hepatic sections from PVS-treated group (C1 and C2) showing fewer fat vacuoles in hepatocytes (black arrows), dilated sinusoids (S), fewer mononuclear cells infiltration in portal areas (PA, yellow arrow), mild bile duct dilation (arrowheads). Hepatic sections from F5 NPs-treated group (D1 and D2) showing restored normal organization of hepatic cords (H) around central veins (CV) with normal portal areas (PA) and sinusoids (S). Low magnification ×: 100 bar 100 and high magnification ×: 400 bar 50. |
 |
Figure 11 Microscopic pictures of H&E stained longitudinally sectioned skeletal muscles showing normal organization of striated muscle fibers with peripherally located nuclei in negative control group (A1). The longitudinally sectioned skeletal muscles from the positive control group (B1) showing hyaline degeneration (black arrow) in some sections, marked lipid infiltration in muscle fiber and marked mononuclear cells infiltration in interstitial tissue (yellow arrow). The longitudinally sectioned skeletal muscles in the free PVS-treated group (C1), showing moderate lipid infiltration in muscle fibers (blue arrow) and in the F5 nanoparticles-treated group (D1), showing lower lipid infiltration in muscle fibers (blue arrow). The crossly sectioned skeletal muscles showing normal muscle fibers with peripherally located nuclei in negative control group (A2). The crossly sectioned skeletal muscles from positive control group (B2) showing marked lipid infiltration, mild mononuclear cells infiltration (yellow arrows) in muscle fibers and hyaline degeneration in some sections with mild mononuclear cells infiltration. The cross-sectioned skeletal muscles from the free PVS-treated group (C2) showing moderate lipid infiltration in muscle fibers (blue arrow) and in the F5 NPs-treated group (D2) showing very mild lipid infiltration in muscle fibers (blue arrow). |
Conclusion
Concisely, PVS–PLGA-NPs were successfully prepared by double emulsion solvent evaporation technique. A 32 factorial design was used to select the optimized formula for further evaluation. We confirmed that both drug:polymer ratios and surfactant concentration played a vital role in determining NPs characteristics. The developed NPs were proved to have appropriate PS, PDI, EE % and suitable ZP. F5 was selected as the optimized formula as it was characterized by highest EE% (51.7 ± 5), reasonable PS (168.4 ± 2.506) as well as reasonable ZP (−28.3 ± 1.18). Solid-state characterization confirmed the encapsulation of PVS into the polymeric matrix. TEM and SEM images indicated that NPs are distinct spherical shape with smooth surface. The in vitro release study of the optimized formula (F5) confirmed that PVS release can be successfully regulated in PLGA-NPs formulations over a period of 6 hr. F5 NPs were not significantly changed during the whole storage period in the refrigerator. Finally, evaluation of in vivo antihyperlipidemic and hepatoprotective activities indicated that PVS–PLGA-NPs are a promising treatment for hyperlipidemia with higher efficacy, and hepatoprotective activity compared to PVS solution.
Acknowledgments
The authors would like to express their gratitude to Dr Walaa Awadin, Associate Professor, Department of Pathology, Faculty of Veterinary Medicine, Mansoura University, for her technical support and specimen examination during the histopathological examination. The authors would like to thank Delta Pharm Pharmaceutical Co, Cairo, Egypt, and Purac Biomedical, Holland, for kindly supplying pravastatin sodium and poly(lactic-glycolic acid), respectively.
Disclosure
The authors report no conflicts of interest in this work.
References
1. Korani S, Korani M, Bahrami S, et al. Application of nanotechnology to improve the therapeutic benefits of statins. Drug Discov Today. 2019;24(2):567–574. doi:10.1016/j.drudis.2018.09.023
2. Castañeda PS, Escobar-Chávez JJ, Vázquez JA, Cruz IMR, Contreras LMM. Pravastatin transdermal patches: effect of the formulation and two different lengths of microneedles on in-vitro percutaneous absorption studies. Iran J Pharm Res. 2020;19(2):127–133. doi:10.22037/ijpr.2019.1100914
3. Al-Badr AA, Mostafa GA. Pravastatin sodium. Profiles Drug Subst Excip Relat Methodol. 2014;39:433–513. doi:10.1016/b978-0-12-800173-8.00008-8
4. Campos‐Lara M, Pinto‐Almazán R, Oropeza MV, Mendoza‐Espinoza JA. Optimization of a pravastatin quantification method using HPLC with ultraviolet detection in human serum for monitoring dyslipidemic patients. J Liq Chromatogr. 2008;31(5):667–674. doi:10.1080/10826070701853784
5. Saraogi GK, Tholiya S, Mishra Y, et al. Formulation development and evaluation of pravastatin-loaded nanogel for hyperlipidemia management. Gels. 2022;8(2):81. doi:10.3390/gels8020081
6. Tayel SA, El-Nabarawi MA, Tadros MI, Abd-Elsalam WH. Duodenum-triggered delivery of pravastatin sodium via enteric surface-coated nanovesicular spanlastic dispersions: development, characterization and pharmacokinetic assessments. Int J Pharm. 2015;483(1–2):77–88. doi:10.1016/j.ijpharm.2015.02.012
7. Puttegowda VD, Karki R, Goli D, Mudagal MP, Mudagal MP. Formulation and pharmacokinetic evaluation of microcapsules containing pravastatin sodium using rats. Scientifica. 2016;2016:7623193. doi:10.1155/2016/7623193
8. Moshiri M, Mehmannavaz F, Hashemi M, Yazdian-Robati R, Shabazi N, Etemad L. Evaluation of the efficiency of simvastatin loaded PLGA nanoparticles against acute paraquat-intoxicated rats. Eur J Pharm Sci. 2022;168:106053. doi:10.1016/j.ejps.2021.106053
9. Rizvi SZH, Shah FA, Khan N, et al. Simvastatin-loaded solid lipid nanoparticles for enhanced anti-hyperlipidemic activity in hyperlipidemia animal model. Int J Pharm. 2019;560:136–143. doi:10.1016/jijpharm.2019.02.002
10. Arafa MG, Girgis GN, El-Dahan MS. Chitosan-coated PLGA nanoparticles for enhanced ocular anti-inflammatory efficacy of atorvastatin calcium. Int J Nanomedicin. 2020;15:1335. doi:10.2147/IJN.S237314
11. Aldalaen S, El-Gogary RI, Nasr M. Fabrication of rosuvastatin-loaded polymeric nanocapsules: a promising modality for treating hepatic cancer delineated by apoptotic and cell cycle arrest assessment. Drug Dev Indu Pharm. 2019;45(1):55–62. doi:10.1080/03639045.2018.1515221
12. Sifaoui I, Díaz-Rodríguez P, Rodríguez-Expósito RL, et al. Pitavastatin loaded nanoparticles: a suitable ophthalmic treatment for Acanthamoeba Keratitis inducing cell death and autophagy in Acanthamoeba polyphaga. Eur J Pharm Biopharm. 2022;180:11–22. doi:10.1016/j.ejpb.2022.09.020
13. Derman S. Caffeic acid phenethyl ester loaded PLGA nanoparticles: effect of various process parameters on reaction yield, encapsulation efficiency, and particle size. J Nanomater. 2015;2015:341848. doi:10.1155/2015/341848
14. Sanna V, Roggio AM, Siliani S, et al. Development of novel cationic chitosan-and anionic alginate-coated poly(D, L-lactide-co-glycolide) nanoparticles for controlled release and light protection of resveratrol. Int J Nanomedicine. 2012;7:5501–5516. doi:10.2147/ijn.S36684
15. Kim BS, Kim CS, Lee KM. The intracellular uptake ability of chitosan-coated Poly (D, L-lactide-co-glycolide) nanoparticles. Arch Pharm Res. 2008;31(8):1050–1054. doi:10.1007/s12272-001-1267-5
16. Almutairy BK, Alshetaili A, Alali AS, Ahmed MM, Anwer MK, Aboudzadeh MA. Design of olmesartan medoxomil-loaded nanosponges for hypertension and lung cancer treatments. Polymers. 2021;13(14):2272. doi:10.3390/polym13142272
17. Anwer MK, Al-Mansoor MA, Jamil S, Al-Shdefat R, Ansari MN, Shakeel F. Development and evaluation of PLGA polymer based nanoparticles of quercetin. Int J Biol Macromol. 2016;92:213–219. doi:10.1016/j.ijbiomac.2016.07.002
18. Ramadan E, Borg T, Abdelghani G, Saleh NM. Transdermal microneedle-mediated delivery of polymeric lamivudine-loaded nanoparticles. J Pharm Technol Drug Res. 2016;5:1. doi:10.7243/2050-120X-5-1
19. Bhatt PC, Verma A, Al-Abbasi FA, Anwar F, Kumar V, Panda BP. Development of surface-engineered PLGA nanoparticulate-delivery system of Tet1-conjugated nattokinase enzyme for inhibition of Aβ(40) plaques in Alzheimer’s disease. Int J Nanomedicine. 2017;12:8749–8768. doi:10.2147/ijn.S144545
20. Iqbal M, Zafar N, Fessi H, Elaissari A. Double emulsion solvent evaporation techniques used for drug encapsulation. Int J Pharm. 2015;496(2):173–190. doi:10.1016/j.ijpharm.2015.10.057
21. El-Emam GA, Girgis GN, Hamed MF, Soliman O, Abd El AE. Formulation and pathohistological study of mizolastine–solid lipid nanoparticles–loaded ocular hydrogels. Int J Nanomedicine. 2021;16:7775. doi:10.2147/IJN.s335482
22. Vyas A, Saraf SK, Saraf S. Encapsulation of cyclodextrin complexed simvastatin in chitosan nanocarriers: a novel technique for oral delivery. J Incl Phenom Macrocycl Chem. 2010;66:251–259. doi:10.1007/s10847-009-9605-y
23. Badran MM, Harisa GI, AlQahtani SA, Alanazi FK, Zoheir KM. Pravastatin-loaded chitosan nanoparticles: formulation, characterization and cytotoxicity studies. JDDST. 2016;32:1–9. doi:10.1016/j.jddst.2016.01.004
24. Kang JH, Chon J, Kim YI, et al. Preparation and evaluation of tacrolimus-loaded thermosensitive solid lipid nanoparticles for improved dermal distribution. Int J Nanomedicine. 2019;14:5381–5396. doi:10.2147/ijn.S215153
25. Yamunappa KR, Suvarna P, Suvarna P, Swamy VB, Swamy VN. Formulation and evaluation of immediate release pravastatin sodium tablets. RJPDFT. 2016;8:105. doi:10.5958/0975-4377.2016.00014.8
26. Martin AN, Bustamante P, Chun AHC. Physical Pharmacy: Physical Chemical Principles in the Pharmaceutical Sciences.
27. Higuchi T. Mechanism of sustained-action medication. Theortical analysis of rate of release of solid drugs dispersed in solid matrix. J Pharm Sci. 1963;52:1145–1149. doi:10.1002/jps.2600521210
28. Ritger PL, Peppas NA. A simple equation for description of solute release I. Fickian and non-Fickian release from non-swellable devices in the form of slabs, spheres, cylinders or discs. J Control Release. 1987;5:23–36. doi:10.1016/0168-3659(87)90034-4
29. Zou W, Cao G, Xi Y, Zhang N. New approach for local delivery of rapamycin by bioadhesive PLGA-carbopol nanoparticles. Drug Deliv. 2009;16(1):15–23. doi:10.1080/10717540802481307
30. Fathi HA, Allam A, Elsabahy M, Fetih G, El-Badry M. Nanostructured lipid carriers for improved oral delivery and prolonged antihyperlipidemic effect of simvastatin. Colloids Surf B. 2018;162:236–245. doi:10.1016/j.colsurfb.2017.11.064
31. Dalaklioglu S, Sahin P, Tasatargil A, Celik-Ozenci C. Pravastatin improves the impaired nitric oxide-mediated neurogenic and endothelium-dependent relaxation of corpus cavernosum in aged rats. Aging Male. 2014;17(4):259–266. doi:10.3109/13685538.2013.832194
32. Cocchetto DM, Bjornsson TD. Methods for vascular access and collection of body fluids from the laboratory rat. J Pharm Sci. 1983;72(5):465–492. doi:10.1002/jps.2600720503
33. Abo-zalam HB, El-Denshary ES, Abdelsalam RM, Khalil IA, Khattab MM, Hamzawy MA. Therapeutic advancement of simvastatin-loaded solid lipid nanoparticles (SV-SLNs) in treatment of hyperlipidemia and attenuating hepatotoxicity, myopathy and apoptosis: comprehensive study. Biomed Pharmacother. 2021;139:111494. doi:10.1016/j.biopha.2021.111494
34. Salem HF, Kharshoum RM, Abou-Taleb HA, Naguib DM. Brain targeting of resveratrol through intranasal lipid vesicles labelled with gold nanoparticles: in vivo evaluation and bioaccumulation investigation using computed tomography and histopathological examination. J Drug Target. 2019;27(10):1127–1134. doi:10.1080/1061186X.2019.1608553
35. Bancroft JD, Gamble M. Theory and Practice of Histological Techniques. Elsevier health sciences; 2008.
36. Crotts G, Park TG. Protein delivery from poly(lactic-co-glycolic acid) biodegradable microspheres: release kinetics and stability issues. J Microencapsul. 1998;15(6):699–713. doi:10.3109/02652049809008253
37. Sinha V, Trehan A. Biodegradable microspheres for protein delivery. J Control Release. 2003;90(3):261–280. doi:10.1016/s0168-3659(03)00194-9
38. Nakhare S, Vyas SP. Preparation and characterization of multiple emulsion based systems for controlled diclofenac sodium release. J Microencapsul. 1996;13(3):281–292. doi:10.3109/02652049609026016
39. Panigrahi D, Sahu PK, Swain S, Verma RK. Quality by design prospects of pharmaceuticals application of double emulsion method for PLGA loaded nanoparticles. SN Appl Sci. 2021;3(6):638. doi:10.1007/s42452-021-04609-1
40. Feczkó T, Toth J, Dósa G, Gyenis J. Influence of process conditions on the mean size of PLGA nanoparticles. Chem Eng Process. 2011;50:846–853. doi:10.1016/j.cep.2011.05.006
41. Tefas LR, Tomuţă I, Achim M, Vlase L. Development and optimization of quercetin-loaded PLGA nanoparticles by experimental design. Clujul Med. 2015;88(2):214–223. doi:10.15386/cjmed-418
42. Jalil R, Nixon JR. Biodegradable poly(lactic acid) and poly(lactide-co-glycolide) microcapsules: problems associated with preparative techniques and release properties. J Microencapsul. 1990;7(3):297–325. doi:10.3109/02652049009021842
43. Kheradmandnia S, Vasheghani-Farahani E, Nosrati M, Atyabi F. The effect of process variables on the properties of ketoprofen loaded solid lipid nanoparticles of beeswax and carnauba wax. IJCCE. 2010;29(4):181–187. doi:10.30492/ijcce.2010.6485
44. Sznitowska M, Wolska E, Baranska H, Cal K, Pietkiewicz J. The effect of a lipid composition and a surfactant on the characteristics of the solid lipid microspheres and nanospheres (SLM and SLN). Eur J Pharm Biopharm. 2017;110:24–30. doi:10.1016/j.ejpb.2016.10.023
45. Misra PK, Dash U, Maharana S. Investigation of bovine serum albumin-surfactant aggregation and its physicochemical characteristics. Colloids Surf A. 2015;483:36–44. doi:10.1016/j.colsurfa.2015.06.052
46. Wang B, Chen G, Mao Z, Zhang Y, Yu D, Gao C. Preparation and cellular uptake of PLGA particles loaded with lamivudine. Chin Sci Bull. 2012;57(31):3985–3993. doi:10.1007/s11434-012-5419-1
47. Liang Q, Xiang H, Li X, et al. Development of rifapentine-loaded PLGA-based nanoparticles: in vitro characterisation and in vivo study in mice. Int J Nanomedicine. 2020;15:7491–7507. doi:10.2147/IJN.S257758
48. Elsewedy HS, Dhubiab BEA, Mahdy MA, Elnahas HM. Development, optimization, and evaluation of PEGylated brucine-loaded PLGA nanoparticles. Drug Deliv. 2020;27(1):1134–1146. doi:10.1080/10717544.20201797237
49. Tayel SA, El-Nabarawi MA, Tadros MI, Abd-Elsalam WH. Duodenum-triggered delivery of pravastatin sodium: II. Design, appraisal and pharmacokinetic assessments of enteric surface-decorated nanocubosomal dispersions. Drug Deliv. 2016;23(9):3266–3278. doi:10.3109/10717544.2016.1172367
50. Mehanna MM, Shabarek MI, Elmaradny HA, Elmartadny HA. Spray-dried pH-sensitive microparticles: effectual methodology to ameliorate the bioavailability of acid labile pravastatin. Drug Dev Ind Pharm. 2019;45(3):485–497. doi:10.1080/03639045.2018.1562465
51. Abd El Hady WE, Mohamed EA, Soliman OAE, El-Sabbagh HM. In vitro-in vivo evaluation of chitosan-PLGA nanoparticles for potentiated gastric retention and anti-ulcer activity of diosmin. Int J Nanomedicine. 2019;14:7191–7213. doi:10.2147/ijn.S213836
52. Dilawar N, Ur-Rehman T, Shah KU, Fatima H, Alhodaib A. Development and evaluation of PLGA nanoparticle-loaded organogel for the transdermal delivery of risperidone. Gels. 2022;8(11):709. doi:10.3390/gels8110709
53. Huang Y, Hu L, Huang S, et al. Curcumin-loaded galactosylated BSA nanoparticles as targeted drug delivery carriers inhibit hepatocellular carcinoma cell proliferation and migration. Int J Nanomedicine. 2018;13:8309. doi:10.2147/IJN.S184379
54. Akl M, Kartal-Hodzic A, Oksanen T, et al. Factorial design formulation optimization and in vitro characterization of curcumin-loaded PLGA nanoparticles for colon delivery. JDDST. 2016;32. doi:10.1016/j.jddst.2016.01.007
55. Michnik A. Thermal stability of bovine serum albumin DSC study. J Therm Anal Calorimetry. 2003;71(2):509–519. doi:10.1023/A:1022851809481
56. Öztürk AA, Yenilmez E, Özarda MG. Clarithromycin-loaded poly (lactic-co-glycolic acid) (PLGA) nanoparticles for oral administration: effect of polymer molecular weight and surface modification with chitosan on formulation, nanoparticle characterization and antibacterial effects. Polymers. 2019;11(10):1632. doi:10.3390/polym11101632
57. Abdelghany S, Parumasivam T, Pang A, et al. Alginate modified-PLGA nanoparticles entrapping amikacin and moxifloxacin as a novel host-directed therapy for multidrug-resistant tuberculosis. JDDST. 2019;52:642–651. doi:10.1016/j.jddst.2019.05.025
58. Yurtdaş Kirimlioğlu G, Öztürk AA. Levocetirizine dihydrochloride-loaded chitosan nanoparticles: formulation and in vitro evaluation. Turk J Pharm Sci. 2020;17(1):27–35. doi:10.4274/tjps.galenos.2018.34392
59. Yadav P, Yadav AB. Preparation and characterization of BSA as a model protein loaded chitosan nanoparticles for the development of protein-/peptide-based drug delivery system. Futur J Pharm Sci. 2021;7(1):200. doi:10.1186/s43094-021-00345-w
60. Ruiz-Picazo A, Colón-Useche S, Perez-Amorós B, et al. Investigation to explain bioequivalence failure in pravastatin immediate-release products. Pharmaceutics. 2019;11(12):663. doi:10.3390/pharmaceutics11120663
61. Kumar Y, Philip B, Pathak K. High-efficiency loading and controlled release of highly water-soluble drug, pravastatin sodium by use of cross-linked β-cyclodextrin. Int J Pharm Investig. 2011;1(1):10–16. doi:10.4103/2230-973X.76722
62. Puri V, Chaudhary KR, Singh A, Singh C. Inhalation potential of N-Acetylcysteine loaded PLGA nanoparticles for the management of tuberculosis: in vitro lung deposition and efficacy studies. Curr Res Pharmacol Drug Discov. 2022;3:100084. doi:10.1016/j.crphar.2022.100084
63. Govender T, Stolnik S, Garnett MC, Illum L, Davis SS. PLGA nanoparticles prepared by nanoprecipitation: drug loading and release studies of a water soluble drug. J Control Release. 1999;57(2):171–185. doi:10.1016/S0168-3659(98)00116-3
64. Alenazi ASM, El-Bagory IM, Yassin AB, et al. Design of polymeric nanoparticles for oral delivery of capreomycin peptide using double emulsion technique: impact of stress conditions. JDDST. 2022;71:103326. doi:10.1016/j.jddst.2022.103326
65. González AE. Colloidal aggregation coupled with sedimentation: a comprehensive overview. Adv Colloid Sci. 2016;211. doi:10.5772/65699
66. Marinelli L, Ciulla M, Ritsema JAS, et al. Preparation, characterization, and biological evaluation of a hydrophilic peptide loaded on PEG-PLGA nanoparticles. Pharmaceutics. 2022;14(9):1821. doi:10.3390/pharmaceutics14091821
67. De S, Robinson DH. Particle size and temperature effect on the physical stability of PLGA nanospheres and microspheres containing Bodipy. AAPS PharmSciTech. 2004;5(4):e53. doi:10.1208/pt050453
68. Şengel-Türk CT, Hasçiçek C, Dogan AL, Esendagli G, Guc D, Gönül N. Preparation and in vitro evaluation of meloxicam-loaded PLGA nanoparticles on HT-29 human colon adenocarcinoma cells. Drug Dev Ind Pharm. 2012;38(9):1107–1116. doi:10.3109/03639045.2011.641562
69. Grundy SM. Hypertriglyceridemia, atherogenic dyslipidemia, and the metabolic syndrome. Am J Cardiol. 1998;81(4):18B–25B. doi:10.1016/S0002-9149(98)00033-2
70. Harvey RA, Clark M, Finkel R, Rey J, Whalen K. Lippincott’s Illustrated Reviews: Pharmacology. Vol. 526. Philadelphia: Wolters kluwer india Pvt Ltd; 2012.
71. Ahmed TA. Study the pharmacokinetics, pharmacodynamics and hepatoprotective activity of rosuvastatin from drug loaded lyophilized orodispersible tablets containing transfersomes nanoparticles. JDDST. 2021;63:102489. doi:10.1016/j.jddst.2021.102489
72. Dudhipala NR, Ettireddy SR, Puchakayala GR. Attenuation of lipid levels in triton induced hyperlipidemia rats through rosuvastatin calcium nanoparticles: pharmacokinetic and pharmacodynamic studies. Chem Phys Lipids. 2021;237:105081. doi:10.1016/j.chemphyslip.2021.105081
73. Soni A, Dandagi P, Gadad A, Mastiholimath V. Simvastatin-loaded PLGA nanoparticles for improved oral bioavailability and sustained release: effect of formulation variables. Asian J Pharm Sci. 2011;5:57. doi:10.4103/0973-8398.84545
74. Assy N, Kaita K, Mymin D, Levy C, Rosser B, Minuk G. Fatty infiltration of liver in hyperlipidemic patients. Dig Dis Sci. 2000;45(10):1929–1934. doi:10.1023/a:1005661516165
75. Park EO, Bae EJ, Park BH, Chae SW. The associations between liver enzymes and cardiovascular risk factors in adults with mild dyslipidemia. J Clin Med. 2020;9(4). doi:10.3390/jcm9041147
76. Mahmoud MO, Aboud HM, Hassan AH, Ali AA, Johnston TP. Transdermal delivery of atorvastatin calcium from novel nanovesicular systems using polyethylene glycol fatty acid esters: ameliorated effect without liver toxicity in poloxamer 407-induced hyperlipidemic rats. J Control Release. 2017;254:10–22. doi:10.1016/j.jconrel.2017.03.039
77. Addison O, Marcus RL, LaStayo PC, Ryan AS. Intermuscular fat: a review of the consequences and causes. Int J Endocrinol. 2014;2014:309570. doi:10.1155/2014/309570
 © 2023 The Author(s). This work is published and licensed by Dove Medical Press Limited. The full terms of this license are available at https://www.dovepress.com/terms.php and incorporate the Creative Commons Attribution - Non Commercial (unported, v3.0) License.
By accessing the work you hereby accept the Terms. Non-commercial uses of the work are permitted without any further permission from Dove Medical Press Limited, provided the work is properly attributed. For permission for commercial use of this work, please see paragraphs 4.2 and 5 of our Terms.
© 2023 The Author(s). This work is published and licensed by Dove Medical Press Limited. The full terms of this license are available at https://www.dovepress.com/terms.php and incorporate the Creative Commons Attribution - Non Commercial (unported, v3.0) License.
By accessing the work you hereby accept the Terms. Non-commercial uses of the work are permitted without any further permission from Dove Medical Press Limited, provided the work is properly attributed. For permission for commercial use of this work, please see paragraphs 4.2 and 5 of our Terms.