Back to Journals » International Journal of Nanomedicine » Volume 17
Folic Acid and Chitosan-Functionalized Gold Nanorods and Triangular Silver Nanoplates for the Delivery of Anticancer Agents
Authors Lee YJ, Kim YJ, Park Y ![]()
Received 19 December 2021
Accepted for publication 20 April 2022
Published 29 April 2022 Volume 2022:17 Pages 1881—1902
DOI https://doi.org/10.2147/IJN.S354866
Checked for plagiarism Yes
Review by Single anonymous peer review
Peer reviewer comments 4
Editor who approved publication: Dr Phong A Tran
You Jeong Lee, Yeon-Jeong Kim, Youmie Park
College of Pharmacy and Inje Institute of Pharmaceutical Sciences and Research, Inje University, Gimhae, Gyeongnam, 50834, Republic of Korea
Correspondence: Youmie Park, Tel +82-55-320-3884, Fax +82-55-320-3940, Email [email protected]
Background: Advances in the field of nanotechnology have shed light on the applications of nanoparticles for cancer treatment.
Methods: Folic acid and chitosan-functionalized gold nanorods (FACS-R) and triangular silver nanoplates (FACS-T) were synthesized and their properties were elucidated by UV-visible spectrophotometry, Fourier-transform infrared spectroscopy, field emission transmission electron microscopy and high-resolution X-ray diffraction.
Results: The average size of the FACS-R was determined to be a transverse length of 13.1 ± 1.8 nm and a longitudinal length of 47.2 ± 8.9 nm with an aspect ratio of 3.6. The average size of FACS-T was measured to be 31.8 ± 7.7 nm. Colloidal solutions of FACS-R and FACS-T were stable on the shelf at ambient temperature for 14 days in the dark. Anticancer agents were encapsulated in FACS-R and FACS-T. FACS-T showed a higher encapsulation efficiency with docetaxel, paclitaxel and diallyl disulfide than FACS-R. The cell viability on human gastric adenocarcinoma cells (AGS), human epithelial cervix adenocarcinoma cells (HeLa) and human colorectal adenocarcinoma cells (HT-29) after treatment with anticancer agent-encapsulated FACS-R and FACS-T was determined using the 3-(4,5-dimethylthiazol-2-yl)-2,5-diphenyltetrazolium bromide (MTT) assay. Interestingly, paclitaxel-encapsulated FACS-R and FACS-T showed the highest percentages of early and late apoptosis on HeLa cells. A cell cycle analysis demonstrated increased G2/M arrest on HeLa cells with docetaxel and paclitaxel-encapsulated FACS-R and FACS-T. The FACS-T induced more G2/M arrest on HeLa cells than the FACS-R. To assess applications in near-infrared photothermal therapy (PTT), the cell viability on HeLa cells with the anticancer agent-encapsulated FACS-R and FACS-T was assessed in the presence or absence of 808 nm laser irradiation. The results showed that 808 nm laser irradiation significantly decreased cell viability.
Conclusion: Collectively, the triangular silver nanoplates were more effective than the gold nanorods for PTT. We believe that as-prepared nanoparticles have remarkable features and will become promising future nanomedicine.
Keywords: folic acid, chitosan, triangular silver nanoplates, gold nanorods, anticancer activity, photothermal therapy, HeLa cells
Introduction
Cancer treatment is complicated due to multidrug resistance, high drug toxicity and long treatment periods. The following therapies have emerged for cancer treatment: immunotherapy, gene therapy, photodynamic therapy (PDT) and photothermal therapy (PTT).1 PDT is a nondestructive treatment for destroying cancer cells using a combination of light radiation (generally a wavelength above 600 nm) and photosensitizing molecules, which create reactive oxygen species (ROS) in the presence of oxygen.2 PTT is also a nondestructive technique that uses low energy light from the infrared region that is transferred into heat for cancer cell treatment.2 Nanoparticles can easily accumulate in cancer cells due to the enhanced permeability and retention (EPR) effect. In PTT, nanoparticles in cancer cells absorb light and transfer energy into heat and this process ultimately damages cancer cells by increasing the local temperature and denaturing essential proteins.2 PTT can induce cell death through apoptosis or necrosis and this induction is dependent on the laser intensity.1 A low laser intensity leads to mainly apoptosis, whereas a high laser intensity generally results in necrosis.
The use of nanoparticles as vehicles for anticancer agents with small molecular structures has attracted increased attention. In anticancer therapy, drugs often exhibit low stability and low solubility and nanocarriers have helped solve this issue.3 Rawal and Patel reported that the following nanocarrier technologies benefit combination oncotherapy: 1) inorganic/metallic nanoparticles, 2) prodrug-based nanocarriers, 3) micelles, 4) liposomes, 5) dendrimers, 6) polymeric nanoparticles, 7) polymersomes, 8) lipid-based nanoparticles, 9) polymer–drug conjugates, 10) polymer–lipid hybrid nanoparticles, 11) carbon nanotubes, 12) nanosponges and 13) supramolecular nanocarriers.3 The nanocarrier system provides good stability, a high surface area to volume ratio and increased permeability and retention.
Novel metal nanoparticles have been developed to diagnose and treat cancer, including Au, Ag, Pt and Pd.1 Gold nanoparticles (AuNPs) have been used for the treatment of various cancers, including liver cancer, breast cancer, colon cancer, reproductive organ cancer, skin cancer and brain cancer.4 Furthermore, AuNPs are modified and covalently linked to biomolecules such as folic acid to target cancer cells.4 Additionally, AuNPs have been applied as drug delivery vehicles for anticancer drugs such as doxorubicin (DOX), paclitaxel (PTX), platinum complexes and methotrexate.5 Among different shapes of AuNPs, gold nanorods loaded with DOX have been mostly studied for PTT and PDT applications in cancer treatment.6–8 Gold nanorods loaded with DOX showed in vivo anticancer activity on breast cancer bearing mice under the irradiation of 808 nm wavelength near infrared (NIR) with 800 mW.6 Combined gold nanorods with graphene oxide has been successfully applied for controlled release of DOX in mice7 Qi and coworkers have reported that NIR-responsive hybrid nanoparticles (core-shell gold nanorods/mesoporous silica nanoparticles capped with PEGylated graphene oxide) exhibited high drug loading efficiency and excellent photothermal conversion efficiency. Moreover, substantial pH-/NIR-dual- responsive drug release upon NIR irradiation was observed from hybrid nanoparticles.8 Silver nanoparticles (AgNPs) have demonstrated outstanding anticancer activity and antimicrobial activity and have been used as biomedical device coatings and drug delivery carriers.9 The mechanism of AgNPs for anticancer activity involves the following: 1) entering the cell, 2) damaging mitochondria, 3) reducing the cellular ATP content, 4) inducing apoptosis and 5) increasing ROS generation.10 The cytotoxicity of AgNPs has been applied to many types of cancer cells, including hepatocellular carcinoma, cervical carcinoma and breast cancer cells.9
Diallyl disulfide (DADS) and S-allylcysteine (SAC) are abundant in the Allium genus and both compounds are bioactive organosulfur compounds.11 Organosulfur compounds are related to most functional and biological activities.12 Organosulfur compounds are abundant in garlic and affect various stages of carcinogenesis in human cancer cells.13 Garlic extracts and pure compounds are effective in the prevention and therapy of cancers, such as breast cancer, gastrointestinal tract and associated cancer, gynecological cancer, hematological cancer, lung cancer, neurological cancer, sarcoma, skin cancer and urogenital cancer.13 Additionally, DADS exerts diverse pharmacological effects on the cardiovascular system, digestive system, respiratory system, urinary system, endocrine system and neurological disorders.14 Our laboratory synthesized DADS-encapsulated AuNPs and AgNPs and assessed their effect on cell viability.15 DADS-encapsulated AuNPs and AgNPs decreased the viability of human pancreatic ductal adenocarcinoma cells (PANC-1) and human colorectal adenocarcinoma cells (HT-29) compared with that found with AuNPs and AgNPs alone.
In the present study, folic acid and chitosan-functionalized gold nanorods (FACS-R) and triangular silver nanoplates (FACS-T) were synthesized and characterized by UV-visible spectrophotometry, Fourier transform infrared spectroscopy (FT-IR), field emission transmission electron microscopy (FE-TEM) and high-resolution X-ray diffraction (HR-XRD). The colloidal stability of the nanoparticles was assessed by measuring their hydrodynamic size and zeta potential. Four anticancer agents (docetaxel (DTX), PTX, DADS and SAC) were encapsulated in the FACS-R and FACS-T and the encapsulation efficiency was determined by reversed-phase high performance liquid chromatography (RP-HPLC) and liquid chromatography-mass spectrometry (LC-MS). The cell viability on human gastric adenocarcinoma cells (AGS), human epithelial cervix adenocarcinoma cells (HeLa) and HT-29 cells treated with the nanoparticles was examined using the 3-(4,5-dimethylthiazol-2-yl)-2,5-diphenyltetrazolium bromide (MTT) assay. Analyses of the nanoparticles with respect to their effects of the apoptotic population and cell cycle arrest on HeLa cells and their PTT with NIR laser irradiation were carefully performed to determine their potential applications in cancer treatment.
Materials and Methods
Materials
Gold (III) chloride trihydrate (HAuCl4·3H2O), silver nitrate, ascorbic acid, cetyltrimethylammonium bromide (CTAB), acetic acid, sodium hydroxide, sodium citrate tribasic dihydrate, folic acid, SAC, DADS, DTX, trifluoroacetic acid (TFA) and MTT reagent were purchased from Sigma-Aldrich (St. Louis, MO, USA). Chitosan (≥85% deacetylated, MW 100–300 kDa), (3-dimethylaminopropyl)-3-ethylcarbodiimide hydrochloride (EDC, 98%) and N-hydroxysuccinimide (NHS, 98%) were obtained from Alfa Aesar (Haverhill, MA, USA). Chitosan was dissolved in 1% acetic acid solution before use. PTX was purchased from TCI (Tokyo, Japan) and hydrogen peroxide was purchased from Junsei Chemical (Tokyo, Japan). Sodium tripolyphosphate (TPP) was purchased from Acros Organics. Fetal bovine serum (FBS), antibiotic-antimycotic (penicillin 10,000 units/mL, streptomycin 10,000 µg/mL, Fungizone® (amphotericin B) 25 µg/mL), trypsin-EDTA, PBS buffer and Roswell Park Memorial Institute (RPMI) 1640 medium were obtained from Gibco (Thermo Fisher Scientific, Waltham, MA, USA). The Annexin V-FITC (fluorescein isothiocyanate) apoptosis detection kit I and PI/RNase staining buffer were obtained from BD Biosciences (Franklin Lakes, NJ, USA). A Spectra/Por® dialysis membrane (MWCO 12–14 kDa) was purchased from SpectrumTM (Rancho Dominguez, CA, USA). All other reagents were of analytical grade and used as received.
Instrumental Analysis
UV-visible spectra were acquired using a Shimadzu UV-2600 system (Shimadzu Corporation, Tokyo, Japan). FE-TEM images of nanoparticles were obtained using a JEM-3010 model (Jeol Ltd., Tokyo, Japan). To obtain the FE-TEM images, the samples were loaded on a carbon-coated copper grid (carbon type-B, 300 mesh, Ted Pella Inc., Redding, CA, USA) and dried for 24 h at ambient temperature. FT-IR spectra were acquired from powdered samples using a Varian 640 IR system in the ATR mode (Agilent Technologies, Santa Clara, CA, USA). The HR-XRD pattern was analyzed using an Ultimate IV system and a CuKα laser (λ = 0.154056 nm) (Rigaku, Japan). The hydrodynamic size and zeta potential were measured using a NanoBrook 90Plus Zeta system from Brookhaven Instruments Corporation (Holtsville, NY, USA). Sonication was conducted using a WUC-A22H system (Daihan Scientific Co. Ltd., Seoul, Republic of Korea). Centrifugation was performed using a 5424R centrifuge (Eppendorf AG, Hamburg, Germany) and the freeze-drying process was conducted using an FD8518 system (IlshinBioBase Co. Ltd., Gyeonggi, Republic of Korea).
Conjugation of Folic Acid to Chitosan to Prepare FA-CS
The conjugation process was conducted via amide coupling. Folic acid was activated through NHS/EDC coupling. DMSO (10 mL) was mixed with folic acid (25 mg, 1 equiv), EDC (54 mg, 5 equiv) and NHS (64 mg, 10 equiv). The mixture was vigorously stirred for 2 h at ambient temperature with protection from light. The completion of the reaction was evaluated by thin-layer chromatography (TLC) with ammonia:propanol:ethanol (2:2:6) as the elution solvent. Once TLC indicated the disappearance of folic acid, chitosan (500 mg) was dissolved in 1% acetic acid (100 mL) and the activated folic acid was added slowly with protection from light. This mixture was vigorously stirred at ambient temperature for 24 h. The molar ratio of chitosan to activated folic acid was 20:1. After 24 h, the reaction mixture was dialyzed against deionized water for 3 days. The dialysis membrane had a molecular weight cut-off (MWCO) of 12–14 kDa. Deionized water (4 L) was changed every 6 h on the first day and once per day on the second and third days. Folic acid-conjugated chitosan (FA-CS) was then prepared, lyophilized using a freeze-dryer and stored in a desiccator before use. The loading efficiency of folic acid on chitosan was 59.6%.
Preparation of Gold Nanorods and Triangular Silver Nanoplates
Gold nanorods and triangular silver nanoplates were selected to maximize the PTT efficiency and prepared by seed-mediated synthesis and one-pot synthesis, respectively.16 The first step in seed-mediated synthesis included preparation of an amber-colored growth solution in a vial by adding HAuCl4·3H2O (10 mM, 500 μL) and CTAB (100 mM, 9.5 mL). Freshly prepared ascorbic acid (100 mM, 55 μL) was then added and the reaction mixture was stirred until the color of the solution turned colorless. AgNO3 (10 mM, 100 μL) was then added to the colorless solution. Second, to prepare the seed solution, HAuCl4·3H2O (10 mM, 250 μL) was mixed with CTAB (100 mM, 9.75 mL) in a glass vial. Ice-cold NaBH4 (10 mM, 600 μL) was added to this solution and the mixture was mixed for 2 min. The gas was then removed by opening the cap. Subsequently, the seed solution (12 μL) was mixed with the growth solution (10.155 μL) for 10 sec and the mixture was reacted for 24 h in a dry oven at 37 °C. Centrifugation (15,000 rcf, 20 °C, 20 min) was performed twice to remove unreacted CTAB in the supernatant. The pellet was pooled and redispersed in deionized water to a final concentration of 2 mM Au.
To synthesize the triangular silver nanoplates, the one-pot synthetic method was adopted as described previously with minor modifications.17,18 In a glass vial, the following solutions were added sequentially: AgNO3 (final concentration of 0.1 mM), sodium citrate (final concentration of 1.5 mM) and hydrogen peroxide (final concentration of 0.072%, v/v). Subsequently, ice-cold and freshly prepared NaBH4 (final concentration of 1 mM) was added and after 3–4 min, PVP (average MW 40,000, final concentration of 0.04%, w/v) was added by stirring at ambient temperature (900 rpm, 15 min). The total volume was adjusted to 10 mL by adding deionized water. Centrifugation (15,000 rcf, 20 °C, 20 min) was conducted to remove unreacted reagents in the supernatant. The pellet was then pooled and redispersed in deionized water to obtain a final concentration of 1 mM Ag.
Preparation of FACS-R and FACS-T by Ionic Gelation
Ionic gelation was performed for the self-assembly of FA-CS, and the gold nanorods and triangular silver nanoplates were assembled with FA-CS to produce FACS-R and FACS-T, respectively. Either the gold nanorods (final concentration of 0.5 mM) or triangular silver nanoplates (final concentration of 0.15 mM) were added to FA-CS (final concentration of 0.5 mg/mL in 1% acetic acid). Subsequently, tripolyphosphate (final concentration of 60 μg/mL) was added and the final volume was adjusted to 3 mL by the addition of deionized water. The interval between the addition of the various reagents was 30 sec. The final mixture was stirred at 900 rpm with protection from light and reacted at ambient temperature for 20 h. Subsequently, centrifugation (15,000 rcf, 20 °C, 20 min) was performed and the pellet was recovered. The pellet obtained after the gold nanorods were assembled to FA-CS was named FACS-R and the triangular silver nanoplates assembled to FA-CS were named FACS-T. Subsequently, four anticancer agents were encapsulated in the FACS-R and FACS-T using the encapsulation procedure described above. Each anticancer agent was added at a final concentration of 0.1 mM. The order of addition was as follows: FC-CS, gold nanorods or triangular silver nanoplates, anticancer agent and tripolyphosphate. Finally, eight anticancer agent-encapsulated nanoparticle samples were prepared as follows: FACS-R-DTX, FACS-T-DTX, FACS-R-PTX, FACS-T-PTX, FACS-R-DADS, FACS-T-DADS, FACS-R-SAC and FACS-T-SAC.
Assessment of the Colloidal Stability of FACS-R and FACS-T
First, the colloidal stability of the FACS-R and FACS-T was assessed based on their stability on the shelf at ambient temperature for 14 days in the dark. At each time point (days 1, 2, 5 and 14), the hydrodynamic size and zeta potential were measured. Second, the colloidal stability in five different solutions (deionized water, NaCl (0.9%), PBS (pH 7.4), RPMI medium and full medium) was evaluated. The FACS-R or FACS-T were mixed with each solution at a ratio of 1:1 and the mixture was reacted for 30 min in a dry oven at 37 °C. The hydrodynamic size and zeta potential were then measured.
Estimation of the Encapsulation Efficiency of Anticancer Agents
The eight anticancer agent-encapsulated nanoparticle samples were centrifuged (20,000 rcf, 18 °C, 3 h) and the supernatants were collected to analyze the concentration of unreacted anticancer agents by RP-HPLC. The concentrations of DTX, PTX and DADS were analyzed using the Shimadzu HPLC LC-20 series (Shimadzu Corporation, Tokyo, Japan). The stationary phase was an Aquasil C18 column (4.6 mm diameter × 150 mm length, 5 μm particle size) from Thermo Scientific (Waltham, MA, USA). The column oven temperature was maintained at 30 °C and the flow rate was 1 mL/min. The composition of the mobile phase was as follows: A:B = 50%:50% (A: 0.1% TFA in a mixture of 80% acetonitrile and 20% methanol; B: 0.1% TFA in water). Isocratic elution was conducted for 25 min and the sample injection volume was 20 μL. Agilent liquid chromatography-mass spectrometry (LC-MS) was used to analyze the concentration of SAC and the Agilent HPLC 1100 series was employed for HPLC analysis (Agilent Technologies, Santa Clara, CA, USA). The stationary phase was an Agilent Zorbax Eclipse XDB-C8 column (4.6 mm diameter × 250 mm length, 5 μm particle size) and the analysis was performed at ambient temperature. The flow rate was 0.8 mL/min and the sample injection volume was 20 μL. The composition of the mobile phase was as follows: A, 0.1% TFA in a mixture of 80% acetonitrile and 20% methanol; B, 0.1% TFA in water. Gradient elution was conducted for 30 min. From 0 to 20 min, the composition of mobile phase A was increased from 10% to 30% and from 21 to 30 min, the composition of mobile phase A was decreased from 30% to 10%. SAC was further analyzed by Agilent G2708DA MS, which was run in the positive mode. The experimental conditions of the MS analysis were as follows: spray voltage, 5000 V; drying gas flow, 12.0 mL/min; nebulizer pressure, 60 psi; and probe temperature, 350 °C.
Cell Viability Assessment on AGS, HeLa and HT-29 Cells Using the MTT Assay
The cell viability assessment was performed as described previously.19 Three cancer cell types (AGS, HeLa and HT-29) were purchased from the Korean Cell Line Bank (Seoul, Republic of Korea). The cells were seeded in RPMI 1640 medium containing 10% fetal bovine serum, 1% penicillin (100 units/mL) and streptomycin (100 units/mL) and were incubated at 37 °C with 5% CO2 while maintaining 70% confluence. For cytotoxicity assessment, the cells were seeded at a concentration of 5×10³ cells/well in a 96-well plate and incubated for 24 h. The cells were then incubated for an additional 24 h with each of the eight anticancer agent-encapsulated nanoparticle samples. Deionized water instead of the nanoparticle samples was used as a negative control. There were no significant effects on cell viability with treatment of the negative control. Thus, cell viability of the negative control was set as 100% and is not shown. MTT reagent (10 μL, 5%) was added and the mixture was incubated for an additional 3 h. The absorbance at 580 nm was measured using a multidetection microplate reader. All the experiments were conducted in triplicate.
Apoptosis on HeLa Cells Using Annexin V/PI Staining
Apoptosis assays were conducted as described previously.19 An Annexin V-FITC apoptosis detection kit I was used for the apoptosis assay (BD Biosciences, Franklin Lakes, NJ, USA). HeLa cells were seeded at a concentration of 8.0×10⁵ cells/well in RPMI 1640 medium at 37 °C with 5% CO2 and incubated for 24 h. The medium containing the lowest concentration of each nanoparticle sample based on results from the MTT assay was used for the sample treatment. Deionized water instead of the nanoparticle sample served as the control. An additional incubation was performed for 24 h. The cells were recovered after trypsin-EDTA treatment and washed with PBS buffer (pH 7.4). The cell pellet was then resuspended in 1× Annexin binding buffer (100 μL) and FITC-annexin V solution (5 μL) and PI-staining solution (1 μL) were then added. The reaction was performed at ambient temperature for 30 min in the dark. After completion of the staining reaction, binding buffer (400 μL) was added. A FACSCalibur flow cytometer was used to analyze the cells. For each sample, 10,000 gated events were selected and the fluorescence intensity was measured. The results were analyzed using CellQuest Pro Software from BD Biosciences (Franklin Lakes, NJ, USA).
Cell Cycle Analysis on HeLa Cells
Cell cycle analysis was performed as described previously using PI/RNase staining.19 HeLa cells were seeded at a density of 8.0×10⁵ cells/well and incubated for 24 h in RPMI 1640 medium at 37 °C with 5% CO2. The medium containing the lowest concentration of the nanoparticle sample based on the results from the MTT assay was used for the sample treatment. An additional 24 h incubation was conducted and the cells were recovered after trypsin-EDTA treatment and washed twice with PBS buffer (pH 7.4). The pellet was resuspended in cold ethanol (70–80%) and stored in a freezer at −20 °C for 1 h to facilitate the cell fixing process. The cells were washed with cold PBS buffer (pH 7.4) and centrifuged. The cell pellet was subsequently resuspended in PI/RNase staining buffer (500 μL) and incubated for 30 min at ambient temperature with protection from light. The cell cycle distribution was measured using a FACSCalibur flow cytometer from BD Biosciences (Franklin Lakes, NJ, USA). In each analysis, 20,000 cells were counted and the fluorescence intensity was measured. ModFit LT 4.1 software was used for data analysis (Verity Software House Inc., Topsham, ME, USA).
PTT on HeLa Cells
The nanoparticle samples were evaluated with respect to PTT applications. The following factors were considered: 1) examining the temperature change of each nanoparticle sample, 2) varying the duration (min) of laser irradiation and 3) varying the concentration of each nanoparticle sample. A PSU-FC-808-5W fiber coupled laser system was used with an 808-nm laser at a power density of 2 W/cm2 from Changchun New Industries (Changchun, China). An SDT 25 digital thermometer (Daihan Scientific Co. Ltd., Republic of Korea) was used to measure the solution temperature. An 808 nm laser at a power density of 2 W/cm2 was irradiated in the presence of the FACS-R (50 μM), FACS-T (15 μM) and deionized water for 6 min. Each concentration of FACS-R and FACS-T was based on the Au and Ag concentration, respectively. At fixed time points (0, 1, 2, 3, 4, 5 and 6 min), the temperature of each solution was measured. Deionized water was used as a control. Three different concentrations of the FACS-R (50 μM, 100 μM and 150 μM) were then irradiated using a laser, and the solution temperature was measured at each time point for 6 min as previously described. The same experiment was performed with three concentrations of the FACS-T (15 μM, 30 μM and 45 μM).
For the comparison of cell viability in the presence or absence of laser irradiation, the MTT assay was conducted on HeLa cells as described above. The final concentration of each nanoparticle sample was as follows: FACS-R-DTX (5 μM), FACS-R-PTX (5 μM), FACS-R-DADS (5 μM), FACS-R-SAC (5 μM), FACS-T-DTX (1.5 μM), FACS-T-PTX (1.5 μM), FACS-T-DADS (1.5 μM) and FACS-T-SAC (1.5 μM). After addition of each nanoparticle sample, incubation was conducted for 4 h and laser irradiation was conducted for 6 min. An additional incubation was conducted for 24 h and cell viability was evaluated using the MTT assay.
Statistical Analysis
All results were acquired from triplicate samples. Data were expressed as Mean ± SD (n = 3). Statistical analysis was performed by using Student’s two-tailed t-test and one-way ANOVA test.
Results and Discussion
UV-Visible Spectra
FA-CS had an absorbance at 300–400 nm and showed no characteristic absorbance in the range of 500–900 nm (Figures 1A and B, black line). The position of the SPR band in gold nanorods is dependent on the aspect ratio.1 Two SPR bands of gold nanorods are generally observed, corresponding to the longitudinal band in the NIR region and the transverse band at approximately 520 nm. As expected, the gold nanorods had an SPR 517 nm from the transverse band and 803 nm from the longitudinal band (Figure 1A, red line). Gold nanorods have a large size distribution, which broadens their longitudinal bands with full width at half maximum (FWHM) in the range of 100–200 nm.1 We found that the FWHM of the gold nanorods in the NIR region was approximately 100 nm (Figure 1A). Following the assembly of the gold nanorods to FA-CS, the spectrum showed major bands from FA-CS (300–400 nm) and the gold nanorods (517 nm and 789 nm) (Figure 1A, blue line). After assembly, a slight blueshift (or hypsochromic shift) was observed on the SPR of the FACS-R (803 nm → 789 nm and 520 nm → 517 nm). Based on careful examination of Figure 1A, we concluded that the FACS-R were successfully prepared.
 |
Figure 1 UV-visible spectra. (A) The red line indicates the SPR of gold nanorods and the blue line displays the SPR of FACS-R. (B) The red line indicates the SPR of triangular silver nanoplates and the blue line displays the SPR of FACS-T. The black lines indicate the absorbance of FA-CS. |
A broad SPR was observed on the triangular silver nanoplates in the range of 500–900 nm (Figure 1B, red line). A similar broad SPR of triangular silver nanoplates was observed in the range of 600–1000 nm by Aiello et al.20 The assembly of triangular silver nanoplates to FA-CS induced no significant change in SPR in the range of 500–900 nm, with a maximum absorbance at 715 nm (Figure 1B, blue line).
FT-IR Spectra
FT-IR spectra were acquired to characterize the functional groups of chitosan, folic acid, FA-CS, FACS-R and FACS-T (Figure 2). The functional groups of chitosan (dark red-colored spectrum) were observed at 3355 cm−1 (O–H stretching vibration), 2870 cm−1 (C–H stretching vibration), 1645 cm−1 (carbonyl group stretching vibration, amide I) and 1591 cm−1 (N–H bending vibration, amide II). The functional groups of folic acid (orange-colored spectrum) were then interpreted as follows: 1689 cm−1 (C=O α-carboxyl group stretching vibration), 1635 cm−1 (amide bending vibration), 1601 cm−1 (N–H bending vibration) and 1481 cm−1 (phenyl ring). The spectrum of FA-CS was acquired (yellow-colored spectrum). The disappearance of the peak at 1645 cm−1 (carbonyl group stretching vibration, amide I) after the preparation of FA-CS suggested that the amine group of chitosan was successfully used for amide coupling to produce FA-CS. Careful examination of the spectra of FACS-R (green-colored spectrum) and FACS-T (blue-colored spectrum) demonstrated that the major peaks of FA-CS were also observed with the FACS-R and FACS-T: 3356 cm−1, 2966 cm−1, 2878 cm−1, 1632 cm−1, 1553 cm−1, 1406 cm−1, 1066 cm−1, 1026 cm−1 and 898 cm−1. These results indicate no significant change in the FA-CS structure following assembly with either the gold nanorods or triangular silver nanoplates.
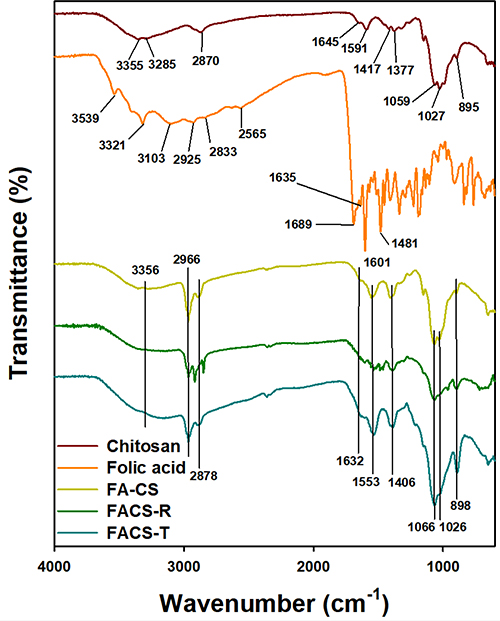 |
Figure 2 FT-IR spectra. From top to bottom, the spectra represent chitosan (dark red color), folic acid (orange color), FA-CS (yellow color), FACS-R (green color) and FACS-T (blue color). |
FE-TEM Images and HR-XRD Patterns
FE-TEM images of the gold nanorods and FACS-R are shown in Figure 3. Fifty-seven nanoparticles were selected to measure the average size of each transverse and longitudinal length (Figure 3A). Gold nanorods were synthesized with an aspect ratio of 3.6 having a transverse length of 13.1 ± 1.8 nm and a longitudinal length of 47.2 ± 8.9 nm (Figures 3B and C). After assembly with FA-CS, the rod shape was well maintained to produce the FACS-R (Figure 3D). To confirm the crystal nature of gold nanorods, HR-XRD patterns were analyzed. A face-centered cubic structures were observed with the gold nanorods (Figure 3E) and FACS-R (Figure 3F). Figure 3E shows the observed diffraction peaks of the (111), (200), (220) and (311) planes of the gold nanorods at 37.83°, 44.27°, 64.41° and 77.55°, respectively.
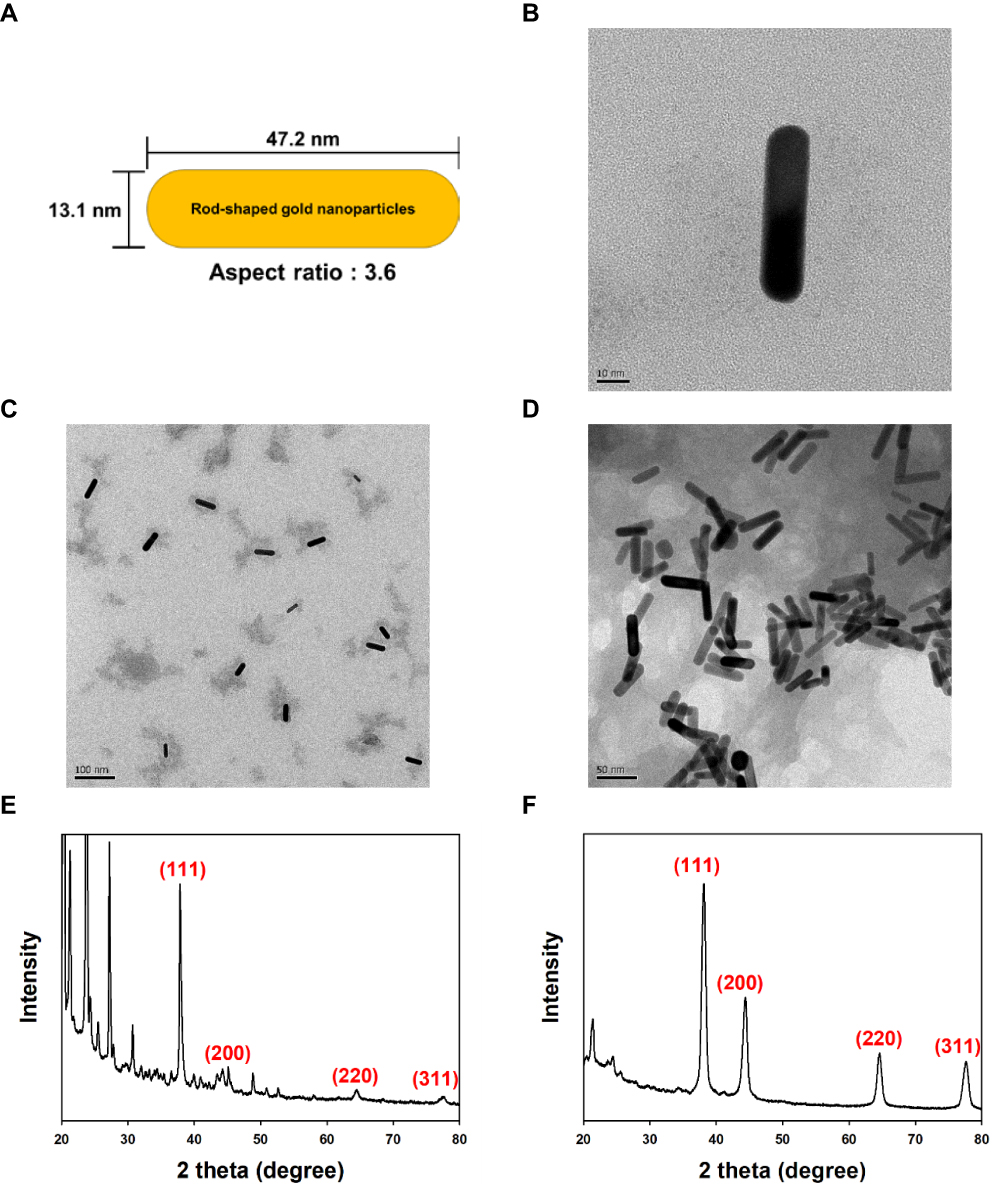 |
Figure 3 FE-TEM images and HR-XRD patterns of gold nanorods and FACS-R. (A) Schematic illustration of gold nanorods showing the aspect ratio and average size. (B) FE-TEM image of gold nanorods (scale bar: 10 nm). (C) FE-TEM image of gold nanorods (scale bar: 100 nm). (D) FE-TEM image of FACS-R (scale bar: 50 nm). (E) HR-XRD pattern of gold nanorods. (F) HR-XRD pattern of FACS-R. |
FE-TEM images of the triangular silver nanoplates are shown in Figure 4. A size histogram demonstrated that the average size from 118 selected nanoparticles was 31.8 ± 7.7 nm (Figure 4A and B). After careful observation of the triangular silver nanoplates in a red circle, a stack of nanoplates was observed with a height of approximately 10 nm (Figure 4C). This observation indicated the successful preparation of the triangular silver nanoplates. After assembly with FA-CS, the shape of the triangular nanoplates was well maintained (Figure 4D). A face-centered cubic structure was also confirmed by the HR-XRD patterns of the triangular silver nanoplates (Figure 4E) and FACS-T (Figure 4F). Four diffraction peaks were observed in the triangular silver nanoplates (Figure 4E): (111) plane at 37.83°, (200) plane at 40.44°, (220) plane at 64.23° and (311) plane at 77.21°.
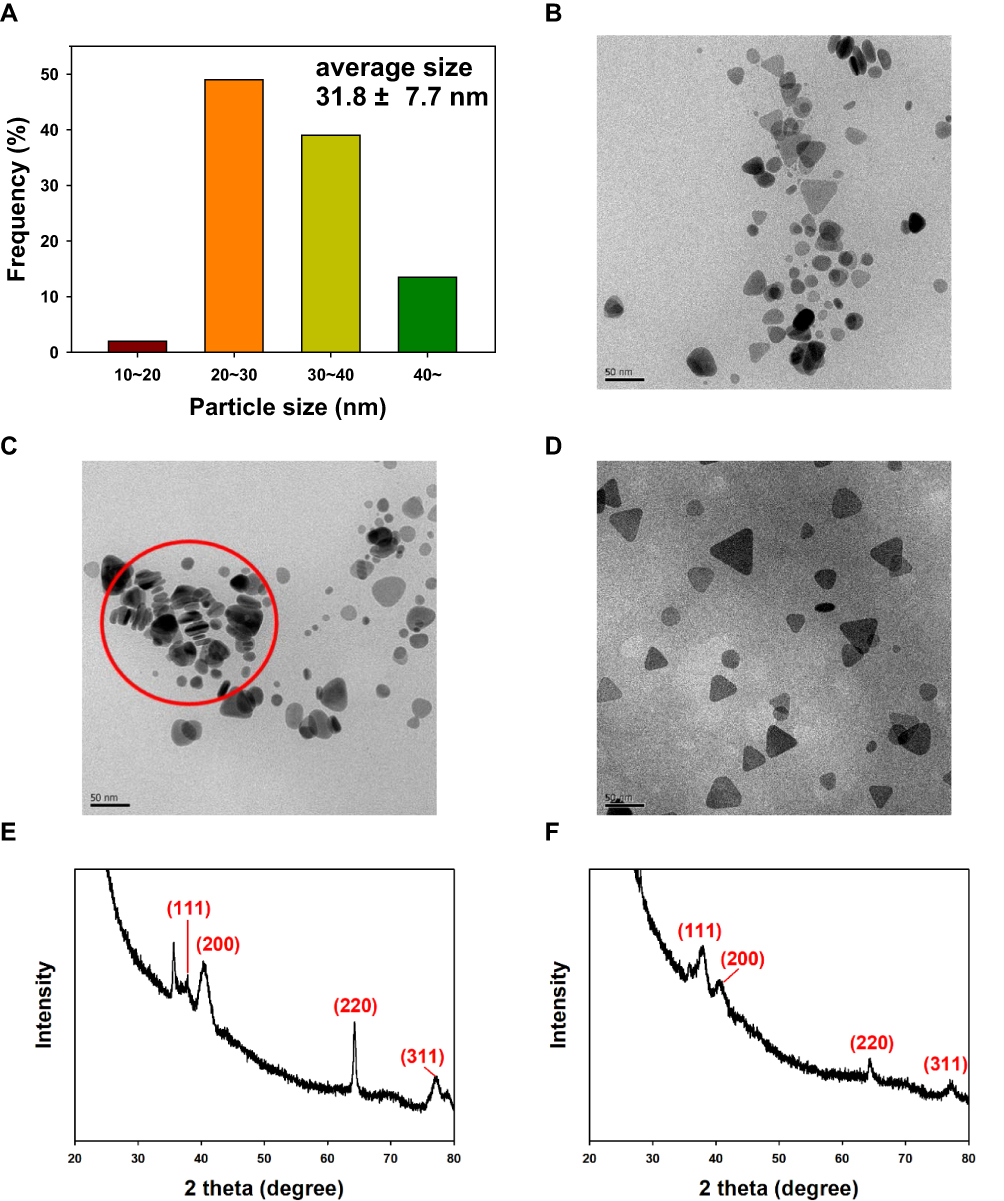 |
Figure 4 FE-TEM images and HR-XRD patterns of triangular silver nanoplates and FACS-T. (A) Size histogram. (B) FE-TEM image of triangular silver nanoplates. (C) FE-TEM image of triangular silver nanoplates. A stack of nanoplates with a height of approximately 10 nm is shown in the red circle. (D) FE-TEM image of FACS-T. (E) HR-XRD pattern of triangular silver nanoplates. (F) HR-XRD pattern of FACS-T. The scale bar in all FE-TEM images represents 50 nm. |
Hydrodynamic Size and Zeta Potential
The hydrodynamic size and zeta potential of the nanoparticles are shown in Table 1. In general, the hydrodynamic size was larger than that measured from the HR-TEM images. The hydrodynamic sizes of the FACS-R and FACS-T were 199.3 nm and 81.90 nm, respectively. The zeta potentials were all positive: 45.22 mV for the FACS-R and 38.40 mV for the FACS-T. Positive zeta potentials were attributed to cationic chitosan functionalization. Both zeta potentials were larger than 30 mV; thus, we propose that the colloidal stability of the FACS-R and FACS-T was relatively high. After the encapsulation of DTX, PTX, DADS and SAC in the FACS-R, the hydrodynamic size decreased and the zeta potential increased in the range of 44.95–55.20 mV. With PTX, no significant difference in the hydrodynamic size was found. After the encapsulation of DTX, PTX, DADS and SAC in the FACS-T, the size of the resultant nanoparticles was larger than that of FACS-T. The hydrodynamic size was positive in the range of 42.12–55.54 mV. After encapsulation of the anticancer agents in both the FACS-R and FACS-T, all the zeta potentials were larger than 40 mV. This result suggested that the resultant nanoparticles were quite stable.
 |
Table 1 Hydrodynamic Size and Zeta Potential of FACS-R, FACS-T and Nanoparticles Encapsulated with DTX, PTX, DADS and SAC |
Colloidal Stability
Colloidal stability is a critical factor for nanoparticle applications. The hydrodynamic size and zeta potential of the FACS-R and FACS-T were measured at a fixed time point (days 1, 2, 5 and 14) to observe the colloidal stability on the shelf at ambient temperature for 14 days in the dark (Table 2). Both the hydrodynamic size and zeta potential decreased slightly over time by day 14. The absolute value of the zeta potential was larger than 30 mV, which suggested that colloidal stability was maintained for 14 days. Furthermore, UV-visible spectra were acquired at fixed time points in the range of 300 to 900 nm and no significant changes were detected in the spectra (data not shown). These results suggested that the colloidal solutions of the FACS-R and FACS-T were stable on the shelf at ambient temperature for 14 days in the dark.
 |
Table 2 Colloidal Stability of FACS-R and FACS-T on the Shelf |
The colloidal stability of the FACS-R and FACS-T was then evaluated in five different solutions (deionized water, NaCl (0.9%), PBS (pH 7.4), RPMI medium and full medium) for 2 days (Table 3). A significant change was observed in the hydrodynamic size and zeta potential in full medium. The hydrodynamic size of the FACS-T showed a marked increase to 1575.5 nm (day 1) and 8112.7 nm (day 2) in full medium. We thus selected RPMI medium for the cell culture experiment because no significant change in the hydrodynamic size or zeta potential was found compared with the results obtained with the control.
 |
Table 3 Colloidal Stability of FACS-R and FACS-T in Five Different Solutions |
Encapsulation Efficiency of Anticancer Agents
The encapsulation efficiencies of DTX, PTX, DADS and SAC in the FACS-R and FACS-T were determined by RP-HPLC and LC-MS (Table 4). After encapsulation, the samples were centrifuged and the free anticancer agents in the supernatant were then collected and analyzed by RP-HPLC (data not shown). For SAC, LC-MS was performed to calculate the encapsulation efficiency. With both the FACS-R and FACS-T, DADS showed the highest encapsulation efficiency (higher than 70%), whereas the lowest encapsulation efficiency was found with SAC. Considering the shape, FACS-T exhibited a higher encapsulation efficiency for DTX, PTX and DADS than FACS-R. Specifically, PTX-encapsulated FACS-T showed the highest encapsulation efficiency at 99.7%. For the analysis of SAC, the supernatant was subjected to LC-MS. In the positive mode, a peak of protonated molecular ion [M+H]+ at m/z 162.1 along with major fragmentation at m/z 145.0 was detected (data not shown). This result corroborated a previous finding reported by Lee et al.21
 |
Table 4 Encapsulation Efficiency of Anticancer Agents in FACS-R and FACS-T |
MTT Assay on AGS, HeLa and HT-29 Cells
Four anticancer agents were encapsulated in either FACS-T or FACS-R. With these samples, the MTT assay was performed to assess cell viability on AGS, HeLa and HT-29 cells (Figures 5, 6 and 7). Collectively, the anticancer agent-encapsulated nanoparticles showed lower cell viability than the FACS-R and FACS-T. The degree of cell viability was dependent on the type of cancer cell. At 50 μM Au, FACS-R-DTX, FACS-R-PTX, FACS-R-DADS and FACS-R-SAC demonstrated low cell viability (<30%) in all three cancer cell types. Specifically, very low cell viability (5–10%) was observed with on both AGS and HeLa cells. FACS-T-DTX, FACS-T-PTX, FACS-T-DADS and FACS-T-SAC demonstrated higher cell viability than their FACS-R counterparts. At 15 μM Ag, these four encapsulated nanoparticles resulted in 45–50% cell viability with all three cancer cell types. As shown in the previous section, the encapsulation efficiency of the anticancer agents was higher in the FACS-T than in the FACS-R. However, cell viability was not directly correlated with encapsulation efficiency. In the present study, two metallic nanoparticles with different shapes were used: gold nanorods and triangular silver nanoplates. Metallic nanoparticles can induce ROS generation and mitochondrial and cytoskeletal damage, which results in cytotoxicity.22–24 Tarantola et al reported that gold nanorods induce higher ROS generation in Madin–Darby canine kidney epithelial cells than spherical-shaped AuNPs.22 Xie et al investigated the cytotoxicity and cell uptake pathway of different shapes of AuNPs (star, rod and triangular shapes) in RAW 264.7 cells.25 No significant cytotoxicity was found with any AuNPs; however, cell uptake was dependent on the shape. The highest cell uptake was observed with the triangular shape followed by the rod and star shapes. Nambara et al reported the uptake of spherical- and triangular-shaped AuNPs by RAW 264.7 and HeLa cells.26 The uptake by RAW 264.7 cells was higher than that by HeLa cells. Although cell uptake was dependent on the size of AuNPs, higher cell uptake was obtained with the triangular shape compared with the spherical shape. Furthermore, the size of the spherical shape increased and the cell uptake decreased. In contrast, for the triangular shape, the size increased and cell uptake also increased. Therefore, a future investigation regarding why higher cytotoxicity was observed with the anticancer agent-encapsulated FACS-R than with the anticancer agent-encapsulated FACS-T in the present study is warranted.
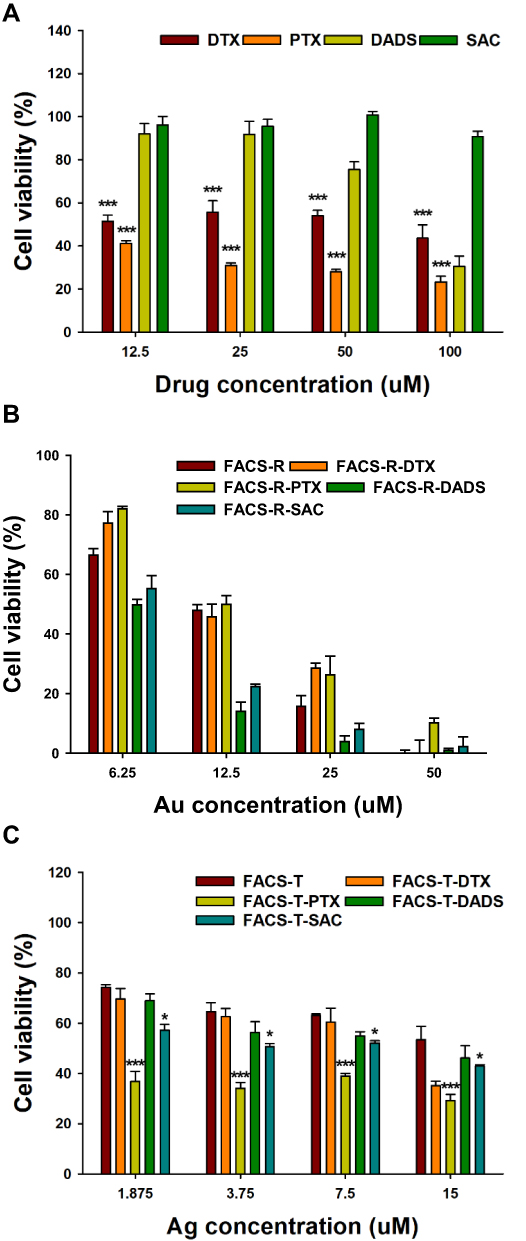 |
Figure 5 MTT assay on AGS cells. (A) Free anticancer agents (DTX, PTX, DADS and SAC). (B) FACS-R and anticancer agent-encapsulated FACS-R. (C) FACS-T and anticancer agent-encapsulated FACS-T. Significant difference between control and each nanomaterial was expressed as *p < 0.05 and ***p < 0.001, and was calculated with two-tailed Student’s t-test. Significance difference on each sample with different concentration was calculated by one-way ANOVA test (p < 0.001). |
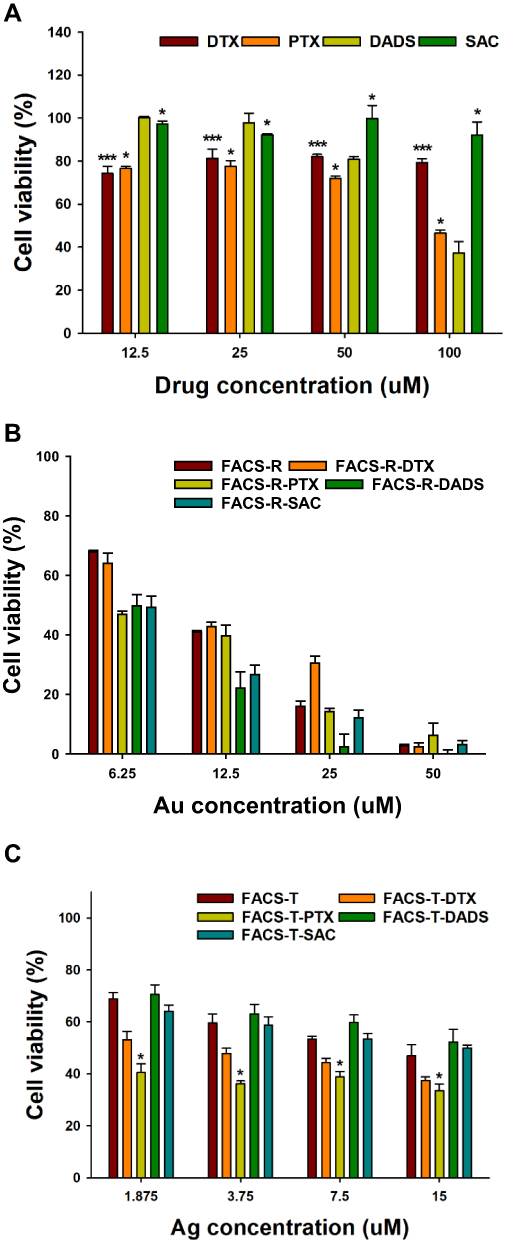 |
Figure 6 MTT assay on HeLa cells. (A) Free anticancer agents (DTX, PTX, DADS and SAC). (B) FACS-R and anticancer agent-encapsulated FACS-R. (C) FACS-T and anticancer agent-encapsulated FACS-T. Significant difference between control and each nanomaterial was expressed as *p < 0.05 and ***p < 0.001, and was calculated with two-tailed Student’s t-test. Significance difference on each sample with different concentration was calculated by one-way ANOVA test (p < 0.001). |
 |
Figure 7 MTT assay on HT-29 cells. (A) Free anticancer agents (DTX, PTX, DADS and SAC). (B) FACS-R and anticancer agent-encapsulated FACS-R. (C) FACS-T and anticancer agent-encapsulated FACS-T. Significant difference between control and each nanomaterial was expressed as ***p < 0.001 and was calculated with two-tailed Student’s t-test. Significance difference on each sample with different concentration was calculated by one-way ANOVA test (p < 0.001). |
Apoptosis Assay on HeLa Cells
HeLa cells were selected as the experimental model to investigate apoptosis, cell cycle analysis and PTT. Apoptosis assay was conducted using Annexin V-FITC apoptosis detection kit I (Figure 8). The lower-left quadrant, lower-right quadrant, upper-right quadrant and upper-left quadrant represent living, early apoptotic, late apoptotic and necrotic cells, respectively. The apoptotic populations obtained with the control (Figure 8A), PTX (Figure 8B), FACS-T (Figure 8C) and FACS-T-PTX (Figure 8D) treatments were visualized in a histogram (Figure 8E). The green, orange and dark red colors in the histogram indicate late apoptosis, early apoptosis and necrosis, respectively. The total percentages of early and late apoptotic cells found with the control, PTX, FACS-T and FACS-T-PTX treatments were 1.94%, 7.49%, 2.99% and 10.23%, respectively. The FACS-T-PTX induced higher cell apoptosis than the control, PTX and FACS-T. Similar results were found for FACS-R and FACS-R-PTX. Therefore, PTX encapsulation in either FACS-R or FACS-T reinforced the apoptosis on HeLa cells. However, no significant increase in early and late apoptosis was observed after the encapsulation of DTX, DADS and SAC.
 |
Figure 8 Measurement of the apoptotic population (%) on HeLa cells. The lower-left quadrant, lower-right quadrant, upper-right quadrant and upper-left quadrant represent living, early apoptotic, late apoptotic and necrotic cells, respectively. (A) Control. (B) PTX. (C) FACS-T. (D) FACS-T-PTX. (E) Histogram of the apoptotic rate (%). In the histogram, the green, orange and dark-red colors represent late apoptosis, early apoptosis and necrosis, respectively. |
Cell Cycle Analysis on HeLa Cells
Cell cycle analysis was performed to investigate the effects of the nanoparticles on cell cycle progression. The anticancer drugs DTX and PTX affect G2/M arrest in the cell cycle. Wu et al reported that diallyl sulfide induced G0/G1 arrest in HeLa cells.27 The results from the cell cycle analysis of the control, PTX, FACS-T and FACS-T-PTX are shown in Figure 9A–D. Each color indicates the following phases: red (G1 phase), green (S phase), blue (G2/M phase) and sky blue (sub G1, apoptosis). Furthermore, the histogram of the percentages of cells at each phase is displayed in Figure 9E: dark red represents the G0/G1 phase, orange represents the S phase and green represents the G2/M phase. In the control group, the percentages of cells at the G0/G1 and G2/M phases were 73.37% and 4.72%, respectively. The cell cycle analysis revealed that PTX alone increased the population of cells at the G2/M phase to 35.24%, which represented a 7.5-fold increase compared with the control level (Figure 9B). An 8.7-fold increase in the percentage of cells at the G2/M phase (40.83%) was also observed with DTX alone (Figure 9E). Therefore, PTX and DTX induced G2/M arrest due to their anticancer activity. Following the encapsulation of PTX, we observed G2/M arrest with the FACS-T-PTX treatment (Figure 9D). Careful examination of the histogram presented in Figure 9E revealed that the encapsulation of DTX and PTX mediated G2/M arrest: FACS-R-DTX (22.4%), FACS-T-DTX (32.56%), FACS-R-PTX (23.11%) and FACS-T-PTX (38.67%). The triangular silver nanoplates induced increased G2/M arrest compared with the gold nanorods after DTX and PTX encapsulation.
 |
Figure 9 Cell cycle analysis on HeLa cells. (A) Control. (B) PTX. (C) FACS-T. (D) FACS-T-PTX. (E) Histogram of the percentage (%) of cells at each phase. In the histogram, the green, orange and dark-red colors represent the G2/M, S and G0/G1 phases, respectively. |
Additionally, DADS and SAC mediated an increase in the percentage of cells at the G0/G1 phase and a decrease in the percentage of cells at the S and G2/M phases compared with the control level (Figure 9E). With DADS and SAC, the percentages of cells at the G0/G1 phase were 84.26% and 85.29%, respectively. The following nanoparticles obtained after the encapsulation of DADS and SAC induced a clear increase in the percentage of cells at the G0/G1 phase compared with the control level (73.37%): FACS-R-DADS (89.68%), FACS-T-DADS (85.17%), FACS-R-SAC (90.03%) and FACS-T-SAC (85.26%) (Figure 9E). Regarding DADS and SAC, the gold nanorods induced slightly increased G0/G1 arrest compared with the triangular silver nanoplates. The FACS-R and FACS-T also mediated G0/G1 arrest and decreased the accumulation of cells at the S and G2/M phases compared with the control level (Figure 9E). Chitosan nanoparticles induce G0/G1 arrest, as reported by other researchers.28,29 The G0/G1 arrest induced by the FACS-R and FACS-T on HeLa cells can be explained by the formation of chitosan nanoparticles. Mariadoss et al synthesized phloretin-encapsulated chitosan nanoparticles in which phloretin was a hydrophobic phytochemical used as a stable anticancer agent.28 Phloretin-encapsulated chitosan nanoparticles induce effective G0/G1 arrest on human oral cancer cells. Furthermore, Tan et al synthesized phytic acid-chitosan-iron oxide nanoparticles.29 Phytic acid-chitosan-iron oxide triggered apoptosis and G0/G1 arrest on HT-29 cells.
PTT on HeLa Cells
Engineering the shape and size of nanoparticles is critical for their accumulation in cancer cells. Gold nanorods are one of most studied AuNPs for PTT applications. The benefits of gold nanorods include improvements in purity and yield by adjusting the size and aspect ratio during the synthesis, which leads to many successful cases of PTT with gold nanorods.1,6–8 In PTT, nanoparticles accumulate in cancer cells due to the EPR effect. Based on the EPR effect, nanoparticles can effectively enter cancer cells through abnormal cancer blood vessels and prolong the retention of nanoparticles in cancer cells due to the impaired lymphatic system.1 Additionally, the surface chemistry of nanoparticles, such as targeting ligands, helps enhance their accumulation in cancer cells. The targeting ligands include folic acid, hyaluronic acid-based derivatives and RGD peptides. Thus, we selected folic acid as the targeting ligand. The efficiency of PTT is associated with the shape, size and composition of the nanoparticles. Therefore, along with gold nanorods, triangular silver nanoplates were synthesized and selected for PTT. Aiello et al performed PTT with silver nanoplates on HeLa cells and their results motivated us to conduct PTT with triangular silver nanoplates.20 Song et al prepared a hybrid reduced graphene oxide (rGO)-loaded ultrasmall gold nanorod vesicle to deliver DOX.30 Under NIR laser irradiation (808 nm), approximately 30% of DOX was released from the vesicle at pH 7.4, whereas more DOX (more than 80%) was released at pH 5.0. Without laser irradiation, little to no DOX was released from the vesicle.
When the irradiation light is the same as SPR band of the nanoparticles, the absorption is substantially improved. Thus, as shown in Figure 1A and B, both the FACS-R and FACS-T had high SPR at approximately 800 nm; thus, 808 nm laser irradiation was chosen for PTT. The relationships between temperature and time during laser irradiation were investigated and the results are shown in Figure 10. The changes in the temperature of the FACS-R (50 μM), FACS-T (15 μM) and deionized water during laser irradiation are shown in Figure 10A. Although the FACS-T concentration (15 μM) was markedly lower than that of the FACS-R (50 μM), the temperature increase of the FACS-T was higher than that of the FACS-R. This result suggested that the FACS-T was more effective than the FACS-R for the conversion of light energy to heat. Subsequently, the temperature changes with three different concentrations (50, 100 and 150 μM) of FACS-R during laser irradiation were determined (Figure 10B). As expected, a higher concentration of FACS-R showed a greater temperature increase. The same observation was found with three different concentrations (15, 30 and 45 μM) of FACS-T (Figure 10C). Both the FACS-R and FACS-T showed dose-dependent temperature increases in response to 808 nm laser irradiation. Based on these observations, the FACS-R and FACS-T are effective for PTT in which light energy is successfully transferred to heat by 808 nm laser irradiation.
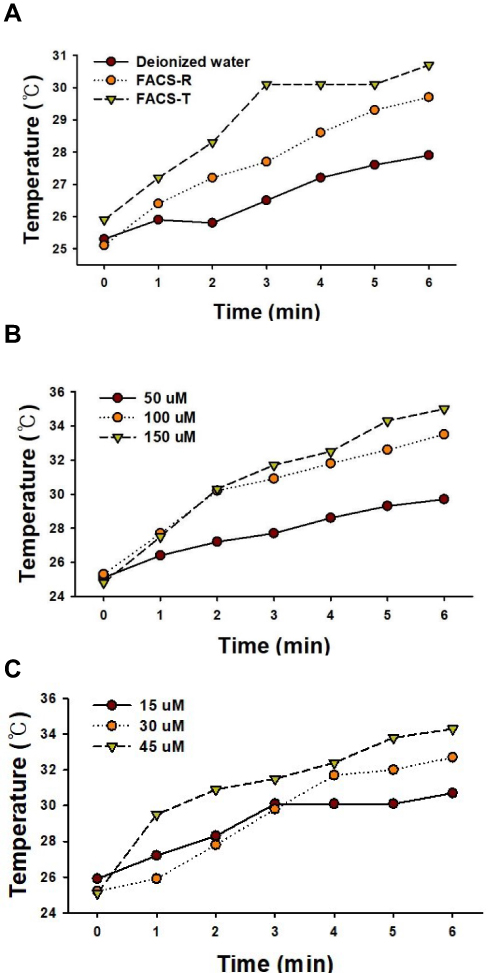 |
Figure 10 Relationship between temperature (°C) and time (min) during laser irradiation (808 nm laser at a power density of 2 W/cm2 for 6 min). The fixed time points for the measurements were 0, 1, 2, 3, 4, 5 and 6 min. (A) Changes in the temperature (°C) of FACS-R (50 μM), FACS-T (15 μM) and deionized water (as a control) at the fixed time points during laser irradiation. The dark-red circles, orange circles and green inverted triangles represent deionized water, FACS-R and FACS-T, respectively. (B) Change in the temperature (°C) observed with three different concentrations (50, 100 and 150 μM) of FACS-R at fixed time points during laser irradiation. The dark-red circles, orange circles and green inverted triangles represent 50, 100 and 150 μM FACS-R, respectively. (C) Changes in the temperature (°C) obtained with three different concentrations (15, 30 and 45 μM) of FACS-T at fixed time points during laser irradiation. The dark-red circles, orange circles and green inverted triangles represent 15, 30 and 45 μM FACS-T, respectively. |
Subsequently, the cell viability on HeLa cells was assessed in the presence or absence of 808 nm laser irradiation (Figure 11). To determine the concentration of each nanoparticle for PTT, we selected a concentration that results in cell viability greater than 80% in the absence of laser irradiation. Therefore, the final concentration of both the FACS-R and anticancer agent-encapsulated FACS-R was 5 μM and the final concentration of both the FACS-T and anticancer agent-encapsulated FACS-T was 1.5 μM. With laser irradiation, all the samples except the control showed a decrease in cell viability. The FACS-R and anticancer agent-encapsulated FACS-R showed an average decrease in cell viability of 35% in the presence of laser irradiation. Additionally, the FACS-T and anticancer agent-encapsulated FACS-T induced an average decrease in cell viability of 47% with laser irradiation. Based on the results presented in Figures 10 and 11, triangular silver nanoplates are more effective for PTT than gold nanorods. Recently, Shakeri-Zadeh and coworkers have reported that the need of AuNPs dose along with laser power threshold was reduced by the use of the pulsed laser instead of the continuous laser.31 Therefore, it is worthwhile to attempt the use of pulsed laser in our future work.
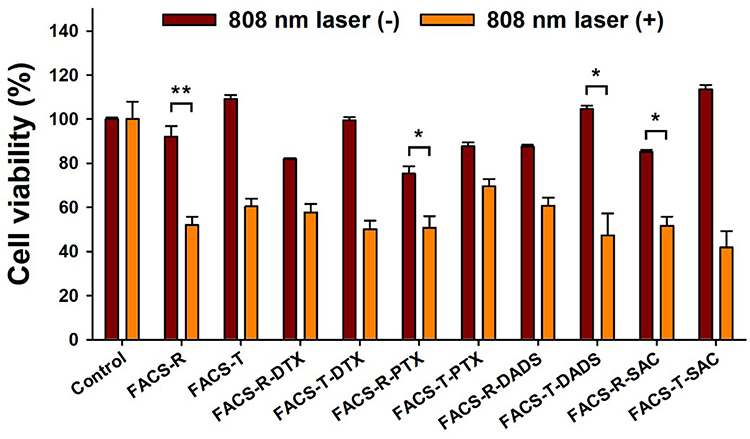 |
Figure 11 Cell viability on HeLa cells in the presence or absence of laser irradiation (808 nm laser at a power density of 2 W/cm2 for 6 min). The dark red-colored bars indicate the absence of laser irradiation and the orange-colored bars represent the presence of laser irradiation. Significant difference compared to laser on/off was indicated by *p < 0.05 and **p < 0.01, and was calculated with paired t-test. |
Conclusions
We introduced the synthesis of folic acid and chitosan-functionalized gold nanorods (FACS-R) and triangular silver nanoplates (FACS-T) to deliver DTX, PTX, DADS and SAC. These nanoparticles were characterized by spectroscopic and microscopic techniques. Colloidal solutions of both the FACS-R and FACS-T were stable on the shelf for 14 days at ambient temperature in the dark. The highest encapsulation efficiency was obtained for PTX in FACS-T (99.7 ± 0.3%). Furthermore, PTX-encapsulated FACS-R and FACS-T induced the highest apoptosis and G2/M arrest on HeLa cells. More interestingly, the DTX- and PTX-encapsulated FACS-T induced increased G2/M arrest than the corresponding FACS-R. The cell viability on HeLa cells was significantly decreased in the presence of 808 nm laser irradiation. An increase in temperature that was dependent on the duration of laser irradiation and the nanoparticle concentration was observed. Additionally, triangular silver nanoplates were more effective for photothermal heating than gold nanorods. Therefore, based on our results, triangular silver nanoplates as well as gold nanorods can be a good candidate for PTT applications.
Abbreviations
AgNPs, silver nanoparticles; AuNPs, gold nanoparticles; CS, chitosan; DADS, diallyl disulfide; DTX, docetaxel; FA, folic acid; FA-CS, folic acid-conjugated chitosan; FACS-R, gold nanorods assembled to FA-CS; FACS-R-DADS, FACS-R encapsulated with diallyl disulfide; FACS-R-DTX, FACS-R encapsulated with docetaxel; FACS-R-PTX, FACS-R encapsulated with paclitaxel; FACS-R-SAC, FACS-R encapsulated with S-allylcysteine; FACS-T, triangular silver nanoplates assembled to FA-CS; FACS-T-DADS, FACS-T encapsulated with diallyl disulfide; FACS-T-DTX, FACS-T encapsulated with docetaxel; FACS-T-PTX, FACS-T encapsulated with paclitaxel; FACS-T-SAC, FACS-T encapsulated with S-allylcysteine; MTT, 3-(4,5-dimethylthiazol-2-yl)-2,5-diphenyltetrazolium bromide; NIR, near-infrared; PTT, photothermal therapy; PTX, paclitaxel; SAC, S-allylcysteine.
Funding
This work was supported by the National Research Foundation of Korea (NRF) through a grant funded by the Korean Government by the Ministry of Education (NRF-2018R1D1A1B07041709).
Disclosure
The authors declare no conflicts of interest in this work.
References
1. Liu Y, Bhattarai P, Dai Z, Chen X. Photothermal therapy and photoacoustic imaging via nanotheranostics in fighting cancer. Chem Soc Rev. 2019;48:2053–2108. doi:10.1039/C8CS00618K
2. Błaszkiewicz P, Kotkowiak M. Gold based nanoparticles systems in phototherapy - current strategies. Curr Med Chem. 2018;25:5914–5929. doi:10.2174/0929867325666181031120757
3. Rawal S, Patel MM. Threatening cancer with nanoparticle aided combination oncotherapy. J Controll Release. 2019;301:76–109. doi:10.1016/j.jconrel.2019.03.015
4. Jindal M, Nagpal M, Singh M, Aggarwal G, Dhingra GA. Gold nanoparticles boon in cancer theranostics. Curr Pharm Des. 2020;26:5134–5151. doi:10.2174/1381612826666200701151403
5. Mioc A, Mioc M, Ghiulai R, et al. Gold nanoparticles as targeted delivery systems and theranostic agents in cancer therapy. Curr Med Chem. 2019;26:6493–6513. doi:10.2174/0929867326666190506123721
6. Liang Y, Gao W, Peng X, et al. Near infrared light responsive hybrid nanoparticles for synergistic therapy. Biomaterials. 2016;100:76–90. doi:10.1016/j.biomaterials.2016.05.023
7. Khan MS, Pandey S, Bhaisare ML, Gedda G, Talib A, Wu H-F. Graphene oxide@gold nanorods for chemo-photothermal treatment and controlled release of doxorubicin in mice Tumor. Colloids Surf B Biointerfaces. 2017;160:543–552. doi:10.1016/j.colsurfb.2017.09.001
8. Qi Z, Shi J, Zhang Z, Cao Y, Li J, Cao S. PEGylated graphene oxide-capped gold nanorods/silica nanoparticles as multifunctional drug delivery platform with enhanced near-infrared responsiveness. Mater Sci Eng C Mater Biol Appl. 2019;104:109889. doi:10.1016/j.msec.2019.109889
9. Lee SH, Jun B-H. Silver nanoparticles: synthesis and application for nanomedicine. Int J Mol Sci. 2019;20:865–888. doi:10.3390/ijms20040865
10. Wadhawan A, Chatterjee M, Singh G. Present scenario of bioconjugates in cancer therapy: a review. Int J Mol Sci. 2019;20:5243–5265. doi:10.3390/ijms20215243
11. Nicastro HL, Ross SA, Milner JA. Garlic and onions: their cancer prevention properties. Cancer Prev Res. 2015;8:181–189. doi:10.1158/1940-6207.CAPR-14-0172
12. Petropoulos S, Gioia FD, Ntatsi G. Vegetable organosulfur compounds and their health promoting effects. Curr Pharm Des. 2017;23:2850–2875. doi:10.2174/1381612823666170111100531
13. Greef DD, Barton EM, Sandberg EN, et al. Anticancer potential of garlic and its bioactive constituents: a systematic and comprehensive review. Semin Cancer Biol. 2021;73:219–264. doi:10.1016/j.semcancer.2020.11.020
14. He H, Ma Y, Huang H, et al. A comprehensive understanding about the pharmacological effect of diallyl disulfide other than its anti-carcinogenic activities. Eur J Pharmacol. 2021;893:173803. doi:10.1016/j.ejphar.2020.173803
15. Lee YJ, Cha S-H, Kim H, Choi SE, Cho S, Park Y. Diallyl disulphide-loaded spherical gold nanoparticles and acorn-like silver nanoparticles synthesised using onion extract: catalytic activity and cytotoxicity. Artif Cells Nanomed Biotechnol. 2020;48:948–960. doi:10.1080/21691401.2020.1773485
16. Rayavarapu RG, Ungureanu C, Krystek P, Leeuwen TGV, Manohar S. Iodide impurities in hexadecyltrimethylammonium bromide (CTAB) products: lot−lot variations and influence on gold nanorod synthesis. Langmuir. 2010;26:5050–5055. doi:10.1021/la100166f
17. Métraux GS, Mirkin CA. Rapid thermal synthesis of silver nanoprisms with chemically tailorable thickness. Adv Mater. 2005;17:412–415. doi:10.1002/adma.200401086
18. Zhang Q, Li N, Goebl J, Lu Z, Yin Y. A systematic study of the synthesis of silver nanoplates: is citrate a “magic” reagent? J Am Chem Soc. 2011;133:18931–18939. doi:10.1021/ja2080345
19. Ahn E-Y, Park Y. Anticancer prospects of silver nanoparticles green-synthesized by plant extracts. Mater Sci Eng C. 2020;116:111253. doi:10.1016/j.msec.2020.111253
20. Aiello MBR, Azcárate JC, Zelaya E, et al. Photothermal therapy with silver nanoplates in HeLa cells studied by in situ fluorescence microscopy. Biomater Sci. 2021;9:2608–2619. doi:10.1039/D0BM01952F
21. Lee S, Chang NI, Yoo M, Choi JH, Shin D. Development and validation of S-Allyl-L-Cysteine in rat plasma using a mixed-mode reversed-phase and cation-exchange LC–ESI–MS/MS method: application to pharmacokinetic studies. J Chromatogr Sci. 2015;53:54–59. doi:10.1093/chromsci/bmu013
22. Tarantola M, Pietuch A, Schneider D, et al. Toxicity of gold-nanoparticles: synergistic effects of shape and surface functionalization on micromotility of epithelial cells. Nanotoxicology. 2011;5:254–268. doi:10.3109/17435390.2010.528847
23. Yang L, Zhou Z, Song J, Chen X. Anisotropic nanomaterials for shape-dependent physicochemical and biomedical applications. Chem Soc Rev. 2019;48:5140–5176. doi:10.1039/C9CS00011A
24. Sun H, Jia J, Jiang C, Zhai S. Gold nanoparticle-induced cell death and potential applications in nanomedicine. Int J Mol Sci. 2018;19:754–773. doi:10.3390/ijms19030754
25. Xie X, Liao J, Shao X, Li Q, Lin Y. The effect of shape on cellular uptake of gold nanoparticles in the forms of stars, rods, and triangles. Sci Rep. 2017;7:3827. doi:10.1038/s41598-017-04229-z
26. Nambara K, Niikura K, Mitomo H, et al. Reverse size dependences of the cellular uptake of triangular and spherical gold nanoparticles. Langmuir. 2016;32:12559–12567. doi:10.1021/acs.langmuir.6b02064
27. Wu -P-P, Chung H-W, Liu K-C, et al. Diallyl sulfide induces cell cycle arrest and apoptosis in HeLa human cervical cancer cells through the p53, caspase- and mitochondria-dependent pathways. Int J Oncol. 2011;38:1605–1613. doi:10.3892/ijo.2011.973
28. Mariadoss AVA, Vinayagam R, Senthilkumar V, et al. Phloretin loaded chitosan nanoparticles augments the pH-dependent mitochondrial-mediated intrinsic apoptosis in human oral cancer cells. Int J Biol Macromol. 2019;130:997–1008. doi:10.1016/j.ijbiomac.2019.03.031
29. Tan BL, Norhaizan ME, Chan LC. An intrinsic mitochondrial pathway is required for phytic acid-chitosan-iron oxide nanocomposite (Phy-CS-MNP) to induce G0/G1 cell cycle arrest and apoptosis in the human colorectal cancer (HT-29) cell line. Pharmaceutics. 2018;10:198–214. doi:10.3390/pharmaceutics10040198
30. Song J, Yang X, Jacobson O, et al. Sequential drug release and enhanced photothermal and photoacoustic effect of hybrid reduced graphene oxide-loaded ultrasmall gold nanorod vesicles for cancer therapy. ACS Nano. 2015;9:9199–9209. doi:10.1021/acsnano.5b03804
31. Shakeri-Zadeh A, Zareyi H, Sheervalilou R, Laurent S, Ghaznavi H, Samadian H. Gold nanoparticle-mediated bubbles in cancer nanotechnology. J Control Release. 2021;330:49–60. doi:10.1016/j.jconrel.2020.12.022
 © 2022 The Author(s). This work is published and licensed by Dove Medical Press Limited. The
full terms of this license are available at https://www.dovepress.com/terms
and incorporate the Creative Commons Attribution
- Non Commercial (unported, 3.0) License.
By accessing the work you hereby accept the Terms. Non-commercial uses of the work are permitted
without any further permission from Dove Medical Press Limited, provided the work is properly
attributed. For permission for commercial use of this work, please see paragraphs 4.2 and 5 of our Terms.
© 2022 The Author(s). This work is published and licensed by Dove Medical Press Limited. The
full terms of this license are available at https://www.dovepress.com/terms
and incorporate the Creative Commons Attribution
- Non Commercial (unported, 3.0) License.
By accessing the work you hereby accept the Terms. Non-commercial uses of the work are permitted
without any further permission from Dove Medical Press Limited, provided the work is properly
attributed. For permission for commercial use of this work, please see paragraphs 4.2 and 5 of our Terms.