Back to Journals » International Journal of Nanomedicine » Volume 12
Folate-modified Annonaceous acetogenins nanosuspensions and their improved antitumor efficacy
Authors Hong JY, Sun ZH, Li YJ, Guo YF, Liao YH ![]() , Liu MF, Wang XT
, Liu MF, Wang XT
Received 17 February 2017
Accepted for publication 14 June 2017
Published 14 July 2017 Volume 2017:12 Pages 5053—5067
DOI https://doi.org/10.2147/IJN.S134284
Checked for plagiarism Yes
Review by Single anonymous peer review
Peer reviewer comments 5
Editor who approved publication: Professor Lei Yang
Jingyi Hong,1 Zhonghao Sun,1 Yijing Li,1 Yifei Guo,1 Yonghong Liao,1 Meifeng Liu,2 Xiangtao Wang1
1Key Laboratory of Bioactive Substances and Resources Utilization of Chinese Herbal Medicine, Institute of Medicinal Plant Development, Chinese Academy of Medical Sciences & Peking Union Medical College, Beijing, 2Key Laboratory of Functional Molecular Engineering of Guangdong Province, School of Chemistry and Chemical Engineering, South China University of Technology, Guangzhou, China
Abstract: Annonaceous acetogenins (ACGs) are a large family of fatty acid derived natural products that are exclusively isolated from the Annonaceae species. Many members of this diverse family have a broad spectrum of biological activities, the most impressive of which is anticancer activity. However, their poor solubility and severe toxicity restrict their clinical application, and their complicated composition hinders their formulation and drug delivery. In this study, β-cyclodextrin was modified with folic acid (FA) and then combined with soybean lecithin to prepare FA-modified ACGs nanosuspensions (FA-ACGs-NSps). The obtained FA-ACGs-NSps had a high drug payload of 57.59% and average particle size of 199.5 nm, and they exhibited sustained drug release within 142 hours. In comparison with ACGs-NSps, FA-ACGs-NSps showed significantly enhanced cytotoxicity and higher cell uptake toward folate receptor-positive 4T1 cell lines. An in vivo study demonstrated that FA-ACGs-NSps more effectively accumulated in tumors and enhanced the antitumor therapeutic efficacy with less toxicity in 4T1 tumor bearing mice. Therefore, FA-ACGs-NSps may be a promising drug delivery system for ACGs to improve their therapeutic window and may be suitable for clinical application to treat folate-positive tumors.
Keywords: Annonaceous acetogenins, nanosuspensions, folate, targeted drug delivery, antitumor activity
Introduction
Annonaceous acetogenins (ACGs) are an active fraction isolated from the extract of seeds of Annonaceae species.1 ACGs are a group of compounds composed of a long aliphatic chain bearing an α, β-unsaturated γ-lactone ring, which is crucial for activity, and 0–3 tetrahydrofuran (THF) ring(s).2 According to their relative stereostructures across the THF rings, ACGs are classified into mono-THF, adjacent bis-THF, nonadjacent bis-THF, non-THF ring, tri-THF, and nonclassical acetogenins.3,4 The bis-adjacent-THF acetogenins are the most potent among this family. Moreover, a series of acetogenin mimetics has also been successfully developed by using both random and systematic syntheses, and some of the non-THF analogs showed remarkable cytotoxicity against tumor cell lines and good selectivity between human tumor cells and normal cells.5–7
Several studies have reported significant antiproliferative effects of different compounds isolated from ACGs toward various cancer cell lines.1,4,8–10 For example, cytotoxic effects comparable to fluorouracil were obtained for annosquacin-I, annosquatin-I, uvarigrandin A, and bullatacin against A549, MCF-7, HeLa, HepG2, SMMC-7721, and MKN-45 cell lines.11 Anticancer studies on ACGs were not only limited to in vitro but also in vivo investigation. Bullatacin, the major component in ACGs, is effective at only 50 μg/kg, and is >300 times more potent than paclitaxel (PTX) against L1210.12 Biologically, ACGs exhibit their potent bioactivities through depletion of adenosine triphosphate (ATP) levels by inhibiting complex I of mitochondria and inhibiting the NADH oxidase of plasma membranes of tumor cells.13 Due to their potent ability to block ATP production, ACGs can also selectively inhibit the growth of multiple drug resistance tumor cells in vitro.14–16
ACGs are readily soluble in most organic solvents but are almost insoluble in water (<1 μg/mL). The severe toxicity of ACGs has largely limited their clinical application.4,17 Multicomponent complicated compositions hindered their formulation and drug delivery study. For a long time, ACGs could only be administered orally using an oil solution or intraperitoneally injected via an ethanol or dimethyl sulfoxide (DMSO) solution.17–19
In our previous study, ACGs nanosuspensions (ACGs-NSps) were successfully prepared using hydroxypropyl-beta-cyclodextrin (HP-β-CD) and soybean lecithin (SPC) in combination as stabilizers, and ACGs-NSps showed higher in vitro cytotoxicity and significantly improved antitumor efficacy than free ACGs.20 However, preparation of NSps alone is far from meeting the demand of ACGs to become an effective antitumor drug in clinical applications. The potent antitumor activity of ACGs also results in strong toxicity with a narrow therapeutic window when in vivo administered. Thus, further targeted modification of such ACGs-NSps is necessary to reduce the potential toxicity to normal cells.
Among the various ligands and monoclonal antibodies targeting tumors,21 folic acid (FA) has been extensively used as a targeting moiety because a variety of tumor cells express a high level of folate receptors (FRs) while the level of FRs is limited in most normal tissues.22–24 FA and FA conjugates have a high affinity for FRs and can be transported into the targeting cell through receptor-mediated endocytosis.25 Thus, FA-modified drug delivery systems can effectively transfer therapeutic agents to tumor cells that highly express FRs. Moreover, FA exhibits some unique characteristics, such as low molecular weight, low cost, and non-immunogenic nature.26–28
This study aimed to increase the tumor targeting ability of ACGs-NSps and further enhance their therapeutic efficacy against tumors. To achieve this goal, FA-modified β-CD (FA-β-CD) was synthesized and then was used together with SPC to prepare FA-mediated active targeting ACGs-NSps (FA-ACGs-NSps). The in vitro characterization, cytotoxicity, cellular uptake, and in vivo biodistribution together with the antitumor efficacy were evaluated. In addition, the body weight, spleen index, and common serum biochemical levels were also assessed to evaluate the in vivo toxicity.
Material and methods
Materials
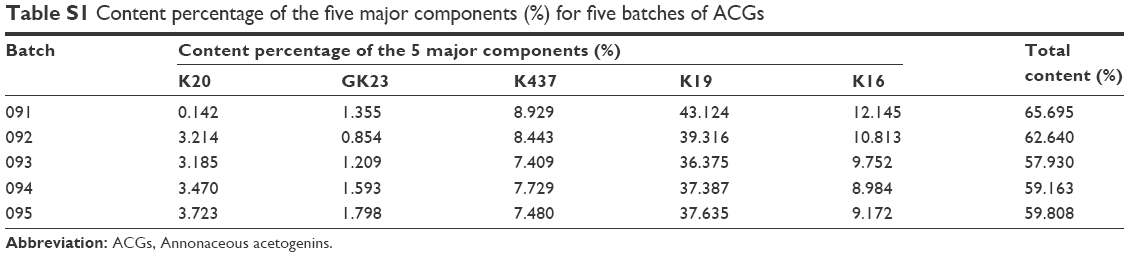
ACGs were prepared in Huang’s laboratory (Institute of Medicinal Plant Development [IMPLAD], Beijing, China) and the composition is shown in Table S1 (batch number 091). Mono-(6-ethanediamine-6-deoxy)-beta-CD (NH2-β-CD) was purchased from Zhiyuan Biotechnology Co Ltd, Shandong, China. FA was obtained from Sinopharm Chemical Reagent Beijing Co, Ltd (Beijing, China). Dicyclohexylcarbodiimide (DCC) and 1-hydroxy-2,5-pyrrolidinedione (NHS) were purchased from Sinopharm Chemical Reagent Beijing Co, Ltd. SPC was obtained from Guangzhou Hanfang Pharmaceutical Co Ltd (Guangdong, China). The Float-A-Lyzer® G2 dialysis cassette was obtained from Spectrum Labs (Rancho Dominguez, CA, USA). The microplate test kit was purchased from Nanjing JianCheng Bioengineering Institute (Nanjing, China). Cy5.5 (a fluorescent probe) and 1,1′-dioctadecyltetramethyl indotricarbocyanine iodide (DiR) were obtained from AAT Bioquest Inc. (Sunnyvale, CA, USA). PTX injections were supplied by Beijing Union Pharm Ltd (Beijing, China). All other reagents were of analytical grade or higher.
Animals and cell lines
Female Balb/c nude mice (6–8 weeks old, 20±2 g) were purchased from the Vital River Laboratory Animal Technology Co, Ltd, Beijing, China. All animal experiments complied with the principles of the Ethical and Regulatory Guidelines for Animal Experiments as defined by IMPLAD, China. The ethics committee of IMPLAD granted ethical approval for this study. The animals were kept under specific pathogen-free conditions for 1 week prior to the experiments with free access to food and water. 4T1 (murine breast carcinoma) and A549 (human lung carcinoma) cell lines were provided by Cell Culture Center, Institute of Basic Medical Sciences (Beijing, China). 4T1 cells were cultured with RPMI 1640 medium (Thermo Fisher Scientific, Waltham, MA, USA) and A549 cells were cultured in Dulbecco’s Modified Eagle’s Medium (Thermo Fisher Scientific). All media contained 10% fetal calf serum (Thermo Fisher Scientific), 100 U/mL penicillin and streptomycin (Gibco, St Louis, MO, USA), and the cells were cultured at 37°C with 5% CO2 (Sanyo, Osaka, Japan).
Synthesis of FA-β-CD
FA (52.92 mg, 0.12 mmol), DCC (37.08 mg, 0.18 mmol), and NHS (20.70 mg, 0.18 mmol) were dissolved in 15 mL of anhydrous dimethylformamide and stirred at 35°C under a nitrogen atmosphere in the dark for 3 hours. Thereafter, NH2-β-CD (117.7 mg, 0.1 mmol) and 2 mL of anhydrous pyridine were added, and the mixture was stirred in the dark at 35°C under a nitrogen atmosphere for 40 hours. After filtration, the mixture was concentrated to 5 mL and precipitated with 200 mL of cold acetone. The resultant precipitate was rinsed three times with acetone, dispersed in 20 mL of deionized water, and passed through a 0.45 μm filter. The obtained clear aqueous solution was purified using a LH-20 column eluted with deionized water and methanol (90:10, v/v). The product, mono-(6-FA-ethanediamine-6-deoxy)-beta-CD (FA-β-CD), was obtained after lyophilization.
The chemical structure of the synthesized FA-β-CD was characterized by Bruker 500 MHz proton nuclear magnetic resonance spectrum (1H NMR; Bruker, Billerica, MA, USA) using deuterium oxide (D2O) as the solvent. Mass spectra were obtained by a Bruker Daltronics Autoflex III MALDI-TOF system. UV–vis spectroscopy was performed using a UV–visible spectrophotometer (Agilent Technologies, Santa Clara, CA, USA).
Preparation of FA-ACGs-NSps
FA-ACGs-NSps were prepared using a similar method as described in our previous study.20 Briefly, 2.5 mg of SPC was dissolved in 0.2 mL of methanol, and then added dropwise into 5 mL of deionized water containing 5 mg of FA-β-CD under 500 rpm stirring (Euro-Std S25; IKA, Staufen, Germany), followed by the evaporation of methanol. Subsequently, 10 mg of ACGs was dissolved in 0.4 mL of methanol and then added dropwise into the above solution under 500 rpm stirring for 15 minutes, and the mixture was then evaporated under vacuum until no methanol remained. ACGs-NSps (without FA) were prepared as described in our previous study.20
Drug content was determined by dissolving FA-ACGs-NSps in 9-fold volumes of acetonitrile to disintegrate NSps and release the encapsulated ACGs, and the mixture was then passed through a 0.22 μm syringe filter for high-performance liquid chromatography (HPLC) analysis. Drug loading (DL% w/w) was calculated as follows:
DL% = Wdrug/W × 100% |
(1) |
where Wdrug is the mass of the drug in FA-ACGs-NSps and W is the total weight of freeze-dried FA-ACGs-NSps containing both the drug and stabilizer.
Characterization of FA-ACGs-NSps
The average particle size and polydispersity index (PDI) of FA-ACGs-NSps were determined by dynamic light scattering (DLS, Zetasizer Nano ZS; Malvern Instruments, Malvern, UK). Each sample was measured in triplicate with 12 runs at 25°C.
The morphology of FA-ACGs-NSps was observed using a JEM-1400 transmission electron microscope (TEM; JEOL Ltd, Tokyo, Japan). Samples were prepared by placing one drop of the FA-ACGs-NSps onto a 300-mesh copper grid, air-dried, and negatively stained with 2% (w/v) uranyl acetate for contrast enhancement.
HPLC analysis of ACGs
The ACGs concentration was determined on a HPLC instrument (DIONEX UltiMate 3000; Sunnyvale, CA, USA) using bullatacin (a major component of ACGs) as an indicator. Chromatographic separation was performed using a Symmetry C18 column (4.6×250 mm, 5 μm; Waters, Milford, MA, USA) at 30°C. The mobile phase was composed of water and acetonitrile (30/70, v/v). The flow rate was 1.0 mL/min and the detection wavelength was set at 210 nm (UV detector; DIONEX). The sample solution was injected at a volume of 20 μL.
Dissolution studies in vitro
To determine the dissolution kinetics, 4 mL of FA-ACGs-NSps containing 4.0 mg of ACGs were placed in Float-A-Lyzer dialysis cassettes (molecular weight cutoff 12–14 kDa; Spectrum Labs) and immersed in 2 L of 0.1 mol/L phosphate-buffered saline (PBS, pH 7.4) at 37°C with stirring (100 rpm). Periodically, 50 μL of the samples in the dialysis bag was removed from the cassettes for HPLC analysis, and then 50 μL of fresh PBS solution was added into the cassettes. The cumulative release of FA-ACGs-NSps was determined by the reduction of ACGs quantity inside the dialysis cassettes. Drug content determination was performed as described in the section “Preparation of FA-ACGs-NSps”. All of the assays were performed in triplicate.
In vitro cytotoxicity assay
The in vitro cytotoxicity of FA-ACGs-NSps against FR-positive 4T1 cells compared to FR-negative A549 cells was evaluated by an MTT assay. 4T1/A549 cells (150 μL, 8.0×10³ cells/well) were seeded in 96-well plates and incubated for 24 hours in 5% CO2 at 37°C. Thereafter, the medium was removed and various concentrations of ACGs-NSps, the physical mixtures of FA and ACGs-NSps, or FA-ACGs-NSps were added and incubated for 24 hours. The cytotoxicity of free FA and the blank NSps prepared by FA-β-CD and HP-β-CD was also determined. Then, MTT solution (20 μL, 5 mg/mL in PBS) was added to each well and incubated for 4 hours. Finally, the medium was replaced with 150 μL of DMSO, and the absorbance of each well was measured using an enzyme linked immunosorbent assay plate reader (Biotek, Winooski, VT, USA) at 570 nm. The cell viability rate was measured as follows:
Cell viability rate (%) = ODt/ODc × 100% |
(2) |
where ODt is the mean absorbance (OD) of the tested group and ODc is the mean OD of the control group.
The 50% inhibitory concentration (IC50) values of ACGs-NSps, FA+ACGs-NSps physical mixtures, and FA-ACGs-NSps were calculated using GraphPad Prism software (version 5; GraphPad Software Inc, La Jolla, CA, USA).
In vitro cell uptake
Lipophilic Cy5.5 (0.25 mg) was co-dissolved with ACGs in methanol to prepare Cy5.5-labeled ACGs-NSps according to the section “Preparation of FA-ACGs-NSps”. The cellular uptake was performed using 4T1 cells. Briefly, 5.0×10⁵ 4T1 cells were seeded in 12-well plates and cultured for 24 hours. The medium was then replaced by 1 mL of FA-ACGs/Cy5.5-NSps and ACGs/Cy5.5-NSps (ACGs concentration of 11 μg/mL and corresponding Cy5.5 concentration of 0.1 μg/mL, diluted with folate-free RPMI 1640 medium). The plates were incubated for 1, 4, and 8 hours at 37°C in 5% CO2. The FA inhibition group was preincubated with 1 mL of FA solution (50 μg/mL) 1 hour before adding FA-ACGs/Cy5.5-NSps. At the designated time interval, the supernatant in each well was removed and the cells were washed several times with cold PBS, stained with Hoechst 33258, and fixed with 4% paraformaldehyde for 20 minutes. Cellular uptake and distribution of FA-ACGs-NSps were monitored by DeltaVision Microcopy Imaging Systems (GE Healthcare Life Sciences, Pittsburg, PA, USA). The uptake of FA-ACGs/Cy5.5-NSps and ACGs/Cy5.5-NSps by 4T1 cells was observed in the Cy5 channel, and Hoechst 33258 was visualized in the DAPI channel. The average fluorescence intensity under the same scale was calculated with the system software.
In vivo experiments using 4T1 tumor bearing mice
Biodistribution study
To visualize the in vivo biodistribution of ACGs in tumor bearing mice, a near-infrared hydrophobic dye (DiR) was incorporated into the cores of FA-ACGs-NSps and ACGs-NSps. DiR-loaded NSps were prepared as described in the section “Preparation of FA-ACGs-NSps”, except that ACGs were replaced by a mixture of ACGs and DiR (ACGs:DiR =40:1, weight ratio). Female Balb/c nude mice (20±2 g) were inoculated subcutaneously with 4T1 cells (2.0×10⁶ cells/mouse) in the right armpit where the blood vessels are rich so the implanted tumor is easy to grow on.29–31 The 4T1 tumor bearing mice were randomly divided into three groups when the size of tumors reached 300 mm3, and were injected intravenously (iv) with 1) 0.4 mg/kg ACGs/DiR-NSps, 2) 0.4 mg/kg FA-ACGs/DiR-NSps, and 3) 0.4 mg/kg FA-ACGs/DiR-NSps (FA inhibition group), respectively. The FA inhibition group was pre-injected with 200 μL of FA solution (1.0 mg of FA dissolved in 0.4 mL of Tween 80/DMSO (1:1, v/v) mixed solution and then diluted with normal saline to 5 mL) 1 hour before administering FA-ACGs/DiR-NSps. The mice were sacrificed at 72 hours after administration, and the tumors and major organs were excised. The ex vivo fluorescence was imaged with IVIS Living Image® 4.4 (Caliper Life Sciences, Hopkinton, MA, USA). Living Image software (version 4.2) was used for quantitative analysis.
In vivo antitumor activity
Female Balb/c nude mice were implanted with 4T1 cells as described earlier. When the tumor reached 100 mm3, the mice were randomly assigned to four groups (n=10) as follows: normal saline negative control, PTX injection positive control (4 mg/kg, iv), FA-ACGs-NSps (0.4 mg/kg, iv), and ACGs-NSps (0.4 mg/kg, iv). All the groups were iv administered through the tail vein every other day for 2 weeks. Tumor volume and body weight were measured throughout the experiment. Blood samples (500 μL) were taken from the mice eyes with local anesthesia after 15 days of treatment. Plasma was collected after centrifugation at 5,000 rpm for 5 minutes and then analyzed using microplate test kits to measure aspartate aminotransferase (AST), serum alanine aminotransferase (ALT), creatinine (CRE), and blood urea nitrogen (BUN) levels for renal and hepatic function evaluation. Finally, the mice were sacrificed, and the tumors and spleens were harvested and weighed. The tumor inhibition rate (TIR%) was calculated as follows:
TIR% = (1 − Wt/Wn) × 100% |
(3) |
where Wt is the average tumor weight of the tested group and Wn is the average tumor weight of the negative control group.
Statistical analysis
Statistical analysis was performed with SPSS 19.0 statistics software (IBM Corporation, Armonk, NY, USA). Both Student’s t-test and two-way analysis of variance test were used to evaluate the differences between groups, and P≤0.05 was considered significant.
Results and discussion
Synthesis and characterization of FA-β-CD conjugates
FA-β-CD conjugates were synthesized by an active ester reaction using pyridine as an activator and DCC as a coupling agent.32 Due to higher reactivity,33–35 the γ-activated carboxyl group of FA might have preferentially reacted with the amino group of NH2-β-CD and resulted in the γ-activated derivative under kinetic control. Characterization of the synthesized FA-β-CD is shown in Figure 1. The 1H NMR spectra of FA-β-CD in D2O (Figure 1A) showed that the signals at 7.59 and 6.6 ppm were attributed to the aromatic protons of FA and that the signal at 8.59 ppm corresponded to the proton of the pteridine structure in FA-β-CD. The appearance of multiple proton resonance at 3.0–4.5 ppm was assigned to the protons in the β-CD framework. Ultra-high performance liquid chromatography-quadrupole-time-of-flight/mass spectrometry (UPLC-Q-TOF/MS, m/z, Figure 1B) showed the following results: [M+H]+ calculated for C63H94N9O39, 1,600; observed, 1,600.5328. The conjugation of FA to β-CD was also characterized by UV–vis spectroscopy (Figure 1C). The UV–vis spectrum of FA-β-CD showed maximum absorption at 280 nm (characteristic peak of FA) and a shoulder peak at 220 nm (attributed to β-CD), indicating the successful synthesis of FA-β-CD.32
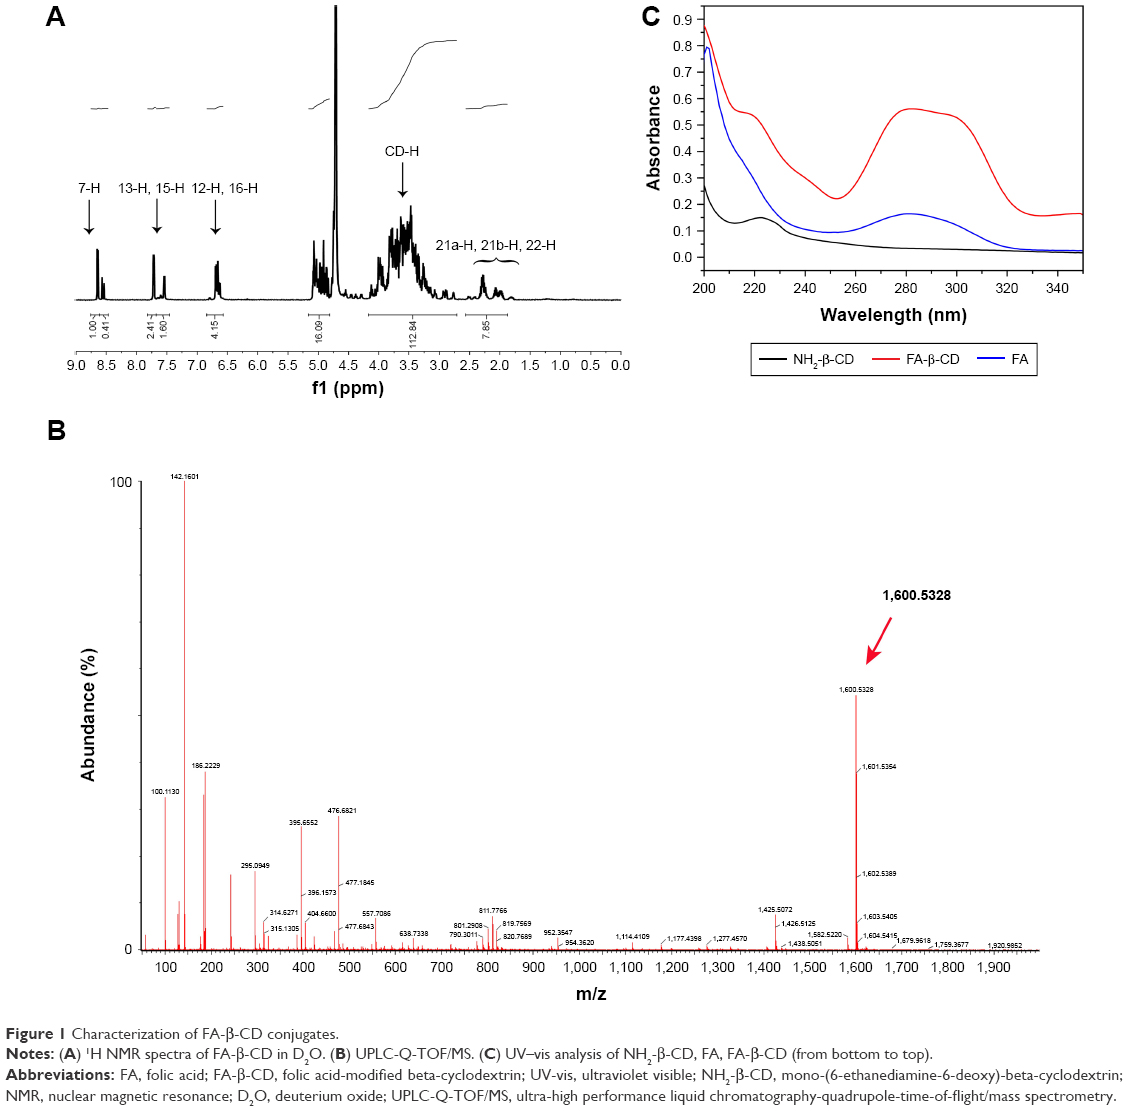 | Figure 1 Characterization of FA-β-CD conjugates. |
Preparation and characterization of FA-ACGs-NSps
In this study, FA-β-CD and SPC were used in combination to prepare ACGs-NSps. FA-ACGs-NSps exhibited an average diameter of 199.5±0.7 nm, which was 55.1 nm larger than that of ACGs-NSps (Figure 2A). The PDI value of FA-ACGs-NSps was 0.07 with a high drug loading capacity of 57.6%±1.9% (w/w). The FA targeting ligand on the surface of ACGs-NSps may lead to a slight increase in the particle size.36,37 The TEM image of FA-ACGs-NSps (Figure 2B) showed a spherical and smooth surface with an approximate particle size of 170 nm, which was slightly smaller than the results determined by DLS.
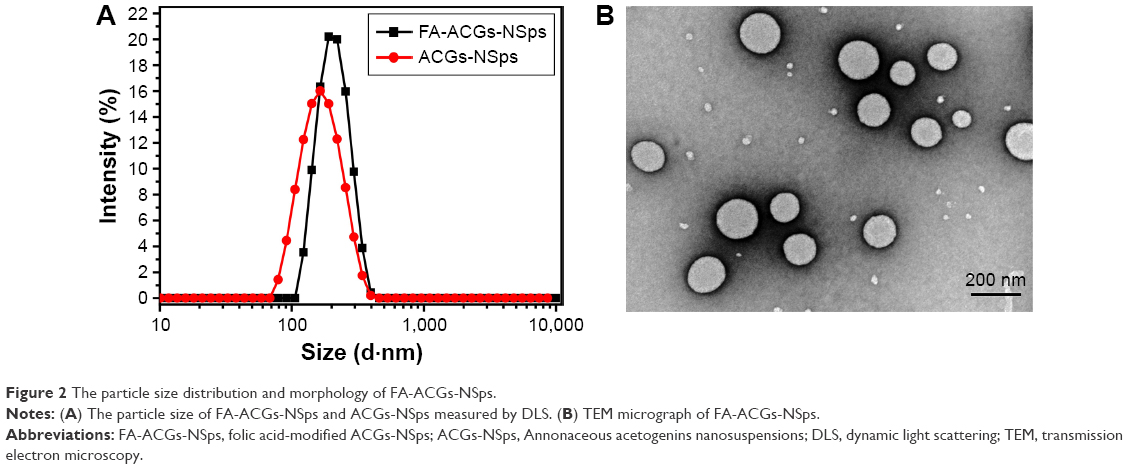 | Figure 2 The particle size distribution and morphology of FA-ACGs-NSps. |
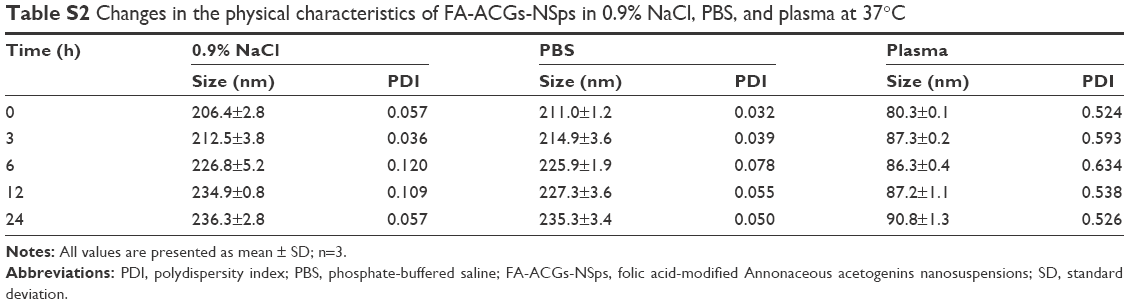
For iv injection, the aqueous medium should be converted into an isotonic solution, such as 0.9% NaCl or PBS. Table S2 showed that the obtained FA-ACGs-NSps were stable in normal saline, PBS, and plasma, with limited size enlargement of ~10–30 nm after 24 hours of incubation at 37°C. This result demonstrated that the prepared FA-ACGs-NSps were suitable for iv administration. In the subsequent study, normal saline was selected as the dispersion medium for all the in vivo investigations, and PBS was selected as the in vitro release medium.
In vitro drug release study
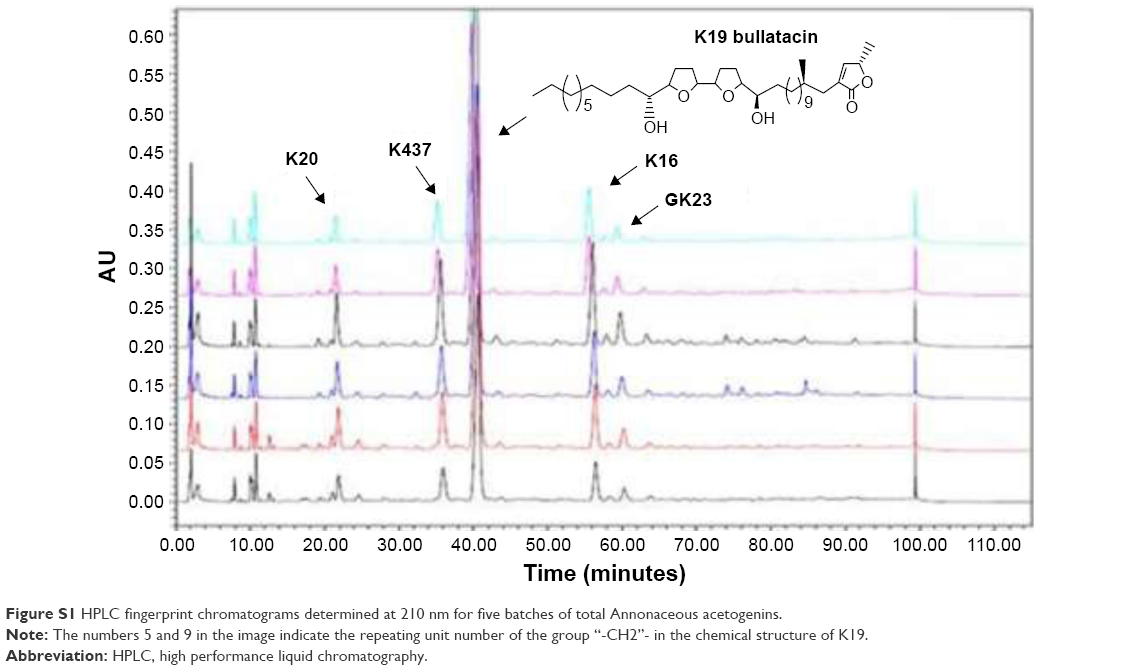
The in vitro drug release from FA-ACGs-NSps was investigated in PBS using the dialysis bag diffusion method. In order to evaluate the release behavior of FA-ACGs-NSps, bullatacin, which is the most abundant compound in ACGs (Figure S1), was used as an indicator for the quantitative analysis of ACGs.
The cumulative dissolution profiles of FA-ACGs-NSps (Figure 3) exhibited a two-phase release pattern. In the initial quick release phase, 28.71% of encapsulated drugs released within 7 hours, which may be attributed to ACGs located in the outer layer of the NSps that were not being tightly bound and consequently more easily released.37 Then FA-ACGs-NSps went through a sustained drug release phase and the cumulative drug release reached 93.05% at 146 hours. The in vitro release data were tested using different release kinetics models, and the Higuchi (Q =0.0698t1/2+0.0698, R2=0.979) equation best described the release behavior of FA-ACGs-NSps. We previously studied the in vitro drug release behavior of ACGs-NSps (100% release within 72 hours),20 which was faster than that of FA-ACGs-NSps. This difference may be due to the particle size of FA-ACGs-NSps being ~50 nm larger than that of ACGs-NSps, or the FA arrangement may have helped retain the drugs inside the carriers as reported before.36,38
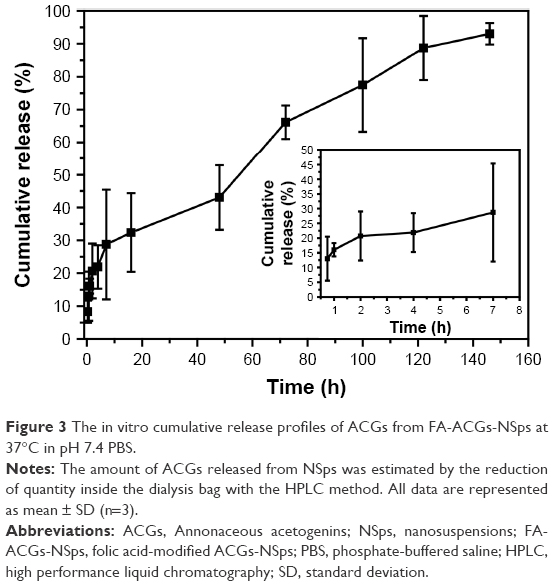 | Figure 3 The in vitro cumulative release profiles of ACGs from FA-ACGs-NSps at 37°C in pH 7.4 PBS. |
In vitro cytotoxicity assay
In this study, an MTT assay was applied to investigate the cytotoxicity of FA-ACGs-NSps and ACGs-NSps toward FR-positive 4T1 and FR-negative A549 cells. As shown in Figure 4, all three ACGs formulations inhibited tumor cell growth in a dose-dependent manner. In the case of FR-positive 4T1 cells, FA-ACGs-NSps showed lower cell viability than ACGs-NSps at all of the concentrations after 24 hours of incubation (Figure 4A). However, no significant difference was observed between the FA-ACGs-NSps and ACGs-NSps groups in A549 cell viability (Figure 4B). This result was in accordance with the IC50 data (Table 1). FA-ACGs-NSps showed significantly enhanced cytotoxicity against 4T1 cells than ACGs-NSps (0.251±0.032 vs 0.352±0.037, P<0.01), while no difference was observed in the IC50 values against A549.
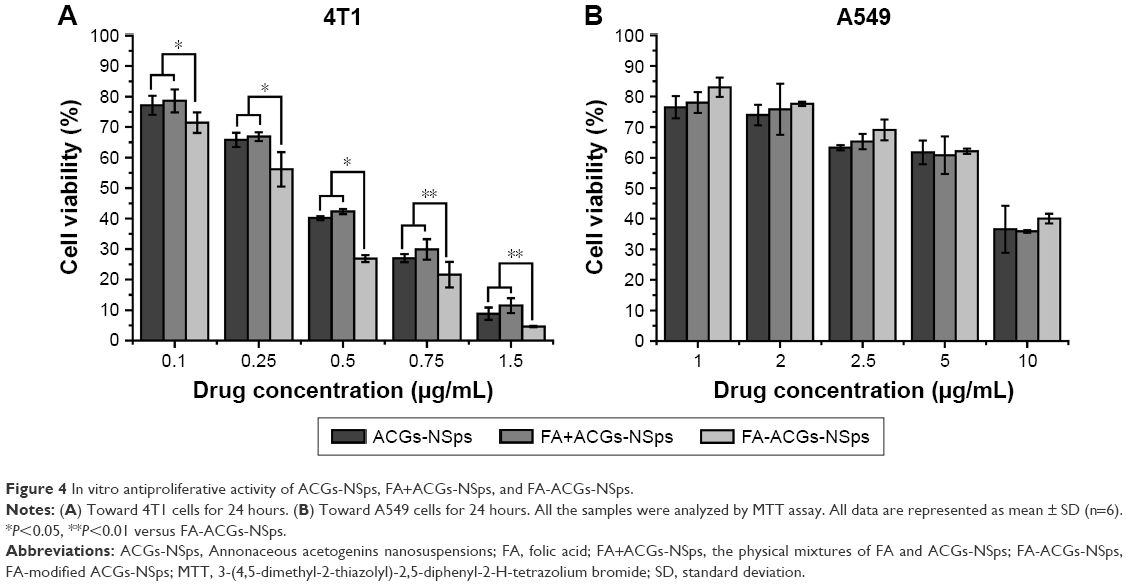 | Figure 4 In vitro antiproliferative activity of ACGs-NSps, FA+ACGs-NSps, and FA-ACGs-NSps. |
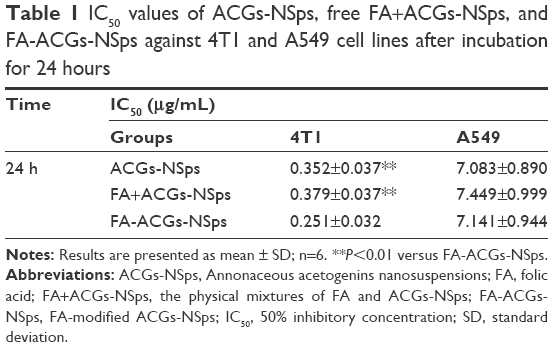 | Table 1 IC50 values of ACGs-NSps, free FA+ACGs-NSps, and FA-ACGs-NSps against 4T1 and A549 cell lines after incubation for 24 hours |
The FA alone group (where the concentration range was equal to that of FA in FA-ACGs-NSps) demonstrated almost no cell inhibition at all of the tested concentrations against both 4T1 and A549 cell lines (Figure S2). In addition, the coexistence of FA showed no effect on the cytotoxicity of ACGs-NSps against both 4T1 and A549 cell lines (Table 1 and Figure 4). These data revealed that neither FA itself nor its co-delivery exhibited antitumor activity or cytotoxicity in the concentration range used in this study. Therefore, the enhanced cytotoxicity of FA-ACGs-NSps could be attributed to the fact that FA played a key role in promoting the cellular uptake of FA-ACGs-NSps into FR-positive tumor cells.39 Compared with FR-negative A549 cells,40 more FRs were expressed on the surface of 4T1 cells,41 which led to rapid binding of FA-ACGs-NSps to 4T1 cells and increased uptake through active endocytosis mediated by the FA–FR interaction. As a result, FA-ACGs-NSps exhibited stronger cell inhibition against 4T1 cells.
We also analyzed the cytocompatibility of blank NSps prepared by FA-β-CD and HP-β-CD toward 4T1 and A549 cells after a 24 hour incubation. Figure S3 shows that blank NSps prepared by HP-β-CD did not exhibit any obvious cell inhibition in all of the tested concentration ranges. There was a slight cytotoxicity of blank NSps prepared by FA-β-CD at a high concentration of 100 μg/mL, which was much higher than that used in our experiment.
In vitro cell uptake
To analyze the effect of FA modification of ACGs-NSps on cellular uptake by FR-positive cells, Cy5.5 was loaded as a tracer to study the cell internalization of FA-ACGs-NSps and ACGs-NSps in 4T1 cells using fluorescence microscopy. The red and blue fluorescence originated from Cy5.5 and Hoechst 33258, respectively. As illustrated in Figure 5, the red fluorescence (Cy5.5-labeled NSps) only partially overlapped with the blue fluorescence (cell nucleus), indicating that FA-ACGs-NSps and ACGs-NSps were mainly distributed in the cytoplasm.
 | Figure 5 Confocal images of 4T1 cells after incubation with different ACGs formulations. |
The in vitro cell uptake was time dependent for both FA-ACGs-NSps and ACGs-NSps (Figure 6). 4T1 cells treated with FA-ACGs-NSps showed brighter red fluorescence than ACGs-NSps treated cells. However, the enhanced fluorescence was reduced when FA-ACGs-NSps treated 4T1 cells were preincubated with 50 μg/mL free FA, which demonstrated that the FA arrangement effectively enhances the cellular uptake of ACGs-NSps by FR-positive cells via receptor–ligand specific interaction.
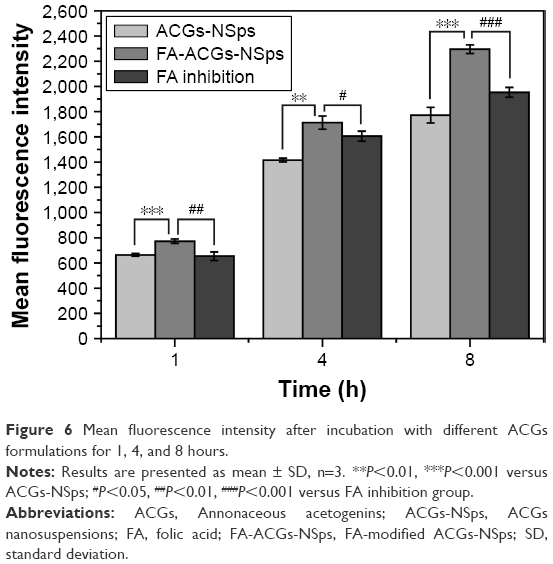 | Figure 6 Mean fluorescence intensity after incubation with different ACGs formulations for 1, 4, and 8 hours. |
In vivo experiments using 4T1 tumor bearing mice
Biodistribution study
ACGs were a mixture of effective components isolated from natural resources without ultraviolet or fluorescent absorption. Thus, the biodistribution of FA-ACGs-NSps in 4T1 tumor bearing nude mice was estimated by co-encapsulating ACGs with a hydrophobic near-infrared fluorescence probe (DiR) in the NSps. The synchronous in vitro release of ACGs and DiR (Figure S4) indicated that it was reasonable to use DiR for tracing the biodistribution behavior of ACGs in vivo.
Figure 7A shows the fluorescence intensity in different organs of mice. The highest fluorescence intensity was found in the liver and then in the spleen, which was in accordance with previously studies.42–44 NSps may be recognized as foreign objects by the immune system when entering the blood circulation and then may be partially uptaken by phagocytic cells of the mononuclear phagocyte system which abounded in special tissues and organs, such as the liver and spleen.42 The FA-ACGs-NSps group displayed much more fluorescence in the tumor than the ACGs-NSps group (P<0.05, Figure 7B), but pretreatment with free FA caused a significant reduction (as observed in the FA inhibition group, P<0.05). This result was due to the specific interaction between the FA moiety of FA-ACGs-NSps and FR of 4T1 tumor cells successfully retaining FA-ACGs-NSps in tumor tissues from the circulation, thus enhancing the cellular uptake. However, as a result of the pretreatment with a high dose of free FA, the FRs of 4T1 tumor cells were saturated in advance, resulting in the failure of FA-ACGs-NSps to bind FRs, thus losing the ability of being selectively retained in the tumor.
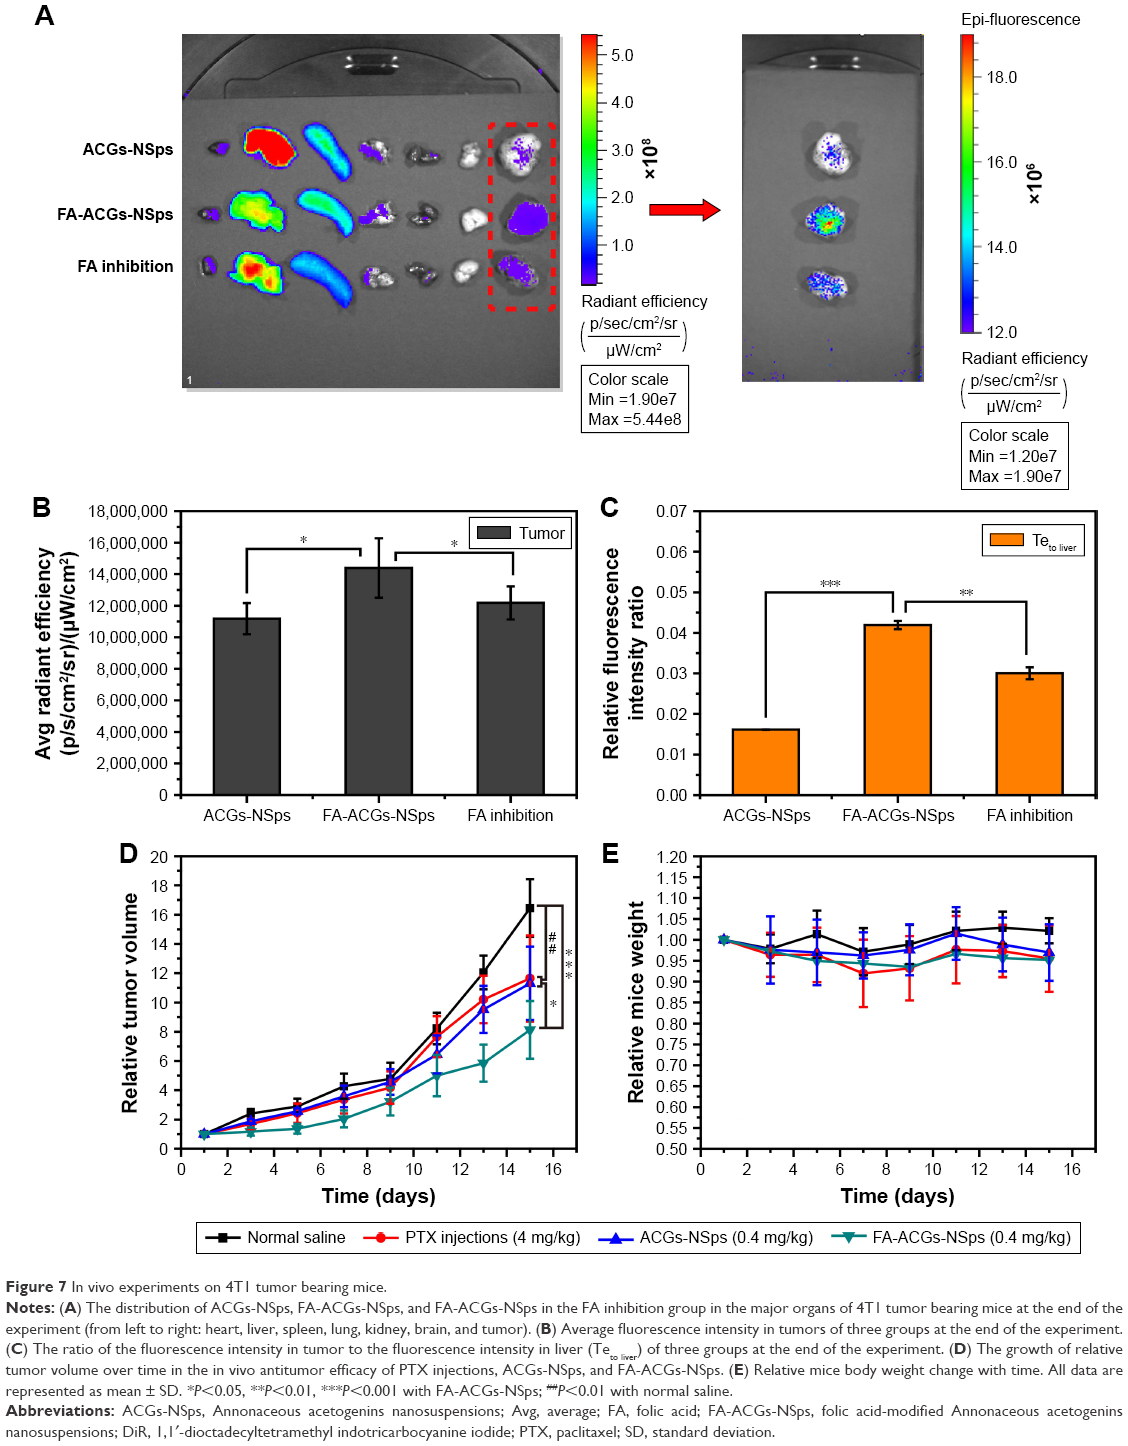 | Figure 7 In vivo experiments on 4T1 tumor bearing mice. |
The ratio of the fluorescence intensity in the tumor to the fluorescence intensity in the liver was used as an index to evaluate the targeting efficiency (Teto liver) of drug delivery systems.45 Figure 7C demonstrated that the Te of FA-ACGs-NSps was 2.5-fold greater than that of ACGs-NSps (P<0.001). It was clear that FA arrangement provides ACGs-NSps with good active tumor targeting ability in FR-positive tumors.
In vivo antitumor efficacy and safety evaluation
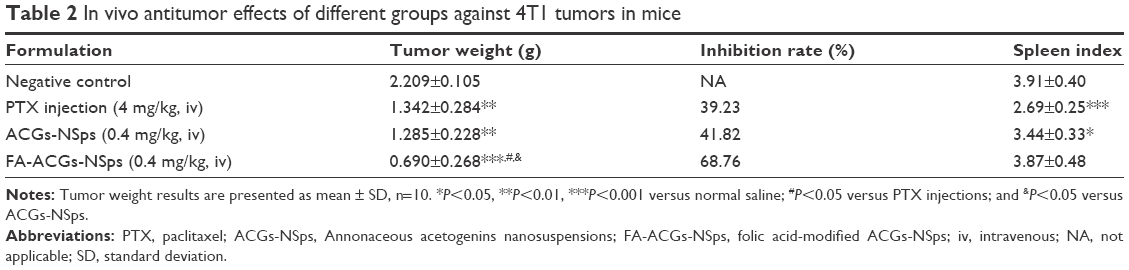
As shown in Figure 7D, treatment with 0.4 mg/kg ACGs-NSps resulted in relatively rapid tumor growth, similar to that of PTX injection (4.0 mg/kg) (11.31-fold vs 11.64-fold, P>0.05). The most significant tumor regression was observed in the FA-ACGs-NSps group, which showed only an 8.12-fold tumor volume increase during 15 days of treatment. Table 2 shows that ACGs-NSps (0.4 mg/kg) exhibited almost the same level of antitumor activity as PTX injections (41.82% vs 39.23%, P>0.05). However, the TIR% of FA-ACGs-NSps (68.76%) was superior to those of the ACGs-NSps and PTX injection groups (P<0.05). The in vivo tumor inhibition data demonstrated that the FA arrangement provides ACGs-NSps with better antitumor efficacy, and that FA-ACGs-NSps could be an effective drug delivery system for ACGs to treat FR-positive tumors.
 | Table 2 In vivo antitumor effects of different groups against 4T1 tumors in mice |
Systemic toxicity is a key factor to consider during cancer therapy. Body weight and spleen index are commonly used indicators of systemic toxicity. There was no significant body weight loss in all the groups (Figure 7E). In contrast to the normal saline group, the PTX injection and ACGs-NSps groups displayed decreased spleen index values (P<0.001 and P<0.05, respectively, Table 2), whereas the FA-ACGs-NSps group showed no significant disparity (P>0.05). Serum analysis (Table 3) indicated that PTX injections and ACGs-NSps induced damage to the kidney and liver function in mice with significantly increased AST values and significantly decreased BUN values. In contrast, the mice in the FA-ACGs-NSps group showed no significant difference in the serum levels of AST, ALT, CRE, and BUN in comparison with normal saline groups (P>0.05). In general, these preliminary safety evaluation data indicated that multiple dosing of FA-ACGs-NSps had minimal impact on the function of liver and kidney and were safer than ACGs-NSps.
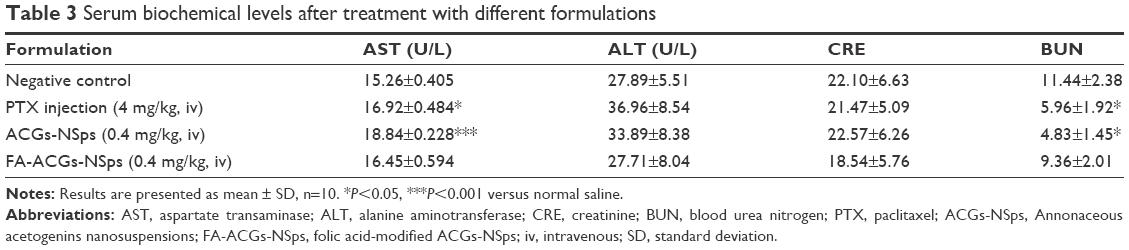 | Table 3 Serum biochemical levels after treatment with different formulations |
ACGs were a potent anticancer active fraction showing stronger cytotoxicity than PTX against a variety of tumor cells.2,4,10,46 However, severe side effect and the narrow therapeutic window greatly restricted their application in the clinic.17 The current research results demonstrated that nanotechnology in combination with active tumor targeting expanded the therapeutic window of ACGs, suggesting that ACGs may be a potent chemotherapeutic agent in cancer treatments.
Conclusion
Botanical extracts have been used as a source of antitumor medicinal agents for a long period of time. ACGs are well known for their wide antineoplastic spectrum. However, further clinic application has been limited due to their low bioavailability by oral administration and side effects. In the present work, FA-β-CD was successfully synthesized and combined with SPC to prepare FA-ACGs-NSps to deliver drugs more efficiently to the tumor site and meanwhile decrease the dose and toxicity by iv administration. The obtained FA-ACGs-NSps were uniform in size and spherical in shape. In vitro cytotoxicity and cellular uptake experiments suggested that the FA-ACGs-NSps could be specifically recognized and taken up by FR-positive cells via receptor-mediated endocytosis. The investigation of the in vivo antitumor activity demonstrated that FA-ACGs-NSps had better therapeutic efficacy and reduced toxicity than ACGs-NSps. To the best of our knowledge, this is the first report on the active targeted drug delivery system for ACGs. The results indicated that nanotechnology in combination with active tumor targeting expanded the therapeutic window of ACGs, suggesting that this potent chemotherapeutic agent may be used in clinical cancer treatment.
Acknowledgments
This work was financially supported by the National Natural Science Foundation of China (number U1401223), CAMS Initiative for Innovative Medicine (CAMS-I2M) (number 2016-I2M-11-068), and the Youth Research Fund of Peking Union Medical College (number 3332015050). In addition, we would like to thank Professor Wenhuang Huang for her generous provision of ACGs.
Disclosure
The authors report no conflicts of interest in this work.
References
Moghadamtousi SZ, Fadaeinasab M, Nikzad S, Mohan G, Ali HM, Kadir HA. Annona muricata (Annonaceae): a review of its traditional uses, isolated acetogenins and biological activities. Int J Mol Sci. 2015;16(7):15625–15658. | ||
Alali FQ, Liu XX, McLaughlin JL. Annonaceous acetogenins: recent progress. J Nat Prod. 1999;62(3):504–540. | ||
Tundis R, Xiao J, Loizzo MR. Annona species (Annonaceae): a rich source of potential antitumor agents? Ann N Y Acad Sci. 2017;17(10):13339. | ||
Liaw CC, Wu TY, Chang FR, Wu YC. Historic perspectives on Annonaceous acetogenins from the chemical bench to preclinical trials. Planta Med. 2010;76(13):1390–1404. | ||
Kojima N, Suga Y, Matsumoto T, et al. Synthesis of dansyl-labeled probe of thiophene analogue of Annonaceous acetogenins for visualization of cell distribution and growth inhibitory activity toward human cancer cell lines. Bioorg Med Chem. 2015;23(6):1276–1283. | ||
Kojima N, Fushimi T, Tatsukawa T, et al. Thiophene-3-carboxamide analogue of Annonaceous acetogenins as antitumor drug lead. Eur J Med Chem. 2014;86:684–689. | ||
Kojima N, Tanaka T. Medicinal chemistry of Annonaceous acetogenins: design, synthesis, and biological evaluation of novel analogues. Molecules. 2009;14(9):3621–3661. | ||
Liaw CC, Chang FR, Lin CY, et al. New cytotoxic monotetrahydrofuran Annonaceous acetogenins from Annona muricata. J Nat Prod. 2002;65(4):470–475. | ||
Chang FR, Wu YC. Novel cytotoxic Annonaceous acetogenins from Annona muricata. J Nat Prod. 2001;64(7):925–931. | ||
McLaughlin JL. Paw paw and cancer: Annonaceous acetogenins from discovery to commercial products. J Nat Prod. 2008;71(7):1311–1321. | ||
Chen Y, Chen JW, Li X. Cytotoxic bistetrahydrofuran Annonaceous acetogenins from the seeds of Annona squamosa. J Nat Prod. 2011;74(11):2477–2481. | ||
Zeng L, Ye Q, Oberlies NH, et al. Recent advances in Annonaceous acetogenins. Nat Prod Rep. 1996;13(4):275–306. | ||
Hollingworth RM, Ahammadsahib KI, Gadelhak G, McLaughlin JL. New inhibitors of complex I of the mitochondrial electron transport chain with activity as pesticides. Biochem Soc Trans. 1994;22(1):230–233. | ||
Raynaud S, Nemati F, Miccoli L, et al. Antitumoral effects of squamocin on parental and multidrug resistant MCF7 (human breast adenocarcinoma) cell lines. Life Sci. 1999;65(5):525–533. | ||
Yuan F, Bai G, Chen Y, Miao Y, Chen J, Li X. Structure–activity relationships of diverse ACGs against multidrug resistant human lung cancer cell line A549/Taxol. Bioorg Med Chem Lett. 2015;25(4):787–790. | ||
Qian JQ, Sun P, Pan ZY, Fang ZZ. Annonaceous acetogenins reverses drug resistance of human hepatocellular carcinoma BEL-7402/5-FU and HepG2/ADM cell lines. Int J Clin Exp Pathol. 2015;8(9):11934–11944. | ||
Chen Y, Chen JW, Zhai JH, Wang Y, Wang SL, Li X. Antitumor activity and toxicity relationship of Annonaceous acetogenins. Food Chem Toxicol. 2013;58:394–400. | ||
Chen Y, Xu SS, Chen JW, et al. Anti-tumor activity of Annona squamosa seeds extract containing Annonaceous acetogenin compounds. J Ethnopharmacol. 2012;142(2):462–466. | ||
Chen Y, Chen JW, Liu SJ, et al. Determination of bullatacin in rat plasma by liquid chromatography-mass spectrometry. J Chromatogr B Analyt Technol Biomed Life Sci. 2012;897:94–97. | ||
Hong J, Li Y, Xiao Y, Guo Y, Kuang H, Wang X. Annonaceous acetogenins (ACGs) nanosuspensions based on a self-assembly stabilizer and the significantly improved anti-tumor efficacy. Colloids Surf B Biointerfaces. 2016;145:319–327. | ||
Wang F, Wang Y, Ma Q, Cao Y, Yu B. Development and characterization of folic acid-conjugated chitosan nanoparticles for targeted and controlled delivery of gemcitabine in lung cancer therapeutics. Artif Cells Nanomed Biotechnol. 2016;29:1–9. | ||
Elnakat H, Ratnam M. Distribution, functionality and gene regulation of folate receptor isoforms: implications in targeted therapy. Adv Drug Deliv Rev. 2004;56(8):1067–1084. | ||
Tang Z, Li D, Sun H, Guo X, Chen Y, Zhou S. Quantitative control of active targeting of nanocarriers to tumor cells through optimization of folate ligand density. Biomaterials. 2014;35(27):8015–8027. | ||
Xia W, Low PS. Folate-targeted therapies for cancer. J Med Chem. 2010;53(19):6811–6824. | ||
Bahrami B, Mohammadnia-Afrouzi M, Bakhshaei P, et al. Folate-conjugated nanoparticles as a potent therapeutic approach in targeted cancer therapy. Tumour Biol. 2015;36(8):5727–5742. | ||
Reddy JA, Allagadda VM, Leamon CP. Targeting therapeutic and imaging agents to folate receptor positive tumors. Curr Pharm Biotechnol. 2005;6(2):131–150. | ||
Sudimack J, Lee RJ. Targeted drug delivery via the folate receptor. Adv Drug Deliv Rev. 2000;41(2):147–162. | ||
Pan D, Turner JL, Wooley KL. Folic acid-conjugated nanostructured materials designed for cancer cell targeting. Chem Commun. 2003;7(19):2400–2401. | ||
Sun J, Jiang L, Lin Y, et al. Enhanced anticancer efficacy of paclitaxel through multistage tumor-targeting liposomes modified with RGD and KLA peptides. Int J Nanomedicine. 2017;12:1517–1537. | ||
Yang X, Liu Y, Zhao Y, et al. A stabilizer-free and organic solvent-free method to prepare 10-hydroxycamptothecin nanocrystals: in vitro and in vivo evaluation. Int J Nanomedicine. 2016;11:2979–2994. | ||
He X, Li L, Su H, et al. Poly(ethylene glycol)-block-poly(epsilon-caprolactone) and phospholipid-based stealth nanoparticles with enhanced therapeutic efficacy on murine breast cancer by improved intracellular drug delivery. Int J Nanomedicine. 2015;10:1791–1804. | ||
Yin JJ, Sharma S, Shumyak SP, et al. Synthesis and biological evaluation of novel folic acid receptor-targeted, beta-cyclodextrin-based drug complexes for cancer treatment. PLoS One. 2013;8(5):e62289. | ||
Eisele K, Gropeanu R, Musante A, et al. Tailored albumin-based copolymers for receptor-mediated delivery of perylenediimide guest molecules. Macromol Rapid Commun. 2010;31(17):1501–1508. | ||
Singh P, Gupta U, Asthana A, Jain NK. Folate and folate-PEG-PAMAM dendrimers: synthesis, characterization, and targeted anticancer drug delivery potential in tumor bearing mice. Bioconjug Chem. 2008;19(11):2239–2252. | ||
van Steenis JH, van Maarseveen EM, Verbaan FJ, et al. Preparation and characterization of folate-targeted pEG-coated pDMAEMA-based polyplexes. J Control Release. 2003;87(1–3):167–176. | ||
Lin M, Teng L, Wang Y, Zhang J, Sun X. Curcumin-guided nanotherapy: a lipid-based nanomedicine for targeted drug delivery in breast cancer therapy. Drug Deliv. 2016;23(4):1420–1425. | ||
Liang X, Sun Y, Liu L, et al. Folate-functionalized nanoparticles for controlled ergosta-4,6,8(14),22-tetraen-3-one delivery. Int J Pharm. 2013;441(1–2):1–8. | ||
Phan QT, Le MH, Le TT, Tran TH, Xuan PN, Ha PT. Characteristics and cytotoxicity of folate-modified curcumin-loaded PLA-PEG micellar nano systems with various PLA:PEG ratios. Int J Pharm. 2016;507(1–2):32–40. | ||
Lu Y, Low PS. Folate-mediated delivery of macromolecular anticancer therapeutic agents. Adv Drug Deliv Rev. 2002;54(5):675–693. | ||
Huang P, Yang LL, Wang CY, et al. Preparation and characterization of folate targeting magnetic nanomedicine loaded with gambogenic acid. J Nanosci Nanotechnol. 2015;15(7):4774–4783. | ||
Tavassolian F, Kamalinia G, Rouhani H, et al. Targeted poly(L-gamma-glutamyl glutamine) nanoparticles of docetaxel against folate over-expressed breast cancer cells. Int J Pharm. 2014;467(1–2):123–138. | ||
Gao L, Zhang D, Chen M, et al. Studies on pharmacokinetics and tissue distribution of oridonin nanosuspensions. Int J Pharm. 2008;355(1–2):321–327. | ||
Yang L, Jiang J, Hong J, et al. High drug payload 10-hydroxycamptothecin nanosuspensions stabilized by cholesterol-PEG: in vitro and in vivo investigation. J Biomed Nanotechnol. 2015;11(4):711–721. | ||
Han M, Liu X, Guo Y, Wang Y, Wang X. Preparation, characterization, biodistribution and antitumor efficacy of hydroxycamptothecin nanosuspensions. Int J Pharm. 2013;455(1–2):85–92. | ||
Hong J, Li Y, Xiao Y, Kuang H, Wang X. Annonaceous acetogenins nanosuspensions stabilized by PCL-PEG block polymer: significantly improved antitumor efficacy. Int J Nanomedicine. 2016;11:3239–3253. | ||
Hopp DC, Alali FQ, Gu ZM, McLaughlin JL. Three new bioactive bis-adjacent THF-ring acetogenins from the bark of Annona squamosa. Bioorg Med Chem. 1998;6(5):569–575. |
Supplementary materials
Experimental
Stability of FA-ACGs-NSps in 0.9% NaCl, PBS, and plasma
In order to study the stability of FA-ACGs-NSps in physiological solutions and plasma, FA-ACGs-NSps (1 mg/mL) were mixed with 1.8% NaCl (1:1, v/v), 2× PBS (pH 7.4) (1:1, v/v), and rat plasma (1:4, v/v), respectively, and then incubated at 37°C. At specific time intervals, 1 mL of sample was withdrawn and analyzed for size changes and particle distribution. Each measurement was performed in triplicate.
 | Table S1 Content percentage of the five major components (%) for five batches of ACGs |
 | Table S2 Changes in the physical characteristics of FA-ACGs-NSps in 0.9% NaCl, PBS, and plasma at 37°C |
 | Figure S1 HPLC fingerprint chromatograms determined at 210 nm for five batches of total Annonaceous acetogenins. |
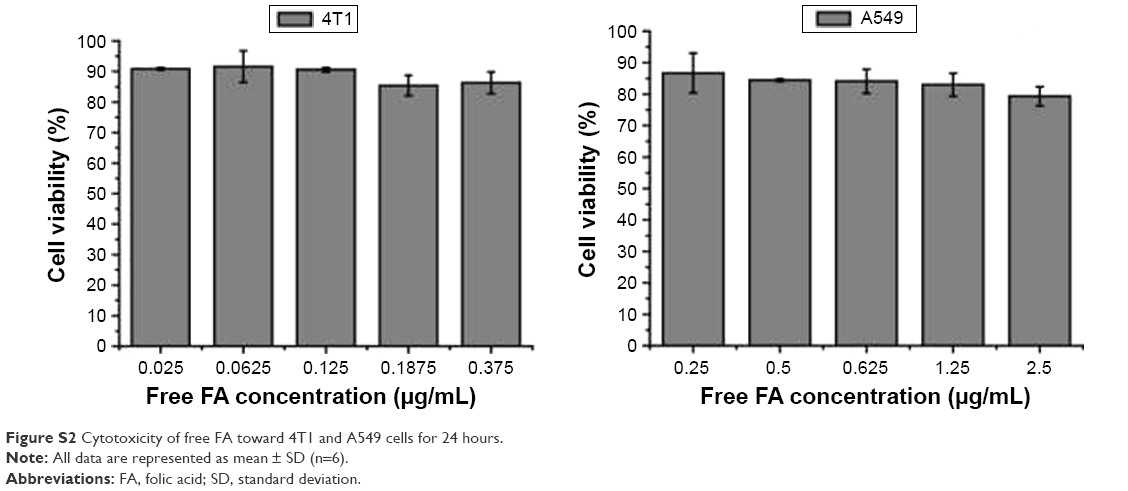 | Figure S2 Cytotoxicity of free FA toward 4T1 and A549 cells for 24 hours. |
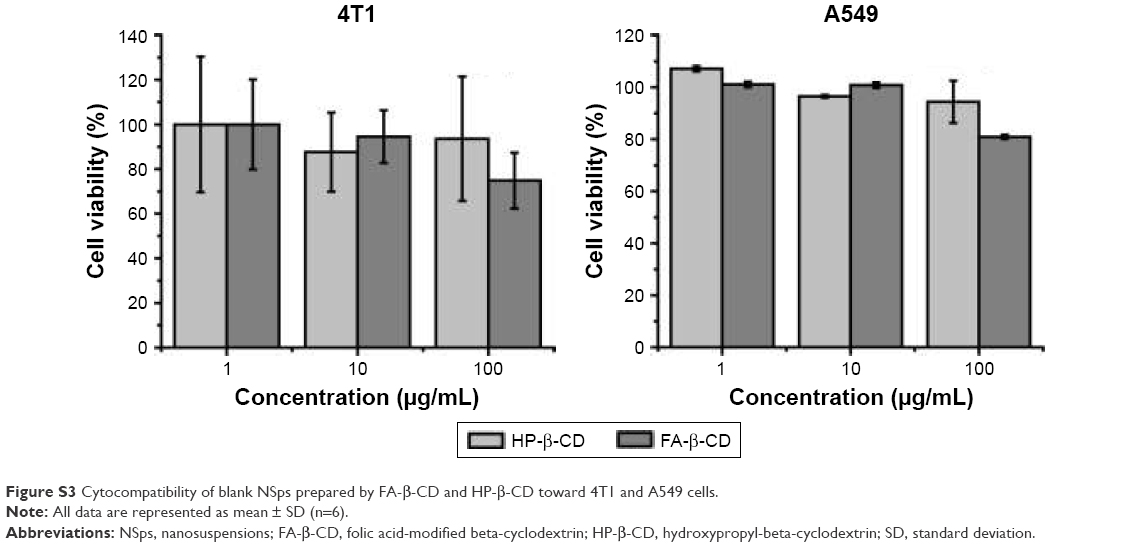 | Figure S3 Cytocompatibility of blank NSps prepared by FA-β-CD and HP-β-CD toward 4T1 and A549 cells. |
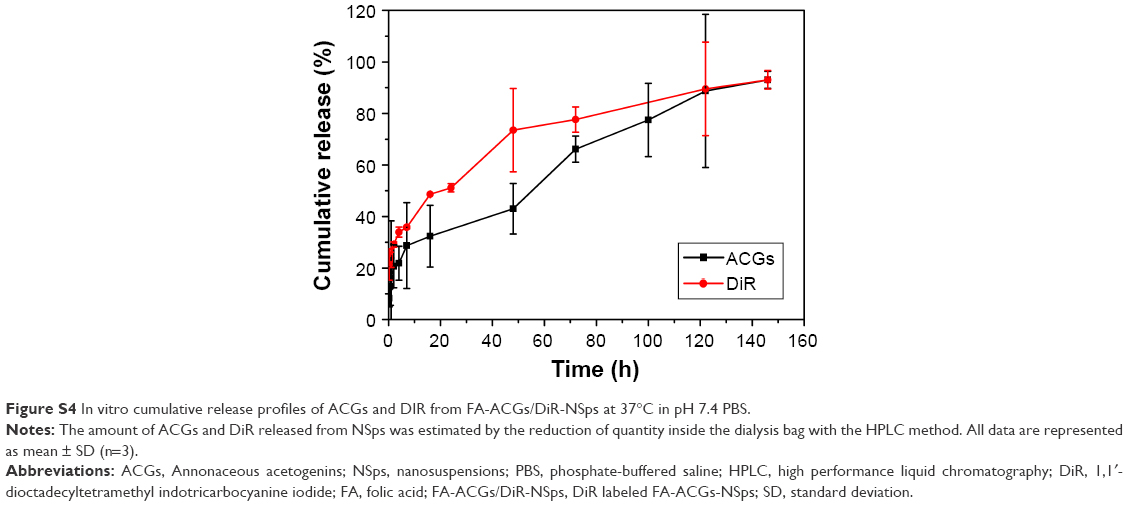 | Figure S4 In vitro cumulative release profiles of ACGs and DIR from FA-ACGs/DiR-NSps at 37°C in pH 7.4 PBS. |
 © 2017 The Author(s). This work is published and licensed by Dove Medical Press Limited. The
full terms of this license are available at https://www.dovepress.com/terms
and incorporate the Creative Commons Attribution
- Non Commercial (unported, 3.0) License.
By accessing the work you hereby accept the Terms. Non-commercial uses of the work are permitted
without any further permission from Dove Medical Press Limited, provided the work is properly
attributed. For permission for commercial use of this work, please see paragraphs 4.2 and 5 of our Terms.
© 2017 The Author(s). This work is published and licensed by Dove Medical Press Limited. The
full terms of this license are available at https://www.dovepress.com/terms
and incorporate the Creative Commons Attribution
- Non Commercial (unported, 3.0) License.
By accessing the work you hereby accept the Terms. Non-commercial uses of the work are permitted
without any further permission from Dove Medical Press Limited, provided the work is properly
attributed. For permission for commercial use of this work, please see paragraphs 4.2 and 5 of our Terms.