Back to Journals » Diabetes, Metabolic Syndrome and Obesity » Volume 15
Fibrosis Predictive Score in Caucasian Patients with Metabolic Syndrome
Authors Mare R ![]() , Sporea I
, Sporea I ![]() , Tomescu M
, Tomescu M ![]() , Pop GN, Vitel A
, Pop GN, Vitel A ![]() , Popescu A, Nistorescu S, Sirli R
, Popescu A, Nistorescu S, Sirli R
Received 25 January 2022
Accepted for publication 17 May 2022
Published 7 June 2022 Volume 2022:15 Pages 1703—1713
DOI https://doi.org/10.2147/DMSO.S358744
Checked for plagiarism Yes
Review by Single anonymous peer review
Peer reviewer comments 2
Editor who approved publication: Prof. Dr. Juei-Tang Cheng
Ruxandra Mare,1,2 Ioan Sporea,1,2 Mirela Tomescu,3 Gheorghe Nicușor Pop,3 Andrei Vitel,3 Alina Popescu,1,2 Silviu Nistorescu,1 Roxana Sirli1,2
1Department of Internal Medicine II, Gastroenterology and Hepatology Unit, Advanced Research Center in Gastroenterology and Hepatology “Victor Babes” University of Medicine and Pharmacy, Timisoara, Romania; 2Regional Center of Research in Advanced Hepatology, Academy of Medical Science, Timisoara, Romania; 3Department VI of Cardiology, “Victor Babeș” University of Medicine and Pharmacy, Timisoara, Romania
Correspondence: Roxana Sirli, Department of Internal Medicine II, Gastroenterology and Hepatology Unit, Advanced Research Center in Gastroenterology and Hepatology “Victor Babes” University of Medicine and Pharmacy, Timisoara, Romania, Tel +40723537039, Fax +40723537039, Email [email protected]
Introduction: Many of the patients presenting with metabolic syndrome (MetS) also have liver steatosis (NAFLD) and some of them could develop liver fibrosis.
Purpose: To develop a simple score that could rule out fibrosis, especially significant fibrosis (F≥ 2) and could be used in daily practice in patients with MetS, in order to identify patients at risk.
Patients and Methods: A total of 204 patients with MetS were prospectively enrolled. Evaluation of liver fibrosis was made using Vibration Controlled Transient Elastography while evaluation of steatosis was achieved using ultrasound (US).
Results: Out of 204 patients with MetS, 179 patients (87.7%) had reliable liver stiffness measurements and 22.9% (41/179) had F ≥ 2. To formulate the fibrosis predicting score, all clinical variables associated with F ≥ 2 in the univariate analysis were considered in a multivariate regression model. According to the power of correlation, by consensus, we attributed 1 point for BMI > 31.4 kg/m2, 1 point for female gender, 1 point for HDLc < 47mg/dL, 1 point for mild steatosis at US, 1.5 point for moderate and 2 points for severe steatosis.
Conclusion: At an optimal cut-off value of < 3.5, our score could be used to rule-out the risk for developing at least significant fibrosis with a high negative predictive value (NPV 89.2%) in patients with MetS.
Keywords: metabolic syndrome, liver steatosis, liver fibrosis, liver elastography
Introduction
Metabolic syndrome (MetS) encompasses a constellation of conditions including abdominal obesity, insulin resistance, hypertension and dyslipidemia. Due to its increasing prevalence, MetS is considered to be an emerging epidemic. MetS is associated with nonalcoholic fatty liver disease (NAFLD), which has become the most common chronic liver disease in many developed countries, mainly due to lifestyle changes.1 The prevalence of NAFLD increases with the number of metabolic syndrome components present, affecting 30% of the general adult population and up to 60–70% of those with MetS or with components of this condition.2 Insulin resistance acts as trigger for both MetS and NAFLD.3,4 There is a bidirectional link between MetS and NAFLD, MetS increasing the risk for NAFLD as well as its severity,5,6 while the latter increases the risk for MetS.7,8 Recently, the term metabolic associated fatty liver disease (MAFLD) has been proposed to be used in clinical practice. MAFLD is present if hepatic steatosis is accompanied by either obesity or overweight (BMI ≥25 kg/m2 in Caucasians), type 2 diabetes mellitus or evidence of metabolic dysregulation.9
NAFLD ranges from simple steatosis to non-alcoholic steatohepatitis (NASH), a condition that can lead to the development of cirrhosis, hepatocellular carcinoma and eventually death. An important clinical predictor in terms of overall mortality, liver-related morbidities and mortality remains the presence of liver fibrosis.10,11 Although liver biopsy remains the gold standard for diagnosing NAFLD, and especially NASH, it is not feasible in a huge cohort of NAFLD patients, and an alternative strategy to screen subjects for progressive liver disease, needs to be defined. In clinical practice, we have to identify those individuals with NAFLD and MetS who have significant fibrosis, in a manner that is noninvasive and affordable by healthcare systems, in order to reduce the liver-related morbidity.
The most commonly non-invasive used method for diagnosing liver fibrosis and steatosis in patients with NAFLD is Vibration Controlled Transient Elastography (VCTE) with Controlled Attenuation Parameter (CAP). VCTE quantifies the speed of a mechanically induced shear wave into the liver tissue and estimates the severity of liver fibrosis using liver stiffness measurements (LSM).12,13 Nowadays, VCTE can detect and quantify liver steatosis by measuring ultrasonic attenuation of the echo signal, using the Controlled Attenuation Parameter (CAP). Several studies have shown that CAP correlates with the histological grade of hepatic steatosis.14,15 However, using the M probe to quantify liver steatosis with CAP, a high failure rate was recorded in obese patients. The method returned better result using the XL probe.16,17
The ultrasound is the most widely used diagnostic tool for the detection of steatosis in clinical practice. A large meta-analysis that included 49 studies and 4720 subjects showed that the sensitivity of ultrasound for the diagnosis of moderate and severe steatosis was 84.8% (95% CI: 79.5–88.9%), with 93.6% specificity (95% CI: 87.2–97.0) compared to liver biopsy.18
Taking into account that liver fibrosis is the main prognostic factor in patients with NAFLD, screening for significant fibrosis in patients with metabolic syndrome seems to be of utmost importance.
The aim of the present study was to develop a simple score that could rule out the presence of significant fibrosis in patients with MetS, which could be used in daily practice in order to identify patients at risk.
Patients and Methods
Study Cohort
This study was conducted between September 2020 and January 2021 in two tertiary departments of Gastroenterology and Cardiology, respectively. We enrolled Caucasian patients with metabolic syndrome that addressed to the Cardiology Department and that agreed to be evaluated. All patients were screened for the presence of liver steatosis using ultrasound, and liver fibrosis was evaluated using Vibration Controlled Transient Elastography (VCTE).
The inclusion criteria were: age over 18 years, a previous diagnosis of MetS according to the International Diabetes Federation criteria from 2006,19 willing to undergo abdominal ultrasound, VCTE and CAP measurements and blood sampling. All patients were evaluated by the cardiologist by conventional mono (M) echocardiography.
The International Diabetes Federation criteria updated in 2006 define metabolic syndrome when three out of five criteria are met, as follows: increased waist circumference ≥94/80cm (men/women) in the European population, increased triglyceride level ≥150 mg/dL or treatment for elevated triglycerides; reduced high-density lipoprotein cholesterol (HDLc) <40/50 mg/dL (men/women) or a treatment for low HDLc; raised blood pressure (BP): systolic BP (SBP) ≥130 or diastolic BP (DBP) ≥85 mmHg or treatment of previously diagnosed hypertension; raised fasting plasma glucose (FPG) ≥100 mg/dL or previously diagnosed type two diabetes.19
The exclusion criteria were: presence of chronic liver diseases (positive HBs Ag, positive HCV Ab, increased gamma-glutamyl transpeptidase, alkaline phosphatase, alcohol intake more than 20 g/day in women and >30 g/day in men, documented use of drugs that induce steatosis - tamoxifen, steroids), malignancy, pregnancy, cardiac pacemakers or defibrillators, history or recent diagnosis of heart failure (systolic dysfunction defined by LV ejection fraction≤50%), significant valvular heart disease, and if aspartate aminotransferase (AST) and alanine aminotransferase (ALT) values were more than five times the upper limit of normal (ULN). All patients gave their informed consent for the procedure. The study protocol was conducted according to the Helsinki Declaration after the approval by our institution’s Ethical Committee of Victor Babes University of Medicine (Nr. 49/21.09–14.10.2020).
Clinical Assessment
Complete medical history, anthropometric and blood pressure (BP) measurements were performed. Weight and height were measured and body mass index (BMI) was calculated. Resting BP was measured three times by using an automated oscillometric sphygmomanometer in seated position and the average of the measurements was used in the study. Arterial hypertension was defined if BP > 140/90 mmHg and/or current antihypertensive therapy.20 Biochemical tests, clinical assessment, echocardiography, abdominal ultrasound, liver stiffness quantification by mean of VCTE were performed on the same day.
Conventional Echocardiography
All the patients underwent M mode echocardiographic evaluation using a 3.5 MHz transducer on a GE phased array ultrasound (VIVID 5S dimension, USA). The diameters of cardiac cavities and LV ejection fraction (EF) were calculated according to the American Society of Echocardiography guidelines.21 The Doppler examination was performed using the apical four-chamber view with the volume specimen placed at the mitral valve tip. The following parameters were determined: the maximal protodiastolic velocity of the transmitral flow (peak E), the maximal telediastolic velocity (peak A), the E/A ratio, and the isovolumic relaxation time (IVRT). LVEF was calculated using the Simpson biplane method.
Abdominal Ultrasound Examinations
Steatosis severity was evaluated by ultrasound in fasting conditions using a convex C5-1 transducer on Philips EPIQ 7 Ultrasound System (Philips Medical System, The Netherlands) and was assessed by the decrease in the intensity and amplitude of ultrasound waves (posterior attenuation). A semi-quantitative scale was used ranging from 0 to 3, according to the subjective assessment of the “brightness” of the liver as compared to the renal cortex and the intensity of “posterior attenuation”. S0 : absence of steatosis (no posterior attenuation), S1: mild steatosis (discrete posterior attenuation) (Figure 1); S2: moderate steatosis (obvious attenuation) (Figure 2); S3: severe steatosis (the posterior diaphragm difficult to visualize) (Figure 3).22 The examinations were performed by two physicians trained in ultrasound techniques. The first operator had 9 years of experience in ultrasound examinations, while the second operator had 4 years of experience.
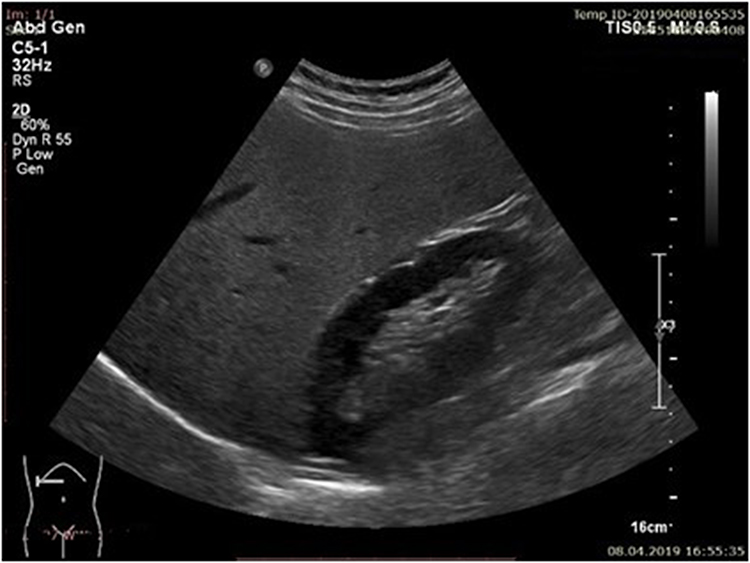 |
Figure 1 Mild steatosis (S1) bright liver with discrete posterior attenuation. |
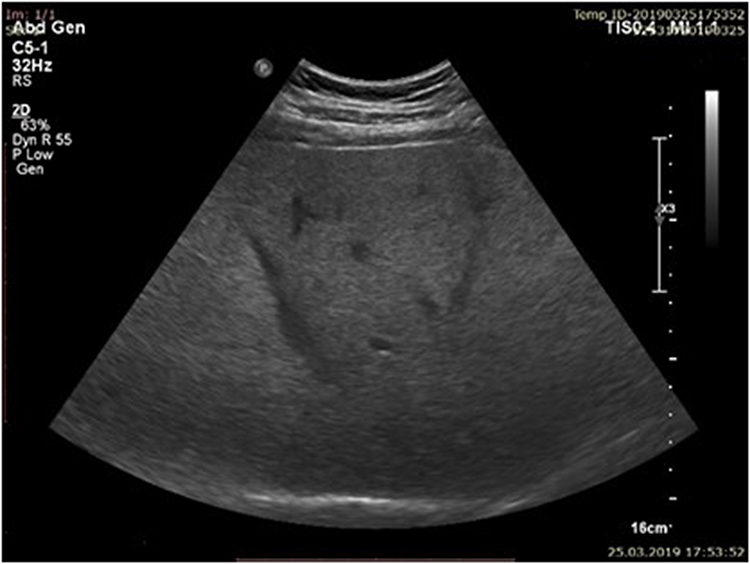 |
Figure 2 Moderate steatosis (S2) bright liver with obvious posterior attenuation. |
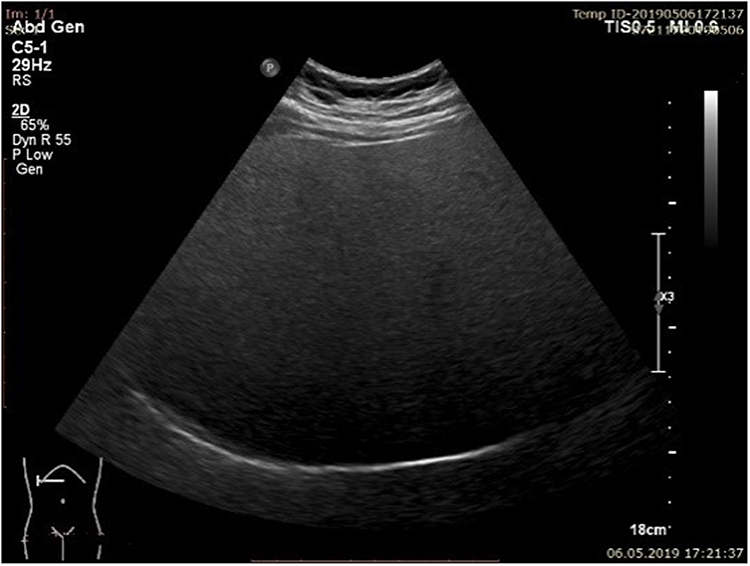 |
Figure 3 Severe steatosis (S3) bright liver with intense posterior. |
VCTE was performed using FibroScan® 502 Touch (EchoSens, Paris, France) after more than 4 hours of fasting, from an intercostal view of the right liver lobe. M or XL probe were used, as suggested by the probe selection tool. The Fibroscan® 502 Touch device automatically selected the M probe when the skin-to-liver capsule distance was ≤25mm, otherwise the XL probe was used. Measurements were performed with the patient in a supine position, with the right arm abducted, according to the EFSUMB recommendations.23 The median value of 10 valid liver stiffness (LS) measurements was calculated and the results were expressed in kilopascals (kPa). Reliable measurements were defined as the median value of 10 valid LS measurements, with an interquartile range interval/median ratio (IQR/M) <30%.23 In order to discriminate between stages of fibrosis, we used the following VCTE cut-offs: for F ≥2–8.2 kPa; for F ≥3–9.7 kPa; and for F = 4–13.6 kPa.13
Statistical Analysis
Data analysis was performed using SPSS v.25 (Statistical Package for the Social Sciences, Chicago, IL, USA). Continuous variables were presented as mean and standard deviation (SD) or as median and Inter-Quartile Range (IQR), based on their distribution and based on Shapiro–Wilk test, respectively. Categorical data were described as frequency counts and their respective percentages calculated from the total. Descriptive and inferential statistical analysis was conducted to summarize the characteristics of the study population. We employed univariate logistic regression in order to find independent factors associated with liver fibrosis, and then we introduced all the independent factors into a multivariate backward logistic regression. In order to construct our score, we employed a backward multivariate logistic regression model. Akaike information criteria (AIC) were used in order to determine the best model. Odds ratio and 95% confidence interval were calculated. The Receiver Operating Characteristic (ROC) curve was employed to illustrate the diagnostic ability. Thresholds to discriminate between the fibrosis and non-fibrosis group were determined with the Youden’s index. We also employed ROC analysis for the final score model. In order to validate our score, we employed a Gradient Boosting machine learning algorithm. We test the Hepatic Fibrosis Score (HFS) by a 10-fold cross-validation method. To avoid biased prediction, we averaged model performance metrics across test folds. For the machine learning validation we employed KNIME 4.3.1 (KNIME AG, Zurich, Switzerland). A p-value under 0.05 was considered statistically significant.
Results
Out of 204 patients with MetS, reliable liver stiffness measurements (LSM) were obtained in 179 (87.7%). The baseline demographic, as well as the clinical and biochemical characteristics of the study group are presented in Table 1. BMI, waist circumference values, N-terminal pro b-type natriuretic peptide (NT-proBNP) were higher in the excluded group as compared with the study group (p = 0.01). In the study group, the distribution of steatosis severity assessed by ultrasound was as follows: 32.4% (58 pts) had mild steatosis (S1), 25.7% (46 pts) moderate steatosis (S2) and the majority of patients 41.9% (75 pts) had severe steatosis. According to VCTE measurements, 77.1% (138 pts) had no or mild fibrosis (F <2), while 22.9% (41pts) had at least significant fibrosis (F≥2).
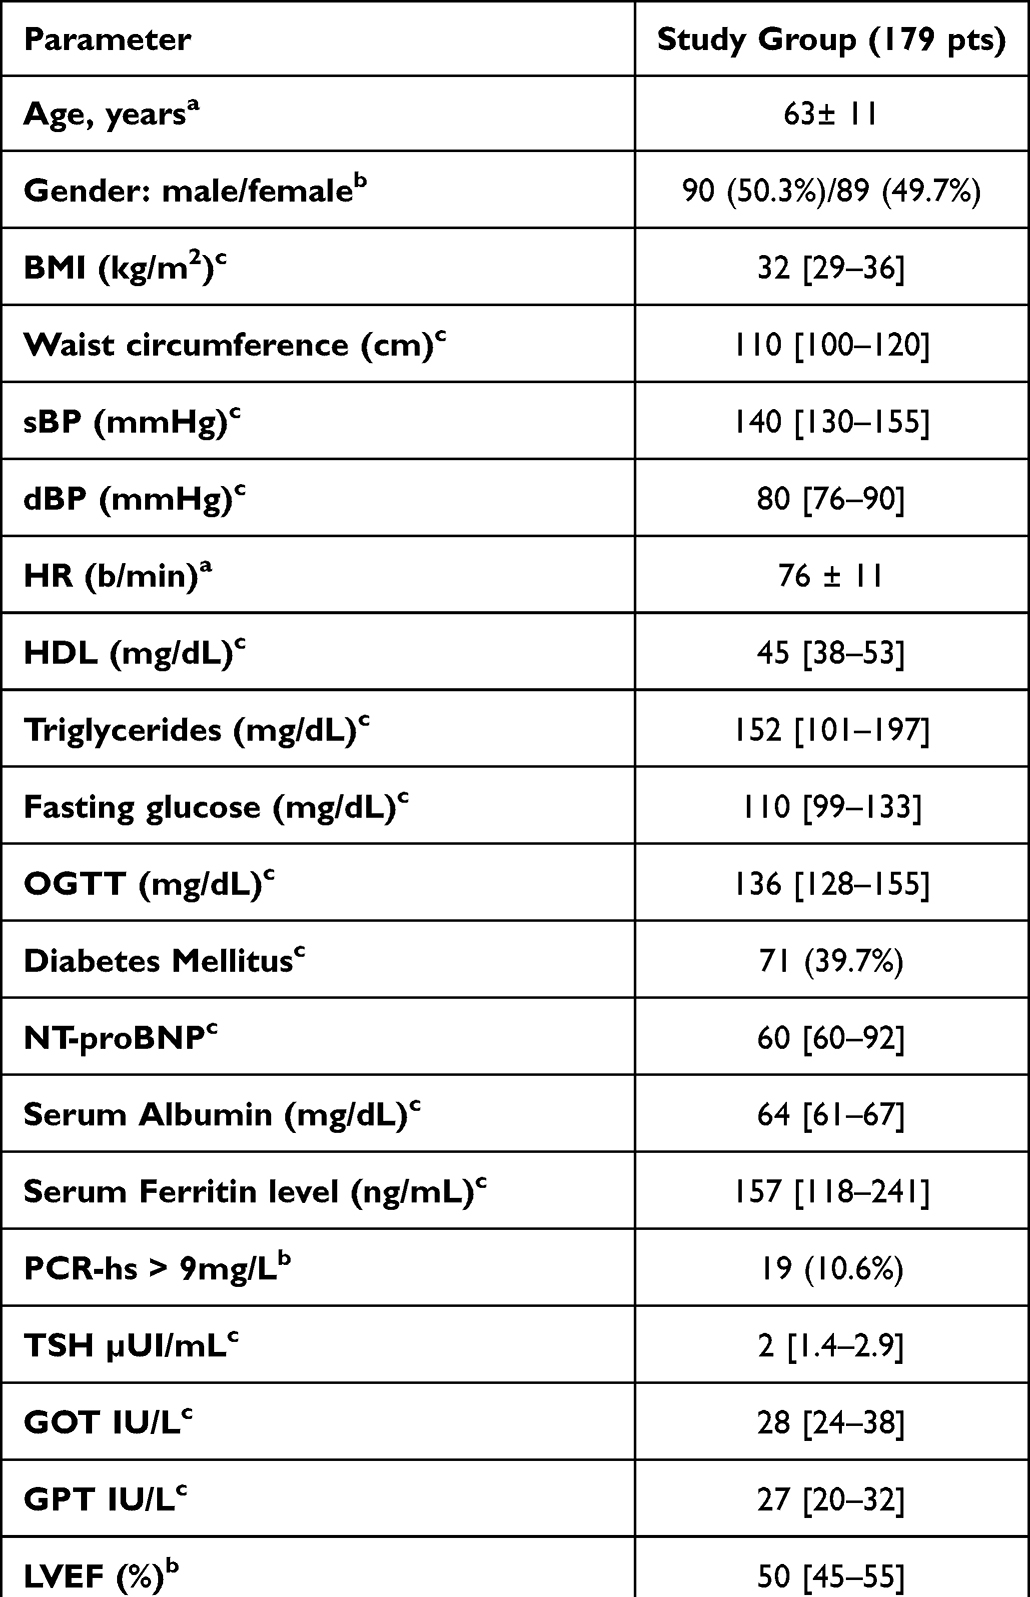 |
Table 1 Baseline Characteristics of the Study Group |
In order to find independent factors that were associated with liver fibrosis, we employed univariate logistic regression. Age, gender, BMI, abdominal circumference, PCR-hs, serum albumin, and liver steatosis were found to be independent factors for predicting liver fibrosis and were included in the final multivariate logistic regression model.
Our regression equation proved to be a good fit for the model, explaining 26.4% of liver fibrosis (Nagelkerke R Square = 0.264). Parameters that were statistically significant for predicting liver fibrosis in our study are presented in Table 2. In our cohort, the risk of at least significant fibrosis (F ≥2, VCTE >8.2kPa) was increased in patients with a BMI higher than 31.4 kg/m2 (1.1-fold), by the presence of hepatic steatosis (1.5-fold), and by female gender (2.2-fold), while higher levels of HDL-c correlated with a lower risk for significant fibrosis (0.9-fold).
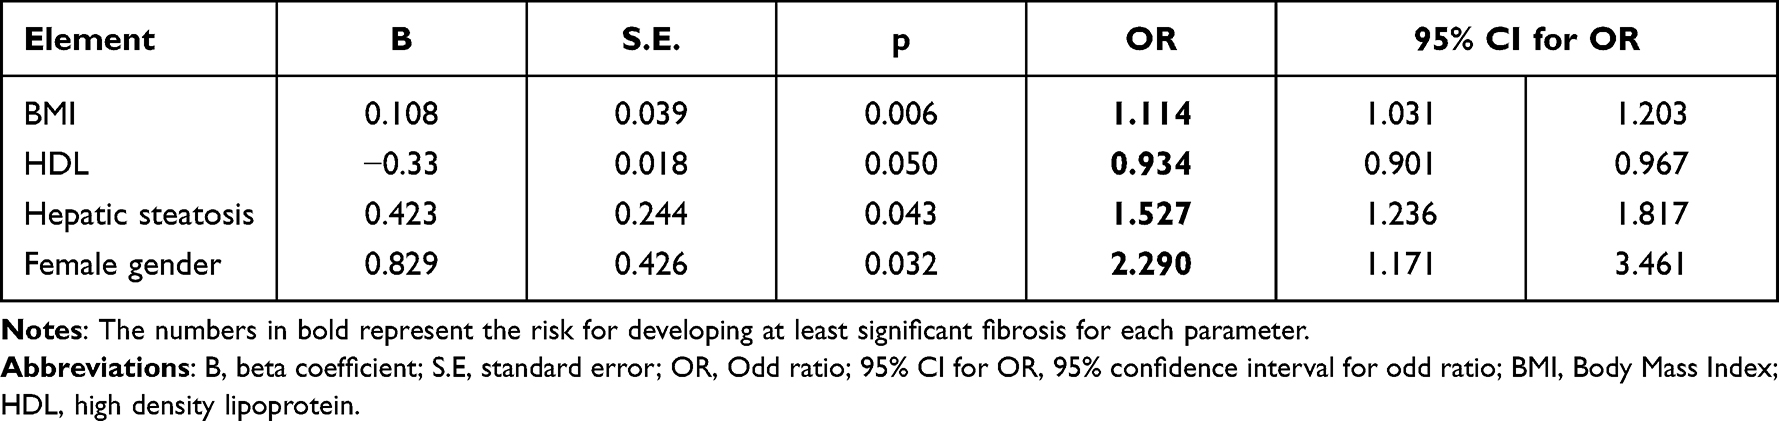 |
Table 2 Logistic Regression for Predicting Liver Fibrosis (>8.2kpa) |
Furthermore, we evaluated the diagnostic performance of ultrasound in comparison with CAP measurements (Table 3). The accuracy of ultrasound performed by our operators was quite high 77% (Se 79.2% and Sp 72.4%) despite the subjectivity of the operator.
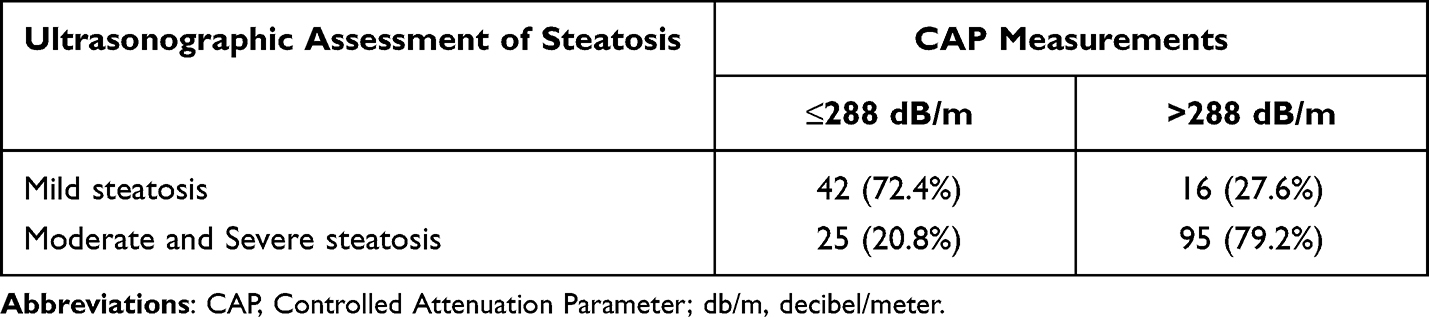 |
Table 3 Ultrasound Liver Steatosis Accuracy versus CAP Assessment |
The second step to construct our score (Hepatic Fibrosis Score: HFS), was to determine cut-off values of our predictive factors. The Receiver Operating Characteristic (ROC) curve was employed to illustrate the diagnostic ability and the thresholds to discriminate between the fibrosis and non-fibrosis groups using the Youden’s index. As seen in Table 4 a BMI value of >31.4 kg/m2 and HDL of <47 mg/dl were found to be the thresholds with most discriminate power, with sensitivities and specificities of 73.8% and 53.4% for BMI and 52.6% and 70% for HDL, respectively.
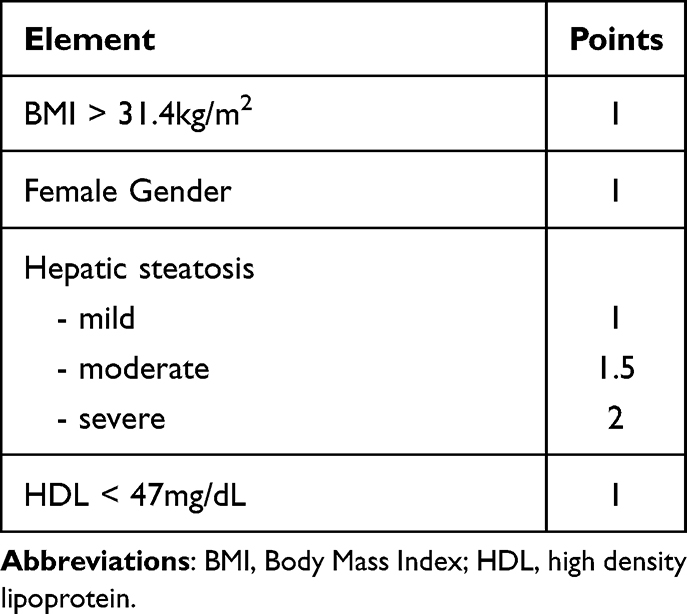 |
Table 4 Hepatic Fibrosis Score (HFS) |
According to the power of correlation, by consensus, we attributed the following points.
The HFS is obtained by adding the points corresponding to each element. This model has an AUROC of 0.654 (95% CI 0.560–0.749), p < 0.001 for predicting the presence of at least significant fibrosis (F ≥2) (Figure 4). At an optimal cut-off value of <3.5, our score could be used to rule-out the risk for developing at least significant fibrosis having a negative predictive value of 89.2%, with a sensitivity of 75% and specificity of 63.8% and a total accuracy of 66.5%.
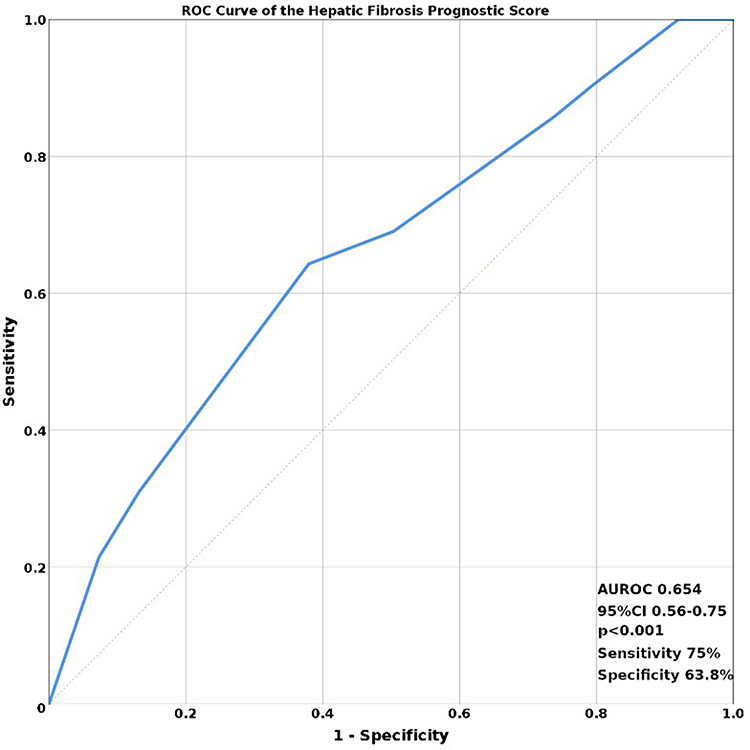 |
Figure 4 ROC curve of hepatic fibrosis score. Abbreviations: AUROC, Area Under the Receiver Operating Characteristic; CI, Confidence Interval. |
For the validation of the score, we employed a Gradient Boosting machine learning algorithm. The validation was performed by a repeated 10-fold cross-validation method. The correlation matrix of the observed vs predicted cases of fibrosis showed a high performance value of 0.737 for the proposed Hepatic Fibrosis Score (HFS).
Discussion
Prevalence and severity of NAFLD is significantly greater in those with metabolic syndrome and increases when the patient presents an association of more of the MetS criteria. Fibrosis is the most important prognostic factor in NAFLD and is correlated with liver-related outcomes and mortality. Diagnosis of liver fibrosis severity in patients with MetS and NAFLD should be performed as part of routine work-up. Identification of non-invasive tests that could easily be used in clinical practice with acceptable performance are a major focus in the field of hepatology.
Many serum biomarkers have shown acceptable diagnostic accuracy with an area under the receiver operating characteristic curve (AUROC) >0.8.12 NAFLD fibrosis score (NFS), fibrosis 4 calculator (FIB-4) and Enhanced Liver Fibrosis (ELF) performed best at distinguishing advanced (≥ F3) vs non-advanced fibrosis, but did not return statistically significant results with regard to ≥ F2 vs no fibrosis.24 All these tests have a good negative predictive value for excluding advanced fibrosis (NFS: 93%, FIB-4: 90%, ELF: 94%).25,26
The HFS score that we propose includes a combination of four variables (BMI, gender, the presence of hepatic steatosis by ultrasound, HDL), which strongly correlated in the multivariate regression analysis with the presence of at least significant fibrosis.
This score could be used in the primary care settings to identify those patients with metabolic syndrome at risk for developing at least significant fibrosis, in order to initiate effective measures aiming to prevent disease progression. The hepatic fibrosis score (HFS) has a high negative predictive value (89.2%) therefore it may be used for first-line risk stratification to exclude at least significant fibrosis. If significant fibrosis cannot be ruled out, patients should be referred to hepatologist for further assessment.
The metabolic syndrome is associated with severe fibrosis and the number of MetS components that a patient presented with showed a strong correlation with the severity of fibrosis.27,28 Obesity is the main determinant and predictor of NAFLD. In our cohort, a BMI value of 31.4kg/m2 (73.8% Se vs 53.4% Sp) was used to significantly discriminate between F <2 vs F ≥2. The association between higher BMI and severity of fibrosis was confirmed in other studies.6,28 Moreover, in our cohort, low HDL cholesterol was an independent risk factor at least for significant fibrosis. A study carried out in Italy29 that confirms the relationship between low HDL cholesterol and obesity among patients with metabolic syndrome is consistent with these results.
Another independent risk factor for significant fibrosis was female gender. Female gender increased by 2.2 fold the risk of at least developing significant fibrosis in our cohort of metabolic patients. Published data30 suggest that the prevalence and severity of NAFLD tend to be greater in men as compared to women during the reproductive age, but after menopause, the prevalence of NAFLD tends to be higher in women, thereby indicating a potential protective role of estrogens. In our cohort, from the group of 91 women, 76.9% were postmenopausal. The loss of estrogen among postmenopausal women accelerates disease progression. Similar results were obtained in a recent meta-analysis where prevalence of advanced fibrosis was 56% higher among women (RR 1.56, 95% CI 1.36–1.80) in a population over 50 years old.31 Prevalence of advanced fibrosis among women also differs by geographic location being higher in studies in East Asia and Europe in comparison with North America.31 One explanation could be the fact that the studies in East Asia and Europe included in the majority of cases older patients, or due to differences in cultural dietary habits or different rates of PNPLA3 genetic variants that could influence NAFLD pathogenesis and fibrosis progression.
The prevalence of NAFLD in the general population is estimated to be 25%, while in patients with MetS, NAFLD can be encountered in more than 50% of the cases.32 Whenever NAFLD is suspected, the presence of steatosis should be documented. The easiest, cheapest and easily available method for steatosis assessment is ultrasonography. Even though ultrasonography has a low reliability for detection of mild steatosis (less than 20% of hepatocytes charged with fat),33 the sensibility and specificity of the method increase when fat content is more than 20–30%, with an area under the curve (ROC) of 0.93 (95% CI 0.91–0.95).18
Nowadays, point of care ultrasound (POCUS) is used in many specialties in clinical practice (gastroenterologists and hepatologists, endocrinologists, internal medicine specialists, general practitioners and others) in many countries. Under these circumstances, the presence of liver steatosis can be diagnosed rapidly and easily. In subjects diagnosed with steatosis, it is of clinical importance to assess the presence of fibrosis, but ultrasound systems able to perform elastography are not so common. Another option is MRI elastography, much more expensive and rarely available.
In 2020, an international group of hepatologists proposed a change in nomenclature from NAFLD to MAFLD or metabolic associated fatty liver disease, where presence of liver steatosis is mandatory in addition to one of the following three criteria, overweight/obesity, presence of type 2 diabetes mellitus (T2DM), or evidence of metabolic dysregulation.9 Liver steatosis must be documented by using either imaging methods such as ultrasound, computer tomography (CT) or magnetic resonance imaging (MRI), serum biomarkers or histology. The first-line diagnostic tool recommended for liver steatosis assessment was ultrasound.9 In our study, a high prevalence of severe steatosis (41.9%) was observed by means of ultrasound. Mild steatosis might not clinically relevant, but moderate and severe steatosis can lead to severe liver damage over time, underlying the need for liver fat quantification.
From the multivariate analysis, we concluded that Mets patients with the highest risk for significant fibrosis were obese female patients, with low HDLc and presence of steatosis as detected by US.
One limitation of the study is the fact that the cohort was selected from a tertiary cardiology care setting that probably led to a selection of patients with a more severe disease spectrum. Another limitation is that the diagnosis of liver steatosis was based on ultrasound imaging, but was not confirmed by liver biopsy or PDFF (MRI proton density fat fraction). Furthermore, being a screening study, liver biopsy could not have been performed.
Nevertheless, the study observations provide significant insights which can be validated through prospective studies across different populations making this test suitable for screening patients with metabolic syndrome. This noninvasive method can be proposed as a screening tool for general practitioners, internal medicine specialists or endocrinologists/diabetologists/cardiologists. Patients with advanced fibrosis should be referred to hepatologists for further evaluation.
Conclusion
In conclusion, a simple score (HFS) consisting of body mass index (BMI), gender, HDLc and severity of steatosis evaluated by ultrasound can be used in clinical practice to rule-out at least the presence of significant fibrosis in patients with MetS. This score could be easily used by general practitioners as a first step for the screening of liver fibrosis in patients with NAFLD.
Disclosure
The authors report no conflicts of interest in this work.
References
1. Younossi ZM, Koenig AB, Abdelatif D, Fazel Y, Henry L, Wymer M. Global epidemiology of nonalcoholic fatty liver disease-Meta-analytic assessment of prevalence, incidence, and outcomes. Hepatology. 2016;64(1):73–84. doi:10.1002/hep.28431
2. Chalasani N, Younossi Z, Lavine JE, et al. The diagnosis and management of non-alcoholic fatty liver disease: practice Guideline by the American Association for the Study of Liver Diseases, American College of Gastroenterology, and the American Gastroenterological Association. Hepatology. 2012;55(6):2005–2023. doi:10.1002/hep.25762
3. Marchesini G, Brizi M, Bianchi G, et al. Nonalcoholic fatty liver disease: a feature of the metabolic syndrome. Diabetes. 2001;50(8):1844–1850. doi:10.2337/diabetes.50.8.1844
4. Petta S, Valenti L, Bugianesi E, et al. A “systems medicine” approach to the study of non-alcoholic fatty liver disease. Dig Liver Dis. 2016;48(3):333–342. doi:10.1016/j.dld.2015.10.027
5. Hamaguchi M, Kojima T, Takeda N, et al. The metabolic syndrome as a predictor of nonalcoholic fatty liver disease. Ann Intern Med. 2005;143(10):722–728. doi:10.7326/0003-4819-143-10-200511150-00009
6. Pais R, Charlotte F, Fedchuk L, et al. A systematic review of follow-up biopsies reveals disease progression in patients with non-alcoholic fatty liver. J Hepatol. 2013;59(3):550–556. doi:10.1016/j.jhep.2013.04.027
7. Lonardo A, Ballestri S, Marchesini G, Angulo P, Loria P. Nonalcoholic fatty liver disease: a precursor of the metabolic syndrome. Dig Liver Dis. 2015;47(3):181–190. doi:10.1016/j.dld.2014.09.020
8. Ballestri S, Zona S, Targher G, et al. Nonalcoholic fatty liver disease is associated with an almost twofold increased risk of incident type 2 diabetes and metabolic syndrome. Evidence from a systematic review and meta-analysis. J Gastroenterol Hepatol. 2016;31(5):936–944. doi:10.1111/jgh.13264
9. Eslam M, Sanyal AJ, George J. International Consensus Panel. MAFLD: a consensus-driven proposed nomenclature for metabolic associated fatty liver disease. Gastroenterology. 2020;158(7):1999–2014.e1. doi:10.1053/j.gastro.2019.11.312
10. Angulo P, Kleiner DE, Dam-Larsen S, et al. Liver fibrosis, but no other histologic features, is associated with long-term outcomes of patients with nonalcoholic fatty liver disease. Gastroenterology. 2015;149(2):389–397.e10. doi:10.1053/j.gastro.2015.04.043
11. Dulai PS, Singh S, Patel J, et al. Increased risk of mortality by fibrosis stage in nonalcoholic fatty liver disease: systematic review and meta-analysis. Hepatology. 2017;65(5):1557–1565. doi:10.1002/hep.29085
12. European Association for Study of Liver, Asociacion Latinoamericana para el Estudio del Higado. EASL-ALEH Clinical Practice Guidelines: non-invasive tests for evaluation of liver disease severity and prognosis. J Hepatol. 2015;63(1):237–264. doi:10.1016/j.jhep.2015.04.006
13. Eddowes PJ, Sasso M, Allison M, et al. Accuracy of FibroScan controlled attenuation parameter and liver stiffness measurement in assessing steatosis and fibrosis in patients with nonalcoholic fatty liver disease. Gastroenterology. 2019;156(6):1717–1730. doi:10.1053/j.gastro.2019.01.042
14. Sasso M, Miette V, Sandrin L, Beaugrand M. The controlled attenuation parameter (CAP): a novel tool for the non-invasive evaluation of steatosis using Fibroscan. Clin Res Hepatol Gastroenterol. 2012;36(1):13–20. doi:10.1016/j.clinre.2011.08.001
15. Chon YE, Jung KS, Kim SU, et al. Controlled attenuation parameter (CAP) for detection of hepatic steatosis in patients with chronic liver diseases: a prospective study of a native Korean population. Liver Int. 2014;34(1):102–109. doi:10.1111/liv.12282
16. de Lédinghen V, Hiriart JB, Vergniol J, Merrouche W, Bedossa P, Paradis V. Controlled Attenuation Parameter (CAP) with the XL Probe of the Fibroscan®: a Comparative Study with the M Probe and Liver Biopsy. Dig Dis Sci. 2017;62(9):2569–2577. doi:10.1007/s10620-017-4638-3
17. Chan WK, Nik Mustapha NR, Wong GLH, Wong VWS, Mahadeva S. Controlled attenuation parameter using the FibroScan® XL probe for quantification of hepatic steatosis for non-alcoholic fatty liver disease in an Asian population. United Eur Gastroenterol J. 2017;5(1):76–85. doi:10.1177/2050640616646528
18. Hernaez R, Lazo M, Bonekamp S, et al. Diagnostic accuracy and reliability of ultrasonography for the detection of fatty liver: a meta-analysis. Hepatology. 2011;54(3):1082–1090. doi:10.1002/hep.24452
19. Alberti KGMM, Zimmet P, Shaw J. Metabolic syndrome – a new world-wide definition. A consensus statement from the International Diabetes Federation. Diabet Med. 2006;23(5):469–480. doi:10.1111/j.1464-5491.2006.01858.x
20. Williams B, Mancia G, Spiering W, et al. 2018 ESC/ESH Guidelines for the management of arterial hypertension. Eur Heart J. 2018;39(33):3021–3104. doi:10.1093/eurheartj/ehy339
21. Lang RM, Badano LP, Mor-Avi V, et al. Recommendations for cardiac chamber quantification by echocardiography in adults: an update from the American Society of Echocardiography and the European Association of Cardiovascular Imaging. J Am Soc Echocardiogr. 2015;28(1):1–39.e14. doi:10.1016/j.echo.2014.10.003
22. Hamaguchi M, Kojima T, Itoh Y, et al. The severity of ultrasonographic findings in nonalcoholic fatty liver disease reflects the metabolic syndrome and visceral fat accumulation. Am J Gastroenterol. 2007;102(12):2708–2715. doi:10.1111/j.1572-0241.2007.01526.x
23. Dietrich CF, Bamber J, Berzigotti A, et al. EFSUMB Guidelines and Recommendations on the Clinical Use of Liver Ultrasound Elastography, Update 2017 (Long Version). Ultraschall Med. 2017;38(4):e16–e47. doi:10.1055/s-0043-103952
24. McPherson S, Anstee QM, Henderson E, Day CP, Burt AD. Are simple noninvasive scoring systems for fibrosis reliable in patients with NAFLD and normal ALT levels? Eur J Gastroenterol Hepatol. 2013;25(6):652–658. doi:10.1097/MEG.0b013e32835d72cf
25. Castera L, Vilgrain V, Angulo P. Noninvasive evaluation of NAFLD. Nat Rev Gastroenterol Hepatol. 2013;10(11):666–675. doi:10.1038/nrgastro.2013.175
26. Guha IN, Parkes J, Roderick P, et al. Noninvasive markers of fibrosis in nonalcoholic fatty liver disease: validating the European Liver Fibrosis Panel and exploring simple markers. Hepatology. 2008;47(2):455–460. doi:10.1002/hep.21984
27. Ryan MC, Wilson AM, Slavin J, Best JD, Jenkins AJ, Desmond PV. Associations between liver histology and severity of the metabolic syndrome in subjects with nonalcoholic fatty liver disease. Diabetes Care. 2005;28(5):1222–1224. doi:10.2337/diacare.28.5.1222
28. Ballestri S, Nascimbeni F, Romagnoli D, Lonardo A. The independent predictors of non-alcoholic steatohepatitis and its individual histological features.: insulin resistance, serum uric acid, metabolic syndrome, alanine aminotransferase and serum total cholesterol are a clue to pathogenesis and candidate targets for treatment. Hepatol Res. 2016;46(11):1074–1087. doi:10.1111/hepr.12656
29. Petta S, Eslam M, Valenti L, et al. Metabolic syndrome and severity of fibrosis in nonalcoholic fatty liver disease: an age-dependent risk profiling study. Liver Int. 2017;37(9):1389–1396. doi:10.1111/liv.13397
30. Lonardo A, Nascimbeni F, Ballestri S, et al. Sex Differences in Nonalcoholic Fatty Liver Disease: state of the Art and Identification of Research Gaps. Hepatology. 2019;70(4):1457–1469. doi:10.1002/hep.30626
31. Balakrishnan M, Patel P, Dunn-Valadez S, et al. Women Have a Lower Risk of Nonalcoholic Fatty Liver Disease but a Higher Risk of Progression vs Men: a Systematic Review and Meta-analysis. Clin Gastroenterol Hepatol. 2021;19(1):61–71.e15. doi:10.1016/j.cgh.2020.04.067
32. Marchesini G, Bugianesi E, Forlani G, et al. Nonalcoholic fatty liver, steatohepatitis, and the metabolic syndrome. Hepatology. 2003;37(4):917–923. doi:10.1053/jhep.2003.50161
33. Saadeh S, Younossi ZM, Remer EM, et al. The utility of radiological imaging in nonalcoholic fatty liver disease. Gastroenterology. 2002;123(3):745–750. doi:10.1053/gast.2002.35354
 © 2022 The Author(s). This work is published and licensed by Dove Medical Press Limited. The
full terms of this license are available at https://www.dovepress.com/terms
and incorporate the Creative Commons Attribution
- Non Commercial (unported, 3.0) License.
By accessing the work you hereby accept the Terms. Non-commercial uses of the work are permitted
without any further permission from Dove Medical Press Limited, provided the work is properly
attributed. For permission for commercial use of this work, please see paragraphs 4.2 and 5 of our Terms.
© 2022 The Author(s). This work is published and licensed by Dove Medical Press Limited. The
full terms of this license are available at https://www.dovepress.com/terms
and incorporate the Creative Commons Attribution
- Non Commercial (unported, 3.0) License.
By accessing the work you hereby accept the Terms. Non-commercial uses of the work are permitted
without any further permission from Dove Medical Press Limited, provided the work is properly
attributed. For permission for commercial use of this work, please see paragraphs 4.2 and 5 of our Terms.