Back to Journals » OncoTargets and Therapy » Volume 10
FBLN4 as candidate gene associated with long-term and short-term survival with primary glioblastoma
Authors Li F, Li YP, Zhang K, Li Y, He P, Liu YJ, Yuan H, Lu H, Liu J, Che S, Li Z, Bie L
Received 13 July 2016
Accepted for publication 27 September 2016
Published 16 January 2017 Volume 2017:10 Pages 387—395
DOI https://doi.org/10.2147/OTT.S117165
Checked for plagiarism Yes
Review by Single anonymous peer review
Peer reviewer comments 3
Editor who approved publication: Dr XuYu Yang
Fubin Li,1,* Yiping Li,1,* Kewei Zhang,1,* Ye Li,1,* Ping He,1,* Yujia Liu,1,* Hongyan Yuan,2,* Honghua Lu,1,* Jinxiang Liu,1,* Songtian Che,3,* Zhenju Li,4,* Li Bie1,5
1Department of Neurosurgery of the First Clinical Hospital, 2Department of Immunology, Norman Bethune College of Medicine, 3Department of Neurosurgery of the Second Clinical Hospital, 4Department of Neurosurgery of the Fourth Clinical Hospital, Jilin University, Changchun, People’s Republic of China; 5Department of Pathology and Laboratory Medicine, School of Medicine, University of California – Irvine, Irvine, CA, USA
*These authors contributed equally to this work
Background: Glioblastoma multiforme (GBM) is the most common malignant and lethal type of primary central nervous system tumor in humans. In spite of its high lethality, a small percentage of patients have a relatively good prognosis, with median survival times of 36 months or longer. The identification of clinical subsets of GBM associated with distinct molecular genetic profiles has made it possible to design therapies tailored to treat individual patients.
Methods: We compared microarray data sets from long-term survivors (LTSs) and short-term survivors (STSs) to screen for prognostic biomarkers in GBM patients using the WebArrayDB platform. We focused on FBLN4, IGFBP-2, and CHI3L1, all members of a group of 10 of the most promising, differentially regulated gene candidates. Using formalin-fixed paraffin-embedded GBM samples, we corroborated the relationship between these genes and patient outcomes using methylation-specific polymerase chain reaction (PCR) for MGMT methylation status and quantitative reverse transcription PCR for expression of these genes.
Results: Expression levels of the mRNAs of these 3 genes were higher in the GBM samples than in normal brain samples and these 3 genes were significantly upregulated in STSs compared to the levels in LTS samples (P<0.01). Furthermore, Kaplan–Meier analysis showed that the expression patterns of FBLN4 and IGFBP-2 serve as independent prognostic indicators for overall survival (P<0.01 and P<0.05, respectively).
Conclusion: To our knowledge, this is the first report describing FBLN4 as a prognostic factor for GBM patient survival, demonstrating that increased GBM survival time correlates with decreased FBLN4 expression. Understanding FBLN4 expression patterns could aid in the creation of powerful tools to predict clinical prognoses of GBM patients.
Keywords: glioblastoma, FBLN4, IGFBP-2, tumor marker, prognosis
Background
GBM is the most common and lethal primary intracranial tumor originating from glial cells. Despite recent advances in therapy over the past 30 years, which include resection, local radiotherapy, and systematic chemotherapy, the median survival time is only 12–15 months.1
In this study, long-term survivors (LTSs) are defined as individuals with survival times greater than 36 months, while those with survival times less than 12 months are designated short-term survivors (STSs).2 LTS patients are clinically very rare and comprise only 2%–12% of all GBM patients.3–7 Understanding this subset of GBM patients might reveal useful biological aspects of this malignancy. Clinical characteristics of LTS patients include younger age, higher Karnofsky performance scores (KPS) at diagnosis, and extent of resection.8,9 In addition, previous studies have pinpointed several biomarkers that are closely correlated with LTS patients. MGMT promoter methylation, p53 mutation, EGFR amplification, 1p/19q codeletion, IDH1/2 mutation, and PTEN deficiency were observed preferentially in LTS GBM samples.10–16 Although LTS GBM research at the molecular level has progressed greatly, biomarkers characterized previously have not sufficiently predicted LTS status in clinical trials. Microarray techniques could aid in the analysis of the genomic landscape to identify prognostic biomarkers for survival in GBM patients. However, analyses of microarray data sets require large numbers of samples to avoid bias. Unfortunately, the LTS sample size has been very limited in past studies. Therefore, it is important to generate data from larger cohorts to better detect robust differences between extreme LTS and general GBM patients.17 In our study, we analyzed the microarray data integrated from multiple array sources using the WebarrayDB platform18 to compensate for inadequate sample size. Among the genes upregulated in STS groups, we focused on a subset of significantly upregulated genes identified in several previous microarray studies,15,19,20 including FBLN4, IGFBP-2, and CHI3L1.
FBLN4, also known as endothelial growth factor (EGF)-containing fibulin-like extracellular matrix protein 2 (EFEMP2), is an extracellular glycoprotein21,22 that contains 6 EGF-like calcium-binding domains and belongs to the fibulin family.23 IGFBP-2 belongs to the IGF family and is involved in molecular events in the regulation of diverse activities in GBM tumors.24,25 CHI3L1, also known as YKL-40 or human cartilage glycoprotein 39, is a secreted glycoprotein that belongs to the 18-glycosyl-hydrolase family of proteins. CHI3L1, considered to be an angiogenic factor for promoting tumor vessel formation through VEGF production, contributes to invasion and radio/chemoresistance of in vivo tumors.26–28
In this study, we examined the expression of the genes FBLN4, IGFBP-2, and CHI3L1 at the mRNA level based on quantitative polymerase chain reaction (qPCR) and microarray data analyses. FBLN4 and IGFBP-2 may represent potential biomarkers for predicting GBM prognosis.
Methods
Patients and tumor samples
Tumor tissue specimens from 77 GBMs were collected from the Department of Neurosurgery, First Affiliated Hospital of Jilin University, Changchun, China, from 2008 to 2013, as approved by the Institutional Review Board (IRB00008484). GBM tumors were obtained from 32 females and 45 males (mean age range at surgery: 17–81 years). All the patients lacked pretreatment history before surgery and all underwent subtotal or gross resection, as confirmed by postsurgical magnetic resonance imaging. All tumors were histologically classified into GBM (WHO grade IV) according to the 2007 WHO classification of tumors of the nervous system.29 Nine control samples (from brains without GBM) were obtained from the same source as for GBM samples and these originated from patients undergoing surgery for brain trauma (n=7) and epilepsy (n=2). All control samples were reviewed to verify the absence of tumors.
Ethical approval
The research was performed in accordance with the Declaration of Helsinki and was approved by the ethics committee of the First Affiliated Hospital of Jilin University (IRB00008484). Written informed consent for participation in the study was obtained from all participants or their guardians.
Extraction, purification, and quality assessment of DNA and RNA
Hematoxylin and eosin (H/E) sections from FFPE specimens were reviewed by a pathologist to select the most informative blocks. Four 10 mm-thick sections per FFPE block were cut, followed by a H/E control slide. The tumor area selected for analysis was marked on the control slide to ensure, whenever possible, greater than 80% content of neoplastic cells within that block. Extraction of genomic DNA was performed using the QuickExtract™ FFPE DNA Extraction Kit (Epicentre, Madison, WI, USA) and quantified with a NanoDrop® ND-1000 spectrophotometer (NanoDrop Technologies, Inc, Wilmington, DE, USA). RNA deparaffinization, extraction, and purification were performed using the QuickExtract FFPE RNA Extraction Kit protocol (Epicentre). The concentration of isolated RNA was measured using the Qubit® RNA BR assay (Invitrogen, Carlsbad, CA, USA) using the Qubit 2.0 fluorometer. Purity absorbance ratios (A260/280 and A260/230) were measured using the NanoDrop ND-1000 spectrophotometer (NanoDrop Technologies).
Real-time qPCR
Synthesis of complementary DNA was performed using the SuperScript™ II Reverse Transcriptase Kit (Invitrogen) using 300 ng total RNA using the manufacturer’s protocol. All gene expression assays were run on an ABI PRISM® 7900HT Sequence Detection System (Applied Biosystems, Foster City, CA, USA) using recommended standard settings. All assays were prepared with the 1× SYBR® Green PCR Super mix (BioPioneer, San Diego, CA, USA). mRNA expression was normalized to the housekeeping gene β-actin. The relative fold changes were calculated using the Pfaffl method30 for each gene after correction using β-actin. The actual sequences of specific primers for FBLN4, IGFBP-2, CHI3L1, and ACTB (β-actin) were as follows: FBLN4 sense: 5′-CCCAGAGATTTGGACTTG-3′; FBLN4 antisense: 5′-GTTTGAGGCAGAGTTAGG-3′; IGFBP-2 sense: 5′-AGGTTGCAGACAATGGCGAT-3′; IGFBP-2 antisense: 5′-GTAGAAGAGATGACACTCGG-3′; CHI3L1 sense: 5′-GAG GATGGAACTTTGGGTCTC-3′; CHI3L1 antisense: 5′-TCAT TTCCTTGATTAGGGTGGT-3′; and β-actin sense: 5′-CCACGAAACTACCTTCAACTCCA-3′; β-actin antisense: 5′-GTGATCTCCTTCTGCATCCTGTC-3′.
The absence of primer dimer formation was demonstrated using agarose gel electrophoresis. Each sample was run in triplicate.
Methylation-specific PCR (MSP)
The extracted DNA (500 ng) was modified with bisulfate using the EZ DNA Methylation™ Kit (Zymo Research, Irvine, CA, USA) according to the manufacturer’s instructions. The MGMT primer sequences were 5′-TTTCGACGTTCGTAGGTTTTCGC-3′ (sense) and 5′-GCACTCTTCCGAAAACGAAACG-3′ (antisense) for methylated template detection and 5′-TTTGTGTTTTGATGTTTGTAGGTTTTTGT-3′ (sense) and 5′-AACTCCACACTCTTCCAAAAACAAAACA-3′ (antisense) for unmethylated template detection, as previously described.31 qPCR assays were performed using an ABI Prism 7900HT Sequence Detection System, as previously described.32 PCR products were separated using a 2% agarose gel. For qualitative assessment, a visible M primer band indicated a positive methylation status, whereas absence of an M primer MSP product was evaluated as a negative methylation status for that respective tumor specimen. Images of the agarose gels were analyzed using ImageJ software (National Institutes of Health, Bethesda, MD, USA; http://rsb.info.nih.gov/ij).
Analysis of microarray data sets
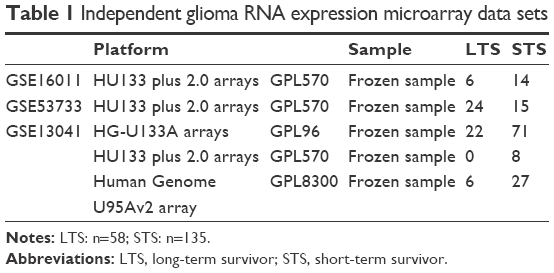
Three independent external microarray data sets15,19,20 containing all 253 GBM samples from 58 LTS patients and 195 STS patients were analyzed using the WebArrayDB cross-platform analysis suite and public data repository for candidate biomarker gene expression (Table 1).18 Data were analyzed with the WebArrayDB platform using an analysis of covariance (ANCOVA) model to correlate gene expression with survival time. Genes were sorted in ascending order according to the P-values calculated for the survival time factor. Thereafter, the first 100 genes were clustered using the Database for Annotation, Visualization and Integrated Discovery (DAVID)33 and Kyoto Encyclopedia of Genes and Genomes (KEGG).34 We applied hierarchical clustering of 3 microarray data sets on survival information using the Kendall tau rank distance to rank dissimilarity for classification of GBM samples into the 4 subtypes identified using The Cancer Genome Atlas (TCGA) Data Portal.35
 | Table 1 Independent glioma RNA expression microarray data sets |
Statistical analysis
Variables are presented as mean values ± SD. For comparison of different groups, the ANCOVA test was used. Cox proportional hazards regression analyses were performed with the use of the design and survival package. Survival curves were calculated using the Kaplan-Meier method and analyzed using the log-rank test. Statistical analysis was performed using SPSS software version 17.0. A P-value less than 0.05 indicated statistical significance.
Results
Clinical characteristics
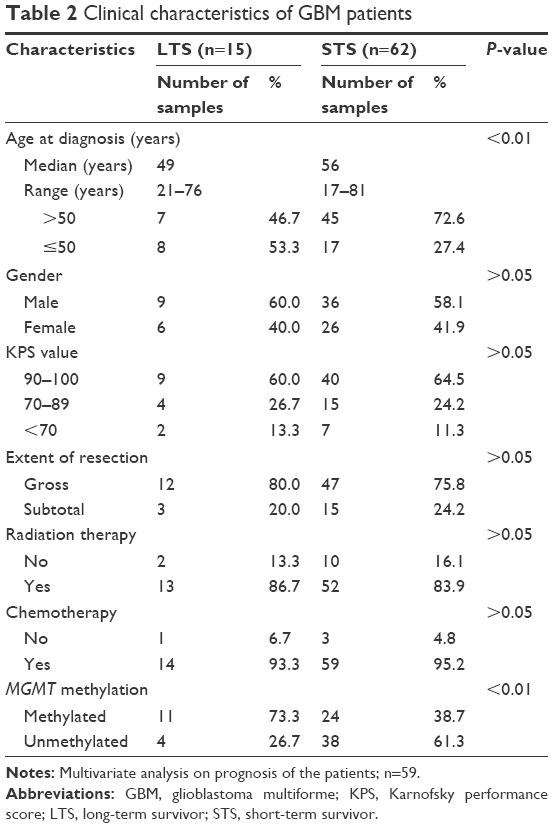
A total of 77 GBM patients treated within the defined study period were investigated. The mean age at diagnosis was 54.6 years (range: 17–81 years; LTS group: 49 years; STS group: 56 years). Most patients could perform activities of daily life independently (KPS scores ≥70) in the LTS group (13/15, 86.3%) and STS group (55/62, 88.7%). Total resection surgeries were performed in most patients within the LTS group (12/15, 80%) and STS group (47/62, 75.8%). Most of the patients also underwent active adjuvant treatment. Gender, KPS score, extent of resection, and method of adjuvant treatment were all similar between the LTS and STS groups (P>0.05) (Table 2).
 | Table 2 Clinical characteristics of GBM patients |
Gene selection from microarray data sets
In order to select genes of potential interest, 3 independent microarray data sets were used (Table 1). These data sets included 8 normal controls, 58 LTS patients, and 135 STS patients. The 2 experimental groups’ data were analyzed using the WebArrayDB cross-platform analysis suite18 using an ANCOVA model. Genes were sorted in ascending order according to the P-values for survival time. The top 100 genes that correlated most significantly with prognosis were compared with genes previously characterized by Gerber et al.36 FBLN4, IGFBP-2, and CHI3L1 were among the top 10 gene candidates in 2 studies. IGFBP-2 and CHI3L1 have also been reported to be closely correlated with glioma invasion and progression.15,19 FBLN4 had not been previously investigated as a biomarker of progression in GBM. Therefore, we focused our attention on these 3 genes in this study. Using the method proposed by Verhaak et al,35 we used unsupervised hierarchical clustering to classify the 3 microarray data sets of LTS samples into 4 subtypes (Table 3) (Figure 1). In the 3 microarray data sets, 34 GBM samples belonged to the classical subtype, 3 to the mesenchymal subtype, 3 to the neural subtype, and 18 to the proneural subtype.
 | Table 3 Classification of the 3 microarray data sets into the 4 subtypes of GBM |
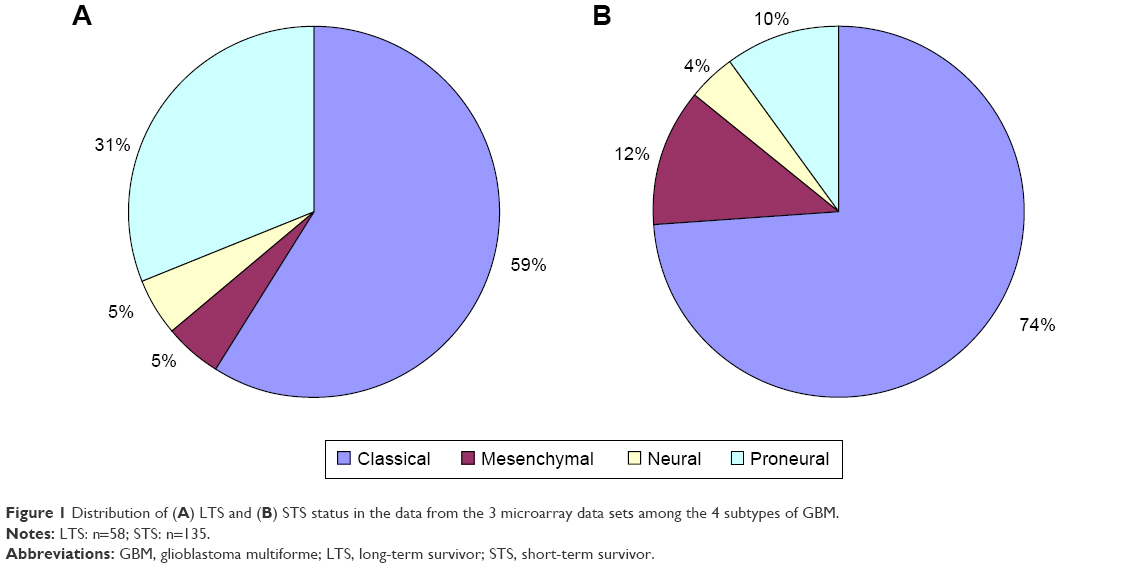 | Figure 1 Distribution of (A) LTS and (B) STS status in the data from the 3 microarray data sets among the 4 subtypes of GBM. |
FBLN4, IGFBP-2, and CHI3L1 mRNA levels in LTS and STS patients
To compare FBLN4, IGFBP-2, and CHI3L1 expression levels in 15 LTS patients and 62 STS patients, we examined the mRNA levels using quantitative reverse transcription (qRT)-PCR. As shown in Table 4, when analyzing the mRNA levels of these genes in normal controls and GBM patients, we found an average increase of expression in tumor tissues compared to normal controls. Moreover, mRNA levels of the 3 genes were significantly different between GBM samples and normal controls (P<0.05). At the same time, we also found that the expression of all 3 genes was significantly upregulated in STS vs LTS patients (P<0.05).
 | Table 4 Comparison of mRNA expression of FBLN4, IGFBP-2, and CHI3L1 in tumor tissue by qRT-PCR and microarray analysis |
Analysis of methylation status of MGMT promoter
In 77 GBM samples, the methylation status of the MGMT promoter was tested using qMSP. MGMT promoter methylation was detected in 11 (73.3%) of the LTS samples and 24 (38.7%) of the STS samples. There was significant difference between the 2 groups (P<0.05) (Table 1).
Multivariate Cox regression analysis
We performed Cox regression analysis to evaluate the expression of genes and the MGMT methylation status in GBM patients. Multivariate survival analyses identified high expression of FBLN4 and IGFBP-2 (P<0.05), with MGMT promoter methylation status of the GBM patients acting as an independent prognostic factor for survival time (Table 5). However, CHI3L1 expression did not function as an independent prognostic factor for survival time, although this result was not statistically significant due to the small sample size (P=0.052).
 | Table 5 Multivariate analysis on prognosis of the patients |
FBLN4 and IGFBP-2 overexpression correlates with survival time in GBM patients
The search for a model describing the relationship between survival and the expression of FBLN4 and IGFBP-2 using maximally selected log-rank statistics identified a cutpoint model to be the most suitable; it was used to delineate 2 subgroups of GBM patients. Applying a 2-gene expression cutoff to a Kaplan–Meier survival curve estimation revealed decreased survival probability for patients with tumors expressing high levels of these gene products (P<0.05), (Figure 2). The 2 subgroups exhibited significantly different outcomes relative to WHO grade IV patients.
 | Figure 2 Kaplan–Meier estimates of OS in relation to FBLN4 and IGFBP-2 expression as determined by qPCR. |
Discussion
Although during the past 2 decades many attempts have been made to identify biomarkers with prognostic significance, predicting GBM patients’ prognosis still remains a serious challenge. Nevertheless, the LTS phenomenon in GBM provides a unique opportunity to gain insights into the molecular characteristics underlying such a favorable prognosis.
In this study, we analyzed the data from 3 microarrays15,19,20 to screen LTS and STS samples. Our study showed that LTS can be achieved in GBM patients with nonproneural tumors (40/58, 69.0%). Moreover, LTS patients can be observed within all GBM subtypes, as corroborated by previous investigations.36 This study also showed higher incidence of MGMT promoter methylation in the LTS group vs STS group (73.3% vs 38.7%). As a next step, we compared LTS and STS sample microarray data sets using the WebarrayDB platform and combined our results with those of another recent study36 to evaluate the prognostic biomarkers in GBM patients. FBLN4, IGFBP-2, and CHI3L1 ranked within the top 10 prognostic gene candidates in multiple microarray data sets. We further validated these 3 biomarkers in clinical samples using qPCR. We found that the mRNA expression levels of these genes were higher in GBM samples than in normal brain samples and all were significantly upregulated in STS samples vs LTS samples. Furthermore, both FBLN4 and IGFBP-2 expression patterns were independent prognostic factors for overall survival, as determined using the Cox proportional hazards regression model. Patients with high expression of FBLN4 or IGFBP-2 had poorer survival times than those with low expression of these genes. Furthermore, CHI3L1 was not determined to be an independent prognostic factor, possibly due to the small sample size (P=0.052). Moreover, Kaplan–Meier analysis showed that both FBLN4 and IGFBP-2 can be independent prognostic indicators for overall survival (P<0.01 and P<0.05, respectively). To our knowledge, this is the first report showing that FBLN4 is a prognostic factor in glioma patients.
FBLN4, also known as EGF-containing fibulin-like extracellular matrix protein 2 (EFEMP2), is localized to the FBLN4 gene on chromosome 11q13a. It is an extracellular glycoprotein21,22 that contains 6 EGF-like calcium-binding domains and belongs to the fibulin family.23 FBLN4 is essential for connective tissue development and elastic fiber formation, and it plays an important role in vascular patterning and collagen biosynthesis.37 Moreover, it is involved in the onset and progression of many diseases, including aortic aneurysms,38,39 cutis laxa,40,41 and osteoarthritis.42 FBLN4 has been observed to be a specific protein partner for mutant p53, and it displays both mutant p53-dependent and -independent oncogenic properties, with implications for both cancer biology and therapeutic intervention. To date, the role of FBLN4 in different types of tumor tissues has been controversial. FBLN4 promoter methylation has frequently been found in lung cancers43 and melanoma cells.44 Other studies have reported that FBLN4 is overexpressed in tumors of the digestive system45–47 and in gynecological tumors;48–50 FBLN4 overexpression correlates with tumor progression and poor prognosis in these studies. In contrast, FBLN4 is downregulated in prostate cancer.51 A recent study has reported that FBLN4 is upregulated in glioma tissue and promotes glioma cell proliferation and invasion.52 In our study, we also found that FBLN4 expression was significantly increased in GBM samples vs normal samples (P<0.01) and was significantly higher in STS samples than in LTS samples (P<0.01). Therefore, FBLN4 expression can be an independent prognostic indicator for overall survival (P<0.01).
IGFBP-2 belongs to the IGF family. IGFBP-2 exhibits higher expression in GBM samples than in other pathological types of glioma.53,54 Moreover, IGFBP-2 is significantly associated with the Ki-67 labeling index in gastric carcinoma.55 In addition, over the past 15 years, results of several studies reporting increased expression of IGFBP-2 have correlated it with poor clinical GBM patient outcomes.56–59 Moreover, recent studies have reported that plasma IGFBP-2 levels could predict the clinical outcomes of GBM patients.25,60,61 IGFBP-2 expression has been associated with oncogenic effects via several mechanisms. IGFBP-2 modulates the status of PTEN through activation of the PI3K/AKT pathway.62–64 IGFBP-2 drives glioma development and progression by activating the signaling pathway of integrins.65–67 IGFBP-2 contributes to GBM progression by enhancing transcription of VEGF and MMP-2 to promote tumor cell invasion.68–70 IGFBP-2 plays a key role in the activation of the EGFR/STAT3 pathway to influence the invasive and migratory capacities of GBM cells. At the same time, IGFBP-2 modulates multiple key genes to enhance invasiveness of GBM cells.71–74 In our study, we also found that IGFBP-2 exhibits higher expression in STS samples than in LTS samples (P<0.01). Furthermore, Kaplan–Meier analysis showed that IGFBP-2 level can be an independent prognostic indicator for overall survival (P<0.05).
Conclusion
We have found upregulated expression of the genes FBLN4, IGFBP-2, and CHI3L1 in the STS group vs the LTS and normal groups. FBLN4 and IGFBP-2 show promise as useful clinical prognostic markers and could potentially improve patient health management. These provisional findings, however, require confirmation using a larger study.
Abbreviations
GBM, glioblastoma multiforme; LTS, long-term survivor; STS, short-term survivor; FFPE, formalin-fixed paraffin-embedded; H/E, hematoxylin and eosin; MSP, methylation-specific polymerase chain reaction.
Acknowledgments
We thank Mr Hong Yuan for assistance with this study. This work was supported by the National Natural Science Foundation of China (grant numbers 81201980 and 81572476) and the Natural Science Foundation of Jilin Province, China (number 20130522028JH). The data sets supporting the conclusion of this article are included within the article. Any request for data and material may be sent to the corresponding author.
Author contributions
FL, YPL, HY, and KZ carried out the molecular genetic studies and participated in the preparation of the manuscript. YL, PH, YJL, SC, and ZL collected samples. LB conceived the study and participated in its design and coordination, in addition to drafting the manuscript. All authors contributed toward data analysis, drafting and critically revising the paper and agree to be accountable for all aspects of the work. All authors read and approved the final manuscript.
Disclosure
The authors report no conflicts of interest in this work.
References
Wen PY, Kesari S. Malignant gliomas in adults. N Engl J Med. 2008;359(5):492–507. | ||
Shinawi T, Hill VK, Krex D, et al. DNA methylation profiles of long- and short-term glioblastoma survivors. Epigenetics. 2013;8(2):149–156. | ||
Sonoda Y, Kumabe T, Watanabe M, et al. Long-term survivors of glioblastoma: clinical features and molecular analysis. Acta Neurochir (Wien). 2009;151(11):1349–1358. | ||
Scott JN, Rewcastle NB, Brasher PM, et al. Which glioblastoma multiforme patient will become a long-term survivor? A population-based study. Ann Neurol. 1999;46(2):183–188. | ||
Deimling GT, Bowman KF, Wagner LJ. Cancer survivorship and identity among long-term survivors. Cancer Invest. 2007;25(8):758–765. | ||
Krex D, Klink B, Hartmann C, et al. Long-term survival with glioblastoma multiforme. Brain. 2007;130(pt 10):2596–2606. | ||
Stupp R, Hegi ME, Mason WP, et al. Effects of radiotherapy with concomitant and adjuvant temozolomide versus radiotherapy alone on survival in glioblastoma in a randomised phase III study: 5-year analysis of the EORTC-NCIC trial. Lancet Oncol. 2009;10(5):459–466. | ||
Prados MD, Levin V. Biology and treatment of malignant glioma. Semin Oncol. 2000;27(3 suppl 6):1–10. | ||
Lacroix M, Abi-Said D, Fourney DR, et al. A multivariate analysis of 416 patients with glioblastoma multiforme: prognosis, extent of resection, and survival. J Neurosurg. 2001;95(2):190–198. | ||
Das P, Puri T, Jha P, et al. A clinicopathological and molecular analysis of glioblastoma multiforme with long-term survival. J Clin Neurosci. 2011;18(1):66–70. | ||
Hartmann C, Hentschel B, Simon M, et al. Long-term survival in primary glioblastoma with versus without isocitrate dehydrogenase mutations. Clin Cancer Res. 2013;19(18):5146–5157. | ||
Jiang H, Ren X, Wang J, Zhang Z, Jia W, Lin S. Short-term survivors in glioblastomas with oligodendroglioma component: a clinical study of 186 Chinese patients from a single institution. J Neurooncol. 2014;116(2):395–404. | ||
Kim YW, Koul D, Kim SH, et al. Identification of prognostic gene signatures of glioblastoma: a study based on TCGA data analysis. Neuro Oncol. 2013;15(7):829–839. | ||
Baur M, Preusser M, Piribauer M, et al. Frequent MGMT (0(6)-methylguanine-DNA methyltransferase) hypermethylation in long-term survivors of glioblastoma: a single institution experience. Radiol Oncol. 2010;44(2):113–120. | ||
Reifenberger G, Weber RG, Riehmer V, et al. Molecular characterization of long-term survivors of glioblastoma using genome- and transcriptome-wide profiling. Int J Cancer. 2014;135(8):1822–1831. | ||
Franceschi S, Mazzanti CM, Lessi F, et al. Investigating molecular alterations to profile short- and long-term recurrence-free survival in patients with primary glioblastoma. Oncol Lett. 2015;10(6):3599–3606. | ||
Bi WL, Beroukhim R. Beating the odds: extreme long-term survival with glioblastoma. Neuro Oncol. 2014;16(9):1159–1160. | ||
Lee Y, Liu J, Patel S, et al. Genomic landscape of meningiomas. Brain Pathol. 2010;20(4):751–762. | ||
Gravendeel LA, Kouwenhoven MC, Gevaert O, et al. Intrinsic gene expression profiles of gliomas are a better predictor of survival than histology. Cancer Res. 2009;69(23):9065–9072. | ||
Lee Y, Scheck AC, Cloughesy TF, et al. Gene expression analysis of glioblastomas identifies the major molecular basis for the prognostic benefit of younger age. BMC Med Genomics. 2008;1:52. | ||
Giltay R, Timpl R, Kostka G. Sequence, recombinant expression and tissue localization of two novel extracellular matrix proteins, fibulin-3 and fibulin-4. Matrix Biol. 1999;18(5):469–480. | ||
Gallaher DD, Khil J. The effect of synbiotics on colon carcinogenesis in rats. J Nutr. 1999;129(7 suppl):1483S–1487S. | ||
de Vega S, Iwamoto T, Yamada Y. Fibulins: multiple roles in matrix structures and tissue functions. Cell Mol Life Sci. 2009;66(11–12):1890–1902. | ||
Han S, Meng L, Wang Y, Wu A. Plasma IGFBP-2 levels after postoperative combined radiotherapy and chemotherapy predict prognosis in elderly glioblastoma patients. PLoS One. 2014;9(4):e93791. | ||
Lin Y, Jiang T, Zhou K, et al. Plasma IGFBP-2 levels predict clinical outcomes of patients with high-grade gliomas. Neuro Oncol. 2009;11(5):468–476. | ||
Shao R, Hamel K, Petersen L, et al. YKL-40, a secreted glycoprotein, promotes tumor angiogenesis. Oncogene. 2009;28(50):4456–4468. | ||
Francescone RA, Scully S, Faibish M, et al. Role of YKL-40 in the angiogenesis, radioresistance, and progression of glioblastoma. J Biol Chem. 2011;286(17):15332–15343. | ||
Akiyama Y, Ashizawa T, Komiyama M, et al. YKL-40 downregulation is a key factor to overcome temozolomide resistance in a glioblastoma cell line. Oncol Rep. 2014;32(1):159–166. | ||
Louis DN, Ohgaki H, Wiestler OD, Cavenee WK, editors. WHO Classfication of Tumors of the Central Nervous system. Lyon: IARC; 2007. | ||
Pfaffl MW. A new mathematical model for relative quantification in real-time RT-PCR. Nucleic Acids Res. 2001;29(9):e45. | ||
Esteller M, Garcia-Foncillas J, Andion E, et al. Inactivation of the DNA-repair gene MGMT and the clinical response of gliomas to alkylating agents. N Engl J Med. 2000;343(19):1350–1354. | ||
Kanemoto M, Shirahata M, Nakauma A, et al. Prognostic prediction of glioblastoma by quantitative assessment of the methylation status of the entire MGMT promoter region. BMC Cancer. 2014;14:641. | ||
Huang da W, Sherman BT, Tan Q, et al. The DAVID Gene Functional Classification Tool: a novel biological module-centric algorithm to functionally analyze large gene lists. Genome Biol. 2007;8(9):R183. | ||
Kanehisa M. The KEGG database. Novartis Found Symp. 2002;247:91–101; discussion 101–103, 119–128, 244–252. | ||
Verhaak RG, Hoadley KA, Purdom E, et al. Integrated genomic analysis identifies clinically relevant subtypes of glioblastoma characterized by abnormalities in PDGFRA, IDH1, EGFR, and NF1. Cancer Cell. 2010;17(1):98–110. | ||
Gerber NK, Goenka A, Turcan S, et al. Transcriptional diversity of long-term glioblastoma survivors. Neuro Oncol. 2014;16(9):1186–1195. | ||
Argraves WS, Greene LM, Cooley MA, Gallagher WM. Fibulins: physiological and disease perspectives. EMBO Rep. 2003;4(12):1127–1131. | ||
Te Riet L, van Deel ED, van Thiel BS, et al. AT1-receptor blockade, but not renin inhibition, reduces aneurysm growth and cardiac failure in fibulin-4 mice. J Hypertens. 2016;34(4):654–665. | ||
Le VP, Yamashiro Y, Yanagisawa H, Wagenseil JE. Measuring, reversing, and modeling the mechanical changes due to the absence of Fibulin-4 in mouse arteries. Biomech Model Mechanobiol. 2014;13(5):1081–1095. | ||
Papke CL, Tsunezumi J, Ringuette LJ, et al. Loss of fibulin-4 disrupts collagen synthesis and maturation: implications for pathology resulting from EFEMP2 mutations. Hum Mol Genet. 2015;24(20):5867–5879. | ||
Igoucheva O, Alexeev V, Halabi CM, et al. Fibulin-4 E57K knock-in mice recapitulate cutaneous, vascular and skeletal defects of recessive cutis laxa 1B with both elastic fiber and collagen fibril abnormalities. J Biol Chem. 2015;290(35):21443–21459. | ||
Xiang Y, Sekine T, Nakamura H, et al. Fibulin-4 is a target of autoimmunity predominantly in patients with osteoarthritis. J Immunol. 2006;176(5):3196–3204. | ||
Yue W, Dacic S, Sun Q, et al. Frequent inactivation of RAMP2, EFEMP1 and Dutt1 in lung cancer by promoter hypermethylation. Clin Cancer Res. 2007;13(15 pt 1):4336–4344. | ||
Furuta J, Nobeyama Y, Umebayashi Y, Otsuka F, Kikuchi K, Ushijima T. Silencing of Peroxiredoxin 2 and aberrant methylation of 33 CpG islands in putative promoter regions in human malignant melanomas. Cancer Res. 2006;66(12):6080–6086. | ||
Chang H, Rha SY, Jeung HC, et al. Identification of genes related to a synergistic effect of taxane and suberoylanilide hydroxamic acid combination treatment in gastric cancer cells. J Cancer Res Clin Oncol. 2010;136(12):1901–1913. | ||
Yuen HF, McCrudden CM, Huang YH, et al. TAZ expression as a prognostic indicator in colorectal cancer. PLoS One. 2013;8(1):e54211. | ||
Yao L, Lao W, Zhang Y, et al. Identification of EFEMP2 as a serum biomarker for the early detection of colorectal cancer with lectin affinity capture assisted secretome analysis of cultured fresh tissues. J Proteome Res. 2012;11(6):3281–3294. | ||
Kehrmann A, Truong H, Repenning A, et al. Complementation of non-tumorigenicity of HPV18-positive cervical carcinoma cells involves differential mRNA expression of cellular genes including potential tumor suppressor genes on chromosome 11q13. Cancer Genet. 2013;206(7–8):279–292. | ||
Chen J, Zhang J, Liu X, Fang R, Zhao Y, Ma D. Overexpression of fibulin-4 is associated with tumor progression and poor prognosis in patients with cervical carcinoma. Oncol Rep. 2014;31(6):2601–2610. | ||
Chen J, Liu Z, Fang S, et al. Fibulin-4 is associated with tumor progression and a poor prognosis in ovarian carcinomas. BMC Cancer. 2015;15:91. | ||
Wlazlinski A, Engers R, Hoffmann MJ, et al. Downregulation of several fibulin genes in prostate cancer. Prostate. 2007;67(16):1770–1780. | ||
Wang L, Chen Q, Chen Z, et al. EFEMP2 is upregulated in gliomas and promotes glioma cell proliferation and invasion. Int J Clin Exp Pathol. 2015;8(9):10385–10393. | ||
Marucci G, Morandi L, Magrini E, et al. Gene expression profiling in glioblastoma and immunohistochemical evaluation of IGFBP-2 and CDC20. Virchows Arch. 2008;453(6):599–609. | ||
Higgins RJ, Dickinson PJ, LeCouteur RA, et al. Spontaneous canine gliomas: overexpression of EGFR, PDGFRalpha and IGFBP2 demonstrated by tissue microarray immunophenotyping. J Neurooncol. 2010;98(1):49–55. | ||
Zhang L, Huang W, Chen J, Zhou X, Lu Z, Zhou H. Expression of IGFBP2 in gastric carcinoma and relationship with clinicopathologic parameters and cell proliferation. Dig Dis Sci. 2007;52(1):248–253. | ||
McDonald KL, O’ullivan MG, Parkinson JF, et al. IQGAP1 and IGFBP2: valuable biomarkers for determining prognosis in glioma patients. J Neuropathol Exp Neurol. 2007;66(5):405–417. | ||
Santosh V, Arivazhagan A, Sreekanthreddy P, et al. Grade-specific expression of insulin-like growth factor-binding proteins-2, −3, and −5 in astrocytomas: IGFBP-3 emerges as a strong predictor of survival in patients with newly diagnosed glioblastoma. Cancer Epidemiol Biomarkers Prev. 2010;19(6):1399–1408. | ||
Zheng S, Houseman EA, Morrison Z, et al. DNA hypermethylation profiles associated with glioma subtypes and EZH2 and IGFBP2 mRNA expression. Neuro Oncol. 2011;13(3):280–289. | ||
Kulkarni A, Thota B, Srividya MR, et al. Expression pattern and prognostic significance of IGFBP isoforms in anaplastic astrocytoma. Pathol Oncol Res. 2012;18(4):961–967. | ||
Li Y, Jiang T, Zhang J, et al. Elevated serum antibodies against insulin-like growth factor-binding protein-2 allow detecting early-stage cancers: evidences from glioma and colorectal carcinoma studies. Ann Oncol. 2012;23(9):2415–2422. | ||
Gallego Perez-Larraya J, Paris S, Idbaih A, et al. Diagnostic and prognostic value of preoperative combined GFAP, IGFBP-2, and YKL-40 plasma levels in patients with glioblastoma. Cancer. 2014;120(24):3972–3980. | ||
Levitt RJ, Georgescu MM, Pollak M. PTEN-induction in U251 glioma cells decreases the expression of insulin-like growth factor binding protein-2. Biochem Biophys Res Commun. 2005;336(4):1056–1061. | ||
Mehrian-Shai R, Chen CD, Shi T, et al. Insulin growth factor-binding protein 2 is a candidate biomarker for PTEN status and PI3K/Akt pathway activation in glioblastoma and prostate cancer. Proc Natl Acad Sci U S A. 2007;104(13):5563–5568. | ||
Jiang R, Mircean C, Shmulevich I, et al. Pathway alterations during glioma progression revealed by reverse phase protein lysate arrays. Proteomics. 2006;6(10):2964–2971. | ||
Wang GK, Hu L, Fuller GN, Zhang W. An interaction between insulin-like growth factor-binding protein 2 (IGFBP2) and integrin alpha5 is essential for IGFBP2-induced cell mobility. J Biol Chem. 2006;281(20):14085–14091. | ||
Holmes KM, Annala M, Chua CY, et al. Insulin-like growth factor-binding protein 2-driven glioma progression is prevented by blocking a clinically significant integrin, integrin-linked kinase, and NF-kappaB network. Proc Natl Acad Sci U S A. 2012;109(9):3475–3480. | ||
Han S, Li Z, Master LM, Master ZW, Wu A. Exogenous IGFBP-2 promotes proliferation, invasion, and chemoresistance to temozolomide in glioma cells via the integrin beta1-ERK pathway. Br J Cancer. 2014;111(7):1400–1409. | ||
Wang H, Shen W, Huang H, et al. Insulin-like growth factor binding protein 2 enhances glioblastoma invasion by activating invasion-enhancing genes. Cancer Res. 2003;63(15):4315–4321. | ||
Godard S, Getz G, Delorenzi M, et al. Classification of human astrocytic gliomas on the basis of gene expression: a correlated group of genes with angiogenic activity emerges as a strong predictor of subtypes. Cancer Res. 2003;63(20):6613–6625. | ||
Zhou YH, Hess KR, Liu L, Linskey ME, Yung WK. Modeling prognosis for patients with malignant astrocytic gliomas: quantifying the expression of multiple genetic markers and clinical variables. Neuro Oncol. 2005;7(4):485–494. | ||
Fukushima T, Tezuka T, Shimomura T, Nakano S, Kataoka H. Silencing of insulin-like growth factor-binding protein-2 in human glioblastoma cells reduces both invasiveness and expression of progression-associated gene CD24. J Biol Chem. 2007;282(25):18634–18644. | ||
Martino-Echarri E, Fernandez-Rodriguez R, Bech-Serra JJ, et al. Relevance of IGFBP2 proteolysis in glioma and contribution of the extracellular protease ADAMTS1. Oncotarget. 2014;5(12):4295–4304. | ||
Moore LM, Holmes KM, Smith SM, et al. IGFBP2 is a candidate biomarker for Ink4a-Arf status and a therapeutic target for high-grade gliomas. Proc Natl Acad Sci U S A. 2009;106(39):16675–16679. | ||
Li X, Liu Y, Granberg KJ, et al. Two mature products of MIR-491 coordinate to suppress key cancer hallmarks in glioblastoma. Oncogene. 2015;34(13):1619–1628. |
 © 2017 The Author(s). This work is published and licensed by Dove Medical Press Limited. The
full terms of this license are available at https://www.dovepress.com/terms
and incorporate the Creative Commons Attribution
- Non Commercial (unported, 3.0) License.
By accessing the work you hereby accept the Terms. Non-commercial uses of the work are permitted
without any further permission from Dove Medical Press Limited, provided the work is properly
attributed. For permission for commercial use of this work, please see paragraphs 4.2 and 5 of our Terms.
© 2017 The Author(s). This work is published and licensed by Dove Medical Press Limited. The
full terms of this license are available at https://www.dovepress.com/terms
and incorporate the Creative Commons Attribution
- Non Commercial (unported, 3.0) License.
By accessing the work you hereby accept the Terms. Non-commercial uses of the work are permitted
without any further permission from Dove Medical Press Limited, provided the work is properly
attributed. For permission for commercial use of this work, please see paragraphs 4.2 and 5 of our Terms.