")
Back to Journals » Clinical, Cosmetic and Investigational Dermatology » Volume 16
Fatty Acid Metabolism-Related lncRNAs are Potential Biomarkers for Predicting Prognoses and Immune Responses in Patients with Skin Cutaneous Melanoma
Authors Wang X , Yang X, Zhang Y, Guo A, Luo S, Xiao M, Xue L, Zhang G , Wang H
Received 1 June 2023
Accepted for publication 25 November 2023
Published 15 December 2023 Volume 2023:16 Pages 3595—3614
DOI https://doi.org/10.2147/CCID.S417805
Checked for plagiarism Yes
Review by Single anonymous peer review
Peer reviewer comments 2
Editor who approved publication: Dr Jeffrey Weinberg
Xing Wang,1,2,* Xiaojing Yang,1,3,* Yiming Zhang,1 Afei Guo,1 Suju Luo,1 Meng Xiao,1 Lu Xue,1 Guohui Zhang,2 Huiping Wang1
1Department of Dermatovenereology, Tianjin Medical University General Hospital, Tianjin, People’s Republic of China; 2Department of Dermatovenereology, Baotou Central Hospital, Baotou City, Inner Mongolia, People’s Republic of China; 3Department of Dermatovenereology, the First Affiliated Hospital of Hebei North University, Zhangjiakou, Hebei, People’s Republic of China
*These authors contributed equally to this work
Correspondence: Huiping Wang; Guohui Zhang, Email [email protected]; [email protected]
Introduction: Skin cutaneous melanoma is becoming more dangerous since it has a poor prognosis and is resistant to treatment. Previous research has shown that lncRNAs and fatty acid metabolism are essential for numerous biological activities. There are no studies on the relationship between fatty acid metabolism-Related lncRNAs and skin cutaneous melanoma.
Methods and Results: In order to better understand the prognosis and survival of SKCM patients, we investigated the significance of lncRNAs related to fatty acid metabolism. In this work, we looked at the fatty acid metabolism genes and lncRNAs expression patterns. On the basis of lncRNAs associated with fatty acid metabolism, a nomogram and a prognosis prediction model were created. Based on the profile of lncRNAs associated with fatty acid metabolism, functional and pharmacological sensitivity investigations were also carried out. We also looked at the connection between immunotherapy and the immune response. The findings demonstrated that a risk score model based on 11 essential lncRNAs for fatty acid metabolism may discriminate between the clinical condition of SKCM and more accurately predict prognosis and survival. We conducted quantitative reverse transcription polymerase-chain reaction (RT-PCR) to verify the model.
Conclusion: These important lncRNAs further showed a strong association with the tumor immune system, and these important lncRNAs also showed a connection between SKCM and chemotherapeutic treatment sensitivity. Our research strives to provide fresh viewpoints and innovative approaches to the treatment and administration of SKCM.
Keywords: skin cutaneous melanoma, lncRNA, fatty acid metabolism, bioinformatics, tumor immune
Introduction
Skin cutaneous melanoma (SKCM), as one of the most aggressive types of cancer due to its elevated degree of heterogeneity, has gained increasing attention during the past few decades.1 Also known as “the cancer that rises with the sun”,2 melanoma originates from cancerous melanocytes due to molecular or genetic mutation. Currently, surgical excision remained the most effective approach, especially for patients with clinical stage II (dermal spread of the tumor) or III melanoma (regional lymph node spread).3 As for stage I, there were also data suggesting that expeditious treatment was associated with improved outcomes especially early initial biopsy,4 which emphasized the critical role which early detection and treatment played in the prognosis of SKCM. Recently, many approaches have been achieved in immunotherapy and targeted therapy. The FDA recently approved the use of ipilimumab, an antibody-mediated CTLA-4 (cytotoxic T-lymphocyte-associated antigen-4) blockade, to treat metastatic melanoma. Programmed cell-death protein 1 (PD-1) immune checkpoints were also widely used in clinical treatment.5 Longer follow-up was required to determine the impact of CTLA-4-PD-1 inhibition, and more precise immunotherapy biomarkers also remained a huge urgent need, according to advanced randomized controlled trials undertaken to assess immune targeted treatment.6 Thus, it is of great importance to explore a deeper relationship between clinical phenotype and molecular pathways to discover more precise biomarkers and gene agents for early forecast and long-term prognosis in patients with SKCM.
Fatty acid metabolism, as one of the three major nutrient metabolisms, has been increasingly recognized in cancer development in recent decades.7 Apart from the well-known “Warburg effect”, the enhanced anaerobic metabolism even under the circumstance of sufficient oxygen supply due to the unbalance of urgent nutrition supply and the vigorous growth of cancer cells, dysregulation of fatty acids and amino acids have been verified to function in cancer cells development.8 Additionally, research has shown that metabolic reprogramming, such as de novo fatty acid production and fatty acid oxidation, might be used for anticancer therapy by pharmacologically inhibiting cell growth.9 While how fatty acid metabolism influences SKCM and specific molecular pathways still remains a misery. At the same time, several publications have pointed out the crosstalk between fatty acid and lncRNA, which means non-coding RNAs of more than 200 nucleotides.10,11 As a result of molecular biology advancements, more and more lncRNAs have been discovered to play crucial regulatory roles in the development of cancer, highlighting the significance of bioinformatics technique advancements in the role of lncRNAs in several clinical diseases, especially cancer.12 The tumor microenvironment (TME), which is made up of a variety of immune cells, stromal cells, and vessel system to influence the development of tumor cells and act as anti-cancer targets, is just one of the factors that could regulate the initiation, progression, and metastasis of cancer cells in addition to the link between fatty acid metabolism and lncRNAs.13 However, how TME correlates with lncRNAs to moderate fatty acid metabolism in cancer progression, especially in SKCM is still not fully illustrated.
Herein, we conducted a comprehensive evaluation and prognosis system to analyze how lncRNAs and immune infiltration moderate fatty acid metabolism to influence cancer development in patients with SKCM, and then provide potential immune checkpoints and therapeutic targets for clinical treatment.
Method
Data Acquisition and Processing
This study’s SKCM patients’ gene transcript, mutation, and clinical prognostic data were all retrieved from the TCGA database (The Cancer Genome Atlas, https://www.cancer.gov/ccg/research/genome-sequencing/tcga).470 samples of SKCM patients were eventually included in this analysis after samples with incomplete prognostic information or survival times of less than 30 days were disregarded. Training and test groups are created using random selection from these samples. The KEGG database was used to download genes linked to fatty acid metabolism (FAM), and a total of 92 genes that were confirmed to be involved in the FAM regulatory pathway were chosen for this investigation.
Identification of FAM-Related lncRNAs
According to the annotation file of lncRNA downloaded from the GENCODE database (https://www.gencodegenes.org/human/), we discovered 16773 lncRNAs. To further identify FAM-related lncRNAs that met the filter requirements (|R| 0.4 and p-value 0.001), a Pearson correlation test was performed.
Construction of FAM-Related Risk Model
Univariate regression analysis was utilized in conjunction with patient prognostic data to identify the differential FAM-related lncRNAs linked with prognosis. Then, we used LASSO regression14 (R package “glmnet”) to perform 1000 cycles of 10-fold cross-validation with a p-value of 0.05 and discovered 25 lncRNAs that were directly related to the prognosis of SKCM patients. Finally, an 11 FAM-related lncRNA risk model was created by multivariate regression analysis. We used the algorithm below to get the risk score.

The “survminer” program utilized the ideal cut-off value to categorize all patients into high or low risk subgroups for each SKCM patient using the aforementioned algorithm to determine risk level.
Risk Model Testing and Evaluation
To determine if the risk model could be utilized as a standalone predictor of prognosis in SKCM patients, we conducted univariate and multivariate regression analysis, respectively, and built ROC curves using the R packages glmnet, survminer, and survival. We generated and presented 1-, 3-, and 5-year ROC curves altogether.
Survival Analysis and PCA Analysis
The “survival” package’s K-M analysis was used to compare the overall survival (OS) rates of two groups of SKCM patients. High-dimensional data may be effectively reduced in dimension via the use of principal component analysis (PCA) and t-distributed stochastic neighbor embedding (t-SNE).
Nomogram Construction
We merged the risk scores, age, gender, and TNM classification of SKCM patients to create a nomogram via “RMS” program, and to more effectively guide the clinical diagnosis and management of SKCM, we used the Hosmer–Lemeshow test to evaluate the degree of fit.
Tumor Microenvironment and Immunotherapy Analysis
Tumor mutational burden (TMB) in SKCM patients was assessed and calculated using the “maftools” R package. In addition, the immune cell infiltration status of different risk score groups was assessed using the CIBERSORT15 and ssGSEA algorithm, as well as TIMER (http://timer.comp-genomics.org/).16 TME scores and immunological checkpoints comparing samples of various risk categories were computed and compared using the ggpubr (version 0.4.0) R package in order to more properly depict the immune system alterations in SKCM patients.
Drug Sensitivity Analysis
The Genomics of Drug Sensitivity in Cancer (GDSC)17 platform and the R package pRRophetic (version 0.5) were used for calculation and visualization to determine the half-maximal inhibitory concentration (IC50) of each SKCM patient in relation to a common antineoplastic drug.
Functional Analysis
The GSEA analysis was conducted using software for gene set enrichment analyses (https://www.gsea-msigdb.org/gsea/login.jsp) (p0.05 and FDR0.25 were considered statistically significant).18 Based on the different expressed genes between two different risk groups (identified by package “limma”, |Log2FC| > 1.0, p-value 0.05), Go and KEGG enrichment analyses were carried out using the DAVID online site (version 6.8), where pertinent annotations with p 0.05 and FDR 0.05 were considered significantly different. In addition, Cytoscape (version 3.6.1) was used to build and display lncRNA-mRNA interaction networks.
Statistical Analysis
R program (Version 4.1.1) was used for all statistical analysis. To find the difference between the two groups, Student’s t-tests were used. The Log rank test was used to analyze differences between K-M curves. A p-value of 0.05 or below is considered statistically significant if there is no other explanation for the aforementioned approach.
Results
FAM-Related LncRNAs in SKCM Patients
The clinical characteristics of a total of 455 patients (228 in the training set, while 227 in the testing set) with SKCM are shown in Supplementary Table 1. The 92 (FAM)-related genes obtained from the KEGG data can be found in Supplementary Table 2. The FAM-related lncRNA co-expression network was displayed in the form of a Sankey diagram (Figure 1A), of which 488 were identified as FAM-related lncRNAs (r>0.4, p < 0.001, Supplementary Table 3). The relationship between FAM-related genes and lncRNAs can be seen in Figure 1B.
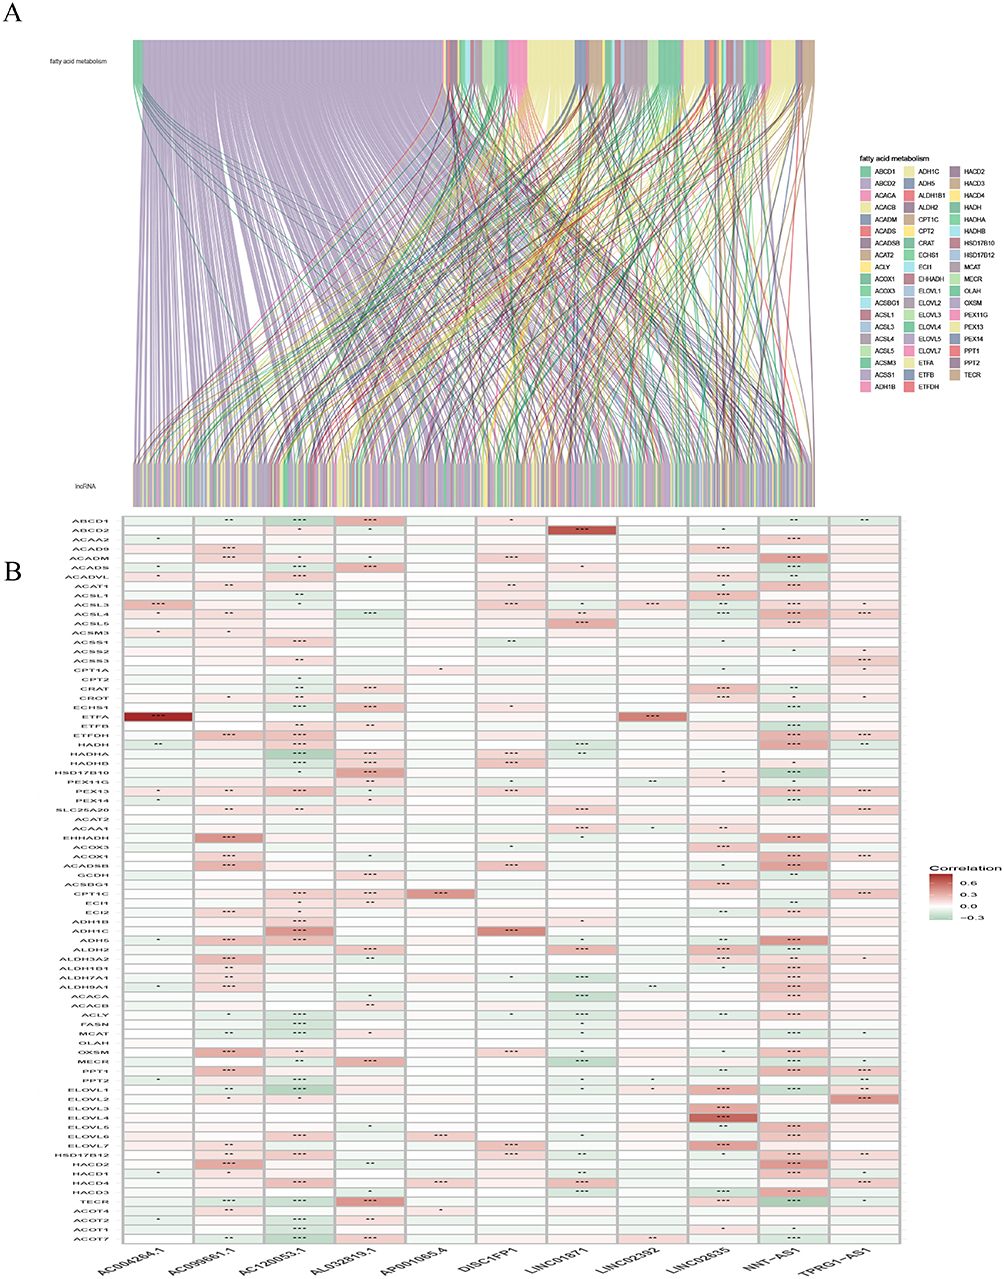 |
Figure 1 Identification of fatty acid metabolism-related lncRNAs in LUAD patients. (A) Sankey relation diagram for 92 fatty acid metabolism genes and fatty acid metabolism-related lncRNAs. (B) Heatmap for the correlations between randomly fatty acid metabolism-related genes and the 11 prognostic fatty acid metabolism-related lncRNAs, (P <0.05*.P <0.01**.P<0.001***). |
Risk Model Construction and Validation
By univariate COX regression analysis, 178 FAM-related lncRNAs were first screened (Supplementary Table 4). Further LASSO Cox analysis identified 25 lncRNAs highly correlated with SKCM prognosis (Figure 2A and B). Finally, 11 FAM-related lncRNAs with the strongest prognostic predictive ability were identified by multivariate COX regression analysis (Figure 2C, Supplementary Table 5) for risk model construction.
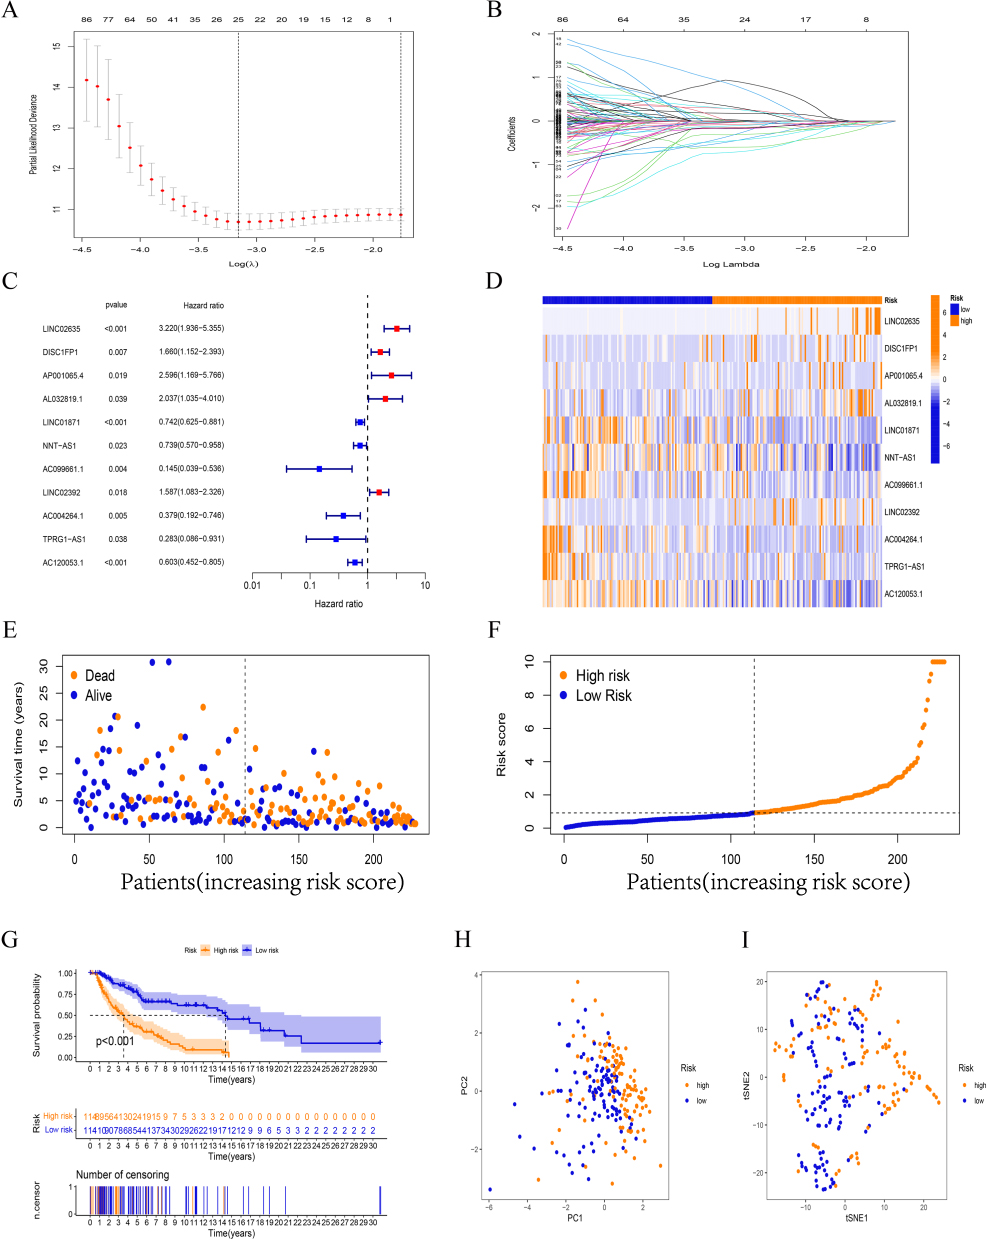 |
Figure 2 Construction and validation of risk model in the training set. (A, B) Altogether 19 lncRNAs were selected by LASSO regression. (C) Multivariate Cox regression analysis showed 11 independent prognostic lncRNAs. (D) Heatmap to show the expression of 11 lncRNAs between high- and low-risk groups in the training set. (E-F) Different patterns of survival status/time and distribution of sample risk score between the high-risk and low-risk groups in the training set. (G) Kaplan–Meier curve of high-risk and low-risk patients in the training set. (H) PCA analysis. (I) tSNE tses. |
The formula for the risk score is:
Risk scores = expression of LINC02635 × (1.33199216728219) + expression of DISC1FP1 × (0.511374903636262) + expression of AP001065.4 × (1.92788134463082) + expression of AL032819.1 × (0.905439316962729) + expression of LINC01871 × (−0.193074990172509) + expression of NNT-AS1 × (−0.291235901104001) + expression of AC099661.1 × (−1.35582401383763)+ expression of LINC02392 × (0.672054901141788) + expression of AC004264.1 × (−0.97049582156531) + expression of TPRG1-AS1 × (−1.64497380823641) + expression of AC120053.1 × (−0.357203764155365).
Based on the mean calculated by the above formula, we divided SKCM patients into high-risk group and low-risk group, and the differences in the expression of 11 hub lncRNAs in different samples are shown in Figure 2D. In the training set, the survival time of patients with different risk scores, distribution See Figure 2E and F, respectively. The K-M survival analysis showed that in the training set, the difference in the prognosis of different groups of patients was well differentiated according to the risk score (Figure 2G). PCA analysis and the t-SNE test suggested better component heterogeneity within the training set (Figure 2H and I).
Correspondingly, Figures 3 and 4 show the results of applying the risk model to the testing and entire sets. The survival time/status of patients with different risk scores in these sets, and the differences in the expression of 11 hub lncRNAs between high- and low-risk patients are shown in Figures 3A–C and 4A–C, respectively. K-M survival analysis showed that the risk score model still had a good ability to predict the prognosis of different risk subgroups in the testing set (p < 0.05, Figure 3D) as well as the entire group (p < 0.001, Figure 4D). PCA analysis and tSNE test suggested that the samples in the testing and entire set had good intergroup heterogeneity (Figures 3E, F and 4E, F).
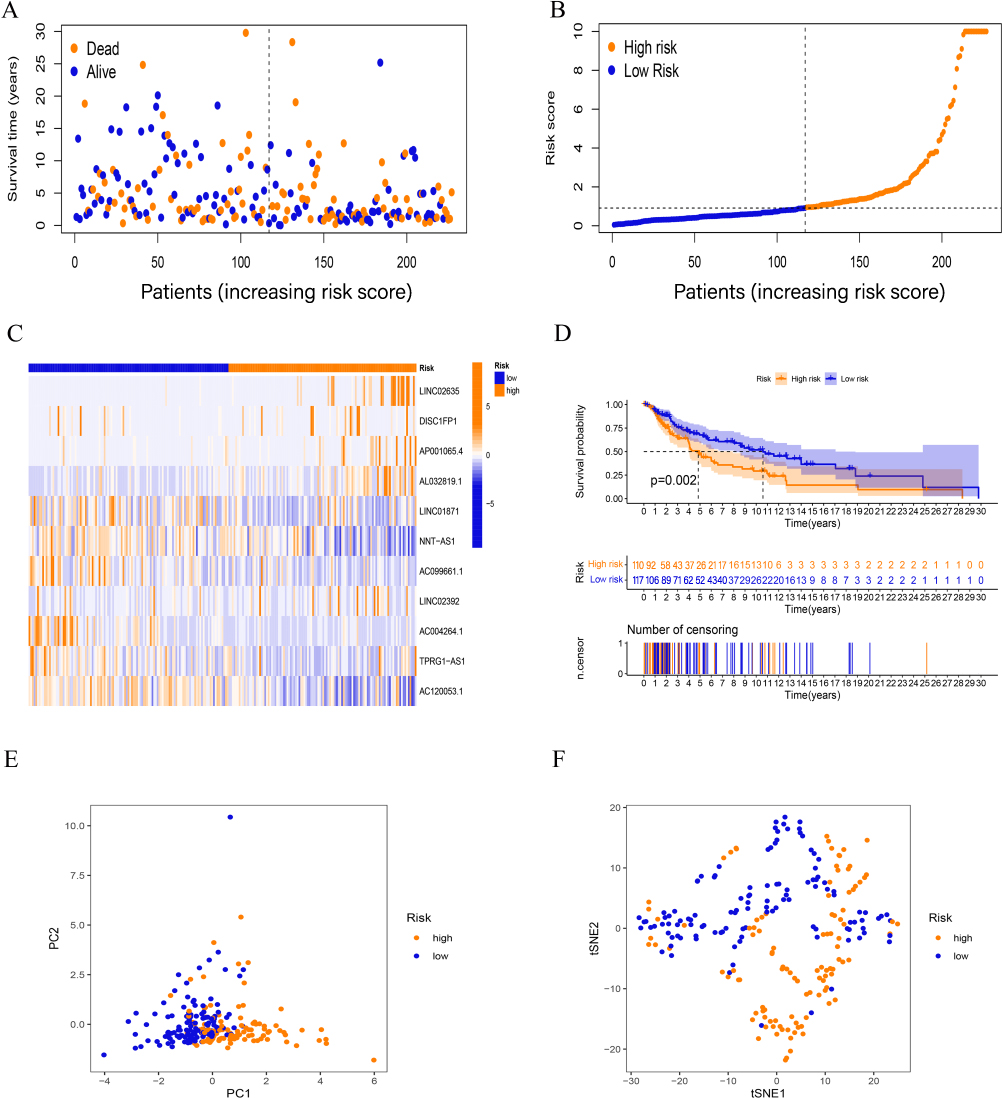 |
Figure 3 Validation of prognostic FAMs-related lncRNA signature. (A-C) The survival time/status, risk score, and (C) heatmap for the testing set. (D) Kaplan–Meier curve for the testing set. (E-F) PCA and tSNE test for the testing set. |
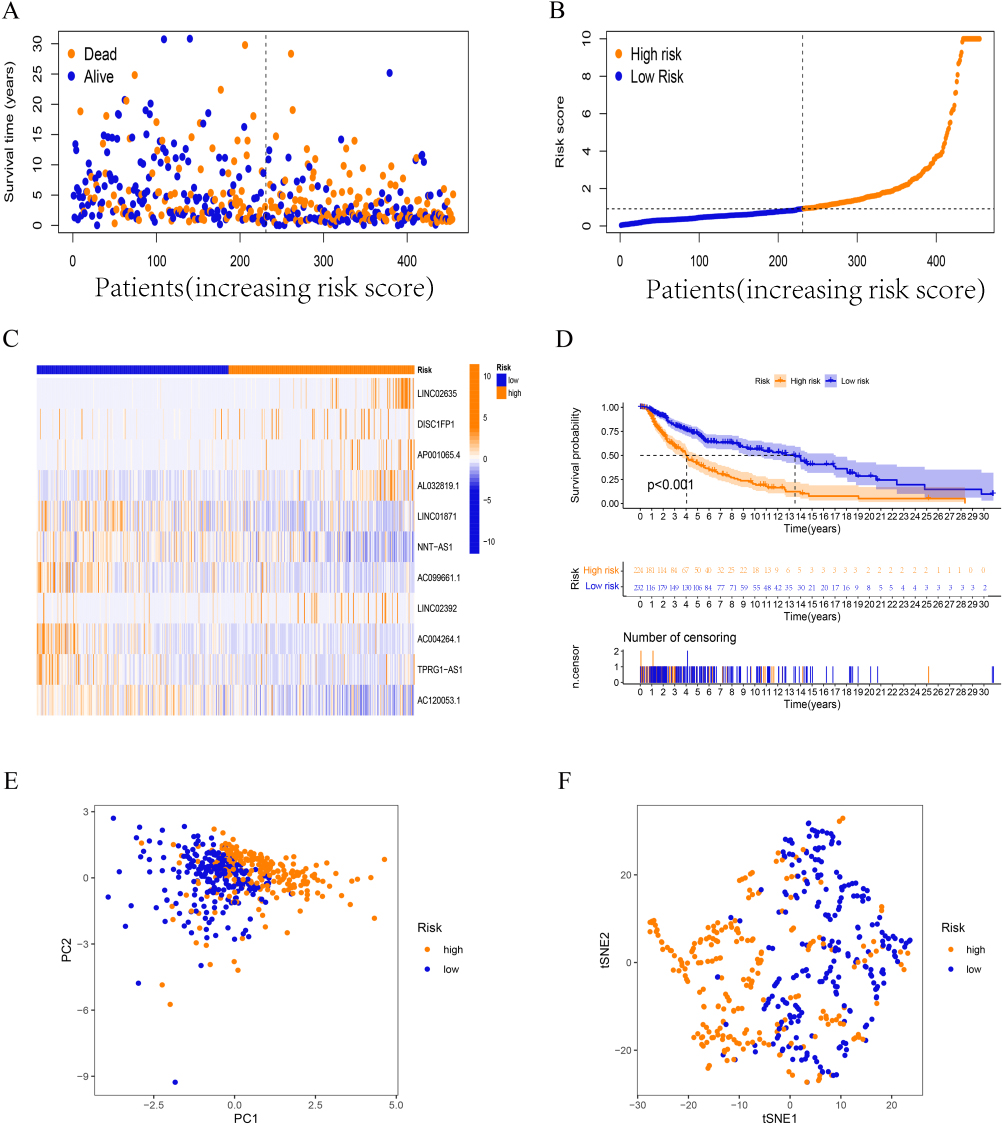 |
Figure 4 Validation of prognostic FAMs-related lncRNA signature. (A-C) The survival time/status, risk score, and (C) heatmap for the entire set. (D) Kaplan–Meier curve for the entire set. (E-F) PCA and tSNE test for the entire set. |
Nomogram and Independent Prognostic Factor Analysis
We carried conducted univariate and multivariate Cox regression analyses, respectively, to investigate the independent predictive potential of risk models and other clinical factors for patient outcomes. Age, T/N grade, clinical stage, and risk score were all identified as prognostic markers for SKCM patients by univariate Cox regression analysis (HR=1.194(1.134–1.257), p<0.05, Figure 5A), and additional multivariate Cox regression analysis demonstrated that the risk score was a valid independent predictor of prognosis in SKCM patients, with a greater degree of confidence in the prediction outcomes than other clinical parameters. (HR=1.208(1.141–1.278), p<0.001, Figure 5B). The same illustration are also shown in the ROC curves, which the AUC of risk score model at 1, 3, 5-years were 0.828, 0.787 and 0.808 (Figure 5C). The overall AUC of the Risk score model was also higher than other clinical characteristics (Figure 5D) as same as what the C-index curve shown (Figure 5E). As for the nomogram (Figure 5F), its accuracy was high enough between the actual observed and predicted values (Figure 5G), which also show an exciting predictive power verified by the DCA cure at 1, 3, 5-years, respectively (Figure 5H–J).
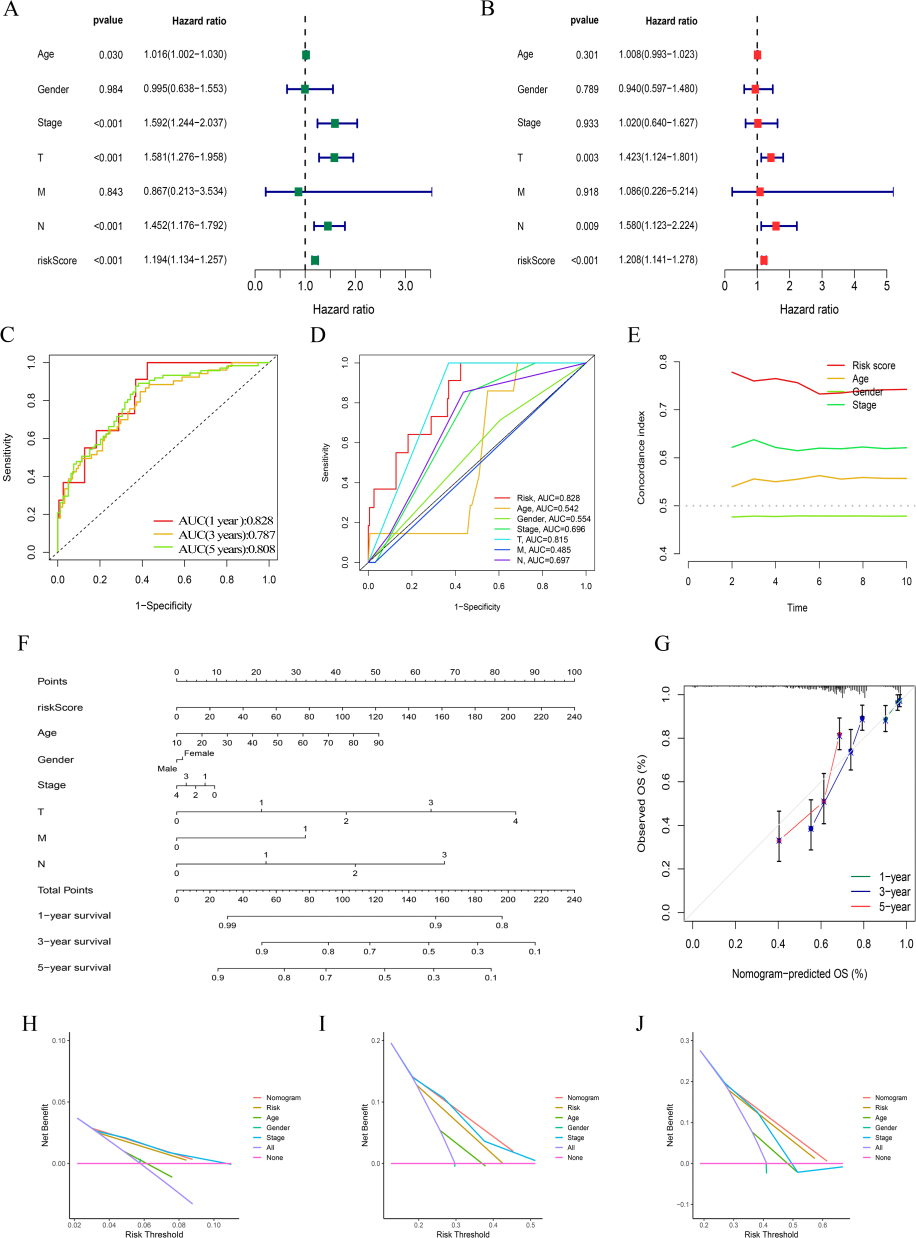 |
Figure 5 Independent prognostic factors and construction of the nomogram. (A) Univariate analysis of the clinical characteristic and risk score. (B) Multivariate analysis of the clinical characteristic and risk score. (C-D) The risk model predicts the probability of the 1-, 3-, and 5-year OS and compared it to other clinical features. (E) The calibration plot of the nomogram indicates the probability of the 1-, 3-, and 5-year OS, Concordance indexes of the risk score and clinical features. (F) The nomogram. (G) The accuracy of nomogram prediction at 1-, 3-, and 5-years. (H-J) The DCA of the nomogram at 1-, 3-, and 5-years. |
In addition to the longitudinal validation of the risk model, we also performed a horizontal comparison of the risk models constructed using all genes, FAM-related genes, all FAN-related lncRNAs, and 11FAM-related lncRNAs using PCA analysis to demonstrate the truthfulness of our key lncRNA risk model predictions performance and accuracy (Figure 6A–D).
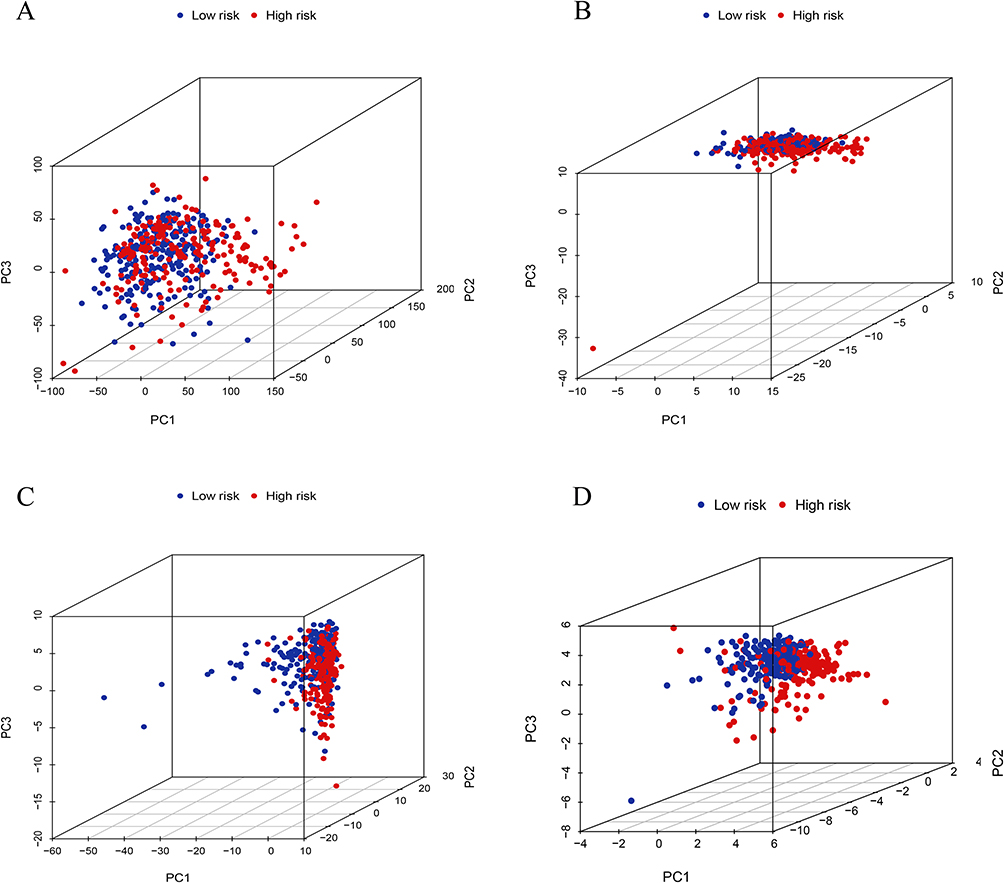 |
Figure 6 PCA analysis depends on different gene risk models. PCA between the high-risk and low-risk groups based on (A) all genes, (B) FAM-related genes, (C) all FAN-related lncRNA, and (D) eleven FAM-related lncRNA risk models. |
Using various clinical feature groups based on risk score grouping, we conducted the K-M analysis to further demonstrate the validity of our model. Patients in the low-risk category had a better prognosis than those in the high-risk group, according to the findings (Figure 7).
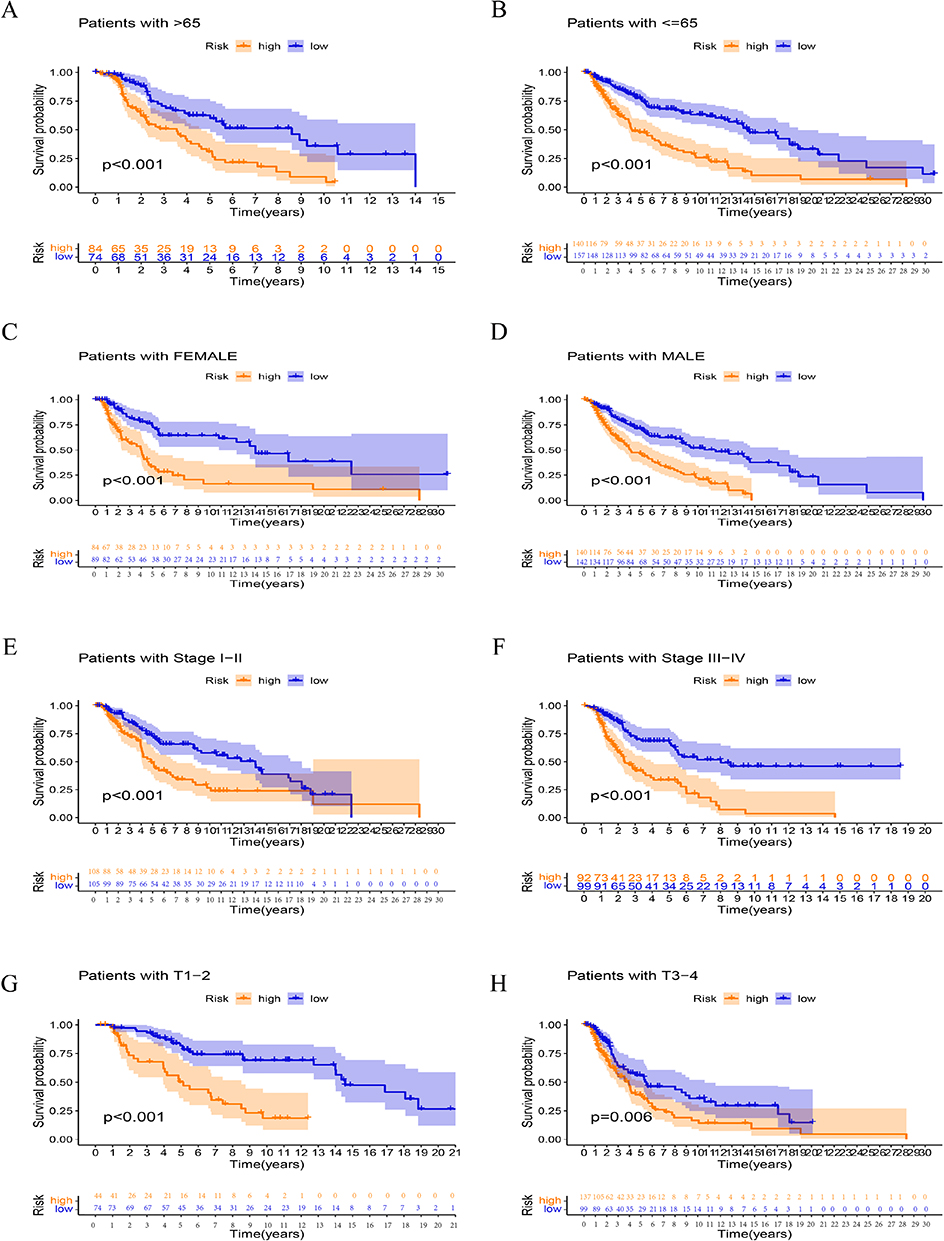 |
Figure 7 Kaplan–Meier curves of OS difference stratified by SKCM age (>65 (A) or <=65 (B)), gender (female (C) or male (D)), grade (I–II (E) or III–IV (F)), and TNM stage (T1-2 (G) or T3-4 (H)) between the different sub-group in the entire set. |
Somatic Mutation Landscape
The mutation rate in the high-risk group was comparatively low (87.89%, Figure 8A and B), compared to the low-risk group’s somatic mutation rate of 96.07%. As a result, the high-risk group had a lower TMB (Figure 8C). TMB in SKCM was shown to be negatively connected with risk score by correlation analysis (Figure 8D). This suggests that the risk scores of SKCM patients are closely related to TMB. Interestingly, TMB score can differentiate the prognosis of patients, high TMB tends to have a better prognosis (Figure 8E), based on this, we found that using risk score, we can further subdivide patients with TMB score grouping, the same high TMB Patients with different risk scores can also distinguish differences in prognosis (Figure 8F), which indicates that our risk score model is a more accurate evaluation model than TMB.
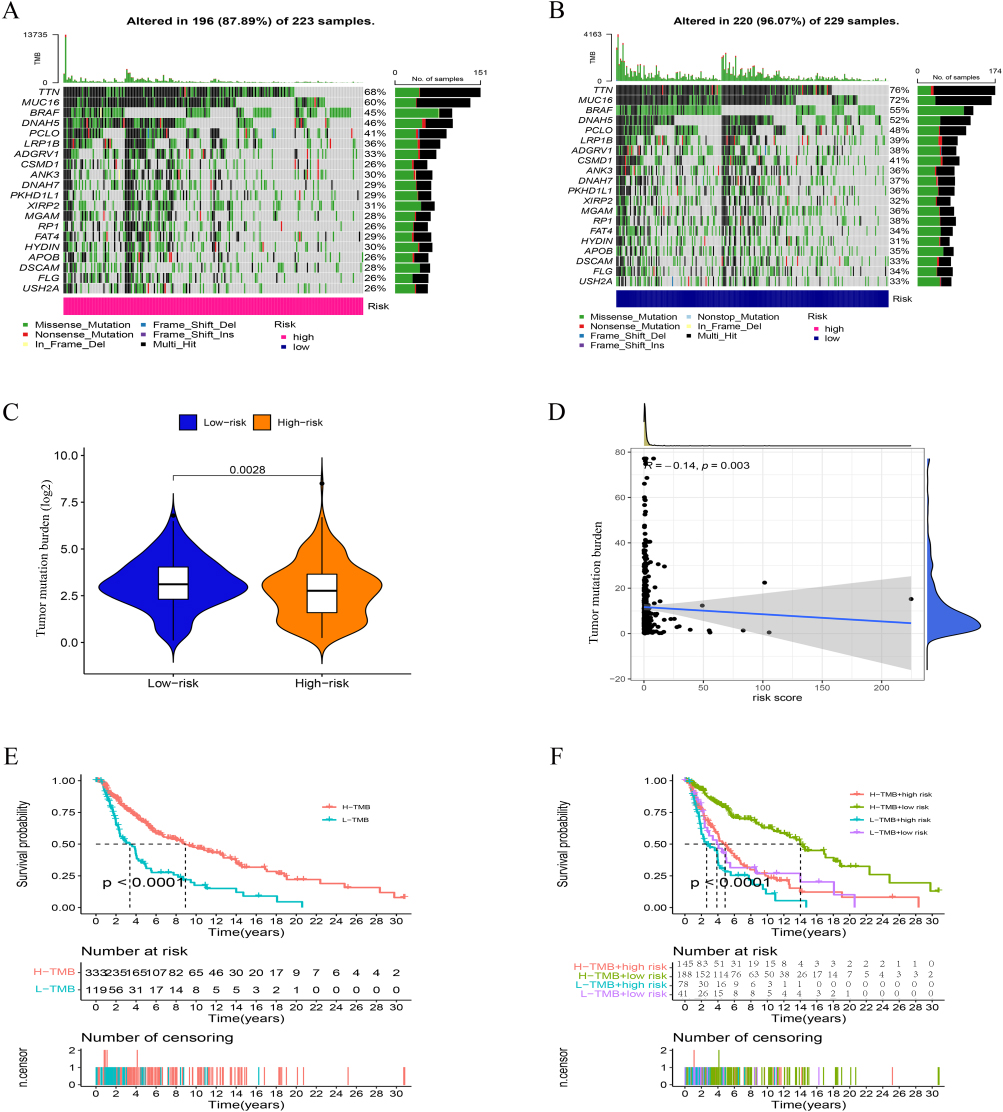 |
Figure 8 TMB analysis. (A, B) The waterfall plot of somatic mutation features established with high- and low-risk groups. (C) Tumor mutation burden in the high-risk and low-risk groups. (D) The correlation between risk score and TMB. (E-F) Kaplan–Meier curve of the OS among the high- and low- TMB groups. |
Immune Signature Analysis Based on FAM-Related lncRNAs
The immunological score reveals that the stromal, immune, and ESTIMATE scores are lower in the high-risk group (Figure 9A–C). Based on the CIBERSORT algorithm, Figure 9D and E shows the proportion of 22 immune cells in different risk groups in the SKCM sample. Supplementary Table 6 has comprehensive data. Additional ssGSEA immunoassays revealed that samples from the high-risk group exhibited greater variety and less immune cell infiltration, including CD8+ T cells, neutrophils, and NK cells. In comparison to the low-risk group, the immune system’s activity was also decreased (Figure 9F, G. Supplementary Table 7). According to the aforementioned findings, patients who were at a greater risk of developing SKCM had more severe immunosuppression.
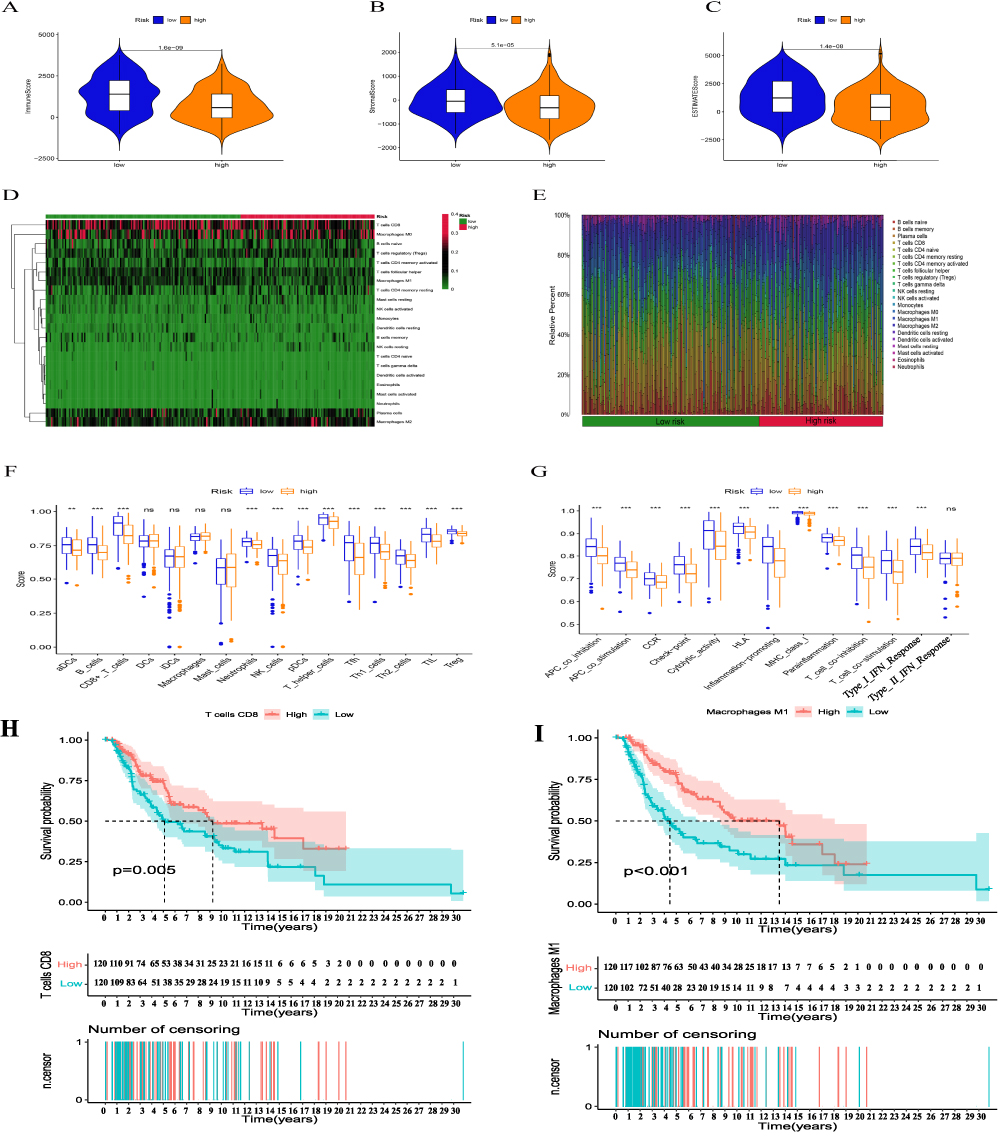 |
Figure 9 Immune infiltration discrepancy in different risk groups. (A-C) The TME scores between high- and low-risk groups. Heatmap of 22 tumor-infiltrating immune cell types in low- and high-risk groups (D). Bar chart of the proportions for 22 immune cell types (E). (F, G) The differences between the immune cell populations (F), and immune functions (G) between high risk and low risk group using the ssGSEA algorithm,(H-I) Analysis of the combined immune cells’ survival,(P <0.01**.P<0.001***). |
Intriguingly, we discovered that CD8+ T cells and M1 macrophages could accurately predict the prognosis of patients in different risk groups when using the immune cell infiltration fraction (Figure 9H and I), but the ssGSEA results revealed that total macrophage infiltration did not differ between high- and low-risk groups, which may be due to different macrophage subtypes.
Clinical Immunotherapy Analysis
Anti-tumor medications have progressively become more varied as a result of recent in-depth study on tumor immunology, yet tumor resistance has always been an important problem in clinical therapy. Drug sensitivity study revealed that patients with SKCM in the high-risk group had higher IC50s for five anticancer medications, including ATRA and AS601245, suggesting that these medications may be clinically less efficacious for these patients. A.770047, AZ628 and AUY922 on the other hand, had larger IC50 in the low-risk group, suggesting that these three medications may be better suited for the treatment of high-risk SKCM patients (Figure 10A). To explain the different drug susceptibility performances, we explored the correlation between drug sensitivity and hub lncRNAs (Figure 10B, Supplementary Table 8), and the results showed that these 11 FAM-related lncRNAs were associated with multiple drug resistance There was a correlation between them, with the highest positive correlation with Procarbazine (r=0.413) and the most negative correlation with Ironfulven (r=−0.417). Immediately thereafter, the immune checkpoint score results of different risk groups also suggested that the low-risk group had more extensive immune checkpoint hyperresponsiveness (Figure 10C), which may explain why multiple antitumor drugs are more effective in the treatment of patients in the high-risk group.
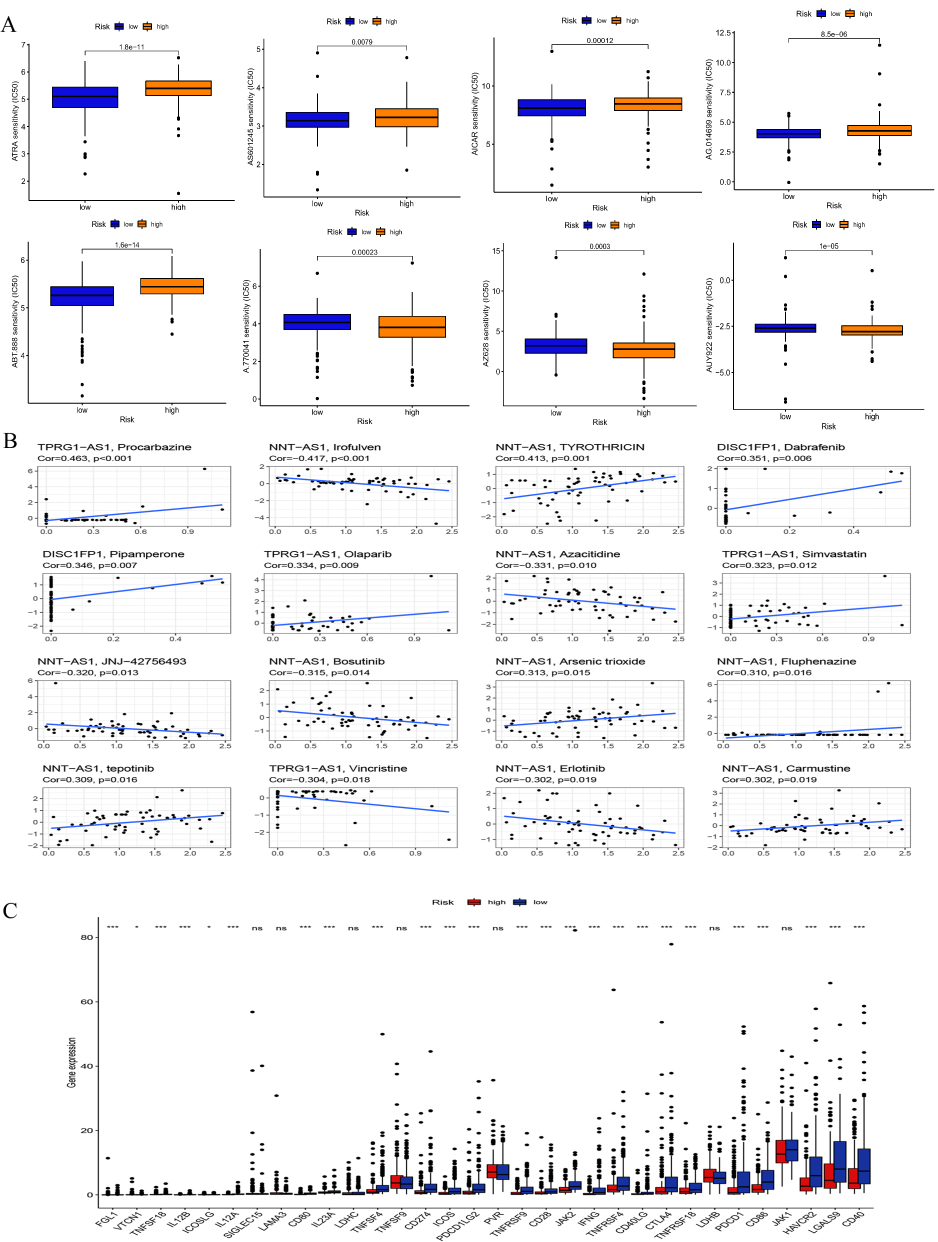 |
Figure 10 Clinical application of the risk signature. (A) IC50 of anti-tumor drugs among different subgroups. (B) Drug susceptibility correlation analysis. (C) Immune checkpoint analysis, (P <0.05*, P <0.001***). |
Functional Analysis
We carried out matching functional enrichment analysis to thoroughly investigate how FAM-related lncRNAs have biological impacts. We carried out matching functional enrichment analysis to thoroughly investigate how FAM-related lncRNAs have biological impacts. The findings of Go analysis revealed that alterations in T cells and B cells were among the immunological processes affected by SKCM (Figure 11A), and the KEGG results suggested that humoral immune pathways were substantially linked with the illness (Figure 11B). In the high-risk group, the oxidative phosphorylation, glyoxylate, and dicarboxylate metabolic pathways were considerably altered, according to the findings of the GSEA enrichment analysis (Figure 11C), but in the low-risk group, the JAK-STAT signaling pathway was more dramatically altered (Figure 11D). In addition, we also explored the role of these 11 FAM-related lncRNAs on the prognosis of patients at the molecular level. Among them, 6 lncRNAs, including AL032819, AP001065.4, etc., were risk factors for SKCM, and the remaining 5 lncRNAs played a protective role, which is consistent with the calculated coefficients of our risk model (Figure 11E), and the construction of ceRNA network further explains how these lncRNAs interact with mRNAs and ultimately affect SKCM progression (Figure 11F).
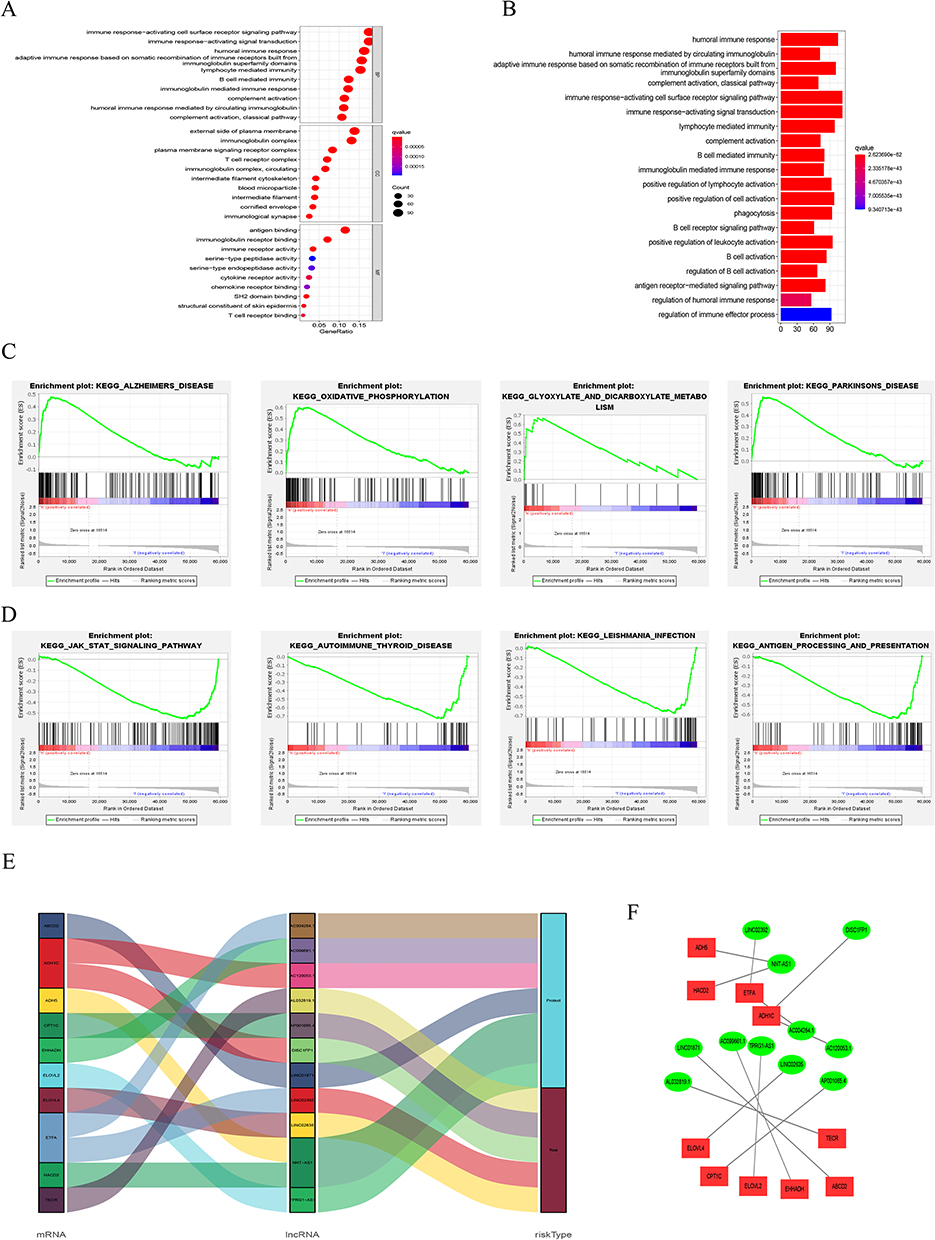 |
Figure 11 Functional analysis. (A) Top 10 classes of GO enrichment terms. (B) Top 30 pathways of KEGG enrichment terms. (C) Top 4 GSEA terms in high-risk group. (D) Top 4 GSEA terms in low-risk group. (E) lncRNA risk subgroup analysis. (F) Cytoscape of lncRNA–mRNA interaction network. |
qRT-PCR Validation of Optimal Feature Genes
We examined the relative expression of four optimal feature genes in A857 cell melanoma line and fibroblast cell line (n=9) Compared to fibroblast cell line (n=9), the expression of LINC02635, AL032819.1 and LINC02392 (Figure 12) were significantly up-regulated in A857 cell melanoma line (all P < 0.05), which was in line with the bioinformatics analysis. Compared to fibroblast cell line, the expression of DISC1FP1 (Figure 12) no significance in A857 cell melanoma line (P > 0.05).
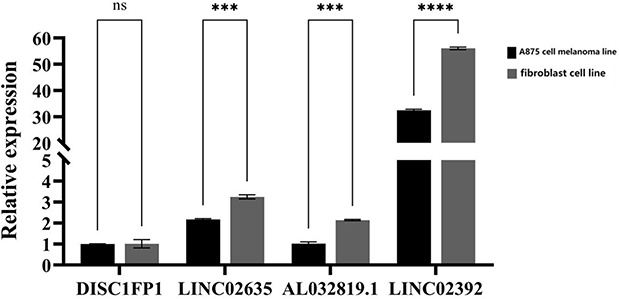 |
Figure 12 The relative expressions of optimal feature genes were validated by qRT-PCR. The expressions of DISC1FP1, LINC02635, AL032819.1, LINC02392 between A857 cell melanoma line and fibroblast cell line. Statistic tests: Student’s t-test (P <0.001***.P<0.0001****). |
Discussion
Among all organs of our human being body, skin is the most special and largest one, and melanoma remains one of the most malignant and aggressive cancers.19 Along with the increasing incidence, different treatment methods are gradually applied according to histological and pathological stages to provide a better prognosis. Differing from simple surgical excision for stage I, advanced SKCM mainly focused on immunotherapy and target therapies that have enhanced survival sharply and more specific biomarkers are warranted.20 Present investigated risk factors include females under 40 years old, males over 75 years old, exposure to ultraviolet rays, melanocytic nevi, family history, and genetic susceptibility.21 Although biopsy remains the golden standard, early non-invasive detection and treatment techniques are still lacking. According to a recent phase II trial of 30 patients with melanoma in Japan, the response rate of nivolumab and ipilimumab combination therapy is just 40%.22 This phenomenon that a lack of effective detection and therapy methods makes SKCM an urgent affair. When it comes to molecular mechanisms related to biomarkers, numerous data have demonstrated that fatty acids and lncRNAs have played a vital role in the development of SKCM, along with immune infiltration, especially in macrophages and T cells.23 However, the specific pathways and mechanisms are still not fully illustrated.
Thus, based on the above characteristics, we conducted a comprehensive diagnosis and prognosis risk model to evaluate the fatty acid-related lncRNAs in patients with SKCM with the technique of bioinformatics and RNA-sequencing profiling, exploring the crosstalk between fatty acid metabolism and immune infiltration along with TME, especially tumor-infiltrating T lymphocytes (TILs) and macrophages. The aim of this investigation is to explore novel biological targets and immunotherapeutic approaches for clinical treatment in patients with SKCM.
In our study, we analyzed gene sets and multivariate Cox analysis found that 11 hub genes were associated with fatty acid-related lncRNAs in SKCM patients. Of course, the majority of them were not found in previous studies, while several researchers have reported similar results to our investigation at some level. Disrupted-In-Schizophrenia 1 (DISC1) co-segregates with schizophrenia, bipolar disorder, and depression, which was also a risk factor, according to Jennifer E Eykelenboom et al.24 As a crucial gene involved in the development and maturation of neural precursors, neuronal migration and integration, and synaptic signaling in the adult and developing brain.25 Other researchers have found similar results that DISC1 acts as an important regulator of the central neuron system,26–28 however, the function of DISC1 in patients with SKCM has not been investigated, which needs further researches to explore certain connections. As for gene LINC01871, previous similar researchers have found that it was a significant autophagy-related gene in breast cancer29,30 as well as a critical immune-related regulator in breast cancer and human endometrial cancer,31,32 which unfolded that it could function through autophagy and immune infiltration in SKCM as well. Further studies should explore certain crosstalk or co-expression pathways to solve our proposal. Then, we searched the gene TPRG1-AS1 and found that it could promote heterogeneous liver cancer progression by sponging miR-4691-5p and miR-3659 to interfere with their binding to RBM24.33 When it comes to gene NNT-AS1, there were more investigations about its function in cancer, like lung squamous cell carcinoma,34 prostate cancer,35 cervical cancer,36 glioma,37 and bladder cancer.38 Altogether, these researches have illustrated various functions of lncRNAs in cancer development, while, the specific pathways in SKCM remain a misery and need further investigation.
After that, we performed a concrete gene set enrichment analysis, and the KEGG bubble diagram showed that these fatty acid-related lncRNAs mostly function via immune response-activating signal transduction and cell surface receptor-signaling pathways. A more in-depth heatmap revealed that the high-risk subgroup had significantly lower expression levels of HLA, immunological checkpoints (ICP), T cell co-stimulation, CCR, MHC class I, and type I IFN response, suggesting that immune infiltration and inflammation may have some bearing on the development of SKCM.
Then, the K-M survival curve in subgroups with high- and low-expression CD8 (+) T cells revealed that the probability of survival was significantly higher in the former group, supporting earlier studies’ findings that infiltration of CD8 (+) T cells had a significant prognostic value in patients with melanoma.39 Previous studies in mice have shown that CD8 (+) T cells and interferon (IFN-) were responsible for the upregulation of indoleamine-2,3-dioxygenase (IDO) and PD-L1 in the TME of patients with SKCM.40 Further, Kexin Yanet al identified that 9 essential genes were associated with CD8 (+) T cell infiltration which was closely related to IFN-γ gene function.41 The hypoxia-inducible factor-1 (HIF-1) pathway is in fact activated by regions of hypoxia in melanoma, and HIF-1 expression increases in response to T cell activation.42 However, detailed mechanisms still need further exploration.
Along with CD8 (+) T cells, we also looked at the likelihood of survival with respect to macrophage M1 expression and discovered that the high-expression subgroup had a greater survival rate than the low-expression subgroup. The majority of tumor types include M2-like cells, which may be classed as either tumoricidal M1 or tumor-supportive M2 activation phenotypes in macrophages.43,44 In the early stage of SKCM development, M1-recruited macrophages shift to the M2 phenotype and function as a tumor-promoting factor.45 Research has previously shown that the combination of an antiangiogenic medicine with an immunostimulatory agent causes repolarization from an M2-like to an M1-like phenotype, which alters the blood vessel structure of tumors, enhances the effectiveness of chemotherapy, and results in tumor growth regression.46 Meanwhile, Sang Min Park et al showed that interleukin-9 (IL-9) might suppress lung metastasis of melanoma in C57BL/6 mice by boosting the polarization and proliferation of M1 macrophages.47 All together verified the function of M1-like macrophages in cancer development and provide a potential therapeutic target for clinical treatment.
There are still several limitations to our investigation. Firstly, as a bioinformatics analysis due to its innate shortcomings, our data were downloaded from a database which needs further cellular or animal experiments to verify our results. Secondly, there would exist several sampling biases like sex, age, and complications which were not included in our research. Therefore, further detailed confirmatory experiments are of great importance.
The analysis of the association between fatty acid metabolism-related lncRNAs and immune infiltration in patients with SKCM was done using a comprehensive diagnosis and prognosis risk evaluation model. This analysis showed the potential role of CD8 (+) T cells and M1-like macrophages in the initiation, progression, and metastasis of cancer. It also provided potential therapeutic targets for clinical treatment.
Conclusion
Overall, we constructed a melanoma cell prognosis model based on fatty acid metabolism, in which lnc RNA (LINC02635, AL032819.1 and LINC02392) plays a key role, indicating that they provide new potential targets for diagnosis and maybe progression of SKCM thus leading to improved outcomes. Different from other similar studies, we used more fatty acid metabolism-related methods analyse to enhance the accuracy of gene screening, and focused on exploring the specific genes that have the most obvious impact on SKCM. It can also provide more accurate direction guidance for future SKCM research. Overall, our research aims to provide new ideas and directions for clinical diagnosis and precise treatment management of SKCM.
Data Sharing Statement
Further questions may be sent to the corresponding authors; the article and Supplementary Material contain the original contributions made for the research.
Ethical Approval
The study was conducted following with the approval of the Ethics Committee of Tianjin Medical University General Hospital.
Author Contributions
All authors made a significant contribution to the work reported, whether that is in the conception, study design, execution, acquisition of data, analysis and interpretation, or in all these areas; took part in drafting, revising or critically reviewing the article; gave final approval of the version to be published; agreed on the journal to which the article has been submitted; and agreed to be accountable for all aspects of the work.
Funding
This study was funded by Tianjin Key Medical Discipline (Specialty) Construction Project (303078100812).
Disclosure
The authors report no conflicts of interest in this work.
References
1. Coricovac D, Dehelean C, Moaca E-A, et al. Cutaneous Melanoma-A Long Road from Experimental Models to Clinical Outcome: a Review. Int J Mol Sci. 2018;19(6):1566. doi:10.3390/ijms19061566
2. Holmes D. The cancer that rises with the sun. Nature. 2014;515(7527):S110–1. doi:10.1038/515S110a
3. Miller R, Walker S, Shui I, et al. Epidemiology and survival outcomes in stages II and III cutaneous melanoma: a systematic review. Melanoma Manag. 2020;7(1):Mmt39. doi:10.2217/mmt-2019-0022
4. Conic RZ, Cabrera CI, Khorana AA, et al. Determination of the impact of melanoma surgical timing on survival using the National Cancer Database. J Am Acad Dermatol. 2018;78(1):40–46.e7. doi:10.1016/j.jaad.2017.08.039
5. Luke JJ, Flaherty KT, Ribas A, et al. Targeted agents and immunotherapies: optimizing outcomes in melanoma. Nat Rev Clin Oncol. 2017;14(8):463–482. doi:10.1038/nrclinonc.2017.43
6. Da silveira nogueira lima JP, Georgieva M, Haaland B, et al. A systematic review and network meta-analysis of immunotherapy and targeted therapy for advanced melanoma. Cancer Med. 2017;6(6):1143–1153. doi:10.1002/cam4.1001
7. Currie E, Schulze A, Zechner R, et al. Cellular fatty acid metabolism and cancer. Cell Metab. 2013;18(2):153–161. doi:10.1016/j.cmet.2013.05.017
8. Li Z, Zhang H. Reprogramming of glucose, fatty acid and amino acid metabolism for cancer progression. Cell Mol Life Sci. 2016;73(2):377–392. doi:10.1007/s00018-015-2070-4
9. Jin Z, Chai YD, Hu S. Fatty Acid Metabolism and Cancer. Adv Exp Med Biol. 2021;1280:231–241.
10. Ma B, Zhang A, Zhao Q, et al. Genome-wide identification and analysis of long non-coding RNAs involved in fatty acid biosynthesis in young soybean pods. Sci Rep. 2021;11(1):7603. doi:10.1038/s41598-021-87048-7
11. Wu H, Liu B, Chen Z, et al. MSC-induced lncRNA HCP5 drove fatty acid oxidation through miR-3619-5p/AMPK/PGC1α/CEBPB axis to promote stemness and chemo-resistance of gastric cancer. Cell Death Dis. 2020;11(4):233. doi:10.1038/s41419-020-2426-z
12. Zhu J, Fu H, Wu Y, et al. Function of lncRNAs and approaches to lncRNA-protein interactions. Sci China Life Sci. 2013;56(10):876–885. doi:10.1007/s11427-013-4553-6
13. Quail DF, Joyce JA. Microenvironmental regulation of tumor progression and metastasis. Nat Med. 2013;19(11):1423–1437. doi:10.1038/nm.3394
14. Lu J, Wang X, Sun K, et al. Chrom-Lasso: a lasso regression-based model to detect functional interactions using Hi-C data. Brief Bioinform. 2021;22(6). doi:10.1093/bib/bbab181
15. Newman AM, Liu CL, Green MR, et al. Robust enumeration of cell subsets from tissue expression profiles. Nat Methods. 2015;12(5):453–457. doi:10.1038/nmeth.3337
16. Li T, Fan J, Wang B, et al. TIMER: a Web Server for Comprehensive Analysis of Tumor-Infiltrating Immune Cells. Cancer Res. 2017;77(21):e108–e110. doi:10.1158/0008-5472.CAN-17-0307
17. Yang W, Soares J, Greninger P, et al. Genomics of Drug Sensitivity in Cancer (GDSC): a resource for therapeutic biomarker discovery in cancer cells. Nucleic Acids Res. 2013;41(Database issue):D955–61. doi:10.1093/nar/gks1111
18. Subramanian A, Tamayo P, Mootha VK, et al. Gene set enrichment analysis: a knowledge-based approach for interpreting genome-wide expression profiles. Proc Natl Acad Sci U S A. 2005;102(43):15545–15550. doi:10.1073/pnas.0506580102
19. Huang B, Han W, Sheng Z-F, et al. Identification of immune-related biomarkers associated with tumorigenesis and prognosis in cutaneous melanoma patients. Cancer Cell Int. 2020;20(1):195. doi:10.1186/s12935-020-01271-2
20. Pelster MS, Amaria RN. Combined targeted therapy and immunotherapy in melanoma: a review of the impact on the tumor microenvironment and outcomes of early clinical trials. Ther Adv Med Oncol. 2019;11:1758835919830826. doi:10.1177/1758835919830826
21. Rastrelli M, et al. Melanoma: epidemiology, risk factors, pathogenesis, diagnosis and classification. Vivo. 2014;28(6):1005–1011.
22. Namikawa K, Yamazaki N. Targeted Therapy and Immunotherapy for Melanoma in Japan. Curr Treat Options Oncol. 2019;20(1):7. doi:10.1007/s11864-019-0607-8
23. Saab J, Santos-Zabala ML, Loda M, et al. Fatty Acid Synthase and Acetyl-CoA Carboxylase Are Expressed in Nodal Metastatic Melanoma But Not in Benign Intracapsular Nodal Nevi. Am J Dermatopathol. 2018;40(4):259–264. doi:10.1097/DAD.0000000000000939
24. Eykelenboom JE, Briggs GJ, Bradshaw NJ, et al. A t(1;11) translocation linked to schizophrenia and affective disorders gives rise to aberrant chimeric DISC1 transcripts that encode structurally altered, deleterious mitochondrial proteins. Hum Mol Genet. 2012;21(15):3374–3386. doi:10.1093/hmg/dds169
25. Brandon NJ, Sawa A. Linking neurodevelopmental and synaptic theories of mental illness through DISC1. Nat Rev Neurosci. 2011;12(12):707–722. doi:10.1038/nrn3120
26. Norkett R, Modi S, Birsa N, et al. DISC1-dependent Regulation of Mitochondrial Dynamics Controls the Morphogenesis of Complex Neuronal Dendrites. J Biol Chem. 2016;291(2):613–629. doi:10.1074/jbc.M115.699447
27. Ryan NM, Lihm J, Kramer M, et al. DNA sequence-level analyses reveal potential phenotypic modifiers in a large family with psychiatric disorders. Mol Psychiatry. 2018;23(12):2254–2265. doi:10.1038/s41380-018-0087-4
28. Ji B, Higa KK, Kim M, et al. Inhibition of protein translation by the DISC1-Boymaw fusion gene from a Scottish family with major psychiatric disorders. Hum Mol Genet. 2014;23(21):5683–5705. doi:10.1093/hmg/ddu285
29. Li X, Jin F, Li Y. A novel autophagy-related lncRNA prognostic risk model for breast cancer. J Cell Mol Med. 2021;25(1):4–14. doi:10.1111/jcmm.15980
30. Wu Q, Li Q, Zhu W, et al. Identification of autophagy-related long non-coding RNA prognostic signature for breast cancer. J Cell Mol Med. 2021;25(8):4088–4098. doi:10.1111/jcmm.16378
31. Ma W, Zhao F, Yu X, et al. Immune-related lncRNAs as predictors of survival in breast cancer: a prognostic signature. J Transl Med. 2020;18(1):442. doi:10.1186/s12967-020-02522-6
32. Wang Z, Liu Y, Zhang J, et al. An Immune-Related Long Noncoding RNA Signature as a Prognostic Biomarker for Human Endometrial Cancer. J Oncol. 2021;2021:9972454. doi:10.1155/2021/9972454
33. Choi JH, Kwon SM, Moon SU, et al. TPRG1-AS1 induces RBM24 expression and inhibits liver cancer progression by sponging miR-4691-5p and miR-3659. Liver Int. 2021;41(11):2788–2800. doi:10.1111/liv.15026
34. Ma J, Qi G, Li L. LncRNA NNT-AS1 promotes lung squamous cell carcinoma progression by regulating the miR-22/FOXM1 axis. Cell Mol Biol Lett. 2020;25(1):34. doi:10.1186/s11658-020-00227-8
35. Yao C, Cheng X, Guo X, et al. NNT-AS1 modulates prostate cancer cell proliferation, apoptosis and migration through miR-496/DDIT4 axis. Cancer Cell Int. 2020;20(1):463. doi:10.1186/s12935-020-01505-3
36. Liu Y, Guo R, Qiao Y, et al. LncRNA NNT-AS1 contributes to the cisplatin resistance of cervical cancer through NNT-AS1/miR-186/HMGB1 axis. Cancer Cell Int. 2020;20(1):190. doi:10.1186/s12935-020-01278-9
37. Zheng D, Chen D, Lin F, et al. LncRNA NNT-AS1 promotes glioma cell proliferation and metastases through miR-494-3p/PRMT1 axis. Cell Cycle. 2020;19(13):1621–1631. doi:10.1080/15384101.2020.1762037
38. Liu Y, Wu G. NNT-AS1 enhances bladder cancer cell growth by targeting miR-1301-3p/PODXL axis and activating Wnt pathway. Neurourol Urodyn. 2020;39(2):547–557. doi:10.1002/nau.24238
39. Yuan Y, Zhu Z, Lan Y, et al. Development and Validation of a CD8+ T Cell Infiltration-Related Signature for Melanoma Patients. Front Immunol. 2021;12:659444. doi:10.3389/fimmu.2021.659444
40. Spranger S, Spaapen RM, Zha Y, et al. Up-Regulation of PD-L1, IDO, and T regs in the Melanoma Tumor Microenvironment Is Driven by CD8 + T Cells. Sci Transl Med. 2013;5(200):200ra116. doi:10.1126/scitranslmed.3006504
41. Yan K, Lu Y, Yan Z, et al. 9-Gene Signature Correlated With CD8(+) T Cell Infiltration Activated by IFN-γ: a Biomarker of Immune Checkpoint Therapy Response in Melanoma. Front Immunol. 2021;12:622563. doi:10.3389/fimmu.2021.622563
42. Zhang Y, Kurupati R, Liu L, et al. Enhancing CD8(+) T Cell Fatty Acid Catabolism within a Metabolically Challenging Tumor Microenvironment Increases the Efficacy of Melanoma Immunotherapy. Cancer Cell. 2017;32(3):377–391.e9. doi:10.1016/j.ccell.2017.08.004
43. Bardi GT, Smith MA, Hood JL. Melanoma exosomes promote mixed M1 and M2 macrophage polarization. Cytokine. 2018;105:63–72. doi:10.1016/j.cyto.2018.02.002
44. Cao M, Yan H, Han X, et al. Ginseng-derived nanoparticles alter macrophage polarization to inhibit melanoma growth. J Immunother Cancer. 2019;7(1):326. doi:10.1186/s40425-019-0817-4
45. Falleni M, Savi F, Tosi D, et al. M1 and M2 macrophages’ clinicopathological significance in cutaneous melanoma. Melanoma Res. 2017;27(3):200–210. doi:10.1097/CMR.0000000000000352
46. Jarosz-Biej M, Kamińska N, Matuszczak S, et al. M1-like macrophages change tumor blood vessels and microenvironment in murine melanoma. PLoS One. 2018;13(1):e0191012. doi:10.1371/journal.pone.0191012
47. Park SM, Do-Thi VA, Lee J-O, et al. Interleukin-9 Inhibits Lung Metastasis of Melanoma through Stimulating Anti-Tumor M1 Macrophages. Mol Cells. 2020;43(5):479–490. doi:10.14348/molcells.2020.0047
 © 2023 The Author(s). This work is published and licensed by Dove Medical Press Limited. The full terms of this license are available at https://www.dovepress.com/terms.php and incorporate the Creative Commons Attribution - Non Commercial (unported, v3.0) License.
By accessing the work you hereby accept the Terms. Non-commercial uses of the work are permitted without any further permission from Dove Medical Press Limited, provided the work is properly attributed. For permission for commercial use of this work, please see paragraphs 4.2 and 5 of our Terms.
© 2023 The Author(s). This work is published and licensed by Dove Medical Press Limited. The full terms of this license are available at https://www.dovepress.com/terms.php and incorporate the Creative Commons Attribution - Non Commercial (unported, v3.0) License.
By accessing the work you hereby accept the Terms. Non-commercial uses of the work are permitted without any further permission from Dove Medical Press Limited, provided the work is properly attributed. For permission for commercial use of this work, please see paragraphs 4.2 and 5 of our Terms.