Back to Journals » Drug Design, Development and Therapy » Volume 19
FAK-Induced Time Dependent Cell Response Profiling: Prediction, Identification, and Analysis of Anti-Tumor Immune Natural Products
Authors Jin L, Chen M, Lou J, Fu J, Bai N, Liu X, Mao W, Li Z, Shou Q, Fu H
Received 29 May 2025
Accepted for publication 21 September 2025
Published 6 October 2025 Volume 2025:19 Pages 9079—9097
DOI https://doi.org/10.2147/DDDT.S533551
Checked for plagiarism Yes
Review by Single anonymous peer review
Peer reviewer comments 3
Editor who approved publication: Dr Solomon Tadesse Zeleke
Lu Jin,1,2,* Mengyun Chen,1,3,* Jingyi Lou,1,3,* Jianhui Fu,1,3 Ningning Bai,1 Xia Liu,1 Weiye Mao,1 Zhenghao Li,1,3 Qiyang Shou,1,3 Huiying Fu1– 3
1Second Clinical Medical School, Jinhua Academy, Zhejiang Chinese Medical University, Hangzhou, 310053, People’s Republic of China; 2College of Life Science, Zhejiang Chinese Medical University, Hangzhou, People’s Republic of China; 3School of Pharmacy, Zhejiang Chinese Medical University, Hangzhou, 310053, People’s Republic of China
*These authors contributed equally to this work
Correspondence: Qiyang Shou, Second Clinical Medical School, Jinhua Academy, Zhejiang Chinese Medical University, No. 548 Binwen Road, Hangzhou, 310053, People’s Republic of China, Tel +86 571-8661-3662, Email [email protected] Huiying Fu, Second Clinical Medical School, Jinhua Academy, Zhejiang Chinese Medical University, No. 548 Binwen Road, Hangzhou, 310053, People’s Republic of China, Tel +86 571-8661-3662, Email [email protected]
Background: Focal Adhesion Kinase (FAK) is a key tyrosine kinase often overexpressed in tumors, making it a promising target for cancer therapy. This study aims to screen and investigate the activity and mechanisms of Traditional Chinese Medicines (TCMs) targeting FAK within breast cancer.
Materials and Methods: Using xCELLigence system, we identified TCMs affecting FAK signaling and validated its anti-tumor effects. The 4T1-Luc breast cancer models and MMTV-PyMT mice were used to evaluate Moutan Cortex Radicis (MCR) on tumor growth and lung metastasis, with flow cytometry assessing immune cell changes. We utilized CRISPR-Cas9 to investigate the anti-tumor mechanisms of MCR by specifically targeting the FAK signaling pathway. To elucidate the underlying molecular mechanisms, RNA sequencing was performed, and the results were subsequently validated through quantitative reverse transcription PCR (qRT-PCR) and Western blot analysis.
Results: We have successfully developed the EGF-induced Time-dependent Cell Response Profilings (FAK-TCRPs) and discovered that MCR effectively attenuated EGF-mediated responses in a dose-dependent manner. Additionally, MCR significantly inhibited tumor growth and lung metastasis by partly targeting FAK. MCR increased CD8+ T cell infiltration and the proportion of CD44HiCD62LHi central memory and CD44HiCD62LLow effector memory T cells, while reducing regulatory T cells (Tregs) and CTLA-4 expression. MCR converted M2 tumor-associated macrophages (TAMs) to M1 within the tumor microenvironment (TME). In FAK-deficient mice, MCR did not affect on CD8+ cells, TAMs, or CTLA-4 expression. MCR modulated chemokine signaling and ECM-receptor interactions, decreasing CCL1, CCL5, TGF, IL-4, IL-10, TNF-α, and IL-6, while increasing CCL7, CXCL10, and IL-24. It significantly inhibited FAK mRNA in tumors. Cellular experiments demonstrated that MCR suppressed P-FAK and P-Erk activation and reduced MMP-2, MMP-9, Laminin, and Fibronectin levels.
Conclusion: Collectively, MCR is identified as a FAK-targeting agent through FAK-TCRPs. MCR inhibits TAMs, CTLA-4, and chemokine transcription via the FAK/MMPs pathway, showing antitumor effects in breast cancer.
Keywords: FAK, time dependent cell response profilings, moutan cortex radicis, breast cancer, MMPs, immune cell
Graphical Abstract:

Introduction
Malignant tumors are a leading cause of non-natural death, significantly threatening human health.1,2 Traditional treatments like surgery, radiotherapy, and chemotherapy often fall short of expectations. As we learn more about the tumor-host relationship, particularly regarding immune responses and evasion, interest in immune-based interventions has grown.3–5 The success of immune checkpoint inhibitors like cytotoxic T-lymphocyte–associated protein 4 (CTLA-4) and programmed cell death protein 1(PD-1) has expanded tumor immunotherapy options.6,7 However, extracellular matrix barriers and immunosuppressive cells in the tumor microenvironment hinder immunotherapy’s effectiveness, and overcoming these obstacles is crucial for wider clinical use.8,9
Numerous studies highlight FAK as crucial for regulating immune evasion in the TME.10–12 As a tyrosine kinase, FAK manages cellular functions like adhesion, migration, and survival, making it a promising cancer treatment target, with several FAK inhibitors currently in development.13 The USFDA has approved Verastem’s FAK inhibitor defactinib (Fakzynja) with MEK inhibitor avutometinib (Avmapki) for KRAS-mutated recurrent low-grade serous ovarian cancer.14 FAK facilitates tumor immune evasion by promoting the depletion of CD8+ T cells within the TME, enhancing the secretion of chemokines and cytokines such as CCL5 and TGF-β2, and significantly recruiting regulatory T cells (Tregs).10 Research indicates that FAK inhibitors markedly reduce fibrosis in surrounding tissues while diminishing the infiltration of immunosuppressive cells.11,15 Consequently, FAK not only serves as a critical target for modulating immunosuppressive cell populations within the TME, but also plays a pivotal role in disrupting the extracellular matrix barrier of the TME. Therefore, the design of high-throughput screening methodologies for FAK inhibitors is imperative for advancing therapeutic strategies.
The xCELLigence system is an advanced real-time cellular electrosensing platform that utilizes microelectronic impedance to detect physiological changes in cells resulting from interactions with drugs in a high-throughput and non-invasive manner.16 The cellular kinetic profiles that characterize the functional responses to specific small molecule compounds or cytokines are referred to as Time-dependent Cell Response Profilings (TCRPs).17 Impedance-based TCRPs inherently reflect dynamic alterations in the membrane-resistance-associated plaque complex, which is a fundamental component of the cytoskeleton. The cytoskeleton plays a critical role in various cellular physiological functions, including motility, endocytosis, exocytosis, synthesis, and secretion. Therefore, the kinetic variations in impedance recorded under specific physiological conditions are of particular physiological significance for this cytoskeleton-associated adhesion plaque.18,19 Based on this characteristic, we employed the xCELLigence system to develop a TCRPs model for FAK signaling, a capability that is not achievable with existing technologies. Accumulating evidence demonstrates that FAK drives tumor immune evasion by orchestrating extracellular matrix remodeling, promoting angiogenesis, and creating an immunosuppressive microenvironment. Based on the mechanisms of FAK function, TCMs with antagonistic activities (classified as heat-clearing, blood-activating and stasis-resolving, and tonifying agents) were utilized to identify TCMs responsive to FAK-TCRPs. The TCRP profiles derived from TCMs were compared with those of known small molecule inhibitors to predict mechanisms of action, thereby establishing a batch screening model that indirectly reflects FAK function.
Moutan cortex radicis, derived from the root cortex of Paeonia suffruticosa Andrews, is widely employed in traditional Chinese medicines for its analgesic, antipyretic, and anti-inflammatory properties.20,21 Studies have indicated that MCR alleviates lipopolysaccharide-induced acute lung injury through its significant anti-inflammatory effects.22 Additionally, MCR has been shown to inhibit eosinophil migration decrease the secretion of IL-8 and MCP-1.23,24 Additionally, MCR enhances serum antioxidant capacity and intestinal immunity by inhibiting the IKKβ/IκBα/NF-κB pathway and modulating gut microbiota.25 It has also been reported that MCR and Cinnamomi ramulus (1:1) or its constituents inhibited cell migration, tube formation, hyper-permeability and phosphorylation of FAK/p38 MAPK.26 Paeonol, a principal active component of MCR, has been documented to suppress colorectal cancer cells proliferation by inducing G0/G1 phase arrest and apoptosis via inhibition of the Wnt/β-catenin signaling pathway.27 Additionally, paeonol upregulates the expression of tumor suppressors TNNC1 and SCARA5, thereby exerting anti-tumor activity in non-small cell lung cancer cells.28 However, research on the anti-tumor effects of MCR and the underlying mechanisms remains limited. Given the crucial role of inflammation, intestinal immunity, and immune cell migration in tumor growth, along with paeonol’s potential antitumor benefits, we investigate MCR’s impact on breast cancer and the immunosuppressive microenvironment.
Materials and Methods
Chemicals and Reagents
We used finished granule medicinal materials for cell experiments, sourced from China Resources Sanjiu Medical & Pharmaceutical Co., Ltd. The materials included Pogostemon cablin (Blanco) Benth., Adenophora tetraphylla (Thunb).Fisch., Salvia miltiorrhiza Bunge, Belamcanda chinensis (L). Redouté), Achyranthes bidentata Blume, F.A. Sophora flavescens Aiton, Polygala tenuifolia Willd., Wolfiporia cocos (F.A. Wolf) Ryvarden & Gilb., Armeniacae Amarum Semen, and Moutan cortex radicis. We precisely measured 1 gram of fully soluble granules using a 0.0001-gram precision balance. The mixture underwent ultrasonic treatment for 1 hour, followed by heating in a 100 °C water bath for another hour, repeated twice. It was then centrifuged at 10,000 rpm for 15 minutes, resulting in a supernatant with a concentration of 1 g/mL.
The herbal raw material, Moutan cortex radicis, sourced from Bozhou, Anhui. The botanical was identified by Professor Hongshu Chen from Zhejiang Provincial Hospital of Chinese Medicine. Voucher specimens (No.2230614Y) were deposited in the Central Laboratory Herbarium of the Second School of Clinical Medicine, Zhejiang Chinese Medical University. For experimentation, 200 g of MCR was soaked in 2 L of distilled water overnight, boiled, and simmered for 60 minutes. The filtrate was collected, and the process was repeated with another 2 L of water. The resulting filtrate was concentrated by using a rotary evaporator, freeze-dried into powder (yield 38.9%), and stored at –40 °C, then the working concentration of 0.8g/mL was prepared for animal experiments.
Analysis of Major Bioactive Compounds of Moutan Cortex Radicis Extract
We weighed 10g of MCR extract powder and then prepared a 10 mg/mL stock solution for the detection of UPLC-Q-TOF/MS. Key chromatographic conditions included: capillary voltage (positive: 1.8 kV, negative: 2.5 kV), sample cone voltage (positive: 30 V, negative: 28 V), source offset (4 V), source temperature (120 °C), desolvation temperature (positive: 480 °C, negative: 500 °C), desolvation gas flow (positive: 950 L/Hr, negative: 1000 L/Hr), cone gas flow (50 L/Hr), and nebuliser pressure (positive: 6.5 Bar, negative: 6 Bar). The column used was ACQUITY Premier HSS T3 1.8um with VanGuard FIT. Mass spectrometry employed an ESI source, scanning in both positive and negative ion modes, with MSE full scan mode (0.4 s scan time, range 50–1200), using collision energies of 6 V (low) and 10–40 V (high). Sodium formate was used for mass spectrometer calibration, and leucine enkephalin (ESI+: m/z 556.2771, ESI-: m/z 554.2615) for real-time mass correction. The analytical platform utilized in the experiment was an Waters UPLC-Q-TOF/MS, with data processing and analysis conducted using Unifi platform.
Cell Culture
COS-7 and 4T1-Luc cells were sourced from the Shanghai Cell Bank. COS-7 cells were cultured in DMEM with 5% fetal bovine serum (FBS) and 2% penicillin-streptomycin, while 4T1-Luc cells were grown in RPMI 1640 under similar conditions at 37 °C with 5% CO2. Follow-up experiments could be carried out when cell confluence reached about 80–90%.
Flux Screening of Traditional Chinese Medicine Based on FAK-TCRPs Model
The Agilent xCELLigence system, a Real-Time Cell Analyzer (RTCA), measures cell-impedance changes using a micro-gold electrode on the E-Plate’s base. Adherent cells between the electrode and solution affect electron flow, with impedance influenced by cell quantity, size, morphology, and adhesion strength. This impedance is converted into the Cell Index (CI), a real-time, unitless parameter used to evaluate adherent cells on the electrodes. CI=1 is commonly used as a reference point to determine whether cells have adhered after inoculation and whether they have entered the exponential growth phase. Briefly, 50 μL of medium was added to a 96-well E-plate and incubated for 15 minutes at room temperature for baseline measurement. Then, 100 µL of COS-7 cell suspension (10,000 cells/well) was added to the E-plate. After a 30-minute incubation at room temperature, the plate was placed on the RTCA xCELLigence station for detection, with the CI measured every 15 minutes until it reached 1. The medium was then replaced with 190 µL of serum-free medium containing varying concentrations of MCR (0, 2.5, 5, 10 mg/mL) or FAK inhibitors (Y15, 2.5, 5, and 10 µm). After 2 hours, 25 ng/mL EGF was added. Short-term efficacy was observed every 2 minutes for 2 hours, and long-term efficacy every 15 minutes for up to 36 hours.
Animals Experimental
Thirty-two SPF BALB/c mice (8 weeks old, 20 ± 2 g) were obtained from Slake Laboratory Animal Co., Shanghai, and female MMTV-PyMT transgenic mice were sourced from Jackson Laboratory. Female BALB/c mice were anesthetized with isoflurane and injected with 0.1 mL of 4T1-Luc cells into the right mammary gland. They were divided into four groups: model, MCR-Low (4 g/kg), MCR-High (8 g/kg), and doxorubicin (DOX, 2.5 mg/kg). MCR and distilled water were given daily, while DOX was given weekly for four weeks. Tumor volumes were measured weekly using vernier calipers, and tumor growth curves were plotted using the formula: tumor volume = (tumor length diameter × tumor short diameter²) / 2, then differences in tumor volume across time points were analyzed. At the experiment’s end, mice were euthanized, and tumors, spleens, and lungs were collected. Additionally, eighteen 6-week-old female PyMT mice were divided into control and MCR groups (8 g/kg), following the same administration and detection procedures.
We calculated the number of animal samples based on the t-test. The calculation formula is as follows:

With α at 0.05 (Z0.05=1.96) and statistical power at 0.9 (Zβ=1.28), the pre-experiment showed a difference δ of 76.08 in average tumor volume between the model and administration groups, with a standard deviation σ of 52.10. Using the formula, n=7.35 was calculated. Accounting for a 10–20% loss rate due to model failure and animal death, 8 or 9 animals were included in each group for the formal experiment. All animal experiments were conducted in accordance with the Regulations for the Administration of Laboratory Animals and the Guideline for Ethical Review of Laboratory Animal Welfare (GB/T 35892–2018). The animal protocol was approved by Laboratory animal management and ethics committee of Zhejiang Chinese Medical University (approval number: IACUC-202402-08) and strictly adhered to ARRIVE guidelines.
FAK Knockout 4T1 Breast Cancer Cells Were Prepared Through the CRISPR-Cas9 System
The lentiCRISPR v2 vector was chosen, and sgRNAs for the FAK gene were designed and synthesized with the following sequences: sgRNA1 (5’-CACCGTGAGTCTTAGTACTCGAACT-3’, 5’-AAACAGTTCTTCGAGTACTAAGACTCAC-3’) and sgRNA2 (5’-CACCGCCTCAGTCACCTGCGATCGG-3’, 5’-AAACCCGATCGCAGGTGACTGAGGC-3’). After processing, the vector with the target sgRNA was constructed. Lipo2000 was used to transfect this vector, pCMV-VSV-G, and psPAX2 into 293T cells for lentiviral packaging. After 48 hours, the virus supernatant was filtered and used to infect target cells at a 1:2 ratio with complete medium. Monoclonal cell lines were obtained through puromycin screening and cell dilution. Western Blotting and qRT-PCR were then used to confirm FAK gene knockout in selected cell lines for further experiments.
Immunofluorescence
Cells were washed twice with PBS, fixed in 4% paraformaldehyde for 20 minutes, and washed three more times with PBS. They were permeabilized with 0.5% Triton X-100 for 5 minutes, followed by three 10-minute PBS washes. After treating with phalloidin or cortactin solution for designated duration in the dark according to the instruction manual, the cells were washed three more times with PBS. The cover glass was placed on a slide with anti-fluorescence quencher containing DAPI, and imaging was done using a Confocal Laser Scanning microscope.
Flow Cytometry
Tumor or spleen tissues were excised and finely minced using sterile scissors in a 2 mL medium supplemented with 2% FBS and 2% penicillin-streptomycin. The resultant cell suspension was filtered through a 200-mesh nylon membrane and subsequently subjected to erythrocyte lysis.29 The cells were then washed twice with PBS buffer. Following this, the cells were stained with the following antibodies: CD45-FITC (553080), CD4-PE (553048), CD8-APC-H7 (560,182), CD3-BV605 (563,004), CD44-BV510 (103,043), CD62L-PE-Cy7 (560,516), CD25-APC (557192), CD127-BV421 (562,959), CD11b-AF700 (557,960), F4/80-PE (565410), CD86-BV510 (563,077), CD152-APC (564331), CD279-BV421 (562,584), TIGIT-APC-R700 (565474s), obtained from BD Biosciences; and 206-AF647 (141711, BioLegend). Cell viability was assessed using Horizon™ Fixable Viability Stain 700 (564997, BD Biosciences) or 7-AAD (559925, BD Biosciences), with unstained cells considered viable. Stained cells were resuspended in 150 µL of fluorescence-activated cell sorting (FACS) buffer and analyzed using a FACS Canto II Cytometer (BD, USA), with data processed using FlowJo version 10.7.1 software.
Cytometric Bead Array (CBA)
The tissue sample (20 mg) was homogenized in 180 µL of PBS buffer and centrifuged at 10,000 rpm for 10 minutes to obtain the supernatant. Inflammation markers in the supernatant were measured using a CBA Flex Set kit (BD Biosciences). Data were collected with FACS Canto II Cytometry and analyzed using FCAP Array v3.
Western Blotting Analysis
Cells or tissues were lysed using RIPA buffer with protease and phosphatase inhibitors (Beyotime, China). Protein concentration was measured by the BCA method, and equal protein amounts were separated by SDS-PAGE and transferred to an NC membrane (Cytiva, Uppsala). The membrane was blocked with 5% skim milk, then incubated with antibodies at 4 °C, and protein bands were visualized using a chemiluminescence imaging system (Biotechne Brand, United States). Analysis was done with ImageJ, using β-actin as a reference. Antibodies for Western blot were diluted 1:1000, including FAK (Cell Signaling Technology, 3285S, 1:1000), p-FAK (HUABIO, ET1610-34, 1:1000), Erk1/2 (HUABIO, ET1601-29, 1:1000), p-Erk1/2 (HUABIO, ET1610-13, 1:1000), MMP-2 (HUABIO, ET1606-4, 1:1000), MMP-9 (HUABIO, ET1704-69, 1:1000), Laminin (HUABIO, ET1703-14, 1:1000), Fibronectin (Proteintech, 15613-1-AP, 1:1000), β-Actin (HUABIO, EM21002, 1:1000).
RNA Isolation and Quantification (q) RT-PCR
Total RNA was isolated from cells and tissues utilizing the TRIzol reagent (Invitrogen). The RNA concentration was quantified using a Thermo Scientific™ Nanodrop™ system, and reverse transcription was performed with a PrimeScript RT reagent kit (Takara) following the manufacturer’s instructions. Subsequently, complementary DNA (cDNA) was amplified using the SYBR® Green Real-time PCR Master Mix (Takara) on a 7900HT Fast instrument (Applied Biosystems, USA). The primer sequences employed were as follows: CCL1, forward 5’-CTGCCGTGTGGATACAGGAT-3’, reverse 5’-TTTGTTAGTTGAGGCGCAGC-3’; CCL5, forward 5’-TTTGCCTACCTCTCCCTCG-3’, reverse 5’-CGACTGCAAGATTGGAGCACT-3’; TGF, forward 5’-GACTGTCCACTTGCGACAAC-3’, reverse 5’-GGCAAACCGTCTCCAGAGTAA-3’; IL-10, forward 5’-GACAACATACTGCTAACCGACT-3’, reverse 5’-ACTGGATCATTTCCGA-3’; IL-4, forward 5’-GGTCTCAACCCCCAGCTAGT-3’, reverse 5’-GCCGATGATCTCTCTCAAGTGAT-3’; TNF-α, forward 5’-CTGAACTTCGGGGTGATCGG-3’, reverse 5’-GGCTTGTCACTCGAATTTTGAGAA-3’; IL-6, forward 5’-CTGCAAGAGACTTCCATCCAG-3’, reverse 5’-AGTGGTATAGACAGGTCTGTTGG-3’; CCL7, forward 5’-CTTTCAGCATCCAAGTGTGGG-3’, reverse 5’-CCATGCCCTTCTTTGTCTTGAA-3’; CXCL10, forward 5’-CATCCTGCTGGGTCTGAGTG-3’, reverse 5’-AGCTTCCCTATGGCCCTCAT-3’; IL-24, forward 5’-TGCACAAGAAGAACCAGCCA-3’
Statistical Analysis
Statistical differences between two groups were assessed with an unpaired t-test, while one-way ANOVA with post hoc Tukey-Kramer test was used for more than two groups. Analyses were conducted using SPSS 17, with significance at P < 0.05.
Results
Construction of the FAK-TCRPs Model and Screening of Traditional Chinese Medicine
A higher CI value indicates a stronger cellular presence on the electrode surface, which correspond to firmer adhesion and more extended cellular morphology. In the study, we found that dose-response analysis showed that EGF at 25, 50 and 100 ng/mL all elevated the CI above 1.6, indicating equivalent stimulatory efficacy (Figure 1A). To maximize cost-effectiveness, 25 ng/mL was used for further experiments. The cell-density curve (Figure 1B) revealed that 10×103 cells per well responded more rapidly than other concentrations to EGF, suggesting this as the optimal seeding density. Significant increases in P-FAK and P-erk were observed with EGF concentrations of 12.5, 25, and 50 ng/mL (Figure 1C). The activation levels of ERK and FAK were most pronounced at 10 minutes of EGF stimulation (Figure 1D). Simultaneously, confocal imaging technology was employed to assess cytoskeletal alterations at different intervention times when the EGF concentration was set at 25 ng/mL. The findings revealed that morphological changes were evident at 5 minutes, characterized by an increase in cytoskeletal size and a greater number of pseudopodia. By 10 minutes, the prominence of cell pseudopodia have became more pronounced (Figure 1E). These results suggest that CI values within the FAK-TCRPs model exhibit a significant correlation with cellular morphological changes. We pre-treated COS-7 cells with various concentrations of FAK inhibitor (Y15) and found that it significantly reduced peak CI values in a dose-dependent manner (Figure 1F), further confirming the feasibility of using FAK-TCRPs to screen the drugs targeting FAK.
 |
Figure 1 Construction of the FAK-TCRPs model and screening of Traditional Chinese Medicines. (A) Dose-respons curve of TCRPs induced with EGF concentrations. (B) Cell-density curve of TCRPs with EGF (25 ng/mL) stimulation. (C)FAK and ERK activation levels were assessed at EGF concentrations of 0, 6.25, 12.5, 25, and 50 ng/mL using Western blot. (D) FAK and ERK activation over time (0 to 120 min) with 25 ng/mL EGF was analyzed by Western blot. (E) Images show COS-7 cytoskeleton reorganization over time (0 to 120 min) with EGF, magnified 400×, red arrows indicate the positions of pseudopodia. (F)TCRPs in EGF models pretreated with FAK inhibitor Y15 (0, 2.5, 5, 10 μM) were recorded using the xCELLigence system. (G) TCRPs in EGF models pretreated with Y15 (2.5 μM, the data were showed as Figure 1F) and MCR (0, 2.5, 5, 10 mg/mL) were recorded in COS-7 cells using xCELLigence. (H) Images show invadopodia formation at various MCR concentrations in EGF-induced models, magnified 200×, red arrows indicate the positions of invadopodia. |
Based on the successful development of the FAK-TCRPs model, we conducted TCMs screening targeting FAK (Supplementary Figure 1). Results shown that pretreatment with MCR effectively reduced EGF-mediated responses within the FAK-TCRPs model in a dose-dependent manner (Supplementary Figure 1K). The results of the TCRPs indicated that MCR inhibited the CI peak to a comparable extent as Y15 (Figure 1G). Confocal imaging further confirmed MCR’s significant inhibitory effect on cellular invadopodia formation (Figure 1H).
UPLC-Q/TOF MS Analysis of the MCR Water Extract
The water extract of MCR was analysed by UPLC-Q/TOF-MS. Figure 2 presents the base peak intensity (BPI) chromatogram acquired in negative-ion electrospray (ESI−) mode. A total of 44 compounds were tentatively identified via the UNIFI platform, the detailed annotated spectra were are provided in Supplementary Material 1. Their retention times and molecular formulas are listed in Table 1, including the marker constituents: paeonol, paeonolide, oxypaeoniflorin, oxybenzoylpaeoniflorin, benzoyloxypaeoniflorin, and benzoylpaeoniflorin.
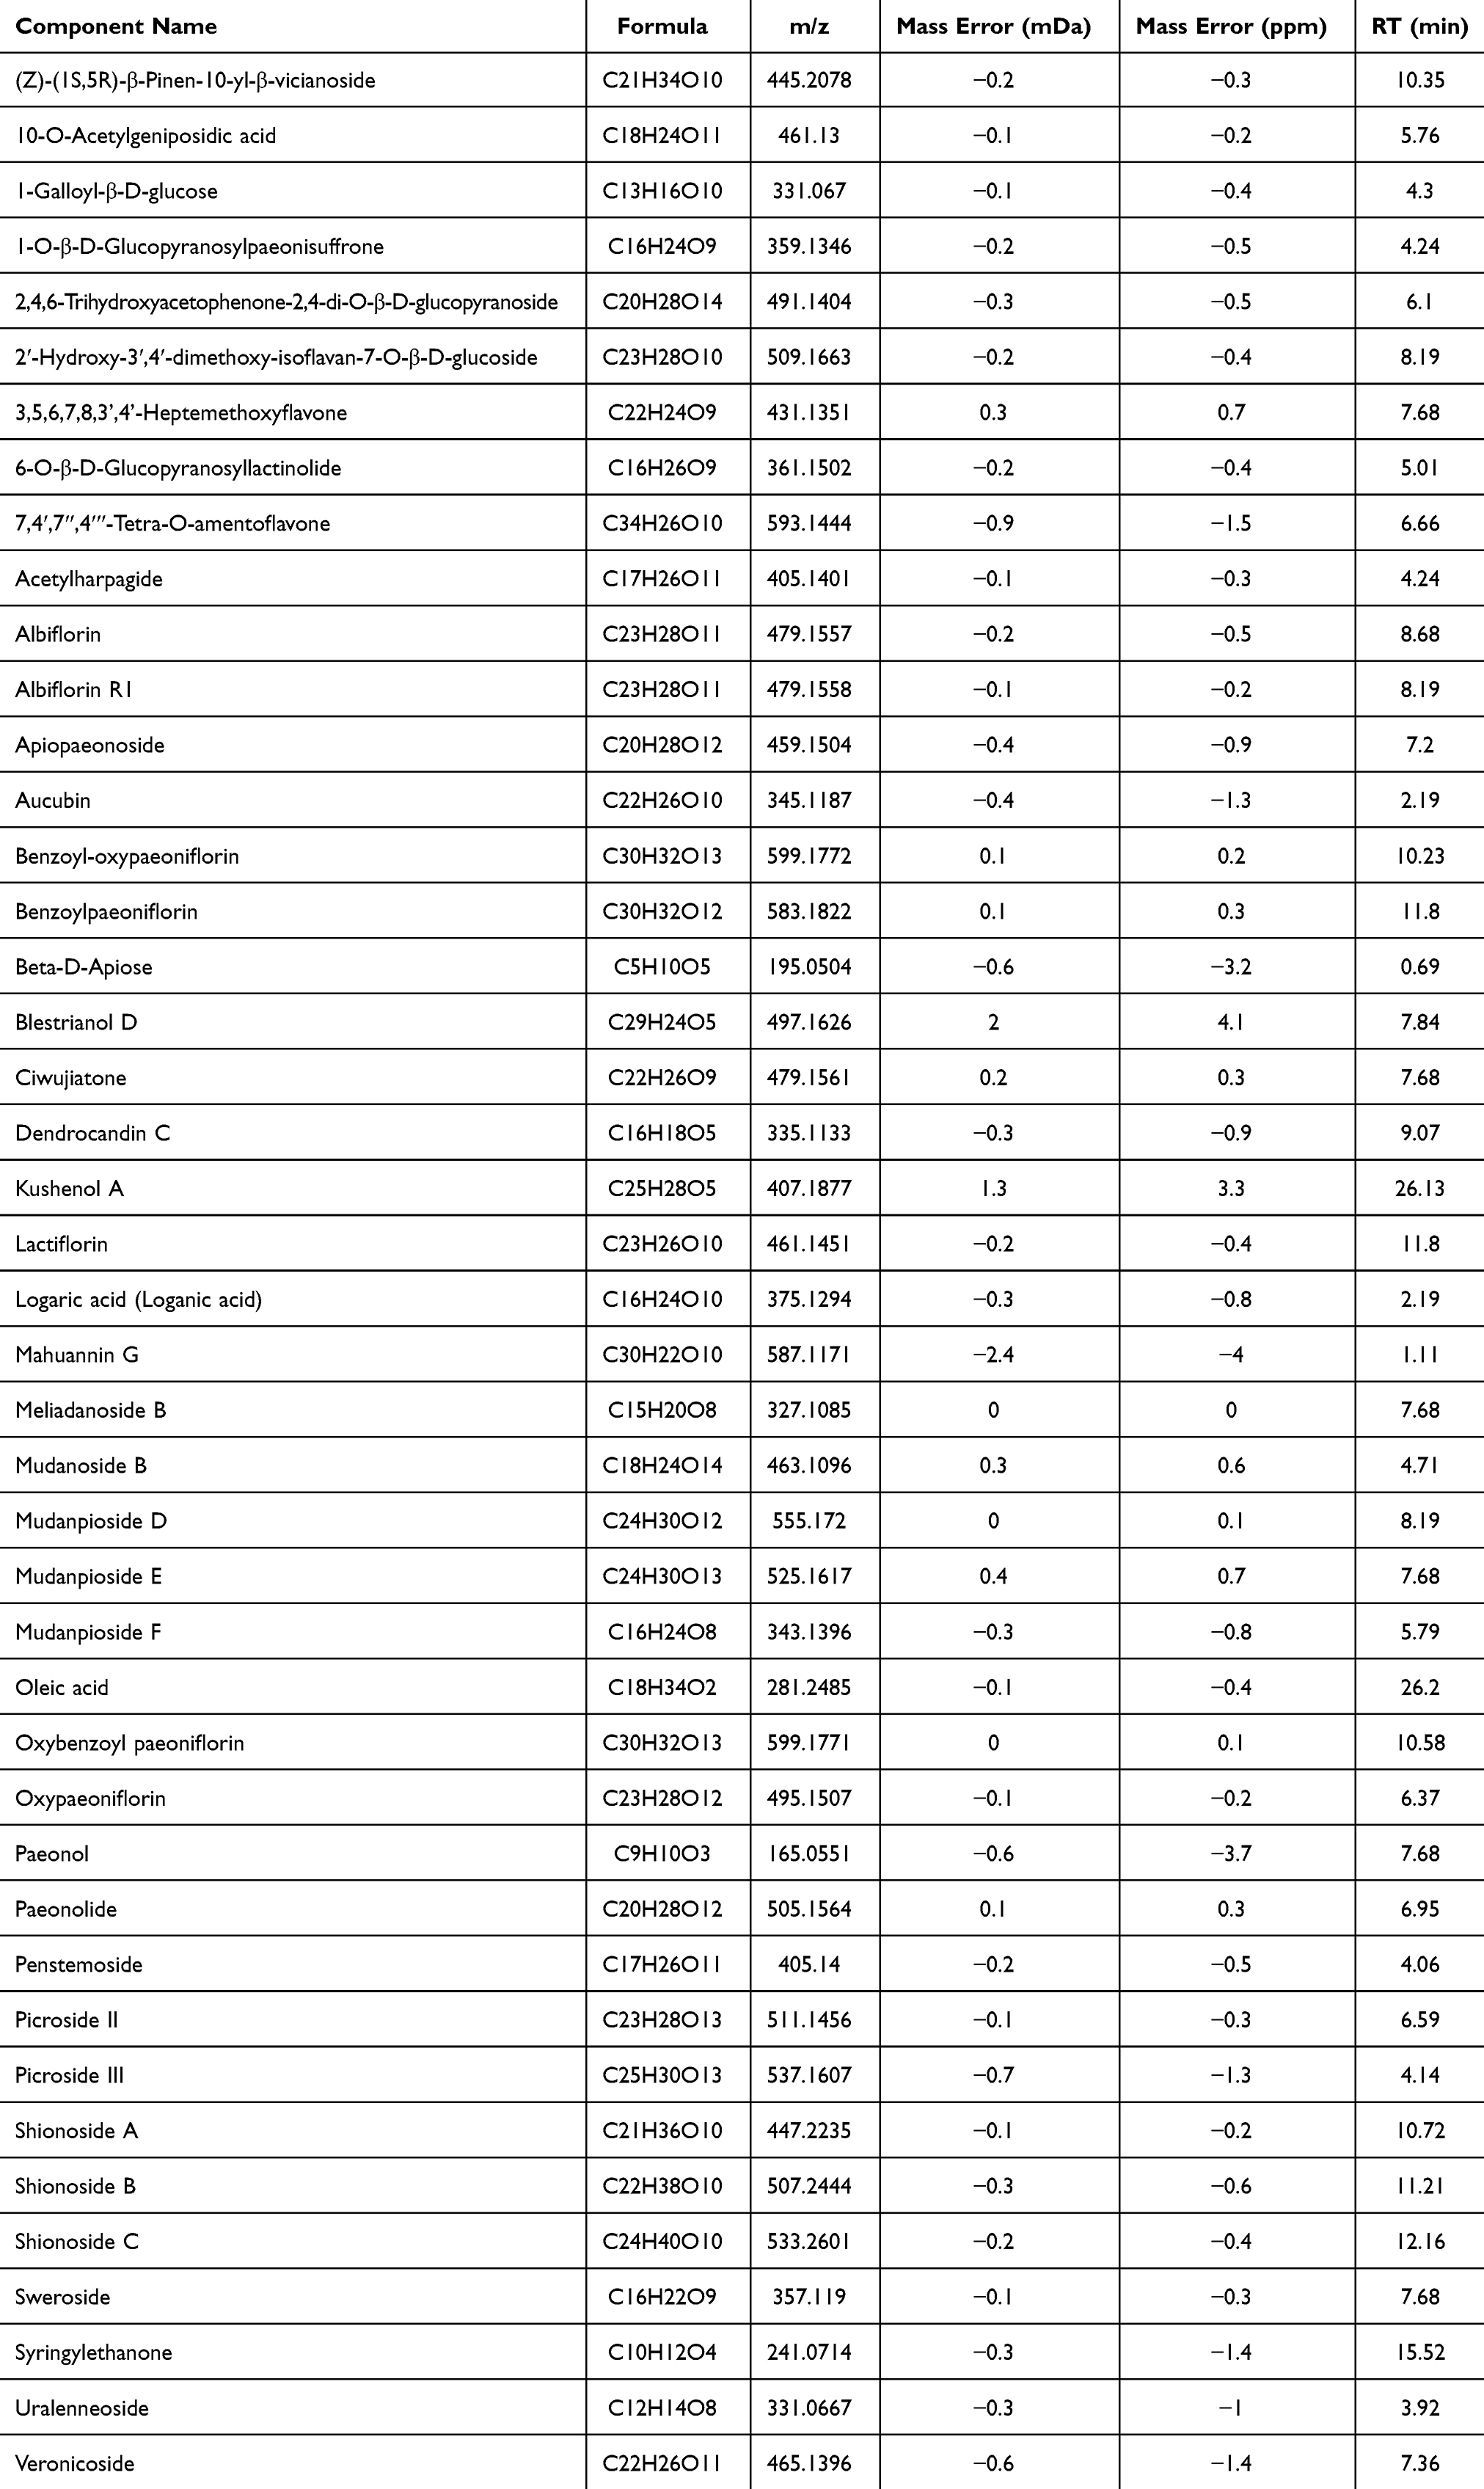 |
Table 1 Compounds Identified from MCR by UPLC-Q/TOF MS Analysis |
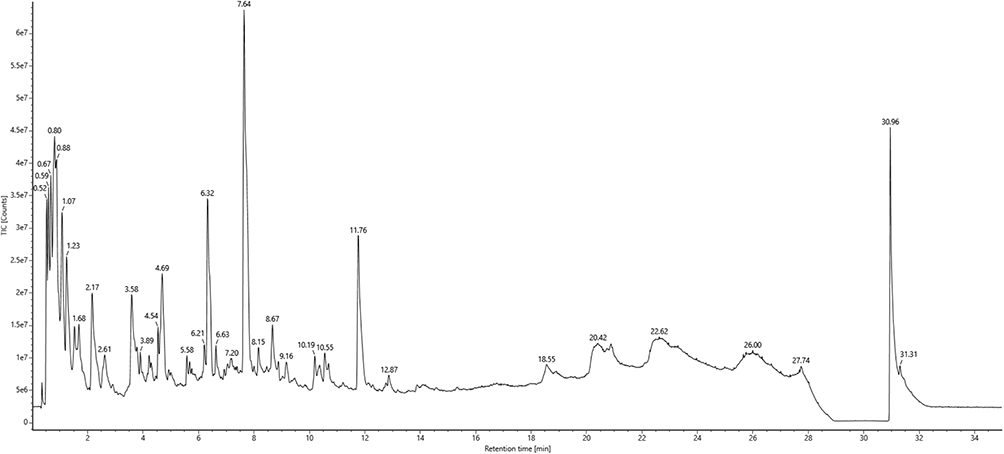 |
Figure 2 UPLC-Q/TOF MS analysis of the MCR water extract. The water extract of MCR was detected through the UPLC-Q/TOF MS method, and the spectrogram was presented. |
MCR Inhibited Tumor Growth and Pulmonary Metastasis in Breast Cancer Models
Given the similarities between MCR-TCRPs and FAK inhibitors, which are being developed as anti-tumor agents, we evaluated MCR’s antitumor efficacy using the 4T1-Luc breast cancer model and the MMTV-PyMT spontaneous breast cancer mouse model. MCR was administered for four weeks in the 4T1-Luc model, with weekly tumor volume measurements. Results showed a dose-dependent reduction in tumor volume and weight in the MCR group compared to the control group, indicating inhibited tumor growth.(Figure 3A and B). At an 8g/kg MCR dosage, lung and spleen weights were significantly lower in treated mice (Figure 3C and D). In the MMTV-PyMT model, the MCR group had reduced tumor weight and fewer high-weight tumors (Figure 3E). Immunohistochemical staining revealed a lower proportion of PCNA+ cells in the MCR group compared to controls, suggesting that MCR significantly inhibited the tumor cells proliferation (Figure 3F).And a significant reductions were observed in spleen weights after MCR treatment (Figure 3G). MCR treatment also significantly reduced lung weights (Figure 3H), indicating potential inhibition of lung metastasis. HE staining showed that MCR reduced both the number and area of lung metastases in PyMT mice by week fourteen (Figure 3I–K). Collectively, these results suggest MCR inhibits breast cancer growth and pulmonary metastasis.
 |
Figure 3 MCR inhibited tumor growth and pulmonary metastasis in breast cancer models. (A) The 4T1-Luc tumor model was treated with MCR (4 g/kg, 8 g/kg) and DOX (2.5 mg/kg) for 4 weeks; tumor growth curves were presented. (B–D) Weights of tumors, spleens, and lungs in the model and MCR groups. (E) 8-week-old MMTV-PyMT mice received MCR (8 g/kg) for 5 weeks; tumor weights were shown. (F) PCNA expression in tumors was analyzed via immunohistochemistry, and PCNA+ cell percentages were quantified with Image J. (G and H) Spleen and lung weights in PyMT mice. (I) Representative graphics and H&E staining of lung tissue. (J) Average metastases from five lung sections per mouse. (K) Lung metastases tumor area statistics, with red arrows indicating nodules. Data are presented as mean ± SEM, n= 8 or 9 mice/group. Outliers exceed three standard deviations from the mean. *p < 0.05, **p < 0.01, ***p < 0.001 vs model group. One-way ANOVA followed by the post hoc Tukey-Kramer test was employed for comparisons among three or more groups, while an unpaired t-test was used for two-group comparisons. |
MCR Improved the Tumor Immunosuppressive Microenvironment by Inhibiting M2 Tumor-Associated Macrophages and Regulatory T Cell Infiltration
FAK inhibitors can assistance the body’s immune system to fight cancer, and it is unclear whether the MCR modulates the immune system.To investigate MCR’s impact on the immune system, we analyzed immune cell composition in tumors and spleens using multicolor flow cytometry. In the tumor microenvironment, MCR treatment did not alter CD4+ T cell infiltration but significantly increased CD8+ T cell infiltration in a dose-dependent manner (Figure 4A). Memory CD4+ and CD8+ T cells were categorized by homing and function, showing a rise in CD44HiCD62LHi CD4+ central memory (TCM) and CD44HiCD62LLow CD4+ effector memory T (TEM) cells in MCR-treated mice (Figure 4B), CD8+ T cell memory subtypes also increased with MCR treatment (Figure 4C). MCR notably reduced Tregs (CD4+CD25+CD127−) and TAMs (CD11b+F4/80+) in the tumor microenvironment (Figure 4D and E), shifting TAMs from M2-like (CD206+CD86−) to M1-like (CD206−CD86+) polarization (Figure 4F). Representative flow cytometric plots depicting the populations of CD4+, CD8+, Tregs, and M1/M2 TAMs in the tumor tissues of model and MCR-treated mice are presented (Figure 4G). Moreover, MCR significantly downregulated CTLA-4 expression on CD8+ T cells (CD8+CTLA-4+, Figure 4H). Briefly, these results indicate that MCR enhanced CD8+ T cell infiltration, reduced Tregs and CTLA-4, and promoted TAM polarization from M2 to M1 in the tumor microenvironment.
 |
Figure 4 MCR improved the tumor immunosuppressive microenvironment by inhibiting M2 tumor-associated macrophages and regulatory T cell infiltration. (A) The percentages of CD4+ (identified by CD45+CD3+CD4+) and CD8+ (identified by CD45+CD3+CD8+) T cells in tumor of both model and MCR-treated mice. (B) The percentages of effector memory (TEM, stained by CD44HiCD62LLow), central memory (TCM, identified by CD44HiCD62LHi) and T memory stem cells T (TSCM, identified by CD44LowCD62LHi) among CD4+, and (C) among CD8+ T cells in tumor. (D) The percentages of Treg (identified by CD4+CD25+CD127−) cells in tumor. (E) The percentages and representative flow cytometric plots of tumor associated macrophages (identified by CD45+CD11b+F4/80+) in breast tumors. (F) The percentages of M1 (identified by CD86+CD206−) and M2 (identified by CD86−CD206+) TAMs cells in tumor. (G) Representative flow cytometric plots of CD4+, CD8+, Tregs, M1 and M2 TAMs cells in tumor of both groups. (H) The percentages of CD8+CTLA-4+ cells in tumor of both groups were measured. (I) The percentages of CD4+ and CD8+ T cells in spleen of model and MCR-treatment mice. (J and K) The percentages of TEM, TCM, and TSCM among CD4+, and among CD8+ T cells in spleen. (L)The percentage of TAMs in spleen of model and MCR-treatment mice. (M) The percentages of M1 and M2 TAMs cells in spleen. (N) The percentages of Treg cells in spleen of model and MCR-treatment mice. (O)The percentages of CD8+CTLA-4+ cells in spleen of both groups. Data represents the mean ± SEM, n=8 mice/group; *p < 0.05, **p < 0.01, ***p < 0.001 vs model group, as determined by one-way ANOVA followed by post hoc Tukey-Kramer test. Outliers exceed three standard deviations from the mean. |
In the spleen microenvironment, MCR reduced CD8+ T cell infiltration but did not affect CD4+ T cells (Figure 4I). TCM, TEM, and stem cell-like memory T (TSCM, CD44lowCD62LHi) cells percentages in CD4+ remained similar, except for a decrease in CD8+ TEM cells at 4 g/kg MCR (Figure 4J and K). MCR also decreased TAMs population (Figure 4L), however, no significant difference was observed in TAM polarization (Figure 4M). A significant decrease in Tregs and CD8+ CTLA-4+ lymphocytes was observed in the MCR-treated group (Figure 4N and O). Consequently, MCR improved the immunosuppressive landscape by lowering Tregs, TAMs, and CTLA-4 in the spleen.
MCR Modulates the Expression of Inflammatory Mediators Within Tumor Microenvironments
Inflammatory mediators play a crucial role in the recruitment of immune cells through various mechanisms, including chemotaxis, modulation of adhesion molecule expression, enhancement of vascular permeability, activation and polarization of immune cells. To determine the specific chemokines and cytokines modulated by MCR, we performed quantitative qRT-PCR array analysis. The results demonstrated a significant reduction in the expression levels of CCL1, CCL5, and TGF in the MCR-treated group (Figure 5A–C). IL-10 and IL-4 are key cytokines involved in macrophage polarization. Our study found that the levels of IL-10 and IL-4 in the tumor microenvironment were significantly down-regulated following MCR treatment (Figure 5D and E). TNF-α and IL-6 are central mediators of cancer-related inflammation. Our data revealed a significant decrease in both mRNA and protein levels of TNF-α and IL-6 in the tumor microenvironment of the MCR group compared to the model group (Figure 5F–I). Importantly, MCR treatment resulted in a marked increase in the expression levels of CCL7, CXCL10, and IL-24 (Figure 5J–L). These findings indicate that MCR may influence inflammatory mediator expression in the tumor microenvironment to control immune cell infiltration.
 |
Figure 5 MCR modulates the expression of inflammatory mediators within tumor microenvironments. (A) CCL1 mRNA expression in breast tumors of 4T1-Luc subcutaneous tumour model and MCR-treatment mice using qRT-PCR analysis. (B) CCL5, (C) TGF, (D) IL-10, (E) IL-4, (F) TNF-α and (G) IL-6 mRNA expression in breast tumors were analyzed using qRT-PCR analysis. (H) TNF and (I) IL-6 protein levels were detected by CBA assay in breast tumors. (J) CCL7, (K) CXCL10, and (L) IL-24 mRNA expression in breast tumors were analyzed using qRT-PCR analysis. Data represents the mean ± SEM, n=8 mice/group; *p < 0.05, **p < 0.01, ***p < 0.001 vs model group, as determined by one-way ANOVA followed by post hoc Tukey-Kramer test. Outliers exceed three standard deviations from the mean. |
MCR Inhibited the Immunosuppressive Cells Infiltration Within Tumor Microenvironments by Promoting the Degradation of the Extracellular Matrix
We initially observed a significant reduction in FAK mRNA levels in tumor tissues after MCR treatment at 4 g/kg and 8 g/kg (Figure 6A). To understand how MCR affects immune cell infiltration and T cell increase in tumors via FAK, we conducted RNA sequencing to analyze transcriptional changes. Using DESeq2, we identified differentially expressed genes (DEGs) with FDR<0.05 and |log2FC| ≥ 1, finding 727 genes upregulated and 103 downregulated by MCR (Figure 6B). Heat map analysis showed varying degrees of gene downregulation (Figure 6C). To gain biological insights, DEGs were analyzed for KEGG pathway enrichment, with P-values adjusted using the Benjamini-Hochberg method. A p-adjusted values less than 0.05 indicated significant enrichment. The top four KEGG pathways identified were cytokine-cytokine receptor interaction, viral protein interaction with cytokines, chemokine signaling, and ECM-receptor interaction (Figure 6D).
 |
Figure 6 MCR inhibited the immunosuppressive cells infiltration within tumor microenvironments by ECM pathway. (A) Levels of FAK mRNA as determined by qRT-PCR analysis. (B) Volcano map showed the all transcriptional changes gene which conducted by RNA sequencing analysis of the breast tumour. (C) Heatmap analysis of down-regulated gene in breast tumors of 4T1-Luc subcutaneous tumour model and MCR-treatment mice. (D) KEGG analysis of differentially expressed genes. (E) Levels of P-FAK, FAK, P-Erk, and Erk protein as determined by Western blotting. (F) Levels of Laminin, Fibronectin, MMP-2, and MMP-9 protein as determined by Western blotting. (G–J) Statistical data for the Laminin, Fibronectin, MMP-2, and MMP-9 protein expression levels. Data represents the mean ± SEM, n=6 sample/group; *p < 0.05, **p < 0.01, ***p < 0.001 vs control group; #p < 0.05, ##p < 0.01, ###p < 0.001 vs model group, as determined by one-way ANOVA followed by post hoc Tukey-Kramer test. |
In the FAK-TCRPs cell model, P-FAK and P-Erk activation were significantly upregulated compared to controls, confirming its utility for studying the FAK signaling pathway. MCR notably downregulated P-FAK and P-Erk activation (Figure 6E). Additionally, the expression of laminin, fibronectin, and MMPs (MMP2, MMP9) was higher in the model group than in controls, and MCR treatment significantly reduced their expression, suggesting MCR’s role in promoting degradation (Figure 6F–J). These findings suggest that MCR promotes extracellular matrix degradation and inhibits P-FAK and P-Erk activation.
The Antitumor Effect of MCR is Partly Regulated by FAK
We used CRISPR-Cas9 to knockout the FAK gene in 4T1 tumor cells and studied MCR’s anti-tumor effects on these FAK-deficient cells.Western blot and qRT-PCR confirmed the absence of FAK protein and reduced mRNA in FAK−/−-4T1 cells (Figure 7A and B). Using an xCELLigence system, we found that FAK−/−-4T1 cells proliferated slower than WT-4T1 cells (Figure 7C). In vivo, FAK−/−-4T1 tumors in mice were smaller and lighter compared to WT-4T1 tumors (Figure 7D and E). Additionally, FAK−/−-4T1 tumors showed increased CD8+ T cell infiltration (Figure 7F) and decreased Tregs, TAMs, and immune checkpoint molecules CTLA-4, TIGIT, and PD-1hi (Figure 7G–K). These findings position FAK as a promising antitumor target capable of dismantling the immunosuppressive microenvironment.
 |
Figure 7 The antitumor effect of MCR is partly regulated by FAK. (A) FAK protein expression in WT-4T1 and FAK−/− −4T1 cell were detected by Western blot. (B) FAK mRNA expression in these cells was analyzed via qRT-PCR. (C) The RTCA xCELLigence system evaluated the impact of WT-4T1 and FAK−/− −4T1 on cell proliferation. (D) WT-4T1 and FAK−/−-4T1 subcutaneous tumors were treated with MCR at 8 g/kg for 4 weeks, and tumor growth curves were presented. (E) Tumor weights in the model and MCR-treated groups were measured. (F) CD45+CD8+ cell percentages in tumors of model and MCR-treated mice were determined. (G) Treg cell percentages in tumors were analyzed. (H) TAM percentages in tumors of model and MCR-treated mice were assessed. (I) CD8+CTLA-4+ cell percentages in tumors were measured. (J) CD8+TIGIT+ cell percentages in tumors were evaluated. (K) Percentages and flow cytometric plots of CD8+PD-1Low, CD8+PD-1Int, and CD8+PD-1Hi cells in tumors of model and MCR-treated mice were analyzed. Data represents the mean ± SEM, n=8 mice/group; *p < 0.05, **p < 0.01, ***p < 0.001 vs model group; NSp> 0.05, #p < 0.05, ##p < 0.01 vs FAK−/−-model group. One-way ANOVA followed by the post hoc Tukey-Kramer test was used for comparisons among three or more groups, and an unpaired t-test was applied for two-group comparisons. |
MCR’s antitumor effects were reduced in the FAK−/−-4T1 model compared to the WT-4T1 model, indicating partial mediation by FAK (Figure 7D and E). In WT-4T1 mice, MCR increased CD8+ cells and decreased Tregs, TAMs, CTLA-4, and TIGIT, with no significant change in PD-1hi levels (Figure 7F–K). In FAK−/−-4T1 mice, MCR has no significant effect on CD8+, TAMs, and CTLA-4, and its impact on Tregs and TIGIT is weakened (Figure 7F–J). Overall, MCR’s growth inhibition through immune engagement relies partly on FAK.
Discussion
Extracellular stimuli like cytokines (eg, EGF and insulin) and ECM components influence membrane signal pathways to regulate the cytoskeleton and alter focal adhesion dynamics.30 Real-time, non-traumatic monitoring of these changes is essential for model development. Impedance-based TCRPs reflect dynamic shifts in membrane resistance-bound plaque complexes, crucial for the cytoskeleton.31 EGF-induced FAK phosphorylation promotes cell proliferation and migration, affecting focal adhesion dynamics.32 Previous studies have demonstrated that the inhibition of the EGF/FAK signaling pathway leads to a reduction in the viability, migratory capacity, and invasive potential of OSCC cells.33 We developed EGF-induced FAK signal TCRPs in COS-7 cells, observing increased FAK and P-FAK levels with varying EGF concentrations and stimulation times. Confocal imaging linked EGF-induced CI value increases to cytoskeletal changes, boosting cell-electrode impedance. Pretreating COS-7 cells with FAK inhibitors reduced EGF signaling, confirming the link between FAK and TCRPs. EGF binding to EGFR activates the FAK pathway, leading to intracellular signaling, including the ERK pathway. Our study showed increased phosphorylated ERK levels after EGF stimulation. These findings indicate that the kinetics induced by EGF are specifically stable and reproducible, being closely associated with FAK signaling. FAK-TCRPs were used to evaluate drug effects on FAK activity and quickly identify Traditional Chinese Medicines that inhibit FAK signaling.
As demonstrated in Supplementary Figure 1A, EGF stimulation causes cytoskeleton rearrangement, increasing cell-electrode impedance, thereby sharply raising the CI value. In the EGF-FAK-TCRPs model, various botanical extracts were tested, including Pogostemon cablin (Blanco) Benth., Adenophora tetraphylla (Thunb).Fisch., Salvia miltiorrhiza Bunge, Belamcanda chinensis (L). Redouté), Achyranthes bidentata Blume, F.A. Sophora flavescens Aiton, Polygala tenuifolia Willd., Wolfiporia cocos (F.A. Wolf) Ryvarden & Gilb., Armeniacae Amarum Semen, Moutan cortex radicis, were evaluated in the study (Supplementary Figure 1B–K). Only MCR and Salvia miltiorrhiza, both blood-activating and stasis-transforming medicines, reduced the CI peak. Notably, MCR treatment significantly reduced EGF signaling in a dose-dependent manner, proving more effective than the FAK inhibitor Y15. While FAK inhibitors are being developed for cancer treatment and have shown effectiveness against pancreatic cancer, studies on breast cancer are limited.34,35 MCR notably reduced the volume and weight of 4T1-Luc breast tumors. Since metastasis, particularly to the lungs, causes about 90% of cancer deaths. In MMTV-PyMT mice, which develop advanced breast cancer within 10–14 weeks, MCR significantly slowed cancer progression, resulting in lower lung weights and fewer, smaller metastases compared to controls. Importantly, the antitumor effect of MCR was reduced in the FAK−/−-4T1 model, suggesting FAK partially regulates its properties.
Focal adhesion kinase aids tumor immune evasion.10–12 T cells are central to immune checkpoint therapy, and the tumor immune microenvironment is the official point of interaction between the tumor and the immune system.36 Remodeling this environment and enhancing the anti-tumor response from immune cells are vital for effective immunotherapy. Activated CD8+ T cells generate durable and effective anti-tumor responses.37 MCR increased CD8+ T cell infiltration in tumors, raised central memory and effector subsets of CD4+ and CD8+ T cell. The FAK signaling pathway regulates Treg proliferation and function, recruiting them while inhibiting CD8+ T cell activation.10 Flow cytometry revealed that MCR significantly reduced infiltrating Tregs in tumors and spleens. Tumor-associated macrophages support tumor growth, progression, immunosuppression, angiogenesis, and metastasis.38 MCR treatment reduced TAM infiltration, decreased M2 macrophages, and increased M1 macrophages. Previous research has confirmed that the combination of immunotherapy with FAK inhibitors is effective in combating tumors and extending survival.39 After MCR treatment, there was a significant reduction in CTLA-4 and TIGIT levels, while PD-1hi levels remained unchanged. In FAK-deficient 4T1 mice, MCR did not alter the expression of CD8+, TAMs, or CTLA-4, but it significantly reduced the numbers of Tregs and TIGIT populations, suggesting that MCR’s regulatory effects on the tumor microenvironment are partially mediated by FAK.
FAK promotes the transcription of chemokines and cytokines that attract immunosuppressive cells to tumors, fostering immune tolerance and tumor growth.11 CCL1 and CCL5 are key for Treg recruitment, while TGF-β aids in Treg induction and expansion.40 IL-4 induces M2-like macrophage differentiation, which is anti-inflammatory, and their increase is linked to higher IL-10 levels.41 TNF-α is crucial for cancer-related inflammation, aiding in the recruitment and differentiation of immunosuppressive cells that help tumors evade the immune system and support tumor survival and growth.42 IL-6 contributes to tumor metastasis,42 CCL7 and CXCL10 boost CD8+ T cell infiltration and expansion for strong anti-tumor responses, whereas high IL-24 levels enhance T cell cytotoxicity.43–46 The study found that MCR treatment significantly decreased mRNA levels of CCL1, CCL5, TGF, IL-4, and IL-10, while both mRNA and protein levels of TNF-α and IL-6 were reduced. Meanwhile, mRNA levels of CCL7, CXCL10, and IL-4 increased. This indicates that MCR modulates inflammatory mediator expression and immune cell infiltration in the tumor microenvironment, as supported by KEGG pathway analysis.
Tumorigenesis is frequently linked to varying degrees of extracellular matrix (ECM) accumulation, as observed in breast, liver, and pancreatic cancers.47 ECM remodeling by proteases like MMPs allows tumor invasion and metastasis.48 Laminin and fibronectin are key components of the ECM. Laminin promotes tumor cell attachment and migration, while fibronectin enhances adhesion through integrin binding and activates signaling pathways such as FAK/Src and Erk to support cell proliferation and survival.49,50 The ECM serves as a critical barrier that impedes the infiltration of T cells into tumor nests.51 Degradation of the ECM fibers within tumors reduces matrix stiffness and diminishes its “physical wall” function. Concurrently, this degradation releases cytokines, leading to elevated local concentrations that enhance T cell proliferation and effector functions, thereby facilitating increased direct contact between tumors and T cells. Furthermore, ECM degradation attenuates TGF-β signaling and the mechanical tension derived from cancer-associated fibroblasts (CAFs), thereby mitigating the expansion of Tregs and the polarization of M2 macrophages.52,53 FAK hyperactivation drives ECM fibrosis and enhances the immunosuppressive tumor microenvironment. Studies have demonstrated that the combination of FAK inhibition and anti-PD1 therapy effectively suppresses the growth of hepatocellular carcinoma (HCC), reduces liver fibrosis, and increases the infiltration of CD8+ T cells.54 KEGG enrichment analysis of RNA sequencing data suggests that MCR significantly modulates the ECM signaling pathway while inhibiting FAK mRNA expression in tumor tissues. Preliminary results indicate that the activated levels of P-FAK and P-Erk proteins are downregulated in an EGF-stimulated cellular model. Given the absence of statistical analysis, it is limited to know the precise regulatory degree of MCR on P-FAK and P-Erk. However, MCR significantly lowered MMP2, MMP9, laminin, and fibronectin protein levels, inhibiting tumor growth and metastasis by preventing ECM remodeling.
In conclusion, the FAK-TCRPS model has demonstrated that the FAK-targeting Traditional Chinese Medicine, MCR, exhibits significant anti-tumor growth and metastasis effects across various tumor models, with these effects being partially mediated by FAK. Mechanistically, MCR was shown to inhibit the remodeling of ECM, subsequently down-regulating the phosphorylation of FAK and Erk. This modulation influences the expression of inflammatory mediators within the tumor microenvironment and affects the infiltration of CD8+ T cells, TAMs, and immune checkpoint molecules such as CTLA-4. Additionally, MCR significantly reduced the numbers of Tregs and TIGIT-expressing populations. A limitation of the current study is that all mechanistic and efficacy data were derived from murine models. In future research, we intend to validate these findings using patient-derived tumor organoids, employ humanized mouse models, and analyze available clinical biopsy samples to enhance the translational relevance of our results.
Abbreviations
TCRPs, Time dependent Cell Response Profilings; FAK, Focal Adhesion Kinase; TCMs, Traditional Chinese Medicines; MCR, Moutan Cortex Radicis; TAMs, tumor-associated macrophages; CTLA-4, cytotoxic T-lymphocyte–associated protein 4; PD-1, programmed cell death protein 1; TME, tumor microenvironment; Tregs, regulatory T cells; qRT-PCR, quantitative reverse transcription PCR; RTCA, Real-Time Cell Analyzer; DOX, doxorubicin; CI, Cell index; CBA, Cytometric Bead Array; TCM, central memory T cells; TEM, effector memory T cells; TSCM, stem cell-like memory T cell; DEGs, differentially expressed genes; MMPs, matrix metalloproteinases; ECM, extracellular matrix.
Data Sharing Statement
All data or resources used in the paper are available by reasonable requirements from the two corresponding authors.
Consent for Publication
Consent for publication was obtained from all participants.
Acknowledgments
We would like to express our gratitude to Dr. Beibei Cao of Zhejiang Chinese Medical University for he valuable assistance in conducting the CRISPR-Cas9 experiment.
Author Contributions
All authors made a significant contribution to the work reported, whether that is in the conception, study design, execution, acquisition of data, analysis and interpretation, or in all these areas; took part in drafting, revising or critically reviewing the article; gave final approval of the version to be published; have agreed on the journal to which the article has been submitted; and agree to be accountable for all aspects of the work.
Funding
The work is supported by the Natural Science Foundation of Zhejiang Province (Grant LY22H280012 to H.Y.F., Grant LQ23H280007 to L.J., Grant LY23H280009 to X.L.), the National Natural Science Foundation of China (Grant 82274175 and 82474168 to Q.Y.S., Grant 82174026 to H.Y.F., Grant 82404915 to L.J.), and Zhejiang Provincial Program for the Cultivation of High-level Innovative Health talents.
Disclosure
The authors have declared no competing interests in this work.
References
1. Lim B, Lin Y, Navin N. Advancing cancer research and medicine with single-cell genomics. Cancer Cell. 2020;37(4):456–470. doi:10.1016/j.ccell.2020.03.008
2. Edsjö A, Holmquist L, Geoerger B, et al. Precision cancer medicine: concepts, current practice, and future developments. J Intern Med. 2023;294(4):455–481. doi:10.1111/joim.13709
3. Kanarek N, Petrova B, Sabatini DM. Dietary modifications for enhanced cancer therapy. Nature. 2020;579(7800):507–517. doi:10.1038/s41586-020-2124-0
4. Akbari B, Hosseini Z, Shahabinejad P, Ghassemi S, Mirzaei HR, O’Connor RS. Metabolic and epigenetic orchestration of (CAR) T cell fate and function. Cancer Lett. 2022;550:215948. doi:10.1016/j.canlet.2022.215948
5. Coan M, Haefliger S, Ounzain S, Johnson R. Targeting and engineering long non-coding RNAs for cancer therapy. Nat Rev Genet. 2024;25(8):578–595. doi:10.1038/s41576-024-00693-2
6. Babamohamadi M, Mohammadi N, Faryadi E, et al. Anti-CTLA-4 nanobody as a promising approach in cancer immunotherapy. Cell Death Dis. 2024;15(1):17. doi:10.1038/s41419-023-06391-x
7. Lin X, Kang K, Chen P, et al. Regulatory mechanisms of PD-1/PD-L1 in cancers. Mol Cancer. 2024;23(1):108. doi:10.1186/s12943-024-02023-w
8. Mai Z, Lin Y, Lin P, Zhao X, Cui L. Modulating extracellular matrix stiffness: a strategic approach to boost cancer immunotherapy. Cell Death Dis. 2024;15(5):307. doi:10.1038/s41419-024-06697-4
9. Mempel TR, Lill JK, Altenburger LM. How chemokines organize the tumour microenvironment. Nat Rev Cancer. 2024;24(1):28–50. doi:10.1038/s41568-023-00635-w
10. Serrels A, Lund T, Serrels B, et al. Nuclear FAK controls chemokine transcription, Tregs, and evasion of anti-tumor immunity. Cell. 2015;163(1):160–173. doi:10.1016/j.cell.2015.09.001
11. Dawson JC, Serrels A, Stupack DG, Schlaepfer DD, Frame MC. Targeting FAK in anticancer combination therapies. Nat Rev Cancer. 2021;21(5):313–324. doi:10.1038/s41568-021-00340-6
12. Tan X, Yan Y, Song B, Zhu S, Mei Q, Wu K. Focal adhesion kinase: from biological functions to therapeutic strategies. Exp Hematol Oncol. 2023;12(1):83. doi:10.1186/s40164-023-00446-7
13. Li Y, Zhang Y, Zhang J, Zhan Z, Mao W. Development of novel focal adhesion kinase (FAK) inhibitors for targeting cancer: structural insights and therapeutic potential. Eur J Med Chem. 2024;279:116913. doi:10.1016/j.ejmech.2024.116913
14. Mullard A. FDA approves a rare novel-novel oncology combination that pairs a first-in-class FAK inhibitor with a MEK-RAF glue inhibitor. Nat Rev Drug Discov. 2025;24(6):408. doi:10.1038/d41573-025-00086-y
15. Chen S, He T, Zhong Y, et al. Roles of focal adhesion proteins in skeleton and diseases. Acta Pharm Sin. 2023;B13(3):998–1013. doi:10.1016/j.apsb.2022.09.020
16. Pan Y, Hu N, Wei X, et al. 3D cell-based biosensor for cell viability and drug assessment by 3D electric cell/matrigel-substrate impedance sensing. Biosens Bioelectron. 2019;130:344–351. doi:10.1016/j.bios.2018.09.046
17. Zhang X, Wan GR, Chen R, et al. Evaluation of drug myocardial toxicity and biological activity by real time xCELLigence analysis: a review. Sheng Wu Gong Cheng Xue Bao. 2021;37(7):2425–2434. doi:10.13345/j.cjb.200561
18. Fu H, Fu W, Sun M, et al. Kinetic cellular phenotypic profiling: prediction, identification, and analysis of bioactive natural products. Anal Chem. 2011;83(17):6518–6526. doi:10.1021/ac201670e
19. Bouchalova P, Bouchal P. Current methods for studying metastatic potential of tumor cells. Cancer Cell Int. 2022;22(1):394. doi:10.1186/s12935-022-02801-w
20. Lin HC, Ding HY, Ko FN, Teng CM, Wu YC. Aggregation inhibitory activity of minor acetophenones from Paeonia species. Planta Med. 1999;65(7):595–599. doi:10.1055/s-1999-14030
21. Tatsumi S, Mabuchi T, Abe T, Xu L, Minami T, Ito S. Analgesic effect of extracts of Chinese medicinal herbs moutan cortex and coicis semen on neuropathic pain in mice. Neurosci Lett. 2004;370(2–3):130–134. doi:10.1016/j.neulet.2004.08.043
22. Fu PK, Yang CY, Tsai TH, Hsieh CL. Moutan cortex radicis improves lipopolysaccharide-induced acute lung injury in rats through anti-inflammation. Phytomedicine. 2012;19(13):1206–1215. doi:10.1016/j.phymed.2012.07.013
23. Kim J, Lee H, Lee Y, et al. Inhibition effects of moutan cortex radicis on secretion of eotaxin in A549 human epithelial cells and eosinophil migration. J Ethnopharmacol. 2007;114(2):186–193. doi:10.1016/j.jep.2007.07.038
24. Oh GS, Pae HO, Choi BM, et al. Inhibitory effects of the root cortex of Paeonia suffruticosa on interleukin-8 and macrophage chemoattractant protein-1 secretions in U937 cells. J Ethnopharmacol. 2003;84(1):85–89. doi:10.1016/S0378-8741(02)00285-4
25. Bai M, Liu H, Wang S, et al. Dietary moutan cortex radicis improves serum antioxidant capacity and intestinal immunity and alters colonic microbiota in weaned piglets. Front Nutr. 2021;8:679129. doi:10.3389/fnut.2021.679129
26. Lee IS, Kim CS, Kim J, et al. Extract of moutan radicis cortex and cinnamomi ramulus ameliorates laser-induced choroidal neovascularization in Brown-Norway rats. Phytomedicine. 2022;94:153794. doi:10.1016/j.phymed.2021.153794
27. Liu LH, Shi RJ, Chen ZC. Paeonol exerts anti‑tumor activity against colorectal cancer cells by inducing G0/G1 phase arrest and cell apoptosis via inhibiting the Wnt/β‑catenin signaling pathway. Int J Mol Med. 2020;46(2):675–684. doi:10.3892/ijmm.2020.4629
28. Zhang C, Zhang J, Guo K. Paeonol upregulates expression of tumor suppressors TNNC1 and SCARA5, exerting anti-tumor activity in non-small cell lung cancer cells. Naunyn Schmiedebergs Arch Pharmacol. 2024;397(7):5241–5251. doi:10.1007/s00210-024-02963-6
29. Jin L, Guo Y, Mao W, et al. Total glucosides of paeony inhibit breast cancer growth by inhibiting TAMs infiltration through NF-κB/CCL2 signaling. Phytomedicine. 2022;104:154307. doi:10.1016/j.phymed.2022.154307
30. Hassanein SS, Abdel-Mawgood AL, Ibrahim SA. EGFR-Dependent extracellular matrix protein interactions might light a candle in cell behavior of non-small cell lung cancer. Front Oncol. 2021;11:766659. doi:10.3389/fonc.2021.766659
31. Fu H, Wu R, Li Y, et al. Safflower yellow prevents pulmonary metastasis of breast cancer by inhibiting tumor cell invadopodia. Am J Chin Med. 2016;44(07):1491–1506. doi:10.1142/S0192415X1650083X
32. Rao TC, Ma VP, Blanchard A, et al. EGFR activation attenuates the mechanical threshold for integrin tension and focal adhesion formation. J Cell Sci. 2020;133(13):jcs238840. doi:10.1242/jcs.238840
33. Yen WC, Chang KP, Chen CY, et al. MFI2 upregulation promotes malignant progression through EGF/FAK signaling in oral cavity squamous cell carcinoma. Cancer Cell Int. 2023;23(1):112. doi:10.1186/s12935-023-02956-0
34. Ye YX, Cao YY, Xu LS, Wang H-C, Liu X-H, Zhu H-L. FAK inhibitors in cancer, a patent review - an update on progress. Expert Opin Ther Pat. 2024;34(8):593–610. doi:10.1080/13543776.2024.2368742
35. Jiang H, Hegde S, Knolhoff BL, et al. Targeting focal adhesion kinase renders pancreatic cancers responsive to checkpoint immunotherapy. Nat Med. 2016;22(8):851–860. doi:10.1038/nm.4123
36. Baldominos P, Barbera-Mourelle A, Barreiro O, et al. Quiescent cancer cells resist T cell attack by forming an immunosuppressive niche. Cell. 2022;185(10):1694–1708.e19. doi:10.1016/j.cell.2022.03.033
37. Rahim MK, Okholm TLH, Jones KB, et al. Dynamic CD8+ T cell responses to cancer immunotherapy in human regional lymph nodes are disrupted in metastatic lymph nodes. Cell. 2023;186(6):1127–1143.e18. doi:10.1016/j.cell.2023.02.021
38. Zhang H, Liu L, Liu J, et al. Roles of tumor-associated macrophages in anti-PD-1/PD-L1 immunotherapy for solid cancers. Mol Cancer. 2023;22(1):58. doi:10.1186/s12943-023-01725-x
39. Symeonides SN, Anderton SM, Serrels A. FAK-inhibition opens the door to checkpoint immunotherapy in pancreatic cancer. J Immunother Cancer. 2017;5(1):17. doi:10.1186/s40425-017-0217-6
40. Moreau JM, Velegraki M, Bolyard C, Rosenblum MD, Li Z. Transforming growth factor-β1 in regulatory T cell biology. Sci Immunol. 2022;7(69):eabi4613. doi:10.1126/sciimmunol.abi4613
41. Aydin S, Darko K, Detchou D, Barrie U. A call for clinical trials in glioblastoma multiforme for interleukin 4, interleukin 6, interleukin 13 and CD40. Neurosurg Rev. 2024;47(1):571. doi:10.1007/s10143-024-02823-0
42. Emamalipour M, Shamdani S, Mansoori B, Uzan G, Naserian S. The implications of the TNFα - TNFR2 immune checkpoint signaling pathway in cancer treatment: from immunoregulation to angiogenesis. Int J Cancer. 2025;156(1):7–19. doi:10.1002/ijc.35130
43. Manore SG, Doheny DL, Wong GL, Lo HW. IL-6/JAK/STAT3 signaling in breast cancer metastasis: biology and treatment. Front Oncol. 2022;12:866014. doi:10.3389/fonc.2022.866014
44. Zhang M, Yang W, Wang P, et al. CCL7 recruits cDC1 to promote antitumor immunity and facilitate checkpoint immunotherapy to non-small cell lung cancer. Nat Commun. 2020;11(1):6119. doi:10.1038/s41467-020-19973-6
45. Yan W, Qiu L, Yang M, et al. CXCL10 mediates CD8+ T cells to facilitate vessel normalization and improve the efficacy of cetuximab combined with PD-1 checkpoint inhibitors in colorectal cancer. Cancer Lett. 2023;567:216263. doi:10.1016/j.canlet.2023.216263
46. Zhang K, Hu W, Li F, et al. 2-24. IL-24 improves efficacy of CAR-T cell therapy by targeting stemness of tumor cells. Br J Cancer. 2024;130(8):1337–1347. doi:10.1038/s41416-024-02601-1
47. Sleeboom JJF, van Tienderen GS, Schenke-Layland K, van der Laan LJW, Khalil AA, Verstegen MMA. The extracellular matrix as hallmark of cancer and metastasis: from biomechanics to therapeutic targets. Sci Transl Med. 2024;16(728):eadg3840. doi:10.1126/scitranslmed.adg3840
48. Zhu S, He J, Yin L, et al. Matrix metalloproteinases targeting in prostate cancer. Urol Oncol. 2024;42(9):275–287. doi:10.1016/j.urolonc.2024.05.002
49. Nonnast E, Mira E, Mañes S. Biomechanical properties of laminins and their impact on cancer progression. Biochim Biophys Acta Rev Cancer. 2024;1879:189181.
50. Vitillo L, Kimber SJ. Integrin and FAK regulation of human pluripotent stem cells. Curr Stem Cell Rep. 2017;3(4):358–365. doi:10.1007/s40778-017-0100-x
51. Arpinati L, Carradori G, Scherz-Shouval R. CAF-induced physical constraints controlling T cell state and localization in solid tumours. Nat Rev Cancer. 2024;24(10):676–693. doi:10.1038/s41568-024-00740-4
52. Hu Q, Zhu Y, Mei J, Liu Y, Zhou G. Extracellular matrix dynamics in tumor immunoregulation: from tumor microenvironment to immunotherapy. J Hematol Oncol. 2025;18(1):65. doi:10.1186/s13045-025-01717-y
53. Yu KX, Yuan WJ, Wang HZ, Li YX. Extracellular matrix stiffness and tumor-associated macrophage polarization: new fields affecting immune exclusion. Cancer Immunol Immunother. 2024;73(6):115. doi:10.1007/s00262-024-03675-9
54. Wei Y, Wang Y, Liu N, et al. A FAK inhibitor boosts Anti-PD1 immunotherapy in a hepatocellular carcinoma mouse model. Front Pharmacol. 2022;12:820446. doi:10.3389/fphar.2021.820446
 © 2025 The Author(s). This work is published and licensed by Dove Medical Press Limited. The
full terms of this license are available at https://www.dovepress.com/terms
and incorporate the Creative Commons Attribution
- Non Commercial (unported, 4.0) License.
By accessing the work you hereby accept the Terms. Non-commercial uses of the work are permitted
without any further permission from Dove Medical Press Limited, provided the work is properly
attributed. For permission for commercial use of this work, please see paragraphs 4.2 and 5 of our Terms.
© 2025 The Author(s). This work is published and licensed by Dove Medical Press Limited. The
full terms of this license are available at https://www.dovepress.com/terms
and incorporate the Creative Commons Attribution
- Non Commercial (unported, 4.0) License.
By accessing the work you hereby accept the Terms. Non-commercial uses of the work are permitted
without any further permission from Dove Medical Press Limited, provided the work is properly
attributed. For permission for commercial use of this work, please see paragraphs 4.2 and 5 of our Terms.