Back to Journals » International Journal of Women's Health » Volume 14
Factors Predicting Successful Vaginal Delivery Following Induction of Labor in Term Pregnancy
Authors Kamlungkuea T ![]() , Manonai J
, Manonai J ![]() , Suriyawongpaisal P, Hansahiranwadee W
, Suriyawongpaisal P, Hansahiranwadee W ![]()
Received 13 November 2021
Accepted for publication 22 January 2022
Published 19 February 2022 Volume 2022:14 Pages 245—255
DOI https://doi.org/10.2147/IJWH.S347878
Checked for plagiarism Yes
Review by Single anonymous peer review
Peer reviewer comments 3
Editor who approved publication: Dr Everett Magann
Threebhorn Kamlungkuea,1 Jittima Manonai,1 Paibul Suriyawongpaisal,2 Wirada Hansahiranwadee1
1Department of Obstetrics and Gynaecology, Faculty of Medicine Ramathibodi Hospital, Mahidol University, Bangkok, Thailand; 2Department of Community Medicine, Faculty of Medicine Ramathibodi Hospital, Mahidol University, Bangkok, Thailand
Correspondence: Wirada Hansahiranwadee, Department of Obstetrics and Gynaecology, Faculty of Medicine Ramathibodi Hospital, Mahidol University, 270, Rama 6 Road, Ratchathewee, Bangkok, Thailand, Tel +66 22012166, Fax +66 22011413, Email [email protected]
Purpose: This study was proposed to evaluate factors predicting a successful vaginal delivery following labor induction and develop induction prediction model in term pregnancy among Thai pregnant women.
Patients and Methods: We conducted a retrospective cohort study using electronic medical records of 23,833 deliveries from April 2010 to July 2021 at tertiary care university hospital in Bangkok, Thailand. Univariate regression was performed to identify the association of individual parameters to successful vaginal delivery. Multiple logistic regression analysis of all possible variables from univariate analysis was performed to develop a prediction model with statistically significant of p value < 0.05.
Results: Of the total 809 labor-induced pregnancies, the vaginal delivery rate was 56.6%. Among predicting variables, history of previous vaginal delivery (aOR 5.75, 95% CI 3.701– 8.961), maternal delivery BMI < 25 kg/m2 (aOR 2.010, 95% CI 1.303– 3.286), estimated fetal weight < 3500 g (aOR 2.193, 95% CI 1.246– 3.860), and gestational age ≤ 39 weeks (aOR 1.501, 95% CI 1.038– 2.173) significantly increased the probability of a successful vaginal delivery following labor induction. The final prediction model has been internally validated. Model calibration and discrimination were satisfactory with Hosmer–Lemeshow test P = 0.21 and with AUC of 0.756 (95% CI 0.695– 0.816).
Conclusion: This study determined the pragmatic predictors for successful vaginal delivery following labor induction comprised history of previous vaginal delivery, maternal delivery BMI < 25 kg/m2, estimated fetal weight < 3500 g, and gestational age ≤ 39 weeks. The final induction prediction model was well-performing internally validated prediction model to estimate individual probability when undergoing induction of labor. Despite restricted population, the predicting factors and model could be useful for further prospective study and clinical practice to improve induction outcomes.
Keywords: labor induction, prediction model, prediction factor, Asian population
Introduction
Induction of labor (IOL) is defined as artificial stimulation to initiate uterine contractions before the spontaneous onset of labor. IOL is indicated when the benefits to either the mother or fetus outweigh the risks of continuing pregnancy.1 Besides the advantages of IOL, it has cost and clinical implications, including higher maternal and neonatal complications due to their unpredictable duration and the probability of a successful vaginal birth. The induction process increases the risk of postpartum hemorrhage and postpartum hysterectomy in pregnant women.2–4 In fetuses, this procedure can induce uterine tachysystole, which is associated with fetal heart rate deceleration and fetal compromise.1 Therefore, the likelihood of unplanned emergent cesarean deliveries is higher than that in spontaneous labor.
Currently, the rate of IOL among deliveries has continued to rise, accounting for 4.4% in Africa, 12.1% in Asia, and approximately 20% in the United States and the United Kingdom.5 According to current obstetric practice, the trend of induction only in late term (41 weeks of gestation) shifted to full term (39 weeks of gestation) in uncomplicated pregnancies.6–9 Unfortunately, one fifth of labor inductions fail to achieve vaginal birth, particularly in nulliparous Asian women who are electively induced or have a medical indication (eg, diabetes mellitus, hypertension, and preeclampsia). IOL in this group has the greater risk of cesarean section.10–13
For many years, studies were conducted to estimate the factors affecting the ability of IOL to achieve vaginal delivery, such as maternal age, parity, body mass index (BMI), fetal birth weight,4,14–16 and the Bishop score, which is composed of cervical characteristics and the station of presentation.14 These factors are commonly used to predict a successful vaginal delivery following labor induction. However, the overall sensitivity and specificity to predict vaginal delivery widely vary from 12% to 100% and 12% to 95%, respectively.17,18 Moreover, many published prediction models for predicting a successful vaginal delivery following induction are often limited in their scope (eg, methodology and performance) and generalizability because they included only women in a single center, with not many studies in the Asian population.4,10,13,15
This study aimed to evaluate the prevalence of a successful vaginal delivery and the factors associated with this success, and to develop a clinical prediction model of vaginal delivery following IOL.
Materials and Methods
Study Design and Population
We conducted a retrospective cohort study using electronic medical record data of 23,833 consecutive deliveries at Ramathibodi Hospital, which is a tertiary care university hospital in Bangkok, Thailand, from April 2010 to July 2021. The study design consisted of identifying predictive factors using multiple logistic regression analysis, construction of a prediction model, and validation of the model. We included pregnancies that were indicated for IOL in the last 10 consecutive years with a single live fetus in the cephalic presentation, the women had no previous uterine scar, and the women were induced after 37 weeks of gestation.
This study excluded pregnancies that had intrauterine fetal demise, a gestational age <37 weeks, indicated for emergency cesarean section or decision to elective cesarean section at the admission time, presentation with spontaneous labor pain (regular uterine contraction plus cervical dilation ≥4 cm with effacement ≥80%),19,20 a ruptured amniotic fluid membrane, a contraindication for IOL, or unrestored electronic medical records.
DOI: http://dx.doi.org/10.17504/protocols.io.bztup6nw
Outcome and Predictors
The primary outcome was vaginal delivery following IOL. Over the last 10 years of induction practices in Ramathibodi Hospital, delivery services have comprised resident practices, maternal–fetal medicine services, and private practices of staff following the hospital’s IOL protocol. This protocol uses vaginal misoprostol 50 mcg every 6 hours,1 for a maximum of four doses or until the cervical Bishop score is ≥8,21 or the membranes spontaneously rupture. Labor was then managed as the active phase (Appendix 1).19,42–46
Potential associated variables for a successful vaginal delivery following IOL were secondary outcomes, which were chosen on the basis of a systematic review of the literature and selected individual studies.4,5,10,11,15,16,18,22 The 19 included variables were categorized into maternal, cervical, and fetal factors. Definitions of presumed variables were identified. Maternal age was recorded as complete years on the day of delivery. Gestational age was defined as completed weeks calculated from the best estimated date of delivery (from the last menstrual period, the first accurate ultrasound, or both). The estimated fetal weight was derived by transabdominal ultrasound before the induction process. The pre-pregnant body weight was self-reported. If these data were missing, then the weight on the first visit to antenatal care was recorded (Appendix 1).
Sample Size
The sample size was calculated using the formula for testing two independent proportions. At least 305 women in each of the vaginal and cesarean delivery groups were required to examine the possible associated factors, with a power of 80% and a 5% alpha error, and an additional 10% data loss.10,23
In the model development phase, all included subjects were randomly divided into two groups to diversely distribute any updated conditions over 10 years, such as induction indications and the recommended gestational age of delivery in individual conditions. A total of 566 (70%) women were included to develop the prediction model and 243 (30%) were used for internal validation of the final model.
Missing Data
For variables with ≤10% of missing data, a randomly missing pattern was examined by the t-test. If data were randomly missing, single imputation modeling with predictive mean matching was used to substitute missing values with estimates. Variables with >10% of missing data or those that were not randomly missing were omitted from the model development phase.
Statistical Analyses
The patients’ characteristics are shown as the mean ± standard deviation and proportion (%). A univariate regression was performed to identify the association of individual parameters with successful vaginal delivery. Continuous variables were tested by Student’s t-test for equality of means. Categorical variables were compared using the Pearson chi-square test or the Mann–Whitney U-test according to their distribution. All possible variables from univariate regression with p values <0.1 were confirmed as independent variables by chi-square test and interaction effect by t-test. We included the significant variables with P < 0.05 to adjust the prediction models by backward stepwise multiple logistic regression analysis. Statistical testing of predictive factors was conducted with p < 0.05, which was considered to be significant for inclusion in the prediction model. Associations were summarized using odds ratios (ORs) and corresponding 95% confidence intervals (CIs) estimated from the final model. Model calibration was assessed by dividing the development cohort into deciles, which were plotted to predict the probability of vaginal delivery. The Hosmer–Lemeshow test was used to evaluate the goodness-of-fit for the model (p < 0.05 indicated a significant lack of fit). The discriminatory ability of the prediction model was assessed using the area under the receiver operating characteristic curve. Finally, likelihood ratios were calculated for each range of predictive probability. The final model was internally validated. The analysis was performed using STATA software package, version 16.1 (Stata Corp, College Station, TX, USA).
Ethical Approval
The study was approved by the Office of The Committee for Research, Faculty of Medicine Ramathibodi Hospital, Mahidol University (COA.MURA2020/167) to access electronic medical records of pregnant patients who were enrolled in the study. The written informed consents were waived by the institutional review board because of the retrospective type of the study. Medical data and personal information were confidentially maintained, anonymously collected, and conducted in accordance with the Declaration of Helsinki.
Data Sharing Statement
The authors intend to share individual participant data that underlie the results reported in this article, after deidentification (text, tables, figures, and appendices). The data include study protocol, statistical analysis plan and analytic code. While the other study documents can be available by sending proposals directed to [email protected]. To gain access, data requestors will need to sign a data access agreement. The data will be available immediately following the publication and there is no end date.
Results
Among the 23,833 deliveries during the study period, we identified 1011 pregnancies with the indication for IOL. The prevalence rate gradually increased from 2.98% in 2010 to 4.55% in 2020. Of the 202 excluded pregnant women, 72 had unrestored electronic medical records. Of the remaining 130 excluded women, women presented with spontaneous labor pain, cesarean section was indicated, the gestational age was <37 weeks, there was intrauterine fetal demise, or the mother decided to have an elective cesarean section (Figure 1).
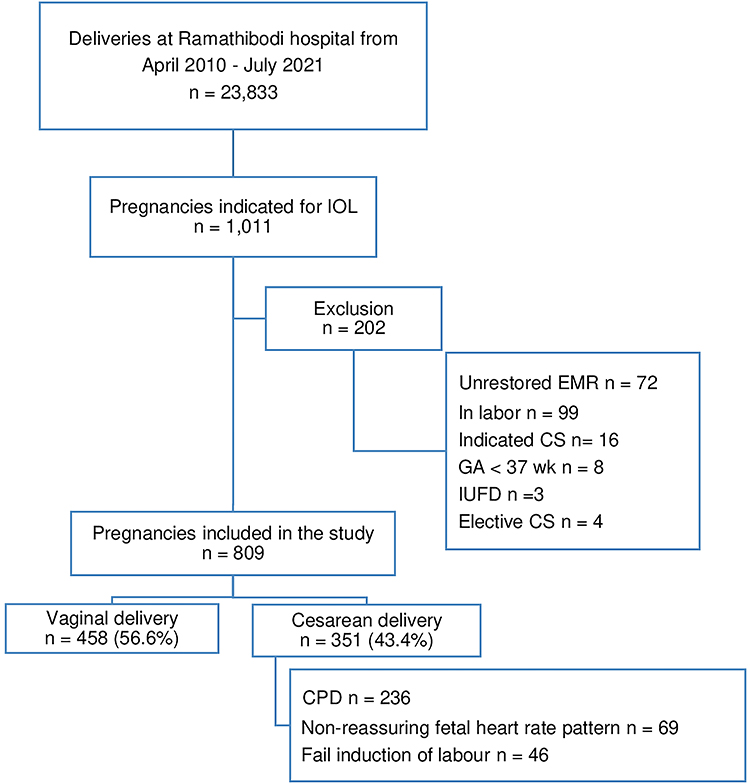 |
Figure 1 Patient selection flow chart. Abbreviations: IOL, induction of labor, CS, cesarean section, GA, gestational age, IUFD, intrauterine fetal death, EMR, electronic medical record, CPD, cephalopelvic disproportion. |
Overall, 809 pregnancies were included in this study. The successful vaginal delivery rate following IOL was 56.6%, and the cesarean section rate was 43.4%. The decision for cesarean section was based on maternal indications (eg, failure for the cervix to ripen after four doses of misoprostol and non-progress of labor or cephalopelvic disproportion) and/or fetal indications, of which most were an abnormal fetal heart rate tracing in the National Institute of Child Health and Human Development (NICHD) category II or III.24
With regard to maternal parameters, a univariate analysis showed that pre-pregnancy BMI, weight at delivery, BMI at delivery and weight gain during pregnancy were significantly lower in pregnant women in the vaginal delivery group than in those who were in the cesarean section group after IOLs (all p < 0.05). BMI < 25 kg/m2 at delivery and a history of previous vaginal delivery were significantly associated with a successful vaginal delivery following IOL (both p < 0.05). Maternal height in the vaginal delivery group was significantly higher than that in the cesarean section group (p = 0.018) (Table 1).
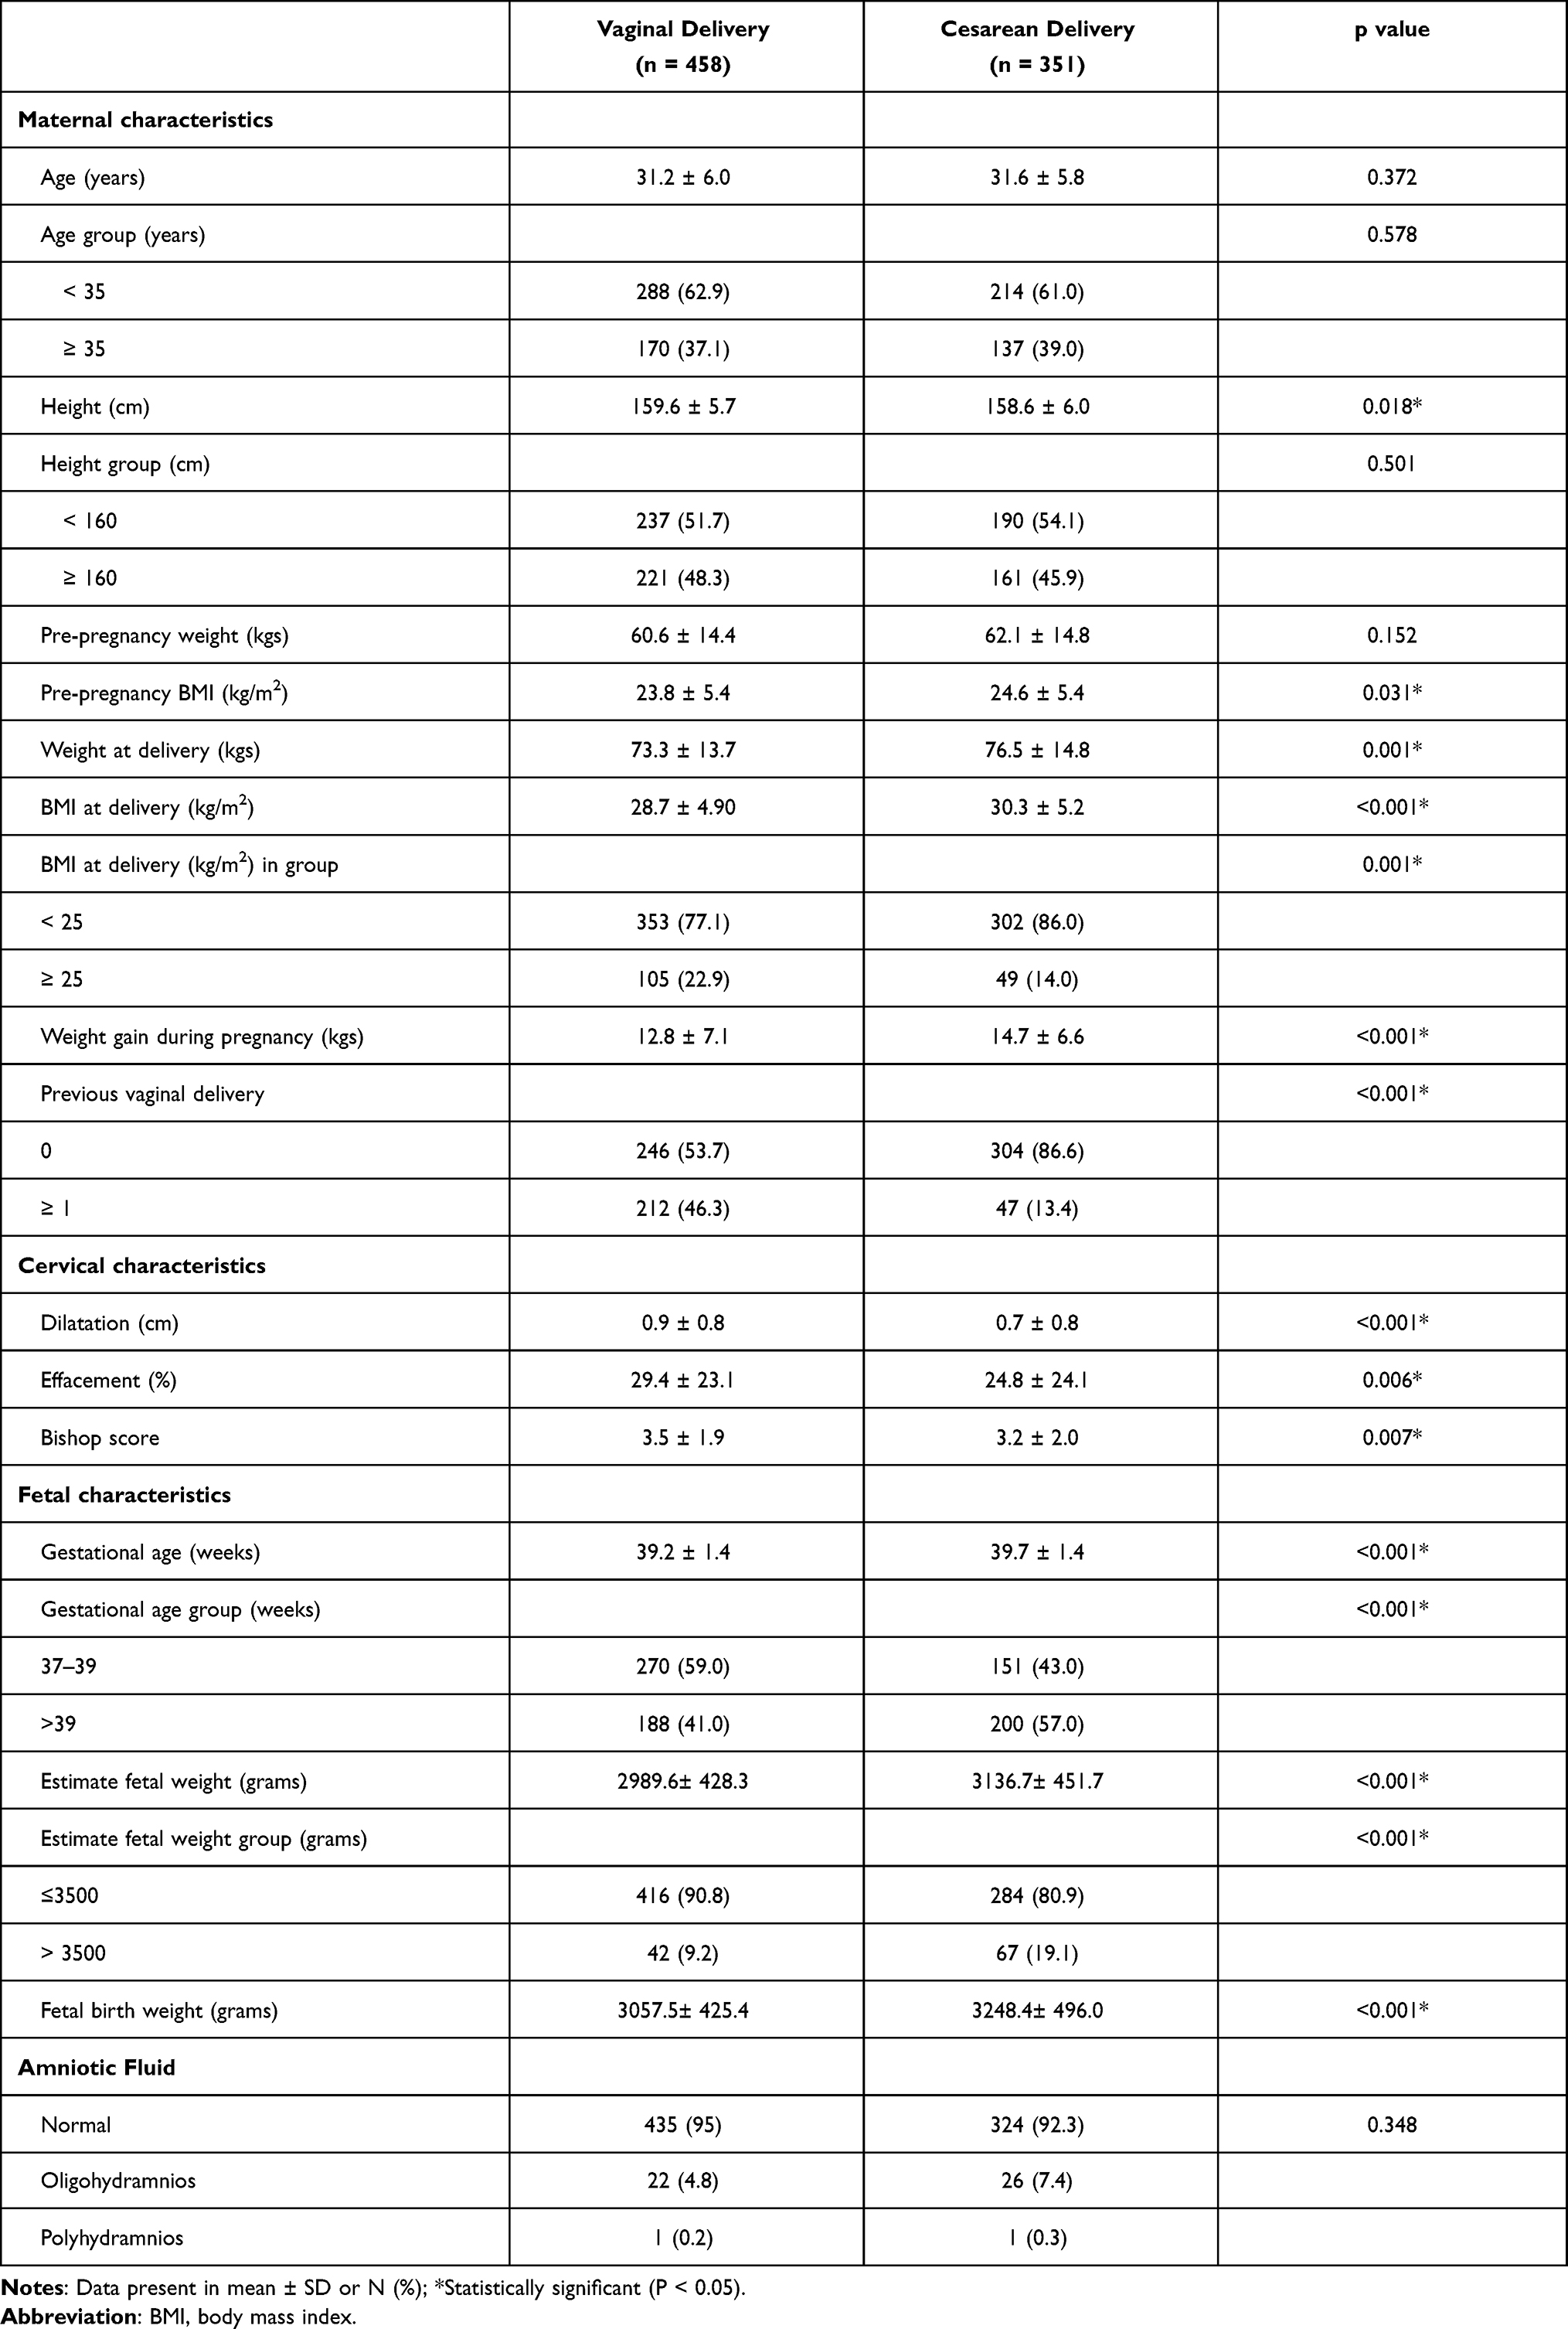 |
Table 1 Maternal Demographic and Clinical Characteristics of Pregnancies Undergoing Induction of Labor |
With regard to cervical characteristics, the parameters that were significantly associated with successful vaginal delivery following IOL were cervical dilatation, cervical effacement, and the pre-induction cervical Bishop score (all p < 0.05). The cervix in the vaginal delivery group was more favorable compared with that in the cesarean section group (p = 0.007).
With regard to fetal characteristics and pregnancy factors, gestational age, estimated fetal weight (by ultrasound), and fetal birth weight in the cesarean section group were significantly higher than those in the vaginal delivery group (all p < 0.001). Similarly, gestational age in the subgroup of 37–39 weeks and the estimated fetal weight, particularly in the subgroup of <3500 g, were significantly related to a successful vaginal delivery following IOL (both p < 0.001). Induction by the indication of diabetes mellitus, fetal growth restriction, and induction in full-term pregnancy were significantly associated with vaginal delivery (all p < 0.001) (Table 2). The amount of amniotic fluid was not significantly different between the vaginal delivery group and the cesarean section group following IOL.
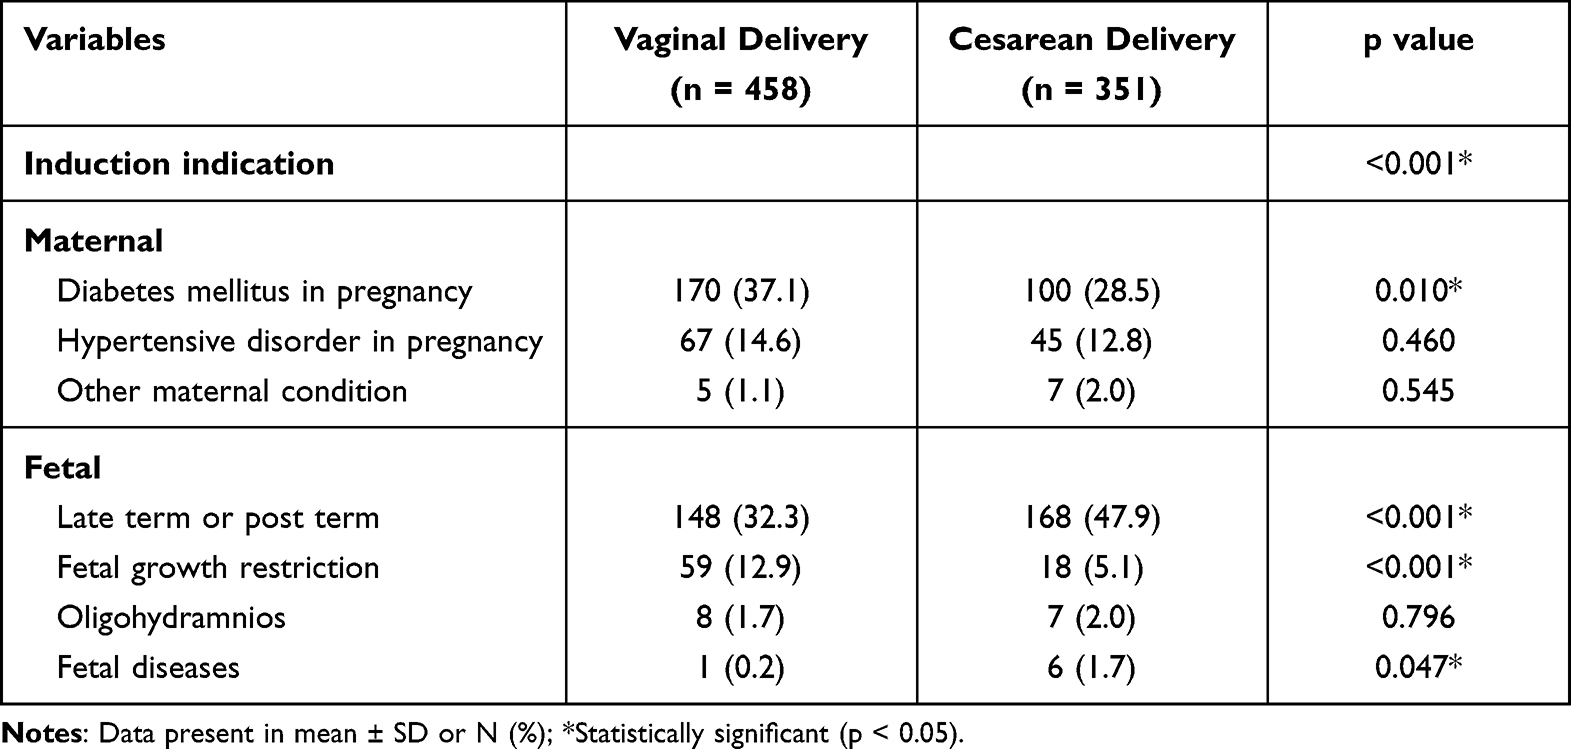 |
Table 2 Maternal and Fetal Indications of Pregnancies Undergoing Induction of Labor |
Using backward stepwise multivariate logistic regression, the final prediction model (Appendix 2) showed that a history of previous vaginal delivery, maternal BMI < 25 kg/m2 at delivery, gestational age ≤39 weeks, and estimated fetal weight <3500 g were significantly associated with the probability of vaginal delivery following IOL (Table 3). The strongest contributing variable was a history of vaginal delivery, which increased the probability of vaginal delivery in nulliparous women by more than five-fold (adjusted OR [aOR] 5.759, 95% CI 3.701–8.961). An estimated fetal weight <3500 g and maternal BMI < 25 kg/m2 at delivery were associated with a more than two-fold increased probability of vaginal delivery (aOR 2.193, 95% CI 1.246–3.860; and aOR 2.010, 95% CI 1.303–3.286, respectively). IOL at a gestational age ≤39 weeks also had a positive correlation with a successful vaginal delivery (aOR 1.501, 95% CI 1.038–2.173).
 |
Table 3 Multiple Regression Analysis of Final Model Predicting Successful Vaginal Delivery Following Induction of Labor |
The performance of the model was determined by calibration and discrimination (Figure 2). The expected rate of vaginal delivery by deciles of predicted probability was considered satisfactory, as demonstrated by a histogram (Figure 2A) and the Hosmer–Lemeshow goodness-of-fit test (X2 = 4.26, p = 0.21). The receiver operating characteristic curve for the development model had an area under the curve (AUC) of 0.732 (95% CI 0.692–0.772) (Figure 2B). The predicted probability cutoff of 0.567 had the most optimal sensitivity and specificity values, and was determined as a “positive test”. Individual pregnancies that scored ≥0.567 were predicted to have a successful vaginal delivery and those that scored <0.567 were predicted to have cesarean section after undergoing IOL. With this cutoff, the sensitivity was 62.85%, and the specificity was 72.43%.
 |
Figure 2 Model performance for predicting successful vaginal delivery following IOLs in term of calibration and discrimination performance. (A) Histogram of predicted probability of vaginal delivery with Hosmer-Lemeshow goodness-of-fit test X2 = 4.26, p = 0.21 (B) Receiver operating characteristic curve of the final model. Area under the curve 0.732, (95% CI 0.692–0.772). |
The cutoff score was calibrated, and deciles were stratified into seven ranks from 0.350 to 0.906. The estimated positive likelihood ratio of successful vaginal delivery for each score was 1.54, 2.28, 2.61, 3.10, 4.81, and 19.56 compared with the lowest probability risk score group (Table 4).
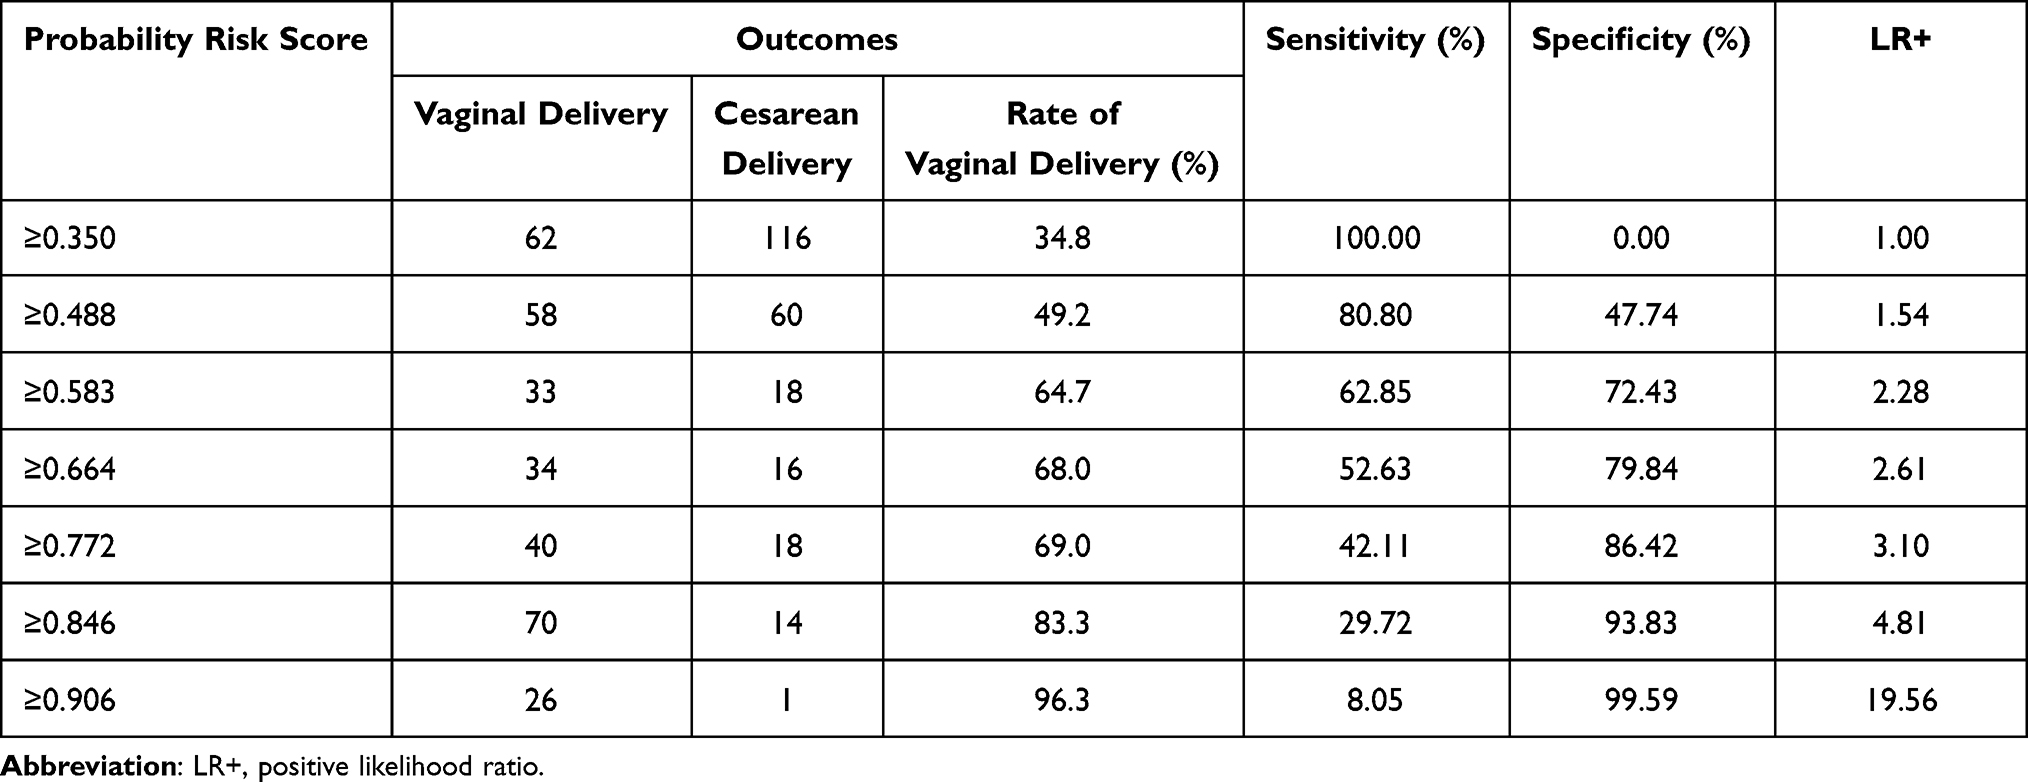 |
Table 4 Vaginal Delivery Probability Risk Score and Likelihood Ratios Stratification |
Using the validation set (n = 243), the predictive model was internally validated, and the calibration was considered satisfactory with a Hosmer–Lemeshow test value of X2 = 5.972 (p = 0.31). The discriminatory ability of the predictive model showed an AUC of 0.756 (95% CI 0.695–0.816). Using the same cutoff value, the sensitivity was 64.20% and the specificity was 73.2%.
Discussion
For decades, various prediction models have been developed to determine the likelihood of vaginal birth following IOL. However, no specific published models have widespread applicability or can currently be recommended for clinical practice because they are limited in generalizability, methodology, and/or performance. Although many prediction models have been previously reported, they are specific to the population (eg, pregnancy with hypertensive disorders, nulliparous women, and preterm induction).7,20,25,26
We aimed to identify predictors of vaginal delivery following IOL in Thai pregnancies that might be representative characteristics of Asian women and fetuses, particularly in Southeast Asia. The features of our model were the distinctive cutoff of each associated predictor of vaginal delivery following IOL in the Asian population. Each predictor was accessible, factual, and not dependent on personal experience, and they were derived from maternal demographic variables, antenatal history, and fetal characteristics.
As a result of a multi-level decision to perform cesarean section (resident practices, general obstetricians and maternal–fetal medicine services), the cesarean section rate (43.4%) following IOL in this study was relatively high during last 10 years. This finding was correlated with our overall primary cesarean section rate of 30–35%. The individual judgement of obstetricians who cared for the patients could have been a confounder for induction failure and the cesarean section indication for cesarean section. According to the consensus of cephalopelvic, disproportion or induction failure criteria cannot be applied to every case before making the decision.27 However, our model had a sensitivity of 62.85% and a specificity of 72.43% to predict the probability of vaginal delivery with a good discrimination (AUC 0.756, 95% CI 0.695–0.816) compared with prior published models, which had an AUC that ranged from 0.68 to 0.82.20,28 Therefore, our model showed a good performance.
The strongest contributing variable in this study was the maternal history of previous vaginal delivery, which is similar to a previous study that affirms pelvic adequacy for further vaginal birth.3,25 In many studies, maternal overweight and obesity were significantly associated with a higher risk of cesarean delivery, particularly in low- and middle-income countries.3,20,28,29 In high-income countries (eg, Europe, Central Asia, and South Asia), a BMI ≥ 25 kg/m2 was associated with an emergency cesarean section.29 Similarly, in our model, maternal BMI < 25 kg/m2 at delivery significantly increased the probability of vaginal birth. Additionally, the pattern of overweight and obesity differs between ethnicities, countries, regions, and the level of income.30,31
With regard to fetal factors, our model showed that IOL at a gestational age ≤39 weeks promoted vaginal delivery, independently of birthweight. This finding is consistent with some randomized trials and meta-analysis.6–8 These studies showed that elective IOL at 39 weeks was associated with a significantly lower risk of cesarean delivery and adverse perinatal outcomes compared with that with expectant management beyond this gestational age. The lower rate of cesarean section in pregnant woman who elective induction of labor at 39 weeks of gestation from recent systematic review was 16.7%32 which is still higher than the ideal rate from WHO recommendation of 10% to 15%.33 In Thailand, especially in our institute, we induced labor of low-risk pregnancy at gestational age 41 weeks – 41 weeks + 6 days. In this practice, our primary cesarean rate is 30–35%, which is comparable with the national data.34 Shifting the induction of labor to 39 weeks of gestation might lower the cesarean section rate. Despite this, it may not be as low as the ideal number.
Recent studies have shown that the estimated fetal weight by ultrasound is accurate nowadays. A systematic review showed that the formula used to calculate the estimated fetal weight by ultrasound consistently produced random errors below 10%.35 Other studies showed that, in pregnancies with macrosomia and a birth weight >4000 g, there was an increased risk of an emergency cesarean section.36,37 This finding is consistent with the difference in estimated fetal weight and fetal birth weight in our study. Asian neonates with normal growth usually have a lower birthweight compared with those in Western countries.38 Our model showed that IOL with an estimated fetal weight <3500 g (90th percentile of Thai neonates’ birthweight)39 increased the probability of vaginal birth.
Based on clinical practice, the Bishop score and cervical ripening are important tools to determine the potential success of IOL.14 Using univariate analysis in this study, the cervical factors consisting of cervical dilatation, cervical effacement, and the Bishop score were associated with a successful vaginal delivery. However, these parameters were diversified by physician evaluating performance, since many compositions of the Bishop score such as the cervical consistency and cervical position are relatively subjective evaluation. As a result, cervical characteristics were not significantly associated with a successful vaginal delivery in multivariate analysis and the model development phase. A systematic review showed that the initial Bishop score did not affect the route of delivery after IOL.40 Therefore, cervical parameters were removed from the final model.
Strength and Limitation
The main strengths of our study are the specific predictors and cutoff values that were more specific for Asian women, particularly among Southeast Asians. The model that we used has been internally validated with good discrimination and calibration after recalibration of the model.41 This model can help pregnant women and physicians to appreciate the probability and likelihood of success in vaginal delivery when undergoing IOL. All included variables in the final prediction model consisted of demographic data, obstetric history, and fetal characteristics, which can be evaluated at the outpatient clinic before making the decision to perform IOL.
There are several limitations to the study, including a uniform population that only included Thai women, which could limit their external validity. Therefore, this study requires external validation in other populations before widespread clinical application. Additionally, there was a restricted variety of induction regimens that could compromise the generalizability of the study.
Conclusion
This study shows that a maternal BMI < 25 kg/m2 at delivery, gestational age ≤39 weeks, estimated fetal weight ≤3500 g, and history of previous vaginal delivery are significant predictors of a successful vaginal delivery following IOL. These factors are pragmatic for clinical application, and the model used in this study has a good clinical application for estimating the individual probability of vaginal delivery and providing information to pregnant women before the induction procedure. However, the use of the model is not intended to preclude the IOL in those with low probability calculated from the risk score.
Acknowledgments
We thank Ellen Knapp, PhD, from Edanz (https://edanz.com/ac) for editing a draft of this manuscript.
Disclosure
The authors report no conflicts of interest in this work.
References
1. The American College of Obstetricians and Gynecologists. ACOG practice bulletin no. 107: induction of labor. Obstet Gynecol. 2009;114:386–397. doi:10.1097/AOG.0b013e3181b48ef5
2. Bailit JL, Gregory KD, Reddy UM, et al. Maternal and neonatal outcomes by labor onset type and gestational age. Am J Obstet Gynecol. 2010;202:245–e1. doi:10.1016/j.ajog.2010.01.051
3. Alavifard S, Meier K, Shulman Y, et al. Derivation and validation of a model predicting the likelihood of vaginal birth following labour induction. BMC Pregnancy Childbirth. 2019;19:1–9. doi:10.1186/s12884-019-2232-8
4. Bonsack CF, Lathrop A, Blackburn M. Induction of labor: update and review. J Midwifery Women's Health. 2014;59:606–615. doi:10.1111/jmwh.12255
5. World Health Organization. WHO recommendations: induction of labour at or beyond term. World Health Organization; 2018.
6. Grobman WA, Caughey AB. Elective induction of labor at 39 weeks compared with expectant management: a meta-analysis of cohort studies. Am J Obstet Gynecol. 2019;221:304–310. doi:10.1016/j.ajog.2019.02.046
7. Grobman WA, Rice MM, Reddy UM, et al. Labor induction versus expectant management in low-risk nulliparous women. N Engl J Med. 2018;379:513–523. doi:10.1056/NEJMoa1800566
8. El-Sayed YY, Rice MM, Grobman WA, et al. Elective labor induction at 39 weeks of gestation compared with expectant management: factors associated with adverse outcomes in low-risk nulliparous women. Obstet Gynecol. 2020;136:692–697. doi:10.1097/AOG.0000000000004055
9. Sotiriadis A, Petousis S, Thilaganathan B, et al. Maternal and perinatal outcomes after elective induction of labor at 39 weeks in uncomplicated singleton pregnancy: a meta-analysis. Ultrasound Obstet Gynecol. 2019;53:26–35. PMID: 30298532. doi:10.1002/uog.20140
10. Vogel JP, Souza JP, Gülmezoglu AM. Patterns and outcomes of induction of labour in Africa and Asia: a secondary analysis of the WHO global survey on maternal and neonatal health. PLoS One. 2013;8:e65612. doi:10.1371/journal.pone.0065612
11. Vardo JH, Thornburg LL, Glantz JC. Maternal and neonatal morbidity among nulliparous women undergoing elective induction of labor. J Reprod Med. 2011;56:25–30.
12. Baños N, Migliorelli F, Posadas E, et al. Definition of failed induction of labor and its predictive factors: two unsolved issues of an everyday clinical situation. Fetal Diagn Ther. 2015;38:161–169. doi:10.1159/000433429
13. Ehrenthal DB, Jiang X, Strobino DM. Labor induction and the risk of a cesarean delivery among nulliparous women at term. Obstet Gynecol. 2010;116:35–42. doi:10.1097/AOG.0b013e3181e10c5c
14. Kolkman DG, Verhoeven CJ, Brinkhorst SJ, et al. The Bishop score as a predictor of labor induction success: a systematic review. Am J Perinatol. 2013;30:625–630. doi:10.1055/s-0032-1331024
15. Gibson KS, Waters TP. Measures of success: prediction of successful labor induction. Semin Perinatol. 2015;39:475–482. doi:10.1053/j.semperi.2015.07.012
16. Heffner LJ, Elkin E, Fretts RC. Impact of labor induction, gestational age, and maternal age on cesarean delivery rates. Obstet Gynecol. 2003;102:287–293. doi:10.1016/s0029-7844(03)00531-3
17. McCarthy FP, Kenny LC. Induction of labour. Obstet Gynaecol Reprod Med. 2014;24:9–15. doi:10.1016/j.ogrm.2013.11.004
18. Hofmeyr GJ, Gülmezoglu AM, Pileggi C. Vaginal misoprostol for cervical ripening and induction of labour. Cochrane Database Syst Rev. 2010:CD000941. PMID: 20927722; PMCID: PMC7061246. doi:10.1002/14651858.CD000941.pub2
19. Hendricks CH, Brenner WE, Kraus G. Normal cervical dilatation pattern in late pregnancy and labor. Am J Obstet Gynecol. 1970;106:1065–1082. doi:10.1016/S0002-9378(16)34092-3
20. Zhang J, Troendle J, Mikolajczyk R, et al. The natural history of the normal first stage of labor. Obstet Gynecol. 2010;115:705–710. doi:10.1097/AOG.0b013e3181d55925
21. Edwards RK, Richards DS. Preinduction cervical assessment. Clin Obstet Gynecol. 2000;43:440–446. doi:10.1097/00003081-200009000-00004
22. Meier K, Parrish J, D’Souza R. Prediction models for determining the success of labor induction: a systematic review. Acta Obstet Gynecol Scand. 2019;98:1100–1112. doi:10.1111/aogs.13589
23. Bernard R. Fundamentals of Biostatistics.
24. Robinson B, Nelson L. A review of the proceedings from the 2008 NICHD workshop on standardized nomenclature for cardiotocography: update on definitions, Interpretative systems with management strategies, and research priorities in relation to intrapartum electronic fetal monitoring. Rev Obstet Gynecol. 2008;1:186–192. PMID: 19173023; PMCID: PMC2621055.
25. Beninati MJ, Ramos SZ, Danilack VA, et al. Prediction model for vaginal birth after induction of labor in women with hypertensive disorders of pregnancy. Obstet Gynecol. 2020;136:402–410. doi:10.1097/AOG.0000000000003938
26. Feghali M, Timofeev J, Huang C, et al. Preterm induction of labor: predictors of vaginal delivery and labor curves. Am J Obstet Gynecol. 2015;212(1):
27. San Román GA. Concerns regarding a validated calculator to estimate risk of cesarean delivery after an induction of labor with an unfavorable cervix. Am J Obstet Gynecol. 2018;219:421–422. doi:10.1016/j.ajog.2018.04.061
28. Rahman MM, Abe SK, Kanda M, et al. Maternal body mass index and risk of birth and maternal health outcomes in low- and middle-income countries: a systematic review and meta-analysis. Obes Rev. 2015;16:758–770. doi:10.1111/obr.12293
29. Jatta F, Sundby J, Vangen S, et al. Association between maternal origin, pre-pregnancy body mass index and caesarean section: a nation-wide registry study. Int J Environ Res Public Health. 2021;18:5938. doi:10.3390/ijerph18115938
30. Ng M, Fleming T, Robinson M, et al. Global, regional, and national prevalence of overweight and obesity in children and adults during 1980–2013: a systematic analysis for the Global Burden of Disease Study 2013 [published correction appears in Lancet. 2014;384:746]. Lancet. 2014;384:766–781. doi:10.1016/S0140-6736(14)60460-8
31. Goldstein RF, Abell SK, Ranasinha S, et al. Gestational weight gain across continents and ethnicity: systematic review and meta-analysis of maternal and infant outcomes in more than one million women. BMC Med. 2018;16:153. doi:10.1186/s12916-018-1128-1
32. Middleton P, Shepherd E, Morris J, et al. Induction of labour at or beyond 37 weeks’ gestation. Cochrane Database Syst Rev. 2020;15(7):CD004945. PMID: 32666584; PMCID: PMC7389871. doi:10.1002/14651858.CD004945.pub5
33. World Health Organization. WHO statement on caesarean section rates. World Health Organization; 2015.
34. Liabsuetrakul T, Sukmanee J, Thungthong J, et al. Trend of cesarean section rates and correlations with adverse maternal and neonatal outcomes: a secondary analysis of Thai universal coverage scheme data. AJP Rep. 2019;9:e328–e336. PMID: 31673478; PMCID: PMC6821536. doi:10.1055/s-0039-1697656
35. Milner J, Arezina J. The accuracy of ultrasound estimation of fetal weight in comparison to birth weight: a systematic review. Ultrasound. 2018;26:32–41. doi:10.1177/1742271X17732807
36. Weissmann-Brenner A, Simchen MJ, Zilberberg E, et al. Maternal and neonatal outcomes of macrosomic pregnancies. Med Sci Monit. 2012;18:PH77–PH81. doi:10.12659/msm.883340
37. Beta J, Khan N, Khalil A, et al. Maternal and neonatal complications of fetal macrosomia: systematic review and meta-analysis. Ultrasound Obstet Gynecol. 2019;54:308–318. doi:10.1002/uog.20279
38. Kiserud T, Benachi A, Hecher K, et al. The World Health Organization fetal growth charts: concept, findings, interpretation, and application. Am J Obstet Gynecol. 2018;218:S619–S629. doi:10.1016/j.ajog.2017.12.010
39. Borisut P, Kovavisarach E. Standard intrauterine growth curve of Thai neonates delivered at Rajavithi hospital. J Med Assoc Thai. 2014;97:798–803.
40. Mishanina E, Rogozinska E, Thatthi T, et al. Use of labour induction and risk of cesarean delivery: a systematic review and meta-analysis. CMAJ. 2014;186:665–673. doi:10.1503/cmaj.130925
41. Toll DB, Janssen KJ, Vergouwe Y, et al. Validation, updating and impact of clinical prediction rules: a review. J Clin Epidemiol. 2008;61:1085–1094. doi:10.1016/j.jclinepi.2008.04.008
42. Friedman EA. Labor: Clinical Evaluation and Management.
43. Rouse DJ, Owen J, Hauth JC. Active-phase labor arrest: oxytocin augmentation for at least 4 hours. Obstet Gynecol. 1999;93:323–328. PMID: 10074971. doi:10.1016/s0029-7844(98)00448-7
44. Park KH. Transvaginal ultrasonographic cervical measurement in predicting failed labor induction and cesarean delivery for failure to progress in nulliparous women. J Korean Med Sci. 2007;22(4):722–727. doi:10.3346/jkms.2007.22.4.722
45. World Health Organization partograph in management of labour. World Health Organization maternal health and safe motherhood programme. Lancet. 1994;343(8910):1399–1404.
46. The American College of Obstetricians and Gynecologists. ACOG practice bulletin number 145. Antepartum fetal surveillance. Obstet Gynecol. 2014;124:182–192. doi:10.1097/01.AOG.0000451759.90082.7b
 © 2022 The Author(s). This work is published and licensed by Dove Medical Press Limited. The
full terms of this license are available at https://www.dovepress.com/terms
and incorporate the Creative Commons Attribution
- Non Commercial (unported, 3.0) License.
By accessing the work you hereby accept the Terms. Non-commercial uses of the work are permitted
without any further permission from Dove Medical Press Limited, provided the work is properly
attributed. For permission for commercial use of this work, please see paragraphs 4.2 and 5 of our Terms.
© 2022 The Author(s). This work is published and licensed by Dove Medical Press Limited. The
full terms of this license are available at https://www.dovepress.com/terms
and incorporate the Creative Commons Attribution
- Non Commercial (unported, 3.0) License.
By accessing the work you hereby accept the Terms. Non-commercial uses of the work are permitted
without any further permission from Dove Medical Press Limited, provided the work is properly
attributed. For permission for commercial use of this work, please see paragraphs 4.2 and 5 of our Terms.