Back to Journals » Diabetes, Metabolic Syndrome and Obesity » Volume 12
Factors influencing insulin sensitivity during hyperinsulinemic-euglycemic clamp in healthy Korean male subjects
Authors Shin D ![]() , Eom YS
, Eom YS ![]() , Chon S, Kim BJ, Yu KS
, Chon S, Kim BJ, Yu KS ![]() , Lee DH
, Lee DH ![]()
Received 20 November 2018
Accepted for publication 12 February 2019
Published 10 April 2019 Volume 2019:12 Pages 469—476
DOI https://doi.org/10.2147/DMSO.S195350
Checked for plagiarism Yes
Review by Single anonymous peer review
Peer reviewer comments 2
Editor who approved publication: Professor Ming-Hui Zou
Dongseong Shin,1,2 Young Sil Eom, 3,4 Suk Chon,5 Byung-Joon Kim, 3,4 Kyung-Sang Yu,6,* Dae Ho Lee 3,4,*
1Department of Pharmacology, Gachon University College of Medicine, Incheon, Korea; 2Clinical Trials Center, Gachon University Gil Medical Center, Incheon, Korea; 3Department of Internal Medicine, Gachon University College of Medicine, Incheon, Korea; 4Department of Internal Medicine, Gachon University Gil Medical Center, Incheon, Korea; 5Department of Endocrinology and Metabolism, Kyung Hee University School of Medicine, Seoul, Korea; 6Department of Clinical Pharmacology and Therapeutics, Seoul National University College of Medicine and Hospital, Seoul, Korea
*These authors contributed equally to this work
Background and objective: The effects of age and related factors on insulin sensitivity have not been definitively evaluated in East Asian populations. We proposed a reference range for the glucose disposal rate (M-value) on hyperinsulinemic-euglycemic study and its association with other parameters.
Methods: Healthy, non-diabetic young (n=10) and elderly (n=13) male subjects with normal body mass index were eligible for this study. Subjects who passed the oral glucose tolerance test (OGTT) underwent hyperinsulinemic-euglycemic clamp with high-dose (80 mU/m2·min) insulin infusion.
Results: M-values were normalized to body weight (MBW) and fat-free mass (MFFM). Neither M-value was significantly different between age groups (P=0.458 and P=0.900, respectively). An inverse correlation was observed between MFFM and baseline insulin (r=−0.418; P=0.047), baseline C-peptide (r=−0.426; P=0.043) and OGTT 2-hour glucose (r=−0.452; P=0.030). Regarding correlations with other insulin sensitivity indices, M-values were positively associated with the Matsuda index but not with homeostasis model assessment of insulin resistance.
Conclusion: Our results suggest that age is not a critical determinant of insulin sensitivity, while fasting insulin and C-peptide levels, OGTT 2-hour glucose level, and Matsuda index are predictable markers of insulin sensitivity in healthy Koreans.
Keywords: insulin sensitivity, hyperinsulinemic-euglycemic clamp, glucose disposal rate, age, Matsuda index
Introduction
Insulin resistance is a status impaired metabolic actions of insulin and is considered a key factor in the pathophysiology of metabolic syndrome, including type 2 diabetes mellitus.1 However, the epidemiological characteristics of type 2 diabetes differ among ethnic groups in various regions; for instance, a lower degree of obesity at a younger age, longer periods with chronic complications, and earlier death have been observed in Asians.2,3 In addition to ethnic differences in insulin resistance, a greater prevalence of type 2 diabetes has been reported in some Asian populations.2
Variations in insulin sensitivity can be observed during puberty or pregnancy as part of the normal life cycle, but insulin sensitivity is markedly influenced by various factors, including obesity, age and physical inactivity.4–6 Some studies have also suggested that glucose tolerance decreases with age in relation to fatness.7
Several simple surrogate indices have been used to assess whole-body insulin sensitivity in vivo, such as the quantitative insulin sensitivity check index, homeostasis model assessment of insulin resistance (HOMA-IR) and Matsuda index, but the hyperinsulinemic-euglycemic clamp is generally considered the gold standard.2,8 Because the hyperinsulinemic-euglycemic clamp is time consuming, laborious and expensive, estimating insulin sensitivity through the glucose disposal rate (GDR or M-value) by the clamp study and its reference range is limited in practice, especially for high-dose insulin infusions in East Asians, including Koreans.1 Therefore, in this study, we evaluated the M-values and explored the correlated factors and contributing effects of age on insulin sensitivity in healthy, non-diabetic, Korean, male subjects.
Methods
Study population and design
Healthy, non-diabetic, male subjects who were 19–29 years of age (the young group) and 50 −70 years of age (the elderly group) were eligible for this study if their body mass index (BMI) was 18.5–25.0 for the young group and 18.5–29.0 for the elderly group. A medical history assessment, physical examination, 12-lead electrocardiogram and clinical laboratory testing were performed for the screening test. This study was conducted in accordance with the principles of the Korean Good Clinical Practice and the Declaration of Helsinki. The Institutional Review Board of Gachon University Gil Medical Center approved this research protocol and the informed consent form for this study (GCIRB2016-226, GBIRB2015-326). This research was registered in a publically accessible primary register (Clinical Research Information Service, KCT0003156, 30/08/2019). All subjects provided voluntary written informed consent after receiving a full explanation of this study.
Subjects who passed the screening test underwent an oral glucose tolerance test (OGTT) within 3 weeks. During the OGTT, the serum glucose, insulin and C-peptide levels were measured following ingestion of a 75-g glucose load (Gluorange; Korea Mcnulty’s Co. Ltd., Hwaseong, Korea) after a 10-hour overnight fast. If the serum glucose level was ≥200 mg/dL, the subject was excluded from the hyperinsulinemic-euglycemic clamp study. After the OGTT, the body composition was evaluated based on the fat mass, fat-free mass (FFM), skeletal muscle mass, percent body fat and waist–hip ratio (WHR) using a multifrequency impedance plethysmograph body composition analyzer (InBody 720; Biospace, Seoul, Korea). The plasma glucagon and total/active glucagon-like peptide-1 (GLP-1) levels were also determined in 10 subjects in the elderly group.
Hyperinsulinemic-euglycemic clamp testing after a 10-hr fast was performed within 1 week following the OGTT. An intravenous (IV) catheter for blood sampling was inserted into the right antecubital vein with a warm pad for arterialization of venous blood, and a second IV line for insulin and glucose infusion was placed in the left antecubital vein. During clamp testing, insulin (Humulin R; Eli Lilly and Co., Indianapolis, IN, USA) was infused at a rate of 10 mU/m2·min for 100 min, and then a high dose of insulin (80 mU/m2·min) was applied for 100 mins to suppress hepatic glucose production. A 20% dextrose solution was administered, and the plasma glucose levels were measured every 5 mins. During the last 20 mins at steady state, the plasma glucose level was maintained at 90–99 mg/dL for calculation of the GDR.
Bioanalytical assessment
The plasma glucose concentration during clamp was determined by the glucose oxidase method using the Stat Plus glucose analyzer (Yellow Springs Instruments, OH, USA). The detection range was 0–900 mg/dL with an inter-assay precision of ±2%. The serum insulin and C-peptide levels were measured using a two-site sandwich immunoassay with direct chemiluminescent technology (ADVIA Centaur XPT; Siemens Healthineers, Erlangen, Germany). The detection ranges were 0.5–300 mU/L for insulin and 0.05–30 ng/mL for C-peptide, and the precision was 6.3–7.5% and 5.1–6.2%, respectively. Blood samples for the measurements of GLP-1, glucagon, glucose-dependent insulinotropic polypeptide (GIP) were collected in vacutainer tubes containing a protease inhibitor cocktail including dipeptidyl peptidase-4 inhibitors (P800, Becton Dickinson, Franklin Lakes, NJ, USA). Tubes were immediately placed on ice and centrifuged at 3,000 g for 10 mins at 4°C. Other plasma and serum isolations were performed as usual to assess additional neurohormonal and metabolic profiles. Plasma and serum were stored in a deep freezer at −80°C until analyses. Plasma levels of active GLP-1 and total GIP were measured by using commercial ELISA kits (EMD Millipore, St. Charles, MO, USA), respectively. The active GLP-1 assay kit detects specifically both 7-36-amide GLP-1 and 7-37 GLP-1, with no cross-reactivity with other forms of GLP-1, and proglucagon-derived peptides. Detection limit for active GLP-1 was 2 pM and all values were above the limit of detection. Plasma glucagon level was quantified by using an ELISA kit from Mercodia, which used one C-terminal and one N-terminal antibody to eliminate cross-reactivity to any other proglucagon-derived peptides.
Statistical analysis
Baseline demographic and clinical data are presented as the mean ± SD with the coefficient of variation according to the age group. We investigated the factors that affected insulin sensitivity based on differences in demographic factors and relationships between clinical laboratory variables and the M-value. The Mann–Whitney U test was performed to specify significant differences in demographic and baseline clinical characteristics between the young and elderly age groups. To evaluate the relationships between the glucagon and GLP-1 levels with insulin sensitivity, the areas under the plasma concentration curve (AUC) for glucagon and total/active GLP-1 were calculated using the linear trapezoidal method. Pearson’s correlation coefficients were calculated to measure the strength of the linear associations between various variables and the M-value. If the variables were not normally distributed, the non-parametric Spearman’s correlation test was used to determine the degree of association between two variables. The statistical analyses were performed using the SPSS 22.0 (IBM Corporation, Armonk, NY, USA) statistical software. Statistical significance was considered at P<0.05.
Results
Demographics and baseline characteristics
A total of 40 subjects were screened for this study, including 18 subjects in the young age group and 22 subjects in the elderly age group. Fifteen of the 18 subjects in the young group and 21 of the 22 subjects in the elderly group passed the screening tests and underwent the OGTT. Two subjects in the young group and seven subjects in the elderly group were excluded from the clamp study due to high levels of 2-hour glucose level (≥140 mg/dL) on the OGTT. Regarding the risk of impaired glucose tolerance, the failure rate of the OGTT was 13.3% (2/15) in the young group and 33.3% (7/21) in the elderly group. No significant difference was observed between age groups (P=0.252). Ultimately, hyperinsulinemic-euglycemic clamp testing was completed, and assessable M-values were obtained for 10 subjects in the young group and 13 subjects in the elderly group.
In subjects for whom an M-value was reported, the mean ± SD ages and BMI in the young and elderly groups were 23±3 and 57±7 years and 22.6±1.3 and 23.2±1.3 kg/m2, respectively. The BMI did not significantly differ between the age groups (P=0.372). However, the fat-related body composition indices were greater in the elderly group than in the young group, and the fat mass, percent body fat and WHR were higher in the elderly group than in the young group (P=0.010, P=0.002, and P=0.010, respectively). The detailed demographic data are presented in Table 1.
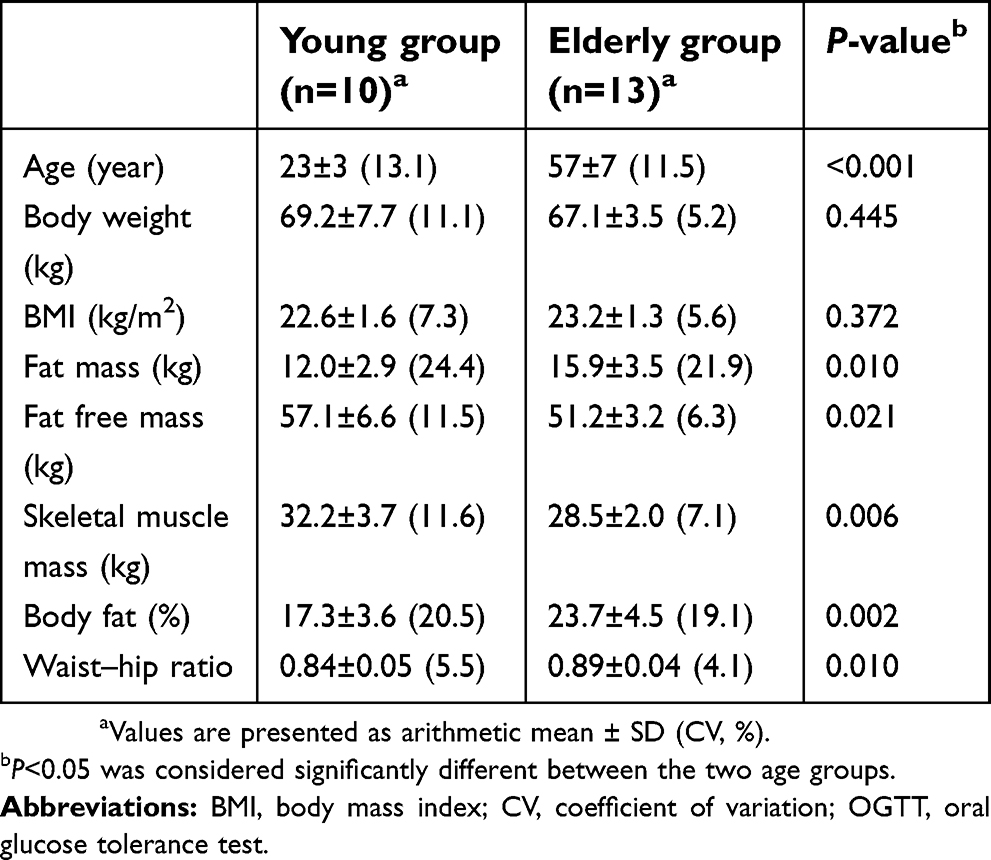 | Table 1 Baseline demographic and clinical characteristics of subjects who completed the hyperinsulinemic euglycemic clamp |
Liver function tests and lipid profiles, including gamma-glutamyltransferase, total cholesterol, high-density lipoprotein cholesterol (HDL-C), low-density lipoprotein cholesterol and hemoglobin A1c (HbA1c), showed differences between the age groups: specifically, the HDL-C level was higher and the other test results were lower in the young group than in the elderly group (Table 2).
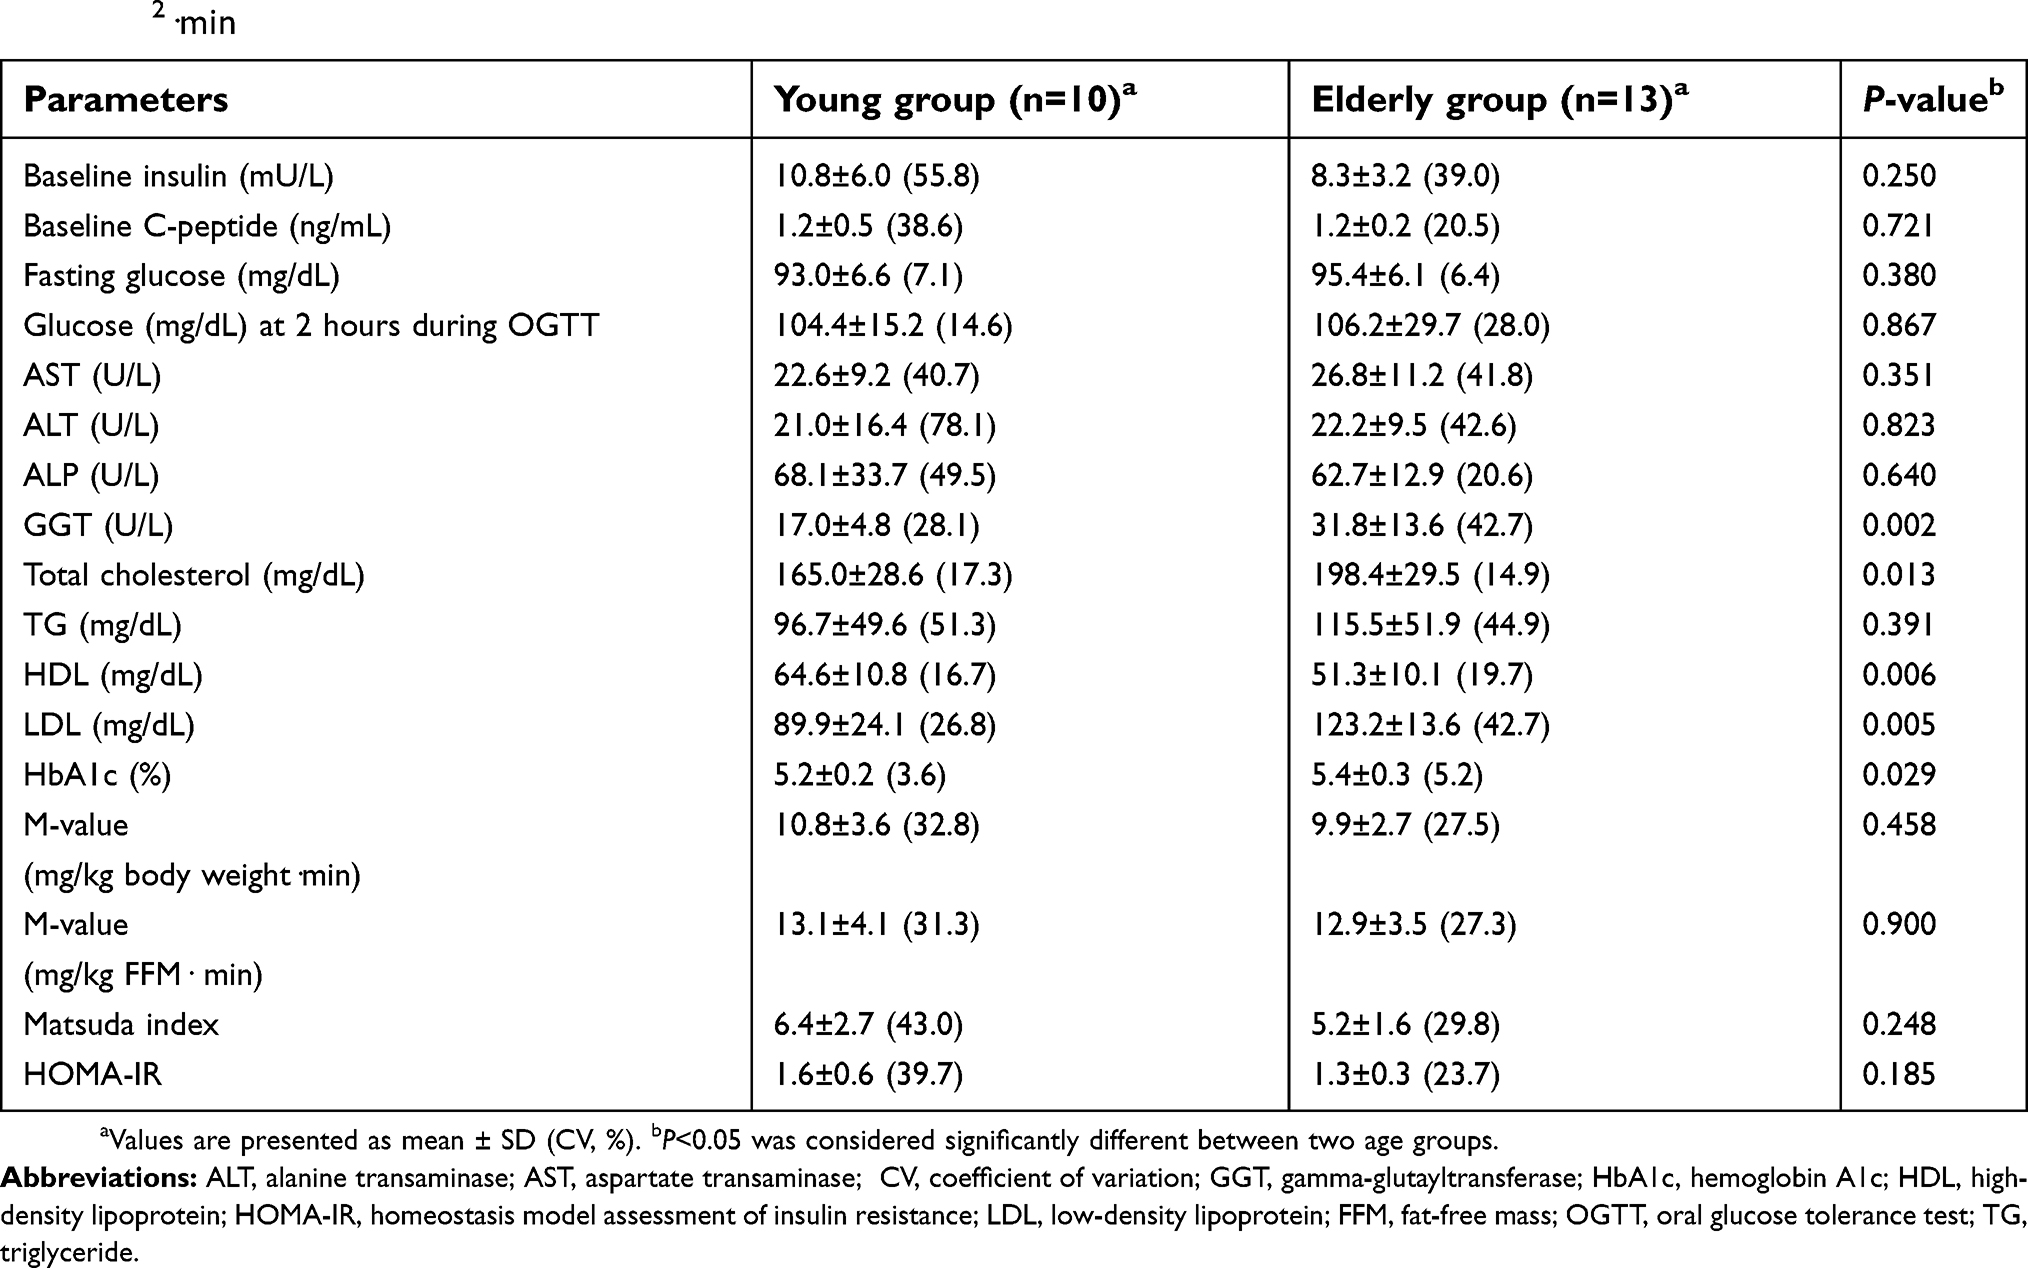 | Table 2 Baseline clinical characteristics and parameters of insulin sensitivity under hyperinsulinemic euglycemic clamp at 80 mU/m2·min |
Insulin sensitivity
The M-value was expressed according to the body weight and FFM. The M-values normalized by body weight (MBW) for insulin sensitivity were 10.8±3.6 mg/kg·min in the young group and 9.9±2.7 mg/kg·min in the elderly group. In addition, the FFM-normalized M-values (MFFM) were 13.1±4.1 mg/kg FFM·min in the young group and 12.9±3.5 mg/kg FFM·min in the elderly group. The M-values normalized by both body weight and FFM were comparable between the two age groups (P=0.458 for body weight and P=0.900 for FFM). The HOMA-IR and Matsuda index were 1.6±0.6 and 6.4±2.7 in the young group and 1.3±0.3 and 5.2±1.6 in the elderly group, respectively. No differences according to the age group were observed (P=0.185 for the HOMA-IR and P=0.248 for the Matsuda index).
Regarding the relationships with insulin sensitivity, a remarkable inverse correlation was found between the MFFM and baseline insulin (r=−0.418, P=0.047), baseline C-peptide (r=−0.426, P=0.043), and 2-hour glucose in the OGTT (r=−0.452, P=0.030) for age ranges (Figure 1). In each individual age group, these negative correlations with baseline insulin and 2-hour glucose in the OGTT were significant in the elderly group; however, no significant correlation between those clinical parameters and MFFM-value was found in the young group (Table 3). With respect to the MBW, only baseline C-peptide showed a significant inverse correlation (r=−0.435, P=0.038). In the elderly group, baseline insulin (r=−0.593, P=0.033), baseline C-peptide (r=−0.557, P=0.048), and 2-hour glucose in the OGTT (r=−0.568, P=0.043) were correlated with the MBW; however, the correlations were non-significant in the young group.
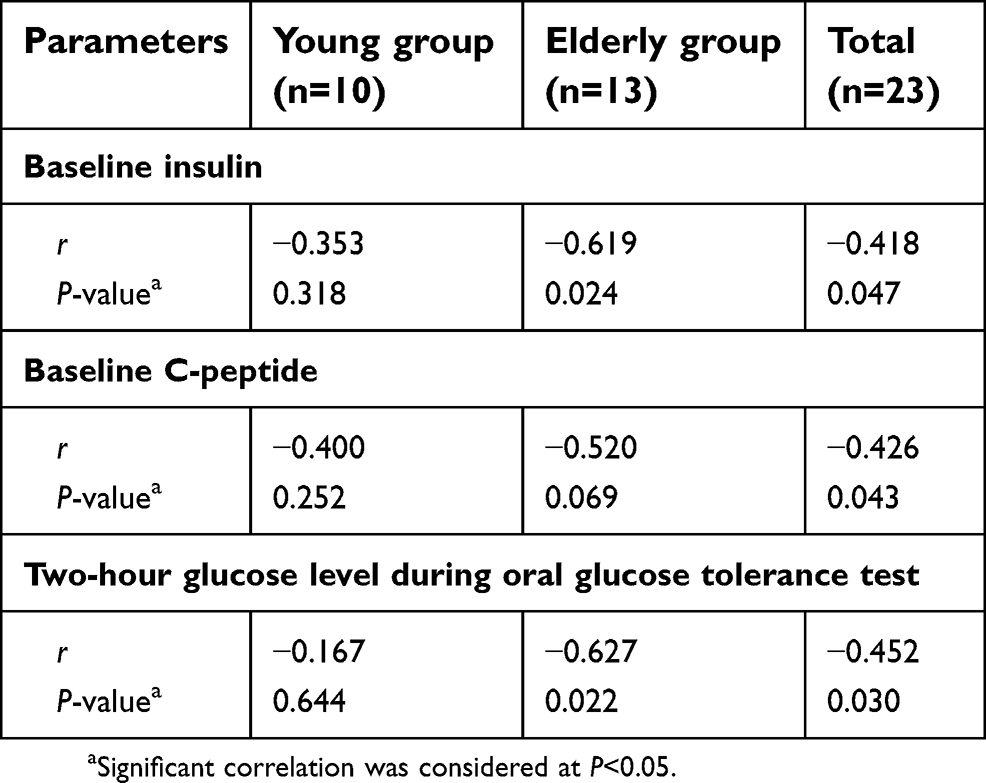 | Table 3 Correlation of M-value normalized by fat-free masswith insulin, C-peptide and 2-hour glucose in oral glucose tolerance test according to age groups |
 | Figure 1 Inverse relationship of M-value normalized by FFM with (A) baseline insulin (r=−0.418, P=0.047), (B) baseline C-peptide (r=−0.426, P=0.043) and (C) glucose at 2 hours during OGTT (r=−0.452, P=0.030).Abbreviations: FFM, fat-free mass; OGTT, oral glucose tolerance test. |
Regarding correlations with other insulin sensitivity indices, the M-values were positively associated with the Matsuda index (r=0.492, P=0.017 for MBM and r=0.437, P=0.037 for MFFM). Conversely, no significant correlation was observed with the HOMA-IR (r=−0.302, P=0.162 for MBM and r=−0.330, P=0.124 for MFFM).
Discussion
In this study, factors that might be associated with insulin sensitivity were evaluated according to age group, and a reference range for the M-value was estimated through hyperinsulinemic-euglycemic clamp under high-dose insulin infusion (80 mU/m2·min) in healthy, non-diabetic, Korean subjects. The use of a high insulin dose was expected to have some benefits, including full suppression of endogenous glucose production and time and cost-effectiveness.1
After hyperinsulinemic-euglycemic clamp testing with an insulin dose of 80 mU/m2·min, the mean M-values were 13.0 mg/kg·min for FFM and 10.3 mg/kg·min for body weight in healthy Korean subjects. These M-values were similar or slightly higher than the GDRs in Caucasians, and the minimum values in Koreans were above the cut-off value for insulin resistance suggested in Caucasians.1,5 A higher insulin sensitivity was in East Asians was reported previously, which might be related to a lower visceral fat content or functional insulin secretion compared to those of other ethnic groups, including Caucasians and Africans.9,10 Additionally, the healthy Koreans in this study had lower BMIs than non-diabetic Caucasians. Because the BMI was negatively correlated with the GDR, the differences in the average BMI between ethnic groups might contribute to the differences in insulin sensitivity.9,11 This high sensitivity for the maintenance of a normal glucose range could be one cause leading to the relatively early onset of type 2 diabetes in East Asians, because even a small defect in insulin action or sensitivity can easily cause a hyperglycemic status.9
In several studies, aging was associated with a decreased FFM and increased abdominal fat.12 Inverse relationships were reported between age and insulin sensitivity, which were most likely due to increased adiposity or physical inactivity related to age.13 The present results in healthy Korean subjects demonstrated a similar tendency; the elderly group had a reduced skeletal muscle mass, increased fat composition and generally elevated cholesterol profile compared to those of the young group. However, although demographic differences were present between the age group, these age-related demographic factors did not demonstrate a significant difference or correlation with the M-values obtained from hyperinsulinemic-euglycemic clamp between the age groups. In addition, the failure rate of OGTT was seem to be higher in elderly group, the difference was not statistically insignificant These results support the idea that insulin sensitivity may not be determined by age-related factors, such as fat or muscle changes, under normal conditions.5,14 In addition, elderly subjects who showed impaired glucose tolerance in the OGTT were included in previous studies of age-associated insulin resistance.4 However, only subjects with a normal glucose tolerance (a serum 2-hour glucose concentration <140 mg/dL during the OGTT) participated in our study. As a result, age itself was not an independent risk factor for insulin resistance in BMI-matched healthy subjects with normal glucose tolerance on OGTT.
We investigated factors related to insulin sensitivity through correlations with M-values. Among the tested parameters, the baseline insulin, baseline C-peptide and 2-hour glucose level in the OGTT inversely correlated with the MFFM. Inverse correlations between these parameters and the MBW were also observed, although significant correlations were only found for the baseline C-peptide level (Table S1). Because the FFM, which is mainly composed of muscle, is independently associated with glucose homeostasis and the pathogenesis of metabolic syndrome, a stronger significant correlation was found for MFFM.15 From the perspective of the clinical meaning of insulin sensitivity, these inverse correlations reflect the efficacy of insulin for maintenance of a normal glucose range.16 As a simple indirect indicator of insulin resistance, the usefulness of fasting insulin and C-peptide was suggested in asymptomatic subjects.17,18 Additionally, plasma glucose at 2 hours in the OGTT is considered one criterion for diagnosing diabetes or prediabetes.19 As a result, the baseline insulin, baseline C-peptide and 2-hour glucose level in the OGTT could be useful markers for insulin sensitivity in clinical practice, especially the MFFM in subjects with normal physiology.
Indirect indices of insulin sensitivity, including the HOMA-IR and Matsuda index, showed some correlations with the M-values during hyperinsulinemic-euglycemic clamp.2,20 However, because ethnicity can affect the consistency of these simple markers, their utility in clinical practice is limited.20 In the present study, of the two simple markers, the Matsuda index was a relevant surrogate index of insulin sensitivity based on the correlation derived from glucose clamp. In several previous reports, the HOMA-IR was correlated with the M-value.2 However, the correlation between the HOMA-IR and M-value was weak or absent in East Asians, and the validity of the HOMA-IR was insufficient according to the BMI range.20,21 Because it is also associated with β-cell dysfunction, the HOMA-IR had limited ability to estimate insulin sensitivity for subjects with a lower BMI and a higher fasting glucose level.21 In this study, when the HOMA-IR was calculated in homogenous, non-obese, and BMI-matched subjects with normal glucose tolerance, no significant relationship was observed between the HOMA-IR and the M-values. As a more precise and accepted clinical practice in East Asians, the Matsuda index may be a preferable method to screen asymptomatic insulin-resistant patients. In addition to these markers, we explored the ability of novel candidates to predict insulin sensitivity. However, glucagon- and GLP-1-related parameters, such as the baseline level, maximum or minimum concentration and AUC, did not show any significant correlations with the M-values in healthy subjects (Table S2). And, the insulinogenic index was also evaluated related to 2-hour glucose level in the OGTT considering insulin secretion, but no significant correlation was observed.
Although the findings about the characteristics of insulin sensitivity in Koreans were significant, this study had some limitations. First, only a small number of healthy male subjects were included in our study. These subjects contributed to the homogeneity and consistency of the data for the evaluation of the insulin sensitivity characteristics in subjects with normal physiology. However, females are known to be more insulin sensitive, and a larger scale clinical study including females and patients with various degrees of insulin resistance is required prior to clinical application.13 Second, the effect of BMI on insulin sensitivity might be expected; however, because the BMI range was narrow in this study, the ability to determine the effect of BMI on the GDR was limited.
Conclusion
Age was not an independent determinant for insulin sensitivity in hyperinsulinemic-euglycemic clamp at an insulin dose of 80 mU/m2·min. The baseline insulin, baseline C-peptide and 2-hour glucose level in the OGTT were suggested to be possibly associated markers for insulin sensitivity even under normal glucose tolerant conditions in Koreans.
Data availability
The datasets generated during the current study are available from the corresponding author on reasonable request.
Acknowledgments
The investigation was conducted at the Clinical Trials Center, Gachon University Gil Medical Center. This research was supported by grants from the Korea Health Technology R&D Project through the Korea Health Industry Development Institute (KHIDI) funded by the Ministry of Health and Welfare, Republic of Korea (grant numbers: HI14C2750 and HI14C1135).
Author contributions
D Shin wrote the main manuscript text and prepared the tables and figures. YS Eom, S Chon and BJ Kim conducted these clinical studies and produced results of hyperinsulinemic-euglycemic clamp. DH Lee, KS Yu and D Shin analyzed main parameters and designed the study. All authors contributed to data analysis, drafting and revising the article, gave final approval of the version to be published, and agree to be accountable for all aspects of the work.
Disclosure
The authors report no conflicts of interest in this work.
References
1. Tam CS, Xie W, Johnson WD, Cefalu WT, Redman LM, Ravussin E. Defining insulin resistance from hyperinsulinemic-euglycemic clamps. Diabetes Care. 2012;35(7):1605–1610. doi:10.2337/dc11-2339
2. Trikudanathan S, Raji A, Chamarthi B, Seely EW, Simonson DC. Comparison of insulin sensitivity measures in South Asians. Metabolism. 2013;62(10):1448–1454. doi:10.1016/j.metabol.2013.05.016
3. Yoon KH, Lee JH, Kim JW, et al. Epidemic obesity and type 2 diabetes in Asia. Lancet. 2006;368(9548):1681–1688. doi:10.1016/S0140-6736(06)69703-1
4. Petersen KF, Befroy D, Dufour S, et al. Mitochondrial dysfunction in the elderly: possible role in insulin resistance. Science. 2003;300(5622):1140–1142. doi:10.1126/science.1082889
5. Rowe JW, Minaker KL, Pallotta JA, Flier JS. Characterization of the insulin resistance of aging. J Clin Invest. 1983;71(6):1581–1587.
6. Kahn SE, Hull RL, Utzschneider KM. Mechanisms linking obesity to insulin resistance and type 2 diabetes. Nature. 2006;444(7121):840–846. doi:10.1038/nature05482
7. Basu R, Breda E, Oberg AL, et al. Mechanisms of the age-associated deterioration in glucose tolerance: contribution of alterations in insulin secretion, action, and clearance. Diabetes. 2003;52(7):1738–1748.
8. Kim JK. Hyperinsulinemic-euglycemic clamp to assess insulin sensitivity in vivo. Methods Mol Biol. 2009;560:221–238. doi:10.1007/978-1-59745-448-3_15
9. Kodama K, Tojjar D, Yamada S, Toda K, Patel CJ, Butte AJ. Ethnic differences in the relationship between insulin sensitivity and insulin response: a systematic review and meta-analysis. Diabetes Care. 2013;36(6):1789–1796. doi:10.2337/dc12-1235
10. Fujimoto WY. Overview of non-insulin-dependent diabetes mellitus (NIDDM) in different population groups. Diabet Med. 1996;13(9 Suppl 6):S7–S10.
11. Haffner SM, Karhapaa P, Mykkanen L, Laakso M. Insulin resistance, body fat distribution, and sex hormones in men. Diabetes. 1994;43(2):212–219.
12. Short KR, Vittone JL, Bigelow ML, et al. Impact of aerobic exercise training on age-related changes in insulin sensitivity and muscle oxidative capacity. Diabetes. 2003;52(8):1888–1896.
13. Karakelides H, Irving BA, Short KR, O’Brien P, Nair KS. Age, obesity, and sex effects on insulin sensitivity and skeletal muscle mitochondrial function. Diabetes. 2010;59(1):89–97. doi:10.2337/db09-0591
14. Ferrannini E, Vichi S, Beck-Nielsen H, Laakso M, Paolisso G, Smith U. Insulin action and age: European Group for the Study of Insulin Resistance (EGIR). Diabetes. 1996;45(7):947–953.
15. Brochu M, Mathieu ME, Karelis AD, et al. Contribution of the lean body mass to insulin resistance in postmenopausal women with visceral obesity: a Monet study. Obesity (Silver Spring). 2008;16(5):1085–1093. doi:10.1038/oby.2008.23
16. Katz A, Nambi SS, Mather K, et al. Quantitative insulin sensitivity check index: a simple, accurate method for assessing insulin sensitivity in humans. J Clin Endocrinol Metab. 2000;85(7):2402–2410. doi:10.1210/jcem.85.7.6661
17. McAuley KA, Williams SM, Mann JI, et al. Diagnosing insulin resistance in the general population. Diabetes Care. 2001;24(3):460–464.
18. Lee S, Choi S, Kim HJ, et al. Cutoff values of surrogate measures of insulin resistance for metabolic syndrome in Korean non-diabetic adults. J Korean Med Sci. 2006;21(4):695–700. doi:10.3346/jkms.2006.21.4.695
19.
20. Kanauchi M, Tsujimoto N, Hashimoto T. Validation of simple indices to assess insulin sensitivity based on the oral glucose tolerance test in the Japanese population. Diabetes Res Clin Pract. 2002;55(3):229–235.
21. Kang ES, Yun YS, Park SW, et al. Limitation of the validity of the homeostasis model assessment as an index of insulin resistance in Korea. Metabolism. 2005;54(2):206–211. doi:10.1016/j.metabol.2004.08.014
Supplementary materials
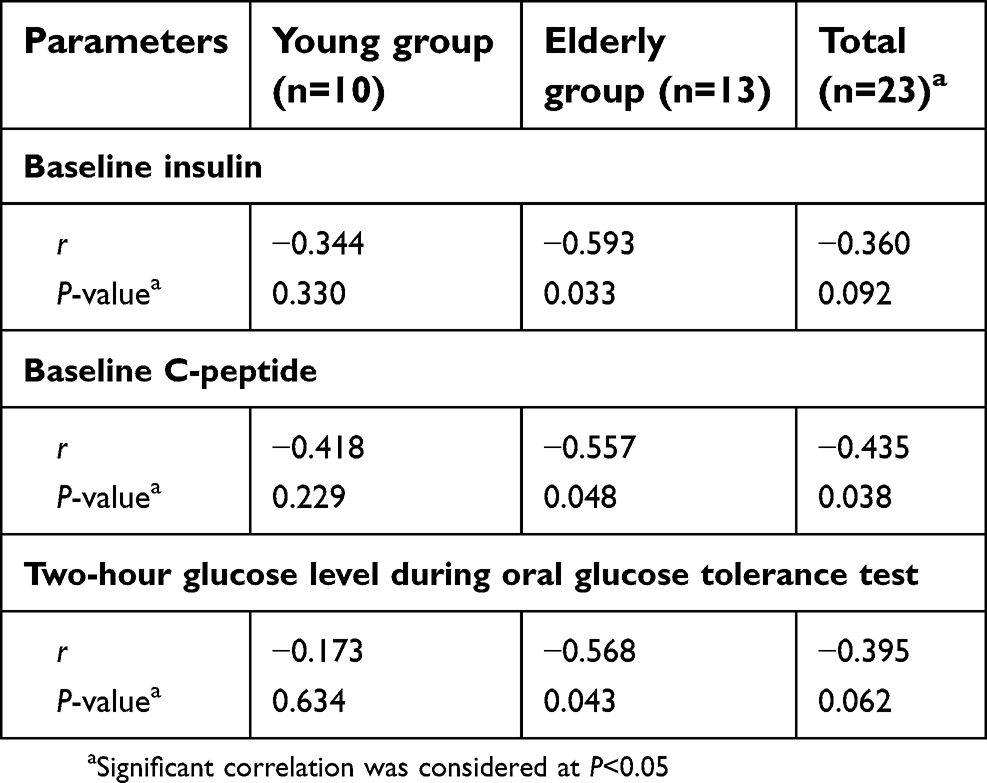 | Table S1 Correlation of M-value normalized by body weight with insulin, C-peptide and 2-hour glucose in OGTT according to age groups |
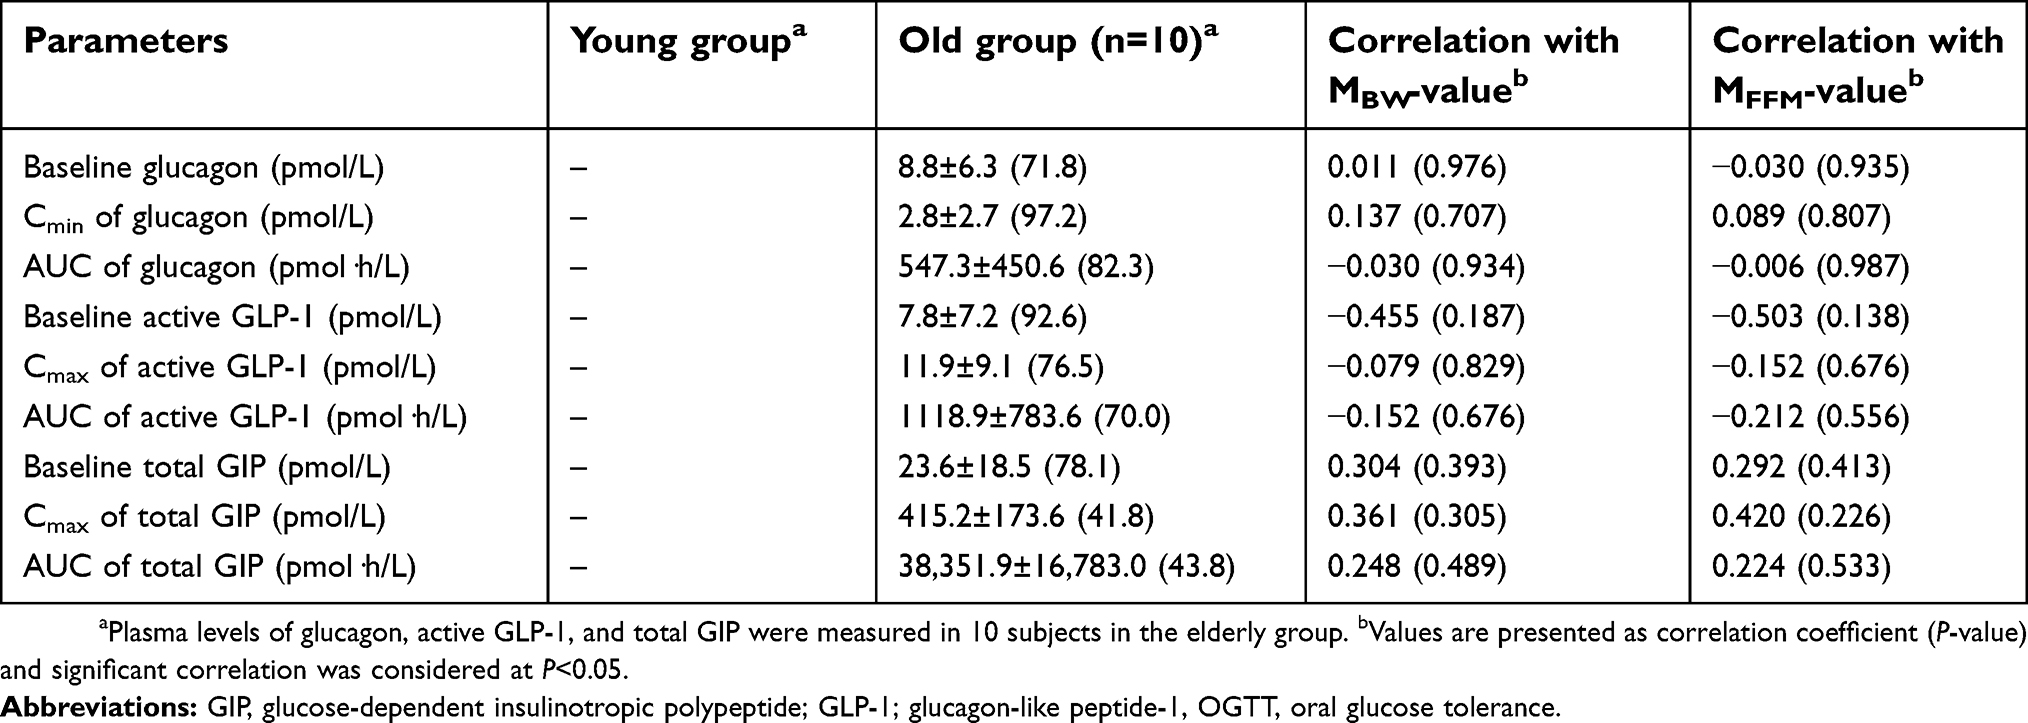 | Table S2 Glucagon and GLP-1 related parameters during OGTT |
 © 2019 The Author(s). This work is published and licensed by Dove Medical Press Limited. The
full terms of this license are available at https://www.dovepress.com/terms
and incorporate the Creative Commons Attribution
- Non Commercial (unported, 3.0) License.
By accessing the work you hereby accept the Terms. Non-commercial uses of the work are permitted
without any further permission from Dove Medical Press Limited, provided the work is properly
attributed. For permission for commercial use of this work, please see paragraphs 4.2 and 5 of our Terms.
© 2019 The Author(s). This work is published and licensed by Dove Medical Press Limited. The
full terms of this license are available at https://www.dovepress.com/terms
and incorporate the Creative Commons Attribution
- Non Commercial (unported, 3.0) License.
By accessing the work you hereby accept the Terms. Non-commercial uses of the work are permitted
without any further permission from Dove Medical Press Limited, provided the work is properly
attributed. For permission for commercial use of this work, please see paragraphs 4.2 and 5 of our Terms.