Back to Journals » International Journal of Nanomedicine » Volume 14
Fabrication and characterization of a titanium dioxide (TiO2) nanoparticles reinforced bio-nanocomposite containing Miswak (Salvadora persica L.) extract – the antimicrobial, thermo-physical and barrier properties
Authors Ahmadi R ![]() , Tanomand A
, Tanomand A ![]() , Kazeminava F, Kamounah FS
, Kazeminava F, Kamounah FS ![]() , Ayaseh A
, Ayaseh A ![]() , Ganbarov K
, Ganbarov K ![]() , Yousefi M
, Yousefi M ![]() , Katourani A, Yousefi B
, Katourani A, Yousefi B ![]() , Samadi Kafil H
, Samadi Kafil H ![]()
Received 15 January 2019
Accepted for publication 27 March 2019
Published 10 May 2019 Volume 2019:14 Pages 3439—3454
DOI https://doi.org/10.2147/IJN.S201626
Checked for plagiarism Yes
Review by Single anonymous peer review
Peer reviewer comments 2
Editor who approved publication: Prof. Dr. Anderson Oliveira Lobo
Raman Ahmadi,1 Asghar Tanomand,2 Fahimeh Kazeminava,1 Fadhil S Kamounah,3 Ali Ayaseh,4 Khudaverdi Ganbarov,5 Mehdi Yousefi,6 Adib Katourani,1 Bahman Yousefi,7 Hossein Samadi Kafil1
1Drug Applied Research Center, Tabriz University of Medical Sciences, Tabriz, Iran; 2Department of Basic Sciences, Maragheh University of Medical Sciences, Maragheh, Iran; 3Department of Chemistry, University of Copenhagen, DK- 2100 Copenhagen. Denmark; 4Department of Food Science and Technology, University of Tabriz, Tabriz, Iran; 5Department of Microbiology, Baku State University, Baku, Azerbaijan; 6Stem Cell Research Center, Tabriz University of Medical Sciences, Tabriz, Iran; 7Immunology Research Center, Tabriz University of Medical Sciences, Tabriz, Iran
Objective: The microbial, physico-chemical and optical corruptions threaten a variety of foods and drugs and consequently the human biological safety and its accessible resources. The humanbeing’s tendency towards bio-based materials and natural plant-extracts led to an increase in the usage of antimicrobial biocomposites based on medicinal herbs. Miswak (Salvadora persica L.) extract (SPE) has been proved effective for its antimicrobial and other biological activities. Therefore, in this study, titanium dioxide (TiO2) nanoparticles (TONP) and SPE were applied to fabricate antimicrobial carboxymethyl cellulose (Na-CMC) based bio-nanocomposites which would simultaneously promote some thermo-physical and barrier properties.
Methods: CMC-neat film (C1), CMC/TONP-2% (C2) and CMC/TONP-2% with 150, 300 and 450 mg/mL SPE (SPE150, SPE30 and SPE450, respectively) were fabricated. The physical and mechanical properties; elemental mapping analysis (MAP), X-ray diffraction (XRD), scanning electron microscopy (SEM), thermal gravimetric analysis (TGA-DTG); fourier transform infrared (FTIR), energy-dispersive X-ray (EDX) and UV-vis spectroscopies were done to further validate the results.
Results: Addition of TONP (2%) improved the blocking of UV light at 280 nm while SPE-containing nanocomposites completely blocked it. FTIR, XRD and SEM confirmed the formation of homogeneous films and high miscibility of applied materials. TONP led to an increase in Young’s modulus (YM) and stress at break (SB) while SPE decreased them and enhanced the elongation to break (EB) (flexibility) of the active nanocomposites. Compared to CMC-film, the thermo-gravimetric analysis (TGA-DTG) showed a higher thermal stability for CMC/TONP and CMC/TONP/SPE nanocomposites. The EDX spectroscopy and elemental mapping analysis (MAP) proved the existence and well-distributedness of Na, K, Cl, S, Ti, F and N elements in SPE-activated nanocomposites. The pure SPE and SPE-activated nanocomposites showed a favorable antimicrobial activity against both gram-positive (Staphylococcus aureus) and negative (Escherichia coli) bacteria.
Conclusion: The CMC-TiO2-SPE nanocomposites were homogeneously produced. Combination of TiO2 nanoparticles and dose-dependent SPE led to an improvement of thermal stability, and high potential in antimicrobial and UV-barrier properties. These results can generally highlight the role of the fabricated antimicrobial bio-nanocomposites as a based for different applications especially in food/drug packaging or coating.
Keywords: antimicrobial biomaterials, biopolymeric nanocomposite, carboxymethyl cellulose, Miswak (Salvadora persica L.), titanium dioxide, food packaging
Introduction
The quality of perishable stuffs like foods and drugs is always affected by ambient parameters such as light, oxygen, water vapor, temperature and micro-organisms. Packaging as a protective barrier can overcome their probable degenerative issues. The hazards of traditional petroleum-based materials for human and bio-eco-systems led to increasing focus on biodegradable materials.1 Some of the natural and edible hydrocolloid biopolymers are recently used for film production including polysaccharides (such as cellulose and its derivatives, chitosan, alginate, guar gum, starch and alginate) and proteins (such as gelatin and collagen).2 Among them, carbohydrates are better candidates because of their better film-forming, barrier and physical properties.3–5
As cellulose is the most accessible, biodegradable and nonhazardous natural polymer, its derivatives are considered good cases for application in the area of materials and packaging. Carboxymethyl cellulose (CMC), an ether-cellulose derivative,6 is well-studied as an accessible carbohydrate with good film-forming, mechanical and transparency properties.5,7,8 The nano-structured cellulose (CNF),3,9 chitin,10 copper oxide (CuO),11 titanium dioxide (TiO2),12 silicon dioxide (SiO2),13 silver (Ag)14 and some other nano-particles15 are used for improving antimicrobial or thermo-physical properties of polymers.
The nontoxicity of TiO2 nanoparticles (TONP) for human is presented by Food and Drug Organization (FDA). Furthermore, photo-catalysis and antimicrobial as well as UV-barrier properties of TONP made it the center of attention in different studies.16 As several recent studies showed, TONP in low content (1–5%) could improve the thermo-physical properties of biopolymeric films.17,18 The TONP together with montmorillonite (MMT) has enhanced the thermal, mechanical and UV-barrier properties of the starch nanocomposites in which the best content of TONP is obtained at 2% wt of polymer which also decreased the water vapor permeability (WVP) of the composites.18 Recently, different content of TONP (5, 10 and 15 wt%) has been applied into soluble soybean polysaccharide in which lower content of TONP (5%) led to improving the melting point, glass transition, tensile strength and WVP of the film.17
The human request is packaging systems which not only physically protect the food and drug stuffs but also enhance their shelf-life. These issues have led to creation of new packaging systems called active packaging. Since the micro-organisms are one of the main hazards for human health and food/drug safety, the antimicrobial packaging has been considered as one of the most common types of active systems. These can deliver antimicrobial agents into the package content. On the other hand, medicinal herbs extracts and essential oils contain a wide range of bioactive compounds. They have become desirable cases for antimicrobial packaging and composites researches. Blending of the plant-based extracts or essential oils into the polymers in order to produce antimicrobial films is well studied with satisfactory results.
Miswak (Salvadora persica L.) (S. persica) with other common names known as“Arak”, “Siwak”, “Siwaki”, “Sewak”, “Meswak”, “Miswaak”, “Misswak”, “Mswaki”, “Miswaki”, a small shrub tree from the family of Salvadoraceae, is native to the Middle East and can be found in Africa, Saudi Arabia, India and south of Iran.19
Miswak root has been in use as a toothbrush (or chewing stick) for many years. World Health Organization (WHO) has also validated the chewing sticks as safe tools for oral hygiene.20,21
Non-toxicity of S. persica extracts (SPEs) and their anti-inflammatory, antimicrobial and antioxidant activities have been previously reported.21–25 It has several bioactive organic chemicals such as salvadorine, salvadourea, cyanates, saponins, alkaloids, amides, tannins, glycosides (eg, salvadoraside and salvadoside), terpenes, flavonoids and fatty acids (eg, oleic, linoleic and stearic acids) and a broad range of non-organic chemicals including potassium chloride (KCl), sodium chloride (NaCl), calcium (Ca), potassium (K), sodium (Na), phosphorus (P), fluoride (F), silica (Si), sulfur (S), magnesium (Mg), manganese (Mn) are reported from SPEs.19,26–30
Benzyl isothiocyanate (BITC) is considered as the main antimicrobial agent in SPEs.31 SPEs with different solvents are well investigated against numerous micro-organisms. This confirms their potent antimicrobial activity against the yeasts (such as Candida ssp. as one of the prevalent oral pathogen) and both gram negative and positive bacteria (such as Staphylococcus ssp., Streptococcus ssp., Mycobacteria ssp., Escherichia ssp.).32–34
Based on what was mentioned above, the production of the natural and bio-based antimicrobial composite materials especially for what humanbeings deal with on a regular basis (eg, food and drug stuffs) can be a promising way toward promoting human safety both environmentally and biologically. On the other hand, to the best of our knowledge, there has not been a report for synchronous application of TONP and SPE into the CMC matrix. Therefore, 2% of TONP (as the nanofiller for mechanical and structural reinforcement) and different contents of SPE (as the antimicrobial agent) were blended into the CMC matrix in which the films were produced through casting method. Microstructure, elemental analysis, thermo-physical characterizations were studied along with the barrier and antimicrobial properties of the films.
Materials and methods
Materials
S. persica roots were collected from the Sistan and Baluchestan in the South-east of Iran. Sodium carboxymethyl cellulose (Na-CMC) (substituent degree of 0.7 and the molecular weight of 40,000 kDa) was purchased from Caragum Parsian Co (Tehran, Iran). Calcium sulfate (CaSO4), magnesium nitrate hexahydrate [Mg(NO3)2-6H2O], potassium chloride (KCl), sodium chloride (NaCl), glycerol, ethanol and microbial culture media of Muller Hinton Agar (MHA) and Tryptic Soy Broth (TSB) were purchased from Merck (Darmstadt, Germany). TiO2 nanoparticles (TONP) in Rutile phase was provided from US Research Nanomaterials Inc. (Hauston, USA) with the average diameter of ~30 nm and the purity of 99.9% as mentioned in the producer data sheet.
Salvadora persica L. extract (SPE) preparation
S. persica roots were washed and dried and after removing the bark it was suitably grinded into small particles. According to the method of Mohamed and Khan21 with some modifications, grinded root was blended into the ethanol–water solvent (50–50% v/v) where the ratio of root to solvent was 1:10. The suspension was stirred for 24 hrs at 25°C in a dark condition. The suspension was filtered through Whatman filter paper No. 1442, two times and the clarified liquid was then concentrated in a vacuum rotary evaporator (Heidolph, Germany) at ambient temperature. Finally, dark-brownish extract was gained from freeze-drying and stored at −70°C until application.
Film preparation
CMC film (control 1) preparation
2 g of CMC was added to 100 ml of water and was first stirred at 90°C and 900 rpm for 30 mins and then stirring was continued for 12 hrs at room temperature. Then, glycerol (1 ml or 50 wt% of CMC) was slowly added to the solution (at 40°C and 700 rpm) and mixed for 10 mins. Just after that, the solution was cooled to ambient temperature and air bubbles were removed, the film solution was casted into 20×14 mm2 polyethylene plastic plate. The solution was dried at 40°C for 20 hrs in an air-circulating condition. The dried films were taken from the container and put in the closed bag until the test time. This control film was coded to C1.
CMC/TiO-2% film (control 2) preparation
Same as C1, TiO2-2% suspension was added to the solution prior to addition of glycerol. TiO2-suspension was treated by sonication at ~40°C, 40 kHz and 100 w for 10 mins in water-bath ultrasound chamber (AS ONE, Japan) and 10 mins by probe ultrasound (Hielscher UP 200H, Germany) at ~40°C, 70% efficiency, 200 w and 24 kHz for 10 mins. Then, it was stirred at 1,000 rpm, 40°C for 10 mins before adding to C1 solution. This second control film was coded to C2 and considered as a base for SPE.
Active nanocomposite film (CMC/TiO2-2%/SPE) preparation
The same method for C2 was applied in which 3 ml of 150, 300 and 450 mg/mL SPE [higher than minimal bactericidal concentration (MBC)] was blended into C2 solution (at 40°C) and stirred (10 mins at 700 rpm) before the addition of glycerol. These active films were coded to SPE150, SPE300 and SPE450, respectively.
All produced films with their codes and formulations are presented in Table 1.
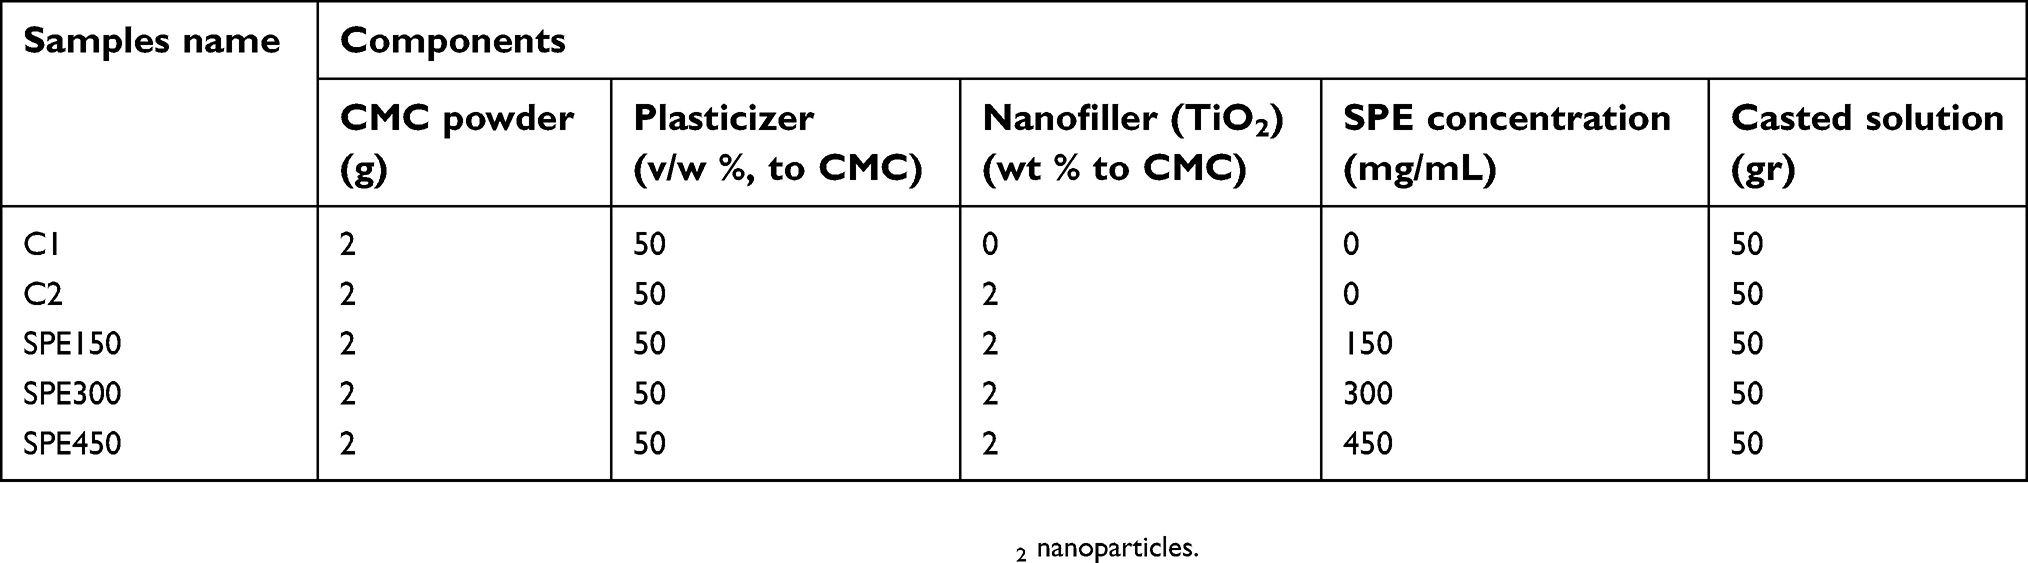 | Table 1 The formulation and the codes of all samples in 100 mL deionized water |
Characterization
X-ray diffraction (XRD) analysis
XRD analysis in the angular region (2θ) of 15–80° was recorded by X’pert Pro diffractometer (Panalytical, Netherland) with Cu anode, at room temperature, step size of 0.026°, the rate of 1°/min, the wavelength of 0.154056 nm, 40 kV and 40 mA.
TONP crystallite size (D) was obtained through Debye-Scherer equation (Eq. (1)).
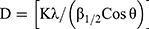
where K, λ, β1/2 and θ are the Scherrer constant (0.94), X-ray wavelength (λ=0.154056 nm), full width at half maximum (FWHM) of TONP peak (by radian) and Bragg’s angle, respectively. The 2θ=27.48° was the reference for calculation of FWHM of TiO2 nanoparticles.
The crystallinity index (CI) of TONP and all samples were calculated by following Segal equation (Eq. (2)):

where Imax and Imin (or Iam) are the maximum and minimum intensity of the specific peak (for TONP: 2θ=27.48°).
Fourier transform infrared (FTIR) spectroscopy
The KBr-pellet method and FTIR spectrophotometer (Bruker Tensor 27, Germany) were utilized to evaluate freeze-dried SPE and film samples from 4000 to 400 cm–1.
Scanning electron microscopy (SEM), energy-dispersive X-ray (EDX) spectroscopy and elemental mapping analysis (MAP)
MIRA3 FESEM microscope (Tescan, Czech) was employed for SEM analysis. Surface and cross-section (cryo-fractured in liquid nitrogen) morphology of the films was scanned at room temperature, 5 kV and the scale of 50 µm.
The EDXs and MAPs were recorded for all samples to investigate the distribution quality of nanofiller (TiO2 nanoparticles) and also dominate and specific elements of SPE based on SPE studies literature (Na, K, Cl, N, S, N and F).
Thickness
The digital micrometer with the accuracy of 0.001 mm (Insize 3109–25, China) was employed for evaluation of thickness in 6 random points for each film.
Moisture content (MC)
About 1 g of conditioned film was placed in 105°C up to reaching a constant weight. MC values were calculated by the following equation:

As the Wi and Wu are the initial and ultimate weight of the films, respectively.
Water vapor permeability (WVP)
ASTM E96-0535 with some modifications was used to evaluate WVP. Round head vials (cylindrical) with 4.5×2.5 (cm)2 (height×diameter) dimensions were considered as the permeation cells. 4 g of dry CaSO4 (RH=0%) was poured into the cells and the conditioned round-shaped films specimens were placed under their head, respectively. Then, after recording the weight of the permeation cell (including both CaSO4 and film specimen), they were inserted in a chamber with RH of 86% (containing KCl saturated solution) at 25±0.1°C which causes driving force (∆P) of 2725.34 Pa. Every 2 hrs, the weight-gain of the vials were recorded for 24 hrs and plotted as a function of time (weight vs time). Then, the slope of weight-time curves was calculated by linear regression. The water vapor transmission rate (WVTR) and WVP were, respectively, computed by


where ∆P and x are driving force (2725.34 Pa) and film thickness (m), respectively.
∆P is driving force which was gained from:
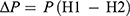
where P, H1 and H2 are saturated vapor pressure of water (3169 Pa) at test temperature (25°C), RH in desiccator (86% or 0.86), RH within the vial (0%).
Mechanical properties
Mechanical properties including Young’s modulus (or elasticity modulus: E), stress at break (or ultimate tensile stress: UTS) and elongation (or strain) at breakpoint (EB) were obtained from ASTM D882-10.36 Three dumbbell-shaped of each film (8×0.5 cm) were prepared and conditioned. Then, the samples were tested in a tensile tester (Sanaf Co., Iran) with initial grip distance of 50 mm and the speed of 10 mm/min at ambient temperature.
Thermal gravimetric analysis (TGA)
The thermal analyzer model Linseis STA PT-1000 (Germany) was employed for TGA evaluation. The test was carried out from room temperature to 500°C, at the steady rate of 10°C/min under 50 cm3/min nitrogen flows. 15 mg of any sample was put into an aluminum pan in which empty aluminum pan was the reference. TGA and TGA-derivative (TGA and DTG) are both reported.
UV-vis barrier properties (opacity and light transmittance)
A UV-vis spectrophotometer model Shimadzu UV 2450 (Tokyo, Japan) was applied to read UV-vis transmission (200–900 nm) through the samples. The composites were inserted in the chamber and the air was selected as the reference. The opacity of the samples was obtained by
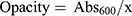
where Abs600 and x are an absorbance at 600 nm and film thickness (mm), respectively. The Lambert-Beer equation was used for conversion the transmittance (Tr) value to absorbance (Abs).
Antibacterial assay
Antibacterial activity of pure SPE
Escherichia coli (E. coli) ATCC® 25922™ and Staphylococcus aureus (S. aureus) ATCC® 29213™ were selected as the typical species of gram negative and positive bacteria, respectively. The minimal inhibition concentration (MIC) and minimal bactericidal concentration (MBC) of SPE were evaluated against both S. aureus and E. coli according to CLSI protocol by microdilution method in a 96-well micro-plate and using culture media of TSB.37
Antibacterial assay of control and SPE-activated films
The disk shape of each sample with the diameter of 1 cm was placed on a MHA media which was previously whole-inoculated with targeted bacteria. Inhibition zone was considered where the bacteria had no growth around the film.
Statistical analysis and samples conditioning
The samples were conditioned before the physical tests at RH~52% and 25±0.2°C for 24 hrs. Completely randomized design with one-way analysis of variance (ANOVA) was applied by SPSS (version 16). Duncan’s multiple range test at the 5% of probability (p≤0.05) was employed for mean comparisons and significant difference among samples. The physical evaluations were repeated three times.
Results and discussion
X-ray diffraction (XRD) analysis
The XRD analysis is plotted at Figure 1A. TiO2 nanoparticles in Rutile phase showed some peaks at 2θ of 27.48, 36.1, 39.21, 41.22, 44.07, 54.22, 56.48, 62.35, 63.82, 68.75, 69.74° which is consistent with other studies.38–41 The crystallite size (D) and crystallinity index (CI) of TONP were estimated around 19.77 nm and ~85% by Debay-Scherrer and Segal equations.
 | Figure 1 XRD patterns (A) of TiO2 nanoparticles in Rutile phase, CMC film (C1), CMC/TiO2-2% (C2) nanocomposite and activated nanocomposites with 150 (SPE150), 300 (SPE300) and 450 mg/mL (SPE450) Miswak extract and FTIR analysis (B) of pure SPE-powder and all mentioned samples.Abbreviations: C1, CMC film; C2, CMC/TONP-2% nanocomposite; CMC, carboxymethyl cellulose; FTIR, Fourier transform infrared spectroscopy; SPE, Salvadora persica L. root extract; SPE150, SPE300, and SPE450: CMC/TONP-2% containing 150, 300, and 450 mg/ml of SPE, respectively; TONP, TiO2 nanoparticles; XRD, X-ray diffraction analysis. |
In CMC-film pattern, no sharp peak was observed that indicated its complete amorphous structure. The amorphous nature of CMC films is previously reported by other studies.42,43 The blending of TONP into CMC and SPE (150, 300 and 450 mg/mL) into CMC-TiO2 matrix caused no shift or appearance of a new peak. The CI of C1, C2, SPE150, SPE300 and SPE450 was 90.57%, 46.19%, 41.73%, 40.27% and 35.12%, respectively. Disappearance of all specific peaks of TONP and simultaneously the reduction of the CI in C2 clearly confirmed the well-distributedness of TiO2 nanoparticles in CMC matrix. Moreover, the addition of SPE into the CMC-TONP matrix resulted in more decrease in CI of SPE-functionalized nanocomposites dose-dependently. The reduction in the CI of SPE-containing samples, especially in higher contents, is related to insertion of the extract between polymeric chains. This led to higher CMC inter-chains distance and chains sliding (plasticizing effect of SPE). Therefore, the lower tensile strength of active nanocomposites particularly in higher contents of SPE is probable. This plasticizing effect of SPE was in line with our recent research.3
XRD results indicated the well-miscibility of all applied materials, no agglomeration of TNOP and SPE, homogenous structure of all nanocomposites and favorable efficiency of film preparation method.
Fourier transform infrared (FTIR) spectroscopy
FTIR patterns are presented in Figure 1B. For pure SPE-powder, isothiocyanate (R‒N=C=S) and isocyanate (R‒N=C=O) showed a weak peak at 2076 cm–1 due to stretching N=C.44
The peaks at 1415, 1460 and 1513 cm–1 are related to C‒H vibration in benzene ring skeleton45 of various compounds in SPE such as lignans, salvadorine, benzyl amides, benzyl cyanates and other phenol-ring-containing bioactive compounds. The peak at 1415 cm–1 can be also due to S=O stretching.29,30
The wide peak around 3425 cm–1 is due to hydrogen bonds, stretch vibration of N‒H (in amide and amine compounds such as benzyl amides and three methylamine) and O‒H stretch of phenols.
For CMC film (C1), some peaks at 3422, 2920, 1618, 1421, 1323 and 1048 cm–1 were recorded that are attributed to O−H stretch and also inter/intra-molecular hydrogen bond, stretching C‒H, stretching COO‒ (−C=O in asymmetrical carboxyl), scissor-like –CH2, OH bending and asymmetric stretching –C‒O‒ in ether group (‒CH‒O‒CH2).
No shift was observed for CMC-TONP (C2) nanocomposite compared to CMC film (C1) which is due to low content of TONP and implied its well physical-insertion within the CMC chains.
In SEP-activated nanocomposites, the pure-SPE specific peaks were not observed and no change happened compared to CMC-TONP peaks. Therefore, no new chemical bond was formed by the addition of SPE but indirectly confirmed its well physical insertion within CMC-TONP structure.
Scanning electron microscopy (SEM) and energy-dispersive X-ray (EDX) spectroscopy
The surface and cross-section micrograph of CMC film (Figure 2A-1 and A-2) was completely smooth and flat with no crack or pore. Adding the TONP to CMC matrix led to no significant change in both surface and cross-section that may be due to the TONP low content (2%) (Figure 2B-1 and B-2). The active nanocomposite with lowest (SPE150) and highest content of SPE (SPE450) showed a bit roughness at the surface while no considerable change or any crack or pore was observed in cross-sections in surfaces of both SPE150 and 450 (Figure 2C-1 and C-2; D-1 and D-2). According to SEM results, homogenous structure implied good miscibility of CMC, TONP and SPE.The EDX results showed Na, C and O elements for Na-CMC film (Figure 2A-3). As expected, Ti appeared in low amount for CMC-TONP nanocomposite (Figure 2B-3). For SPE150 (with lowest SPE content), elements of S, Cl and K appeared and also the amount of Na was increased (Figure 2C-3). This confirmed the existence of salts like NaCl and KCl and also sulfur-containing materials in SPE (like BITC). The EDX of SPE450 (Figure 2D-3) not only showed mentioned elements in SPE150 but also showed F in a low content (0.2%). The appearance of F element in SPE450 compared to SPE150 is probably because of its low content in SPE150 that EDX spectroscopy can detect in a higher content than 150 mg/mL, where F atoms are more exposed to X-ray at the surface of the active nanocomposite. The weight percentage of Na, S, Cl and K in SPE450 was higher than SPE150 which is due to higher amount NaCl, KCl and Sulfur-containing compounds in a higher content of SPE. Dose-dependently, SPE caused to decrease in Ti percentage which probably is due to covering the TONP by SPE which decreased its exposure to X-ray bombardment. This interpretation is approved by a dose-dependent increase in amounts of specific elements in SPE (Na, S, Cl and K) for both SPE150 and SPE450.
 | Figure 2 The SEM micrographs of surface (column 1) and cross-section (column 2); and EDX (column 3) for CMC film (A), CMC/TiO2-2% nanocomposite (B) and active nanocomposites with lower (C) and highest (D) amounts of Miswak extract, ie 150 (SPE150) and 450 mg/mL (SPE450), respectively.Abbreviations: C1, CMC film; C2, CMC/TONP-2% nanocomposite; CMC, carboxymethyl cellulose; EDX, energy-dispersive X-ray spectroscopy; SEM, scanning electron microscopy; SPE, Salvadora persica L. root extract; SPE150, SPE300, and SPE450, CMC/TONP-2% containing 150, 300, and 450 mg/ml of SPE, respectively; TONP, TiO2 nanoparticles. |
Elemental mapping analysis (MAP)
The MAP analysis (Figure 3) of C, O and Na elements for C1; C, O, Na and Ti for C2; and C, O, Na, Ti, S, Cl, K, F and N for both SPE150 and SPE450 showed perfect homogenous distribution of applied material in all control and active films. It is clearly shown in Ti element MAP of all samples that TiO2 nanoparticles have no agglomeration neither before addition (in C2) of SPE nor after it up to 450 mg/mL (in SPE150, SPE300 and SPE450).
 | Figure 3 The elemental mapping analysis (MAP) for CMC film (A), CMC/TiO2-2% (B) nanocomposite and active nanocomposites with 150 (SPE150) (C) and 450 mg/mL (SPE450) (D) Miswak extract. The distribution of any element is separately presented by a single photo.Abbreviations: C1, CMC film; C2, CMC/TONP-2% nanocomposite; CMC, carboxymethyl cellulose; MAP, elemental mapping analysis; SPE, Salvadora persica L. root extract; SPE150, SPE300, and SPE450, CMC/TONP-2% containing 150, 300, and 450 mg/ml of SPE, respectively; TONP, TiO2 nanoparticles. |
MAP also confirmed the EDX results for dose-dependent increase in Na, F, S, Cl and K by increase in SPE amounts. In addition to detected elements in EDX of SPE-activated nanocomposites, the existence of nitrogen-containing compounds and their dose-dependent increase in SPE was shown in MAP distribution.
Totally, all SEM, EDX and MAP results implied that both TiO2 nanoparticles at 2% and SPE up to 450 mg/mL could make a uniform and homogeneous structure. It implied that the employed method for film preparation in this study, ie the steps of addition of materials (TONP, SPE and glycerol, respectively); and the time and temperature of sonication, stirring and cast-drying were completely suitable for fabrication of produced films.
The most outstanding reason for the formation of homogeneous structure and well-miscibility of the applied materials is probably their hydrophilic nature which can prevent phase separation during preparation and drying.
Moisture content (MC)
Figure 4A shows MC content. The addition of TONP led to a slight decrease in MC from 31.37% for C1 film to 30.25% for C2 nanocomposite. A similar report is previously reported for the starch-kefiran matrix.46 Addition of SPE in all content showed lower MC compared to C2 which is due to the higher total solid mass of SEP-activated nanocomposites. It is mainly related to some organic, minerals and metals that EDX and MAP analysis confirmed their existence within the structure of SPE-containing nanocomposites. Therefore, good entrapment of these components within the structure led to the higher ejection of water molecules from the polymeric matrix during the drying time of the casted solutions. Other studies reported similar results for tea extract,47 and mineral and vitamin48 on chitosan-based film. Our previous study has also showed such behavior in MC test after addition of SPE.3
 | Figure 4 The moisture content (MC) (A) and water vapor permeability (WVP) (B) for CMC (C1) and CMC-TiO2 −2% (C2) control groups and all activated nanocomposites by 150 (SPE150), 300 (SPE300) and 450 mg/mL (SPE450) of Miswak extract. Various small letters present significant difference between mean values (P<0.05).Abbreviations: C1, CMC film; C2, CMC/TONP-2% nanocomposite; CMC, carboxymethyl cellulose; MC, moisture content;SPE, Salvadora persica L. root extract; SPE150, SPE300, and SPE450, CMC/TONP-2% containing 150, 300, and 450 mg/ml of SPE, respectively; TONP, TiO2 nanoparticles; WVP, water vapor permeability. |
Water vapor permeability (WVP)
The WVP is one of the important parameters for moisture-stability and shelf life of the stuff within the nanocomposites or films. The WVP is dependent on different parameters such as the nature of the polymeric matrix, additives, activation agent, water content and the structure and morphology of the films and nanocomposites.49 Figure 4B presents the WVP results. Adding TONP to CMC led to the non-significant decrease in WVP. The existence of water-insoluble TONP within the nanocomposite structure as a nanofiller and blocking the paths may form longer routs for transferring of moisture molecules and lower WVP consequently. Deka and Maji50 obtained similar results for blending TONP in wood-based composites. They claimed that the early hydrophilic interactions between TONP and matrix would diminish water permeation from the cross-paths of the matrix. Similar to our research, Oleyaei et al.51 also reported the decrease in WVP by adding TONP (up to 2%) into the potato starch nanocomposites.
The permeability of biopolymeric films will be changed by the addition of plant extracts. Depending on the hydrophilic/hydrophobic nature of the applied biopolymer and extract components, the WVP will differ.49 In this study, the addition of the lowest concentration of SPE (150 mg/mL) diminished the WVP while higher concentrations (300 and 450 mg/mL) increased it. Some previous studies reported the WVP decrease by blending mango kernel extract into soy protein isolate,52 green tea extract into chitosan53 and rosemary extract into κ-carrageenan54 nanocomposites. The main reason for improved moisture barrier properties of extract-containing films is the formation of hydrogen bonds and hydrophobic interactions between biopolymeric matrix and extract or essential oil components. In contrast, it is reported that the WVP is increased after adding grape fruit seed extract into carrageenan-based films.55 Nouri and Nafchi56 also reported the WVP enhancement by addition of betel leaf extract. The WVP decrease in SPE150 can be attributed to insertion of SPE components in free volume between CMC polymeric chains which act as a filler. For SPE300 and SPE450, as it is in accordance with MC results, dominating the hydrophilic and hygroscopic nature of SPE could increase water vapor molecules adsorption and absorption. On the other hand, the higher gap between CMC polymeric chains (higher space for passing small molecules) and therefore lower polymeric chains integrity could facilitate the penetration of water vapor molecules across the SPE-nanocomposites structure.
Mechanical behaviors and properties
Being one of the important parameters for packaging materials, mechanical properties are always center of attention in marketing and processing aspects of products. Figure 5A–D indicates mechanical behaviors and parameters. In C2 nanocomposite, mechanical behavior was the same as C1. However, significant increase in STB (17.46%, from 47.38 to 55.65 M.Pa) and YM (7.04%, from 47.38 to 55.65 M.Pa) and a non-significant decrease in EB (8.76%) was observed. This can be related to the interaction between TiO2 positive charges and the negative charge of carboxylic groups of CMC matrix. Similarly, previous studies reported the increase in TSB and decrease in EB by adding TONP into chitosan,57 potato starch18 and soluble soybean polysaccharide matrix.58 Dependent on the plant extract components, the effects of plant extracts are variable. Generally, the polyphenol-rich extract decreases the mechanical properties of the films and nanocomposites.49 The blending of SPE led to significant reduction in UTS and YM and enhancement of EB, dose-dependently. These results could be related to insertion of SPE components among CMC chains and broadening the distance between adjoining polymeric chains (and decrease in total polymeric chains entanglements) which finally led to lower UTS and YM and higher EB due to higher chains sliding and mobility. These interpretations are in accordance with XRD results in part 3. 1, Figure 1A, where the intensity of the broad peak around 2θ~20° was diminished (ie the reduction in crystallinity index of SPE-activated nanocomposites). In some other studies, similar results were observed for belending mutra extract into methyl cellulose59 and grape fruit seed extract into carrageenan films.55
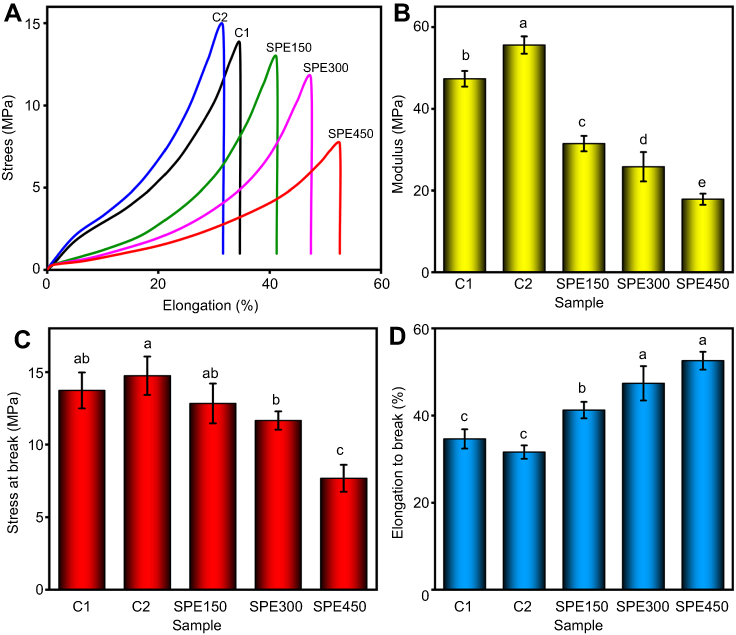 | Figure 5 The mechanical behavior patterns (A), modulus (B), stress at break (C) and elongation to break (D) of CMC film (C1), CMC/TiO2-2% (C2) nanocomposite and all active nanocomposites with 150 (SPE150), 300 (SPE300) and 450 mg/mL (SPE450) Miswak extract. Various small letters present significant difference between mean values (P<0.05).Abbreviations: C1, CMC film; C2, CMC/TONP-2% nanocomposite; CMC, carboxymethyl cellulose; SPE, Salvadora persica L. root extract; SPE150, SPE300, and SPE450, CMC/TONP-2% containing 150, 300, and 450 mg/ml of SPE, respectively; TONP, TiO2 nanoparticles. |
Thermal gravimetric analysis (TGA-DTG)
TGA (Figure 6A) DTG (Figure 6B) curves show the thermal stability behaviors of control and active films. The proximate weight loss (Δw) and maximum temperature of degradation (Tmax) were obtained from TGA and DTG curves, respectively. Three steps of weight loss (Δw1, Δw2 and Δw3, respectively) were observed for C1 and C2 while the second step was overlapped with third and just two steps were recorded for SPE150, SPE300 and SPE450.
 | Figure 6 The TGA (A) DTG (B) curves of CMC film (C1), CMC/TiO2-2% (C2) nanocomposite and active nanocomposites with 150 (SPE150), 300 (SPE300) and 450 mg/mL (SPE450) of Miswak extract.Abbreviations: C1, CMC film; C2, CMC/TONP-2% nanocomposite; CMC, carboxymethyl cellulose; DTG, TGA-derivative or the derivative of TGA; SPE, Salvadora persica L. root extract; SPE150, SPE300, and SPE450, CMC/TONP-2% containing 150, 300, and 450 mg/ml of SPE, respectively; TGA, thermal gravimetric analysis; TONP, TiO2 nanoparticles. |
The Δw1 happened at 45–110°C, the Δw2 at 110–230°C and Δw3 at 230–320°C. The Δw1 is attributed to free water evaporation,60 Δw2 to organic ingredients of SPE59,61 and free glycerol62 evaporation and the Δw3 to polymer branches degradation5 and the rest of glycerol and SPE volatile components.
The Δw1 of 5.2%, 5%, 4.8%, 4.6% and 4.2% was estimated for C1, C2, SPE150, SPE300 and SPE450, respectively. The Tmax1 for C1 was 71.4°C which was changed to 72.6°C by blending TONP (for C2). The blending of SPE also increased the Tmax1 to 78.3°C, 82.8°C and 87.3°C for SPE150, SPE300 and SPE450, respectively.
The Δw2 and Δw3 of 21.1% and 43.8% for C1 were decreased to 20.4% and 42.7% for C2, respectively. The Tmax2 and Tmax3 were enhanced from 206.5°C and 260.4°C for C1 to 211.4°C and 262°C for C2, respectively.
The Δw2 of 61.4%, 61.1% and 61.4% and Tmax2 of 246.2°C, 266.6°C and 271.2°C was recorded for SPE150, SPE300 and SPE450, respectively.
Compared to C1, the O‒H interaction between polymer and TONP18 and the impurity of water and glycerol by adding TONP and SPE is the most probable reason for higher Tmax1 & 2 in C2 and SPE-activated samples. It means that the TONP and SPE enhanced the evaporation temperatures of entrapped water and glycerol.
Similar to the previous study by Ahmadi et al.3 The lower Δw2 and Δw3 For C2 and lower Δw2 for SPE-containing samples were likely due to the increase in total solid mass of nanocomposites by adding 2% TONP and different SPE content in comparison to C1, respectively.
The weight loss at higher temperatures (up to 500°C) gave no certain peak which means that there is no separate or major phase in composite ingredients with a specific TGA behavior. In the other words, slight weight loss from 320°C to 500°C belongs to the remaining fraction of volatile compounds of SPE and not-degraded CMC side-branches.
The total remaining weight percentage at 500°C (R500) was enhanced by addition of TONP and dose-dependently by blending the SPE. R500 was 21.8%, 26.1%, 27.4%, 28.1% and 28.9% for C1, C2, SPE150, SPE300 and SPE450, respectively. The increase in total solid mass and the higher degradation temperature of TiO2 led to higher heat stability of C2 and SPE-activated nanocomposite. Higher heat stability of SPE-activated nanocomposites compared to C1 and C2 is most probably due to the existence of minerals which was approved by EDX and MAP analysis as well as the hinted inorganic compounds in the literature of Miswak. These elements may create an ionic network around CMC polymeric chains in earlier viscose SPE nanocomposite solution and acted as a heat-insulation layer for inner fractions.
Uv-vis barrier properties (opacity and light transmittance)
The UV-vis transmittance patterns of all samples are presented in Figure 7. Opacity and transmittance at the wavelength of 280 nm (Tr280) and 600 nm (Tr600) are also mentioned in Table 2. Adding 2% of TONP led to a significant decrease in transmittance of UV (Tr280) and visible light (Tr600) while the opacity was increased. Decreasing the UV/visible light transmittance by TONP is reported for whey protein isolate,63 starch,18 starch/CMC51 and kefiran-whey protein64 bio-nanocomposites. The dramatic decrease can happen by higher amounts of TONP63 but the intrinsic nature of the polymer, the crystallinity of the final film and co-inside existence of other nanoparticles can lead to different results.
 | Table 2 The UV-vis transmittance and opacity of CMC (C1), CMC/TiO2-2% (C2) and activated nanocomposites by 150, 300 and 450 mg/mL S. persica extract |
 | Figure 7 The UV-vis wavelengths transmission curves through the CMC film (C1), CMC/TiO2-2% (C2) nanocomposite and all active nanocomposites with 150 (SPE150), 300 (SPE300) and 450 mg/mL (SPE450) of Miswak extract.Abbreviations: C1, CMC film; C2, CMC/TONP-2% nanocomposite; CMC, carboxymethyl cellulose; SPE, Salvadora persica L. root extract; SPE150, SPE300, and SPE450, CMC/TONP-2% containing 150, 300, and 450 mg/ml of SPE, respectively; TONP, TiO2 nanoparticles;UV-vis: ultraviolet-visible light. |
Various small letters indicate significant difference of mean values (P<0.05).
A dose-dependent decrease in Tr600 and increase in opacity was observed for SEP-containing nanocomposites which were significant (P<0.05) in SPE300 and SPE450. It means that the transparency and opacity of SPE150 is still near to C2 control film (CMC/TiO2-2%). The opacity enhancement in extract-activated films is previously reported for borage seed, rosemary and oregano extracts on gelatin films65 and green tea extract (GTE) on chitosan film.53 The existence of polyphenols are reported as the main reason for higher opacity.
Incredibly, all three SPE-containing nanocomposites completely blocked UV-light at 280 nm (Tr280=0%).
This high UV-barrier potential is very important for the shelf life of UV-sensitive products such as foods and drugs. It also implies that SPE can play a promising role in UV-blocker nanocomposites or coatings.
Antimicrobial activity of pure SPE and SPE-activated nanocomposites
Pure SPE showed antibacterial activity against both S. aureus and E. coli as the MIC for both bacteria was 32 mg/mL while the MBC was obtained at 64 mg/mL for S. aureus and at 128 mg/mL for E. coli (Figure 8A and B). It reveals that E. coli is more resistant to current SPE. As expected, the disk diffusion test for TiO2-containing control group nanocomposite (C2) did not show any antimicrobial effect on both bacteria. This could be due to its low content (2%) and the fact that it is not performing UV-functionalization on TONP (since it was not considered here as an antimicrobial agent). However, SPE-containing nanocomposites (CMC-TiO2-SPE) showed a dose-dependent increase in antibacterial activity (Figure 8C). The disc diffusion test for SPE-activated nanocomposites showed higher inhibition zone against S. aureus at the same SPE content. There are some contradictory results which showed that gram negative bacteria were more sensitive to Miswak extract.25,31 On the other hand, similar to our results, some studies have reported higher sensitivity of gram positives (such as S. aureus) to SPE.34 The contradictory reports may be due to various extraction methods (such as temperature, solvent, time, etc.), the region and climate of the places where Miswak roots were gathered affects the bioactive components and antimicrobial activities. In lots of studies, BITC is reported as the main antimicrobial component in different SPE. The known mechanism for antibacterial activity of BITC is attributed to its electro-lipophilic properties in which the interaction between BITC and bacterium membrane led to the dysfunction of the redox system. Finally, the bacterial membrane disintegration and potential changes are the main reasons for SPE antibacterial activity.31 As the presence of minerals and salts was proved by EXD and MAP analysis for this study, these components may also have changed the osmosis potential and the optimal parameters for bacterial growth. These findings suggest that pure SPE and SPE-containing nanocomposites have the potential to be considered in antimicrobial biomaterials.
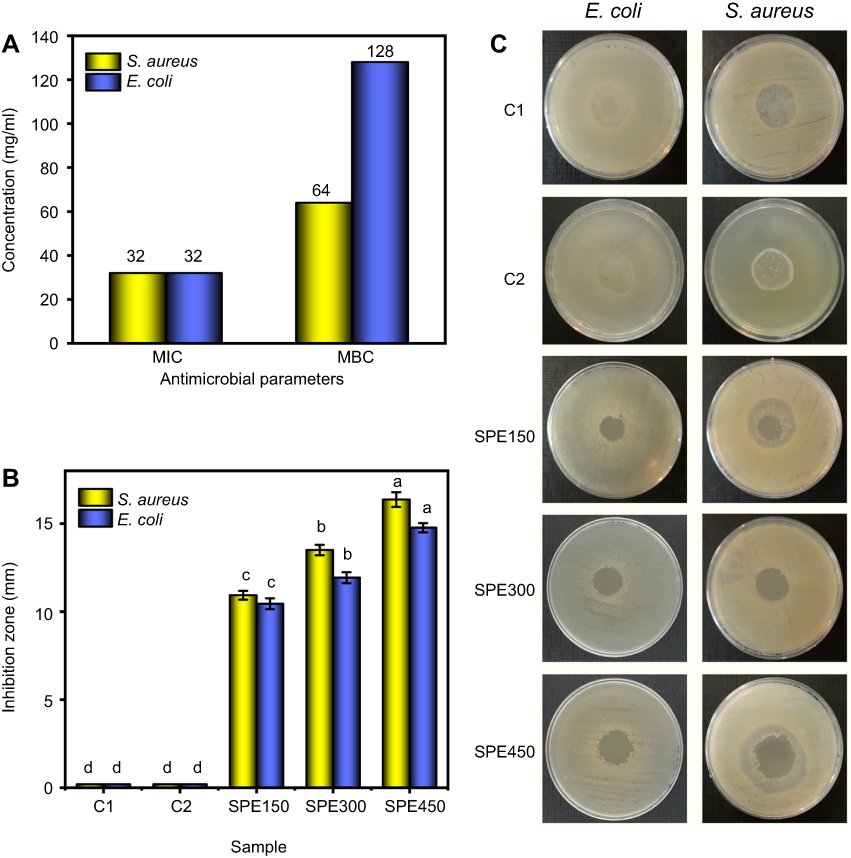 | Figure 8 The MIC and MBC test for pure-SPE (A); recorded inhibition zone from disk diffusion test (B); and digital photos of disk diffusion test (C) for all samples.Abbreviations: C1, CMC film; C2, CMC/TONP-2% nanocomposite; CMC, carboxymethyl cellulose; E. coli, Escherichia coli bacterium; MBC, minimum bactericidal concentration; MIC, minimum inhibitory concentration; S. aureus, Staphylococcus aureus bacterium; SPE, Salvadora persica L. root extract; SPE150, SPE300, and SPE450: CMC/TONP-2% containing 150, 300, and 450 mg/ml of SPE, respectively; TONP, TiO2 nanoparticles. |
Conclusion
Due to good biological properties of Miswak (Salvadora persica L.) extract (SPE) especially for antimicrobial purposes and on the other hand, the application of TiO2 nanoparticles (TONP) as a nanofiller for biopolymeric nanocomposites, the active bio-nanocomposites using TONP and SPE were properly fabricated. The UV-barrier properties showed that TONP diminished UV-transmittance while simultaneous presence of TONP and SPE in carboxymethyl cellulose (CMC) matrix completely blocked it in all applied concentrations of SPE. Elemental mapping analysis (MAP) and energy-dispersive X-ray (EDX) spectroscopy showed the existence of Na, Cl, K, S, N, Cl, Ti and F in SPE-containing nanocomposite. FTIR, MAP, SEM and XRD showed a favorable nanocomposite structure where there was no pore, crack and agglomeration or accumulation of all applied materials. Both TONP and SPE improved the heat stability of CMC through lowering mass loss and increase in the maximum temperature of degradation. Pure SPE and SPE-activated nanocomposites showed a good antimicrobial activity against both gram positive (S. aureus) and negative (E. coli) bacteria. Totally, our results show that SPE and TONP have good miscibility within CMC matrix that highlights their usage in different active antimicrobial biomaterials particularly in the area of packaging applications of product with low moisture content.
Abbreviations list
BITC, benzyl isothiocyanate; C1, CMC film; C2, CMC/TONP-2% nanocomposite; CMC or Na-CMC, carboxymethyl cellulose; EB, elongation to break (flexibility); MBC, minimum bactericidal concentration; MIC, minimum inhibitory concentration; SB, stress at break point; SPE, Salvadora persica L. root extract; SPE150, SPE300 and SPE450, CMC/TONP-2% containing 150, 300 and 450 mg/mL of SPE, respectively; TONP, TiO2 nanoparticles; YM, Young’s modulus.
Acknowledgments
This study was supported by Maragheh University of Medical Sciences and was done in Drug Applied Research Center, Tabriz University of Medical Sciences. We thank all staff of DARC for their collaboration and support.
Disclosure
The authors report no conflicts of interest in this work.
References
1. Deng X, Nikiforov AY, Leys C. Antimicrobial nanocomposites for food packaging. In: Grumezescu AM, editor. Food Preservation: Nanotechnology in the Agri-Food Industry. Vol. 6. Uk & USA: Academic Press; 2017:1–34.
2. Debeaufort F. Hydrocolloids as edible or active packaging materials. In: Williams PA, Phillips GO, editors. Gums and Stabilisers for the Food Industry- the Changing Face of Food Manufacture: The Role of Hydrocolloids. Vol. 17. UK: Royal Society of Chemistry; 2014:271–286.
3. Ahmadi R, Ghanbarzadeh B, Ayaseh A, et al. The antimicrobial bio-nanocomposite containing non-hydrolyzed cellulose nanofiber (CNF) and Miswak (Salvadora persica L.) extract. Carbohydr Polym. 2019;214:15–25. doi:10.1016/j.carbpol.2019.03.010
4. Ghanbarzadeh B, Almasi H. Physical properties of edible emulsified films based on carboxymethyl cellulose and oleic acid. Int J Biol Macromol. 2011;48(1):44–49. doi:10.1016/j.ijbiomac.2010.09.014
5. Oun AA, Rhim JW. Preparation and characterization of sodium carboxymethyl cellulose/cotton linter cellulose nanofibril composite films. Carbohydr Polym. 2015;127:101–109. doi:10.1016/j.carbpol.2015.03.073
6. Namazi H, Rakhshaei R, Hamishehkar H, Samadi Kafil H. Antibiotic loaded carboxymethylcellulose/MCM-41 nanocomposite hydrogel films as potential wound dressing. Int J Biol Macromol. 2016;85:327–334. doi:10.1016/j.ijbiomac.2015.12.076
7. Muppalla SR, Kanatt SR, Chawla SP, Sharma A. Carboxymethyl cellulose–polyvinyl alcohol films with clove oil for active packaging of ground chicken meat. Food Packaging Shelf Life. 2014;2(2):51–58. doi:10.1016/j.fpsl.2014.07.002
8. Dashipour A, Razavilar V, Hosseini H, et al. Antioxidant and antimicrobial carboxymethyl cellulose films containing Zataria multiflora essential oil. Int J Biol Macromol. 2015;72:606–613. doi:10.1016/j.ijbiomac.2014.09.006
9. Salari M, Sowti-Khiabani M, Rezaei-Mokarram R, Ghanbarzadeh B, Kafil HS. Development and evaluation of chitosan based active nanocomposite films containing bacterial cellulose nanocrystals and silver nanoparticles. Food Hydrocoll. 2018;84:414–423. doi:10.1016/j.foodhyd.2018.05.037
10. Oun AA, Rhim JW. Preparation of multifunctional chitin nanowhiskers/ZnO-Ag NPs and their effect on the properties of carboxymethyl cellulose-based nanocomposite film. Carbohydr Polym. 2017;169:467–479. doi:10.1016/j.carbpol.2017.04.042
11. Hasheminya S-M, Rezaei Mokarram R, Ghanbarzadeh B, Hamishekar H, Samadi Kafil H. Physicochemical, mechanical, optical, microstructural and antimicrobial properties of novel kefiran-carboxymethyl cellulose biocomposite films as influenced by copper oxide nanoparticles (CuONPs). Food Packaging Shelf Life. 2018;17:196–204. doi:10.1016/j.fpsl.2018.07.003
12. Ghanbari Mehrabani M, Karimian R, Rakhshaei R, et al. Chitin/silk fibroin/TiO 2 bio-nanocomposite as a biocompatible wound dressing bandage with strong antimicrobial activity. Int J Biol Macromol. 2018;116:966–976. doi:10.1016/j.ijbiomac.2018.05.102
13. Shi J, Lu L, Guo W, Zhang J, Cao Y. Heat insulation performance, mechanics and hydrophobic modification of cellulose–siO2 composite aerogels. Carbohydr Polym. 2013;98:282–289. doi:10.1016/j.carbpol.2013.05.082
14. Ghanbari Mehrabani M, Karimian R, Mehramouz B, Rahimi M, Samadi Kafil H. Preparation of biocompatible and biodegradable silk fibroin/chitin/silver nanoparticles 3D scaffolds as a bandage for antimicrobial wound dressing. Int J Biol Macromol. 2018;114:961–971. doi:10.1016/j.ijbiomac.2018.03.128
15. Goikuria U, Larranaga A, Vilas JL, Lizundia E. Thermal stability increase in metallic nanoparticles-loaded cellulose nanocrystal nanocomposites. Carbohydr Polym. 2017;171:193–201. doi:10.1016/j.carbpol.2017.05.024
16. Murgić ZH, Rešček A, Siročić AP, Krehula LK, Katančić Z. Polymer nanocomposites and antimicrobial activity. In: Nanoparticles in Active Polymer Food Packaging. Shropshire, UK: Smithers Pira Technology Ltd; 2015:73–89.
17. Zhang X, Xiao G, Wang Y, Zhao Y, Su H, Tan T. Preparation of chitosan-TiO2 composite film with efficient antimicrobial activities under visible light for food packaging applications. Carbohydr Polym. 2017;169:101–107. doi:10.1016/j.carbpol.2017.03.073
18. Oleyaei SA, Almasi H, Ghanbarzadeh B, Moayedi AA. Synergistic reinforcing effect of TiO2 and montmorillonite on potato starch nanocomposite films: thermal, mechanical and barrier properties. Carbohydr Polym. 2016;152:253–262. doi:10.1016/j.carbpol.2016.07.040
19. Halawany HS. A review on miswak (Salvadora persica) and its effect on various aspects of oral health. Saudi Dental J. 2012;24(2):63–69. doi:10.1016/j.sdentj.2011.12.004
20. Sofrata AH, Claesson RL, Lingstrom PK, Gustafsson AK. Strong antibacterial effect of miswak against oral microorganisms associated with periodontitis and caries. J Periodontol. 2008;79(8):1474–1479. doi:10.1902/jop.2008.070506
21. Mohamed SA, Khan JA. Antioxidant capacity of chewing stick miswak Salvadora persica. BMC Complement Altern Med. 2013;13(40):40. doi:10.1186/1472-6882-13-118
22. Balto H, Al-Sanie I, Al-Beshri S, Aldrees A. Effectiveness of Salvadora persica extracts against common oral pathogens. Saudi Dental J. 2017;29(1):1–6. doi:10.1016/j.sdentj.2016.11.001
23. Balto H, Al-Manei KK, Bin-Mohareb TM, Shakoor ZA, Al-Hadlaq SM. Cytotoxic effect of Salvadora persica extracts on human gingival fibroblast cells. Saudi Med J. 2014;35(8):810–815.
24. Chaurasia A, Patil R, Nagar A. Miswak in oral cavity – an update. J Oral Biol Craniofacl Res. 2013;3(2):98–101. doi:10.1016/j.jobcr.2012.09.004
25. Chelli-Chentouf N, Tir Touil Meddah A, Mullie C, Aoues A, Meddah B. In vitro and in vivo antimicrobial activity of Algerian Hoggar Salvadora persica L. extracts against microbial strains from children‘s oral cavity. J Ethnopharmacol. 2012;144(1):57–66. doi:10.1016/j.jep.2012.08.025
26. Al-Sohaibani S, Murugan K. Anti-biofilm activity of Salvadora persica on cariogenic isolates of Streptococcus mutans: in vitro and molecular docking studies. Biofouling. 2012;28(1):29–38. doi:10.1080/08927014.2011.647308
27. Bahabri FS. Application of spectroscopic techniques for the identification of organic and inorganic constituents of Salvadora persica from Saudi Arabia. Physica A. 2000;276:346–351. doi:10.1016/S0378-4371(99)00278-2
28. Farag MA, Fahmy S, Choucry MA, Wahdan MO, Elsebai MF. Metabolites profiling reveals for antimicrobial compositional differences and action mechanism in the toothbrushing stick “miswak” Salvadora persica. J Pharm Biomed Anal. 2017;133:32–40. doi:10.1016/j.jpba.2016.11.018
29. Noumi E, Snoussi M, Merghni A, et al. Phytochemical composition, anti-biofilm and anti-quorum sensing potential of fruit, stem and leaves of Salvadora persica L. methanolic extracts. Microb Pathog. 2017;109:169–176. doi:10.1016/j.micpath.2017.05.036
30. Taha Khalil A. Benzylamides from Salvadora persica. Arch Pharmacal Res. 2006;29(11):952–956. doi:10.1007/BF02969277
31. Sofrata A, Santangelo EM, Azeem M, Borg-Karlson AK, Gustafsson A, Putsep K. Benzyl isothiocyanate, a major component from the roots of Salvadora persica is highly active against gram-negative bacteria. PLoS One. 2011;6(8):e23045. doi:10.1371/journal.pone.0023045
32. Al-Ayed MS, Asaad AM, Qureshi MA, Attia HG, AlMarrani AH. Antibacterial activity of Salvadora persica L. (miswak) extracts against multidrug resistant bacterial clinical isolates. Evid Based Complement Alternat Med. 2016;2016:7083964. doi:10.1155/2016/5040528
33. Fallah M, Fallah F, Kamalinejad M, Malekan MA, Akhlaghi Z, Esmaeili M. The antimicrobial effect of aquatic extract of Salvadora persica on Mycobacterium bovis in vitro. Int J Mycobacteriol. 2015;4:167–168. doi:10.1016/j.ijmyco.2014.10.043
34. Rasouli Ghahroudi AA, Rezaei A, Mohseni Salehifard SH, et al. Inhibitory activity of Salvadora persica extracts against oral bacterial strains associated with periodontitis: an in-vitro study. J Oral Biol Craniofacl Res. 2014;4(1):19–23. doi:10.1016/j.jobcr.2014.01.001
35.
36.
37.
38. Moghiminia S, Farsi H, Raissi H. Comparative optical and electrochemical studies of nanostructured NiTiO3 and NiTiO3-TiO2 prepared by a low temperature modified Sol-Gel route. Electrochim Acta. 2014;132:512–523. doi:10.1016/j.electacta.2014.03.166
39. Munawar K, Mansoor MA, Basirun WJ, Misran M, Huang NM, Mazhar M. Single step fabrication of CuO–mnO–2TiO2 composite thin films with improved photoelectrochemical response. RSC Adv. 2017;7:15885–15893. doi:10.1039/C6RA28752B
40. Li JY, Cheng W, Li Y, Xu X, Lin K. Mesoporous TiO2-Carbon beads-one-pot preparation and their application in visible-light-induced photodegradation. Nano-Micro Lett. 2015;7(3):243–254. doi:10.1007/s40820-015-0029-5
41. Zhu J, Yang YT, Wang F, Cao M. Composites of TiO 2 nanoparticles deposited on Ti 3 C 2 MXene nanosheets with enhanced electrochemical performance. JElS. 2016;163(5):A785–A791.
42. Ebrahimzadeh S, Ghanbarzadeh B, Hamishehkar H. Physical properties of carboxymethyl cellulose based nano-biocomposites with graphene nano-platelets. Int J Biol Macromol. 2016;84:16–23. doi:10.1016/j.ijbiomac.2015.11.074
43. Luna-Martínez JF, Hernández-Uresti DB, Reyes-Melo ME, Guerrero-Salazar CA, González-González VA, Sepúlveda-Guzmán S. Synthesis and optical characterization of ZnS–sodium carboxymethyl cellulose nanocomposite films. Carbohydr Polym. 2011;84(1):566–570. doi:10.1016/j.carbpol.2010.12.021
44. Joo S-W. Characterization of self‐assembled phenyl and benzyl isothiocyanate thin films on Au surfaces. Surf Interf Anal. 2006;38:173–177. doi:10.1002/(ISSN)1096-9918
45. Li W, Liu X, Yang Q, Zhang N, Du Y, Zhu H. Preparation and characterization of inclusion complex of benzyl isothiocyanate extracted from papaya seed with beta-cyclodextrin. Food Chem. 2015;184:99–104. doi:10.1016/j.foodchem.2015.03.091
46. Goudarzi V, Shahabi-Ghahfarrokhi I. Development of photo-modified starch/kefiran/TiO2 bio-nanocomposite as an environmentally-friendly food packaging material. Int J Biol Macromol. 2018;116:1082–1088. doi:10.1016/j.ijbiomac.2018.05.138
47. Peng Y, Wu Y, Li Y. Development of tea extracts and chitosan composite films for active packaging materials. Int J Biol Macromol. 2013;59:282–289. doi:10.1016/j.ijbiomac.2013.04.019
48. Park S-I, Zhao Y. Incorporation of a high concentration of mineral or vitamin into chitosan-based films. J Agric Food Chem. 2004;52:1933−1939. doi:10.1021/jf034612p
49. Mir SA, Dar BN, Wani AA, Shah MA. Effect of plant extracts on the techno-functional properties of biodegradable packaging films. Trends Food Sci Technol. 2018;80:141–154. doi:10.1016/j.tifs.2018.08.004
50. Deka BK, Maji TK. Effect of TiO2 and nanoclay on the properties of wood polymer nanocomposite. Compos Part A Appl Sci Manuf. 2011;42(12):2117–2125. doi:10.1016/j.compositesa.2011.09.023
51. Oleyaei SA, Zahedi Y, Ghanbarzadeh B, Moayedi AA. Modification of physicochemical and thermal properties of starch films by incorporation of TiO2 nanoparticles. Int J Biol Macromol. 2016;89:256–264. doi:10.1016/j.ijbiomac.2016.04.078
52. Adilah ZAM, Jamilah B, Hanani ZAN. Functional and antioxidant properties of protein-based films incorporated with mango kernel extract for active packaging. Food Hydrocoll. 2018;74:207–218. doi:10.1016/j.foodhyd.2017.08.017
53. Siripatrawan U, Harte BR. Physical properties and antioxidant activity of an active film from chitosan incorporated with green tea extract. Food Hydrocoll. 2010;24(8):770–775. doi:10.1016/j.foodhyd.2010.04.003
54. Nouri A, Yaraki MT, Ghorbanpour M, Wang S. Biodegradable κ-carrageenan-nanoclay nanocomposite films containing Rosmarinus officinalis L. extract for improved strength and antibacterial performance. Int J Biol Macromol. 2018;115:227–235. doi:10.1016/j.ijbiomac.2018.04.051
55. Kanmani P, Rhim J-W. Development and characterization of carrageenan/grapefruit seed extract composite films for active packaging. Int J Biol Macromol. 2014;68:258–266. doi:10.1016/j.ijbiomac.2014.05.011
56. Nouri L, Mohammadi Nafchi A. Antibacterial, mechanical, and barrier properties of sago starch film incorporated with Betel leaves extract. Int J Biol Macromol. 2014;66:254–259. doi:10.1016/j.ijbiomac.2014.02.044
57. Kaewklin P, Siripatrawan U, Suwanagul A, Lee YS. Active packaging from chitosan-titanium dioxide nanocomposite film for prolonging storage life of tomato fruit. Int J Biol Macromol. 2018;112:523–529. doi:10.1016/j.ijbiomac.2018.01.124
58. Salarbashi D, Tafaghodi M, Bazzaz BSF, Jafari B. Characterization of soluble soybean (SSPS) polysaccharide and development of eco-friendly SSPS/TiO2 nanoparticle bionanocomposites. Int J Biol Macromol. 2018;112:852–861. doi:10.1016/j.ijbiomac.2018.01.182
59. López de Dicastillo C, Bustos F, Guarda A, Mj G. Cross-linked methyl cellulose films with murta fruit extract for antioxidant and antimicrobial active food packaging. Food Hydrocoll. 2016;60:335–344. doi:10.1016/j.foodhyd.2016.03.020
60. Su J-F, Huang Z, Yuan X-Y, Wang X-Y, Li M. Structure and properties of carboxymethyl cellulose/soy protein isolate blend edible films crosslinked by Maillard reactions. Carbohydr Polym. 2010;79(1):145–153. doi:10.1016/j.carbpol.2009.07.035
61. Tunc S, Duman O, Polat TG. Effects of montmorillonite on properties of methyl cellulose/carvacrol based active antimicrobial nanocomposites. Carbohydr Polym. 2016;150:259–268. doi:10.1016/j.carbpol.2016.05.019
62. Jahed E, Khaledabad MA, Almasi H, Hasanzadeh R. Physicochemical properties of Carum copticum essential oil loaded chitosan films containing organic nanoreinforcements. Carbohydr Polym. 2017;164:325–338. doi:10.1016/j.carbpol.2017.02.022
63. Zhou JJ, Wang SY, Gunasekaran S. Preparation and characterization of whey protein film incorporated with TiO2 nanoparticles. J Food Sci. 2009;74(7):N50–56. doi:10.1111/j.1750-3841.2009.01270.x
64. Zolfi M, Khodaiyan F, Mousavi M, Hashemi M. Development and characterization of the kefiran-whey protein isolate-TiO2 nanocomposite films. Int J Biol Macromol. 2014;65:340–345. doi:10.1016/j.ijbiomac.2014.01.010
65. Wang S, Marcone MF, Barbut S, Lim L-T. Fortification of dietary biopolymers-based packaging material with bioactive plant extracts. Food Res Int. 2012;49(1):80–91. doi:10.1016/j.foodres.2012.07.023
 © 2019 The Author(s). This work is published and licensed by Dove Medical Press Limited. The
full terms of this license are available at https://www.dovepress.com/terms
and incorporate the Creative Commons Attribution
- Non Commercial (unported, 3.0) License.
By accessing the work you hereby accept the Terms. Non-commercial uses of the work are permitted
without any further permission from Dove Medical Press Limited, provided the work is properly
attributed. For permission for commercial use of this work, please see paragraphs 4.2 and 5 of our Terms.
© 2019 The Author(s). This work is published and licensed by Dove Medical Press Limited. The
full terms of this license are available at https://www.dovepress.com/terms
and incorporate the Creative Commons Attribution
- Non Commercial (unported, 3.0) License.
By accessing the work you hereby accept the Terms. Non-commercial uses of the work are permitted
without any further permission from Dove Medical Press Limited, provided the work is properly
attributed. For permission for commercial use of this work, please see paragraphs 4.2 and 5 of our Terms.