Back to Journals » Diabetes, Metabolic Syndrome and Obesity » Volume 18
Extensive Dynamic Functional Network Connectivity Alterations in Diabetic Retinopathy Among Patients with Type 2 Diabetes
Authors Liu H ![]() , Gu ZX
, Gu ZX ![]() , Li XT
, Li XT ![]() , Huang X
, Huang X
Received 19 October 2024
Accepted for publication 4 April 2025
Published 30 May 2025 Volume 2025:18 Pages 1823—1835
DOI https://doi.org/10.2147/DMSO.S501849
Checked for plagiarism Yes
Review by Single anonymous peer review
Peer reviewer comments 2
Editor who approved publication: Dr Rebecca Baqiyyah Conway
Hao Liu,1,* Zheng-Xue Gu,2,* Xiao-Tong Li,3 Xin Huang4
1School of Ophthalmology and Optometry, Jiangxi Medical College, Nanchang University, Nanchang, Jiangxi, People’s Republic of China; 2Department of Radiology, Nanjing Central Hospital, Nanjing, People’s Republic of China; 3Queen Mary School, Jiangxi Medical College, Nanchang University, Nanchang, Jiangxi, People’s Republic of China; 4The Affiliated Eye Hospital, Jiangxi Medical College, Nanchang University, Jiangxi, People’s Republic of China
*These authors contributed equally to this work
Correspondence: Xin Huang, The Affiliated Eye Hospital, Jiangxi Medical College, Nanchang University, Jiangxi Province Key Laboratory of Ophthalmology and Vision Sciences, Jiangxi Clinical Research Center for Ophthalmic Disease, Jiangxi Provincial Key Laboratory of Vitreoretinal Diseases for Health, 463 Bayi Avenue, Nanchang, Jiangxi Province, 330006, People’s Republic of China, Tel +8615879215294, Email [email protected]
Background: Diabetic retinopathy (DR) is a prevalent microvascular complication of diabetes. Prior neuroimaging research has indicated that patients with DR exhibit diverse levels of disrupted brain function alongside a variety of ocular symptoms. Nevertheless, past investigations have predominantly focused on static brain activity changes, leaving uncertainties regarding the modifications in dynamic large-scale brain networks among DR patients.
Purpose: The aim of this study was to investigate the alterations in dynamic large-scale functional network connectivity in DR patients and its medical significance.
Methods: Forty-six patients with DR (type 2 diabetes mellitus) and 46 healthy controls, matched for age, gender, and education level, were enrolled in this study. Initial application of Independent Component Analysis (ICA) methods was used to extract the resting state network (RSN) from resting state functional magnetic resonance imaging (fMRI) data. Subsequently, sliding time window and k-means cluster analysis were employed to derive five stable repetitions of the dynamic functional network connectivity (dFNC) states and compare the differences in dFNC between the two cohorts for each state. Finally, the study investigated between-group variances in three dynamic temporal metrics.
Results: Significant between-group differences in dFNC were observed in states 1 and 2. Patients with DR, compared to healthy controls, exhibited reduced functional connectivity within the visual network (VN) and between the dorsal attention network (DAN) and VN, coupled with higher functional connectivity between the default mode network (DMN) and VN, cerebellum network (CN) and VN, and DMN-executive control network (ECN). Regarding the three dynamic temporal metrics, the study findings indicated that DR patients experienced a notable decline in the fraction of time and mean dwell time in state 1, while showing an increase in these metrics for state 3.
Conclusion: Our study reveals extensive dynamic functional network connectivity alterations among patients with DR, potentially linked to visual impairment and cognitive deficits. These discoveries offer valuable insights into the neural mechanisms that drive changes in dynamic large-scale brain networks in individuals with DR.
Keywords: diabetic retinopathy, functional magnetic resonance imaging, independent component analysis, resting state network
Introduction
Diabetes stands as one of the most prevalent chronic diseases worldwide, presenting a significant public health challenge in the 21st century.1 It is projected that by 2040, the global diabetic population will soar to 642 million individuals.2 Diabetes can trigger various microvascular complications across multiple organs, including the brain,3 eyes,4 heart,5 and kidneys,6 with diabetic retinopathy (DR) emerging as a severe complication. The global prevalence of DR among diabetic patients is 22.27%, ranking as a prominent cause of blindness globally.7,8 Noteworthy risk factors for DR encompass hyperglycemia, hypertension, dyslipidemia, duration of diabetes mellitus, and pregnancy.4 The primary pathological characteristics of DR involve microvascular blockade, microangioma development, capillary nonperfusion, vascular permeability, and retinal neurodegeneration, potentially progressing to neovascularization, proliferative retinal detachment, and eventual blindness. These microangiopathies and neurodegeneration are associated with inflammation, oxidative stress, and a variety of metabolic abnormalities, including abnormalities in the polyol pathway, accumulation of advanced glycosylation end products (AGEs), activation of the protein kinase C (PKC) pathway, and increased flux of the hexosamine pathway.9–11 Remarkably, the retinal vasculature shares resemblances in anatomy, physiology, and embryology with the cerebral vasculature.12 Autopsies of diabetic patients often unveil analogous microangiopathy in their brains.13 Both diabetes-induced retinal neurodegeneration and cerebral neurodegenerative diseases exhibit common pathogenic pathways,14 and implying that diabetes could provoke structural and functional neuronal aberrations in the brain.15 Numerous studies also highlight impaired cognitive functions in individuals with DR,16,17 suggesting that besides affecting ocular health, DR may also induce central nervous system abnormalities.
Several neuroimaging studies have revealed a spectrum of structural and functional brain changes among patients with DR. Diffusion-weighted imaging techniques have demonstrated notably elevated apparent diffusion coefficient (ADC) values in key visual regions (orbitofrontal cortex, cingulate gyrus, and visual cortex) in DR patients.18 Reduced gray matter density in the right inferior frontal gyrus and right occipital lobe has been observed in individuals with DR.19 An examination of the structural gray matter networks in the brains of DR patients showcased diminished local path lengths and local clustering, which are believed to be linked to functional deficits.20 These structural alterations are thought to be associated with some functional impairments in DR patients. Regarding the functional changes of the brain in patients with DR, it has been found that the amplitude of low-frequency fluctuation (ALFF) values in the bilateral calcarine area and the middle occipital gyrus were significantly lower in patients with DR,21,22 and the regional homogeneity of the right anterior cingulate gyrus and right cuneiform lobe (ReHo) values were also significantly lower than those of the healthy controls group.23 Altered functional connectivity has been noted in various networks, including the auditory, visual, default mode, salience, and sensorimotor networks in patients with DR, potentially leading to interhemispheric coordination issues and subsequent functional irregularities.24 Additionally, abnormal topological properties in functional brain networks among DR patients may contribute to visual and cognitive impairments.25 Nonetheless, the precise alterations in dynamic large-scale brain networks in DR patients remain ambiguous.
Functional network connectivity (FNC) is a valuable tool for examining the temporal correlations among resting-state networks (RSNs). The resting state means that subjects are instructed to let their minds roam freely in the absence of a task or stimulus, which, unlike studies in the task-based state, avoids the incomparability of experimental results in task-based studies due to differences in the design of the task and variability in its execution by the subjects. In a prior study, we investigated FNC alterations in individuals with DR and discovered significant deficits in both low-level perceptual and high-level cognitive networks in this population. This research provided crucial insights into the neural mechanisms associated with vision impairment and cognitive decline in individuals with DR.26 However, the static nature of traditional FNC analysis assumes that functional interactions remain consistent throughout resting-state scans. In reality, emerging evidence suggests that human brain activity is dynamic, characterized by substantial time-varying fluctuations.27,28 Notably, functional connectivity can fluctuate in response to various factors such as task demands, learning processes, and significant state transitions including sleep and sedation, showcasing changes in both the strength and directionality of connectivity not only between scanning runs but also on faster timescales (seconds to minutes).29 The exploration of dynamic functional network connectivity (dFNC) unveils a wealth of information embedded in these time-varying features, offering insights into the macroscopic neural activity patterns that underlie critical aspects of cognition and behavior, thus warranting further investigation.
The current study utilized a combination of the sliding window approach and k-means cluster analysis, integrating independent component analysis (ICA) to examine dFNC changes in individuals with DR and to identify inter-group disparities in three dynamic temporal metrics. Our hypothesis posited aberrant functional connectivity within the dynamic large-scale brain networks of DR patients.
Materials and Methods
Participants
Forty-six patients with DR (type 2 diabetes mellitus) and 46 healthy controls matched for sex, age, and education were recruited for this study from the Department of Ophthalmology at Jiangxi Provincial People’s Hospital between January 2022 and January 2024. Ethical approval number (202310114). The inclusion criteria for DR patients were: 1) Fasting blood glucose levels ≥ 7.0 mmol/L, random blood glucose levels ≥ 11.1 mmol/L, or 2-hour glucose levels ≥ 11.1 mmol/L; 2) Patients with nonproliferative DR exhibiting microaneurysms, hard exudates, and retinal hemorrhages.
The exclusion criteria for DR patients were: 1) Presence of proliferative DR with retinal detachment or vitreous hemorrhage; 2) Coexistence of other ocular complications (such as cataracts, glaucoma, high myopia, or optic neuropathy); 3) Diagnosis of diabetic nephropathy (urine albumin/creatinine ratio > 30 mg/g persisting for more than 3 months).
Healthy controls were mainly volunteers without other ophthalmic diseases who met the inclusion criteria. The inclusion and exclusion criteria for healthy controls were: 1) Fasting blood glucose levels < 7.0 mmol/L, random blood glucose levels < 11.1 mmol/L, glycosylated hemoglobin levels < 6.5%; 2) No ocular diseases (such as myopia, cataracts, glaucoma, optic neuritis, or retinal degeneration); 3) Binocular visual acuity ≥ 1.0; 4) No history of ocular surgery; 5) Absence of psychiatric disorders. All subjects had no contraindications to MRI such as claustrophobia, metallic implants or metallic foreign bodies in the body.
This study protocol followed the Declaration of Helsinki guidelines and received approval from the Research Ethics Committee of Jiangxi Provincial People’s Hospital. Before participating, all individuals were fully briefed on the study’s objectives, methodologies, potential risks, and provided written informed consent.
Magnetic Resonance Imaging Acquisition
Magnetic resonance imaging (MRI) scans were performed on a 3-T MRI scanner (Discovery MR 750W system; GE Healthcare, Milwaukee, WI, United States) with an eight-channel head coil. Functional images were obtained utilizing a gradient-echo-planar imaging sequence. Participants were directed to rest quietly with their eyes closed, maintaining a relaxed state without fixating on any particular thoughts or drifting off to sleep. During the scanning process, we monitored the subject’s condition throughout to ensure that they were not experiencing abnormalities. Whole-brain T1-weighted images were obtained through three-dimensional brain volume imaging (3D-BRAVO) MRI with the following parameters: repetition time [TR]/echo time [TE] = 8.5/3.3 ms, slice thickness = 1.0 mm, no interslice gap, acquisition matrix = 256 × 256, field of view = 240 mm × 240 mm, flip angle = 12 degrees, and 240 slices. Functional images were captured using a gradient-echo-planar imaging sequence with these parameters: TR/TE = 2000/25 ms, slice thickness = 3.0 mm, interslice gap = 1.2 mm, acquisition matrix = 64 × 64, flip angle = 90 degrees, field of view = 240 mm × 240 mm, voxel size = 3.6 mm × 3.6 mm × 3.6 mm, and 35 axial slices.
Data Preprocessing
All preprocessing steps were conducted using the Data Processing and Analysis of Brain Imaging (DPABI) toolbox,30 which operates on Statistical Parametric Mapping (SPM12) within MATLAB 2013a (MathWorks, Natick, MA, United States). The following procedures were implemented. The first 10 volumes of each scan were discarded to allow for magnetic stability and thus to generate a steady blood oxygenation level-dependent activity signal. Then, the remaining 230 images were slice-time corrected and realigned for head-motion correction. Participants exhibiting head movement beyond 2 mm translation or 1.5° rotation during the scan were excluded.31 The generated images were spatially normalized to the Montreal Neurological Institute (MNI) 152 space and resampling at a resolution of 3 mm x 3 mm x 3 mm. Application of spatial smoothing using a 6 mm x 6 mm x 6 mm isotropic Gaussian kernel with full width at half maximum.
An overview of the analytical process is depicted in Figure 1.
 |
Figure 1 Overview of the analytical process for this study: The study first applied the ICA method to extract RSNs from resting-state functional magnetic resonance imaging data, and then combined the sliding time window and k-mean cluster analysis methods to obtain five stable repetitions of dFNC states. Then the dFNC differences between the two groups of patients in each state were compared. Finally, between-group differences in three dynamic temporal metrics were explored. Abbreviations: ICA, independent component analysis; RSN, resting-state network; dFNC, dynamic functional network connectivity. |
Group Independent Component Analysis Analysis
Group ICA was conducted to decompose the data into independent components (ICs) utilizing the GIFT toolbox (version 3.0b). Initially, 24 IC maps were estimated in this research, employing the minimum description length criterion to account for spatial correlation. Subsequently, the ICs for each participant were obtained from the group ICA back-reconstruction phase and were standardized into z-scores.32 Components selected from the 24 estimated ICs for further analysis were chosen based on their strongest spatial correlation with specific RSN templates.33,34 The IC time courses and spatial maps for each individual were then converted into z-scores, leading to the identification of fourteen RSNs in this study.
Dynamic Functional Network Connectivity Analysis
The dFNC matrix was computed using a sliding window approach. In this investigation, the window width was configured to a TR of 30 (60s), with the window sliding along the time axis in steps of 2 TR.
All subjects’ dFNC matrices were subjected to k-means clustering to evaluate the occurrence and configuration of recurring dFNC patterns. The analysis employed sqEuclidean distance to gauge the resemblance between distinct time windows. To enhance the algorithm’s convergence, we established a maximum of 500 iterations and 150 repetitions. The elbow rule guided the selection of the optimal cluster number, which was determined to be k=5. Consequently, the dFNC matrices for all participants were classified into five dFNC states representing recurrent instantaneous functional connectivity patterns across various windows and subjects, with the cluster centroid defined as the central dFNC matrix.
A range of temporal features were computed as: (i) defining the fraction of time as the ratio of the time windows in a state to the total count, (ii) determining the mean dwell time representing the average duration within a specific state, and (iii) counting the transitions reflecting the instances when subjects transitioned between states during the scanning period.
Statistical Analysis
The differences of the clinical and demographic characteristics between DR patients and healthy controls were assessed using the χ2 test for categorical variables and an independent-samples t-test for continuous variables by SPSS version 16.0 (SPSS Inc., Chicago, IL, USA).
The independent components (ICs) corresponding to fourteen RSNs were extracted from all participants, and one-sample t-tests were conducted on the spatial maps of each RSN using the SPM12 software, aiming to create masks for two-sample t-tests by limiting the size of the brain voxels to make the results more precise. The statistical significance thresholds were established at P < 0.01, corrected for false discovery rate (FDR).
To assess the variations in dFNC between the DR and healthy control cohorts, direct comparisons were made utilizing two independent samples t-tests within the Stats module of the GIFT software package (p < 0.05, FDR-corrected). Additionally, a two-sample t-test was employed to scrutinize the differences in fraction time, mean dwell time, and number of transitions for each state between the groups (p < 0.05, FDR-corrected).
Results
Demographic and Clinical Characteristics
The clinical and demographic characteristics are detailed in Table 1. No significant differences in sex, education, or age were observed between the DR patients and healthy controls. However, notable disparities were detected in bilateral best-corrected visual acuity, showing statistical significance (P < 0.001).
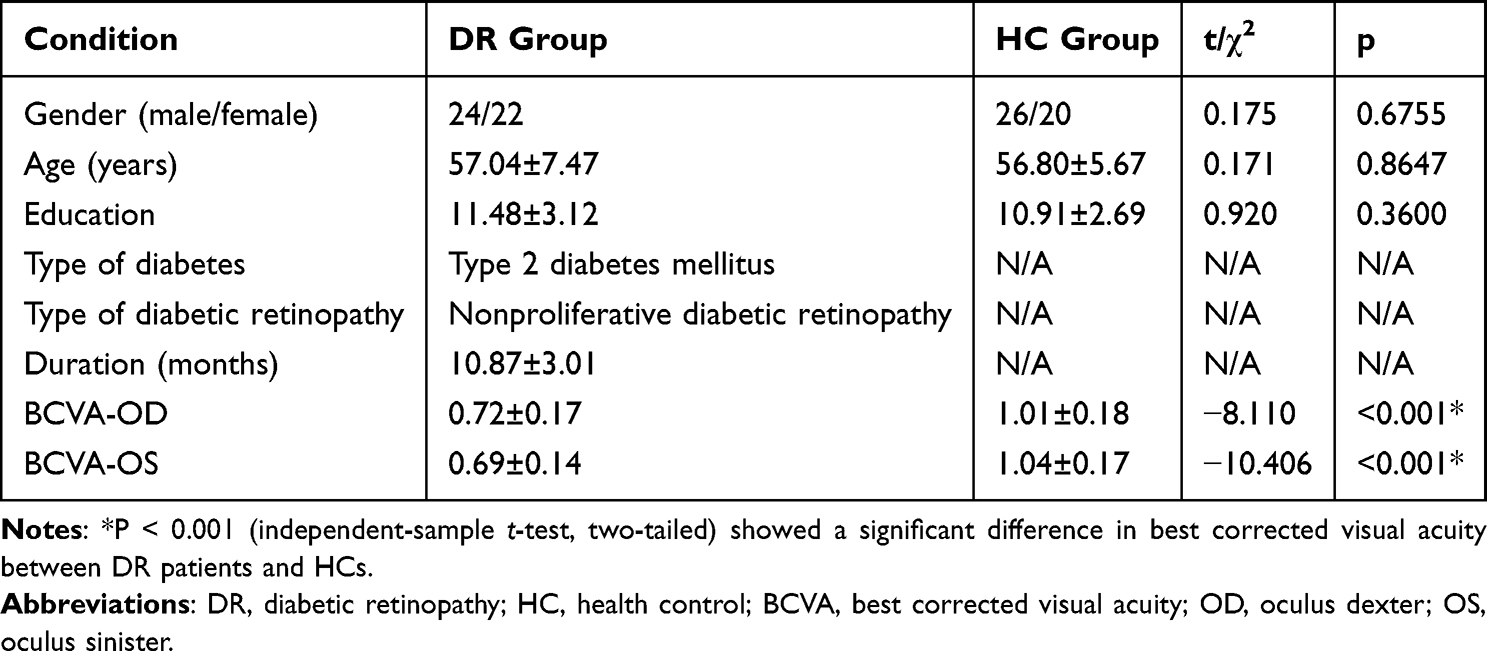 |
Table 1 Demographics and Visual Measurements Between Two Groups |
Spatial Pattern of Resting State Networks in Each Group
The typical spatial patterns in each RSN of both DR and healthy control groups, as illustrated in Figure 2. Fourteen of these components coincided with RSNs included: DMN (IC3, IC15, IC16, IC17): posterior cingulate cortex, precuneus, medial prefrontal cortex, inferior parietal lobule, and lateral temporal cortex.; DAN (IC7): the inferior parietal cortex, frontal eye motor area, auxiliary motor area, insular lobe, and dorsolateral prefrontal cortex; VN (IC8, IC9, IC13, IC20, IC24): middle occipital gyrus, superior occipital gyrus, the temporal-occipital regions, and fusiform gyrus; sensorimotor network(SMN)(IC10): precentral gyrus, postcentral gyrus, and supplementary motor area; ECN (IC11, IC21): dorsolateral frontal cortex and posterior cingulate cortex; CN (IC23): cortex and medulla (parietal nucleus, intermediate nucleus, and dentate nucleus).
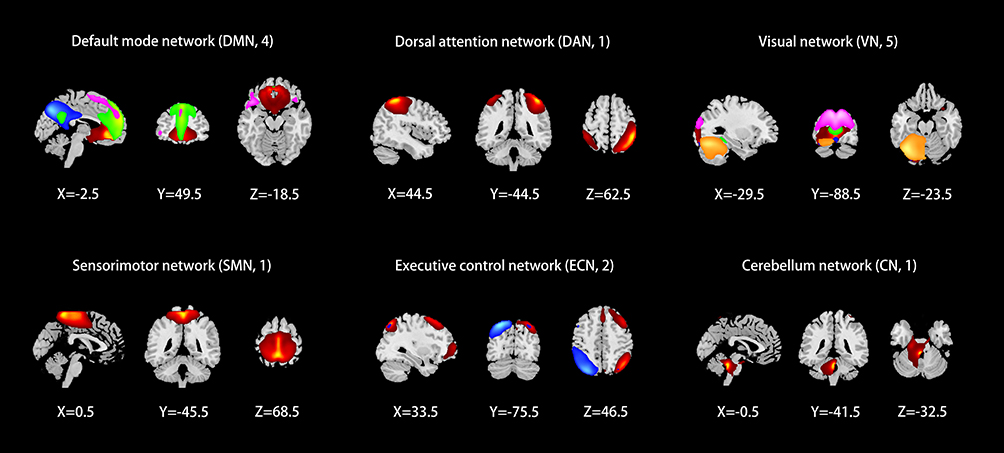 |
Figure 2 Spatial maps of the identified RSNs, including DMN (IC3, IC15, IC16, IC17), DAN (IC7), VN (IC8, IC9, IC13, IC20, IC24), SMN (IC10), ECN (IC11, IC21), CN (IC23). Different colors pass spatial information. Abbreviations: RSNs, resting-state networks; IC, independent component; DMN, default mode network; DAN, dorsal attention network; VN, visual network; SMN, sensorimotor network; ECN, executive control network; CN, cerebellum network. |
Dynamic Functional Network Connectivity Analysis
Cluster Analysis
Five recurrent states of dFNC matrices were identified through the scans using the k-means clustering algorithm. The distribution of these states varied among subjects: State 1 (24%) (Figure 3A), State 2 (7%) (Figure 3B), State 3 (26%) (Figure 3C), State 4 (11%) (Figure 3D), and State 5 (32%) (Figure 3E). The visualization of functional network connectivity in each state is illustrated in State 1 (Figure 3F), State 2 (Figure 3G), State 3 (Figure 3H), State 4 (Figure 3I), and State 5 (Figure 3J).
 |
Figure 3 Five recurrent states of dFNC matrices were identified through the scans using the k-means clustering algorithm. The distribution of these states varied among subjects: State 1 (24%) (A), State 2 (7%) (B), State 3 (26%) (C), State 4 (11%) (D), and State 5 (32%) (E). The visualization of functional network connectivity in each state is illustrated in State 1 (F), State 2 (G), State 3 (H), State 4 (I), and State 5 (J).(K and L) Significant differences in dFNC between DR and HCs were observed in state1 and state2 (p<0.05, FDR correction). Abbreviations: dFNC, dynamic functional network connectivity; DR, diabetic retinopathy; HCs, health controls; DMN, default mode network; DAN, dorsal attention network; VN, visual network; SMN, sensorimotor network; ECN, executive control network; CN, cerebellum network. |
Comparison of Dynamic Functional Network Connectivity Between Groups
Two independent sample t-tests were utilized for further comparison of the dFNC matrix in each state between groups, revealing significant differences in state 1 and state 2 between DR patients and healthy controls (p < 0.05, FDR corrected). When compared to healthy controls, the DR group exhibited increased connectivity between default mode network-ventral network (DMN-VN), sensorimotor network-ventral network (SMN-VN), DMN-executive control network (DMN-ECN), and cingulo-opercular network-ventral network (CN-VN) in state 1, whereas decreased connectivity was observed between dorsal attention network-ventral network (DAN-VN) (Figure 3K and Table 2). State 2 demonstrated enhanced connectivity between CN-VN and reduced connectivity between SMN-VN and VN-VN in the DR group (Figure 3L and Table 2).
 |
Table 2 Significant Dynamic Functional Network Connectivity Differences Across States |
Comparison of Dynamic Functional Network Connectivity Temporal Metrics Between Groups
Figure 4 illustrates that compared to healthy controls, patients with DR exhibited a significant decrease in the fraction of time (Figure 4A) and mean dwell time in state 1(Figure 4B), along with a significant increase in the fraction of time (Figure 4A) and mean dwell time in state 3 (Figure 4B) (p < 0.05). Notably, there was no significant difference in the number of transitions between DR patients and healthy controls (Figure 4C and D) (Table 3).
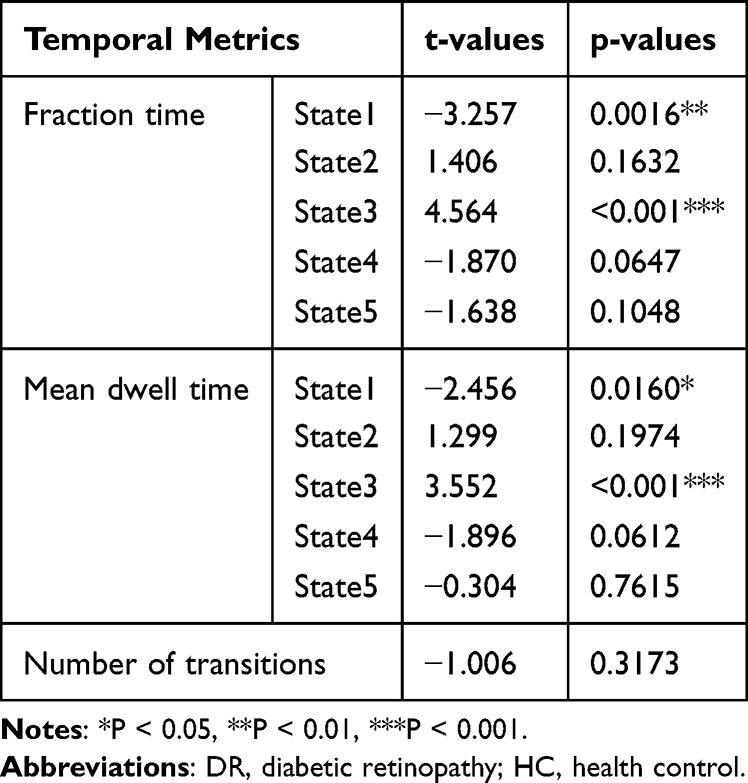 |
Table 3 Differences in Dynamic Temporal Metrics Across States Between DR and HC Groups |
 |
Figure 4 Dynamic temporal metrics (fractional time (A), mean dwell time (B), number of transitions (C), probability of the transitions (D)) differences between DR and HC groups. *P < 0.05, **P < 0.01, ***P < 0.001. Abbreviations: DR, diabetic retinopathy; HC, health control. |
Discussion
This study explored dynamic changes in large-scale brain networks in patients with DR using ICA with a sliding time window approach and k-means cluster analysis. The analysis identified five recurring states over time, with notable differences in dFNC between DR and healthy control groups in states 1 and 2. In these states, compared to healthy controls, DR group exhibited reduced functional connectivity within the VN and among the DAN and VN, paired with compensatory increases in connectivity between the DMN and VN, Central Network (CN) and VN, and DMN and Executive Control Network (ECN). Assessment of three dynamic time metrics revealed that DR patients, in comparison to healthy controls, displayed significantly reduced fraction of time and mean dwell time in state 1, and increased fraction of time and mean dwell time in state 3. These results provide valuable insights into the neural mechanisms underlying dynamic alterations in large-scale brain networks in individuals with DR.
In the cluster analysis we identified five states recurring over time, each with their own distinct dFNC patterns, which reflects the flexibility of functional coordination between brain networks. Significant differences in dFNC between the two groups were found in state 1 and state 2, which were mainly characterized by a decrease in functional connectivity within VN and between DAN-VN, along with a compensatory elevation of functional connectivity between DMN-VN, CN-VN and DMN-ECN. Patients with DR often have varying degrees of visual impairment or even blindness.35,36 This is primarily thought to be caused by microangiopathy and neurodegeneration of the retina. However, studies have shown similar neuronal abnormalities in the proximal and distal optic nerves and brain.37 Combined with the anatomical, physiologic, and embryologic similarities of the retinal vasculature to the cerebral vasculature, we suggest that the cause of visual impairment in patients with DR is not limited to these retinal lesions. The VN is located in the occipital lobe and includes brain regions such as the lingual gyrus, the fusiform gyrus, and the middle occipital gyrus, which are mainly responsible for the processing of visual information.38 DR patients were found to have significantly reduced occipital grey matter density (GMD).19 Yu et al showed that the functional connectivity between the left primary visual cortex (V1) and the cuneus/calcarine/precuneus was weakened in patients with DR, which may cause visual information processing abnormalities.39 Huang et al found large-scale neural network dysfunction in DR patients, including reduced FC within the VN, which was thought to be related to vision loss in DR patients.26 Weakened functional connectivity within the VN was also found in our previous studies of thyroid-associated ophthalmopathy and primary angle-closure glaucoma,40,41 and in conjunction with these findings, we hypothesized that reduced functional connectivity within the VN is associated with impaired visual acuity in patients with DR. This provides useful insights into the mechanisms of visual impairment in DR patients and is favorable to the preservation of vision in patients with DR. The DAN, which includes areas such as the intraparietal sulcus, the middle frontal gyrus, and the frontal eye fields, is responsible for attentional orienting and is also capable of allocating cognitive resources in response to stimuli.42,43 The DAN belongs to the high-level cognitive network, while the VN belongs to the low-level perceptual network. According to the previous inference, DR patients have abnormal visual function, and changes in visual information processing may cause cognitive impairment,44 which may be caused by reduced input of visual information and stimulation of higher-level cognitive networks. On the other hand, the processing of perceptual information requires the support of top-down attentional mechanisms,45,46 so the normal operation of visual function also requires the support of corresponding cognitive resources, otherwise it may lead to visual dysfunction. Combining these analyses, we suggest that functional connectivity between the DAN-VN is decreased in DR patients, which may lead to cognitive deficits and impaired visual function.
It has been found that spontaneous activity in the default mode network is negatively correlated with spontaneous activity in the attention network.47 Previously, we found a weakening of the functional connectivity between the DAN and the VN, while at the same time, we found an enhancement of the functional connectivity between the DMN and the VN. Therefore, we believe that the decrease in the input of visual information and the stimulation of the DAN led to the weakening of the spontaneous activity of the DAN, which caused the corresponding dysfunction. In contrast, the spontaneous activity of the DMN was enhanced, and the functional connectivity with the VN was also enhanced, compensating for the impairment of cognitive and visual functions through this compensatory mechanism. In the past, cerebellar function was mainly understood in terms of motor control, but current research has found that the CN plays an important role in multimodal integration, for example, it contains afferent fibers of the visual sensory system that convey rich visual information and direct visual attention.48 CN-VN functional connectivity is enhanced in DR patients, which may be a compensatory mechanism in order to maintain normal visual-motor functional integration in the presence of abnormal visual function. The ECN and DMN are active during task and off-task periods,49,50 respectively, and switch under the control of the salience network.51,52 Enhanced functional connectivity between the DMN and ECN may imply that the state of functional isolation between them has been disrupted and functional crosstalk is occurring, which is detrimental to the correct allocation of cognitive resources and may exacerbate cognitive impairment.53 It is worth noting that the above between-group differences in dFNC may be a potential neuroimaging indicator in patients with DR and may help in the diagnosis of DR.
For the three dynamic time metrics, the results showed a significant decrease in fraction of time and mean dwell time in state 1 and a significant increase in fraction of time and mean dwell time in state 3 in DR patients compared to healthy controls. By looking at the dynamic functional connectivity matrix diagram, we find that each of these five stable and repeatable states has its own characteristics. Among them, state 1 mainly exhibits stronger positive connectivity, especially stronger functional connectivity within VN and between DMN and VN. DR patients had significantly less fraction of time and mean dwell time in state 1, and this short dwell time may not be conducive to the functional interactions between the above networks,54 which may be one of the mechanisms causing visual and cognitive impairment in DR patients. State 3, on the other hand, mainly showed sparser functional connectivity. Inter-network functional connectivity reflects the ability of functional integration between different regions of the brain.55 Sparse functional connectivity often implies inefficient functional integration, which is not conducive to the synergistic performance of various higher cognitive functions by different brain regions,53,54 and may be one of the mechanisms of cognitive impairment in DR patients.
Several limitations are inherent in this study. First, the sample size of the study remains small and there is no comparative study of patients with different severities and stages of the disease, which limits the generalization of the findings to some extent. In the future, we will include larger sample sizes and study patients with varying degrees of disease severity. Secondly, the RSN values derived from blood oxygen level-dependent signals are susceptible to physiological noise, such as heartbeat and respiratory activity. Thirdly, our exploration was confined to the resting-state network extracted through ICA without considering the impacts of other brain networks. Lastly, while all participants were instructed to maintain a state of rest and minimal movement during the scanning procedure, complete assurance of compliance with these instructions could not be guaranteed.
Conclusions
In conclusion, our study illustrates the existence of a extensive altered dynamic functional network connectivity in patients with DR, which are mainly focused on the visual and higher cognitive networks and may be related to visual impairment and cognitive deficits in patients with DR. At the same time, dynamic temporal metrics were altered in DR patients in different brain states. These insights shed light on the neural mechanisms underlying the large-scale brain network alterations in DR patients and have positive implications for the diagnosis and treatment of the disease.
Data Sharing Statement
The raw data supporting the conclusions of this article will be made available. Further inquiries can be directly to the corresponding author.
Acknowledgments
We acknowledge the assistance provided by the Natural Science Foundation of Jiangxi Province (20212BAB216058), Jiangxi Provincial Health Technology Project (202210012, 202310114 and 202410008), and Jiangxi Provincial traditional Chinese Technology Project (2022B840 and 2023A0138).
Disclosure
The authors declare that they have no conflicts of interest with regard to this work.
References
1. Zimmet P, Alberti KG, Shaw J. Global and societal implications of the diabetes epidemic. Nature. 2001;414(6865):782–787. doi:10.1038/414782a
2. Chatterjee S, Khunti K, Davies MJ. Type 2 diabetes. Lancet. 2017;389(10085):2239–2251. doi:10.1016/S0140-6736(17)30058-2
3. Luo Y, Zhu J, Hu Z, et al. Progress in the pathogenesis of diabetic encephalopathy: the key role of neuroinflammation. Diabetes Metab Res Rev. 2024;40(6):e3841. doi:10.1002/dmrr.3841
4. Cheung N, Mitchell P, Wong TY. Diabetic retinopathy. Lancet. 2010;376(9735):124–136. doi:10.1016/S0140-6736(09)62124-3
5. Bahtiyar G, Gutterman D, Lebovitz H. Heart failure: a major cardiovascular complication of diabetes mellitus. Curr Diab Rep. 2016;16(11):116. doi:10.1007/s11892-016-0809-4
6. Młynarska E, Buławska D, Czarnik W, et al. Novel insights into diabetic kidney disease. Int J Mol Sci. 2024;25(18):10222. doi:10.3390/ijms251810222
7. Teo ZL, Tham YC, Yu M, et al. Global prevalence of diabetic retinopathy and projection of burden through 2045: systematic review and meta-analysis. Ophthalmology. 2021;128(11):1580–1591. doi:10.1016/j.ophtha.2021.04.027
8. Lin KY, Hsih WH, Lin YB, Wen CY, Chang TJ. Update in the epidemiology, risk factors, screening, and treatment of diabetic retinopathy. J Diabetes Investig. 2021;12(8):1322–1325. doi:10.1111/jdi.13480
9. Invernizzi A, Chhablani J, Viola F, Gabrielle PH, Zarranz-Ventura J, Staurenghi G. Diabetic retinopathy in the pediatric population: pathophysiology, screening, current and future treatments. Pharmacol Res. 2023;188:106670. doi:10.1016/j.phrs.2023.106670
10. Sinclair SH, Schwartz S. Diabetic retinopathy: new concepts of screening, monitoring, and interventions. Surv Ophthalmol. 2024;69(6):882–892. doi:10.1016/j.survophthal.2024.07.001
11. Wang W, Lo ACY. Diabetic retinopathy: pathophysiology and treatments. Int J Mol Sci. 2018;19(6):1816. doi:10.3390/ijms19061816
12. Kwa VIH, van der Sande JJ, Stam J, Tijmes N, Vrooland JL, Amsterdam Vascular Medicine Group. Retinal arterial changes correlate with cerebral small-vessel disease. Neurology. 2002;59(10):1536–1540. doi:10.1212/01.wnl.0000033093.16450.5c
13. Usuelli V, La Rocca E. Novel therapeutic approaches for diabetic nephropathy and retinopathy. Pharmacol Res. 2015;98:39–44. doi:10.1016/j.phrs.2014.10.003
14. Sundstrom JM, Hernández C, Weber SR, et al. Proteomic analysis of early diabetic retinopathy reveals mediators of neurodegenerative brain diseases. Invest Ophthalmol Vis Sci. 2018;59(6):2264–2274. doi:10.1167/iovs.17-23678
15. Kong FJ, Ma LL, Guo JJ, Xu LH, Li Y, Qu S. Endoplasmic reticulum stress/autophagy pathway is involved in diabetes-induced neuronal apoptosis and cognitive decline in mice. Clin Sci. 2018;132(1):111–125. doi:10.1042/CS20171432
16. Crosby-Nwaobi RR, Sivaprasad S, Amiel S, Forbes A. The relationship between diabetic retinopathy and cognitive impairment. Diabetes Care. 2013;36(10):3177–3186. doi:10.2337/dc12-2141
17. Hugenschmidt CE, Lovato JF, Ambrosius WT, et al. The cross-sectional and longitudinal associations of diabetic retinopathy with cognitive function and brain MRI findings: the action to control cardiovascular risk in diabetes (ACCORD) trial. Diabetes Care. 2014;37(12):3244–3252. doi:10.2337/dc14-0502
18. Wang Z, Lu Z, Li J, et al. Evaluation of apparent diffusion coefficient measurements of brain injury in type 2 diabetics with retinopathy by diffusion-weighted MRI at 3.0 T. Neuroreport. 2017;28(2):69–74. doi:10.1097/WNR.0000000000000703
19. Wessels AM, Simsek S, Remijnse PL, et al. Voxel-based morphometry demonstrates reduced grey matter density on brain MRI in patients with diabetic retinopathy. Diabetologia. 2006;49(10):2474–2480. doi:10.1007/s00125-006-0283-7
20. van Duinkerken E, Ijzerman RG, Klein M, et al. Disrupted subject-specific gray matter network properties and cognitive dysfunction in type 1 diabetes patients with and without proliferative retinopathy. Hum Brain Mapp. 2016;37(3):1194–1208. doi:10.1002/hbm.23096
21. Qi CX, Huang X, Shen Y. Altered intrinsic brain activities in patients with diabetic retinopathy using amplitude of low-frequency fluctuation: a resting-state fMRI study. Diabetes Metab Syndr Obes. 2020;13:2833–2842. doi:10.2147/DMSO.S259476
22. Shi WQ, Zhang MX, Tang LY, et al. Altered spontaneous brain activity patterns in patients with diabetic retinopathy using amplitude of low-frequency fluctuation. World J Diabetes. 2022;13(2):97–109. doi:10.4239/wjd.v13.i2.97
23. Liao XL, Yuan Q, Shi WQ, et al. altered brain activity in patients with diabetic retinopathy using regional homogeneity: a resting-state FMRI study. Endocr Pract. 2019;25(4):320–327. doi:10.4158/EP-2018-0517
24. Wan S, Xia WQ, Zhong YL. Aberrant interhemispheric functional connectivity in diabetic retinopathy patients. Front Neurosci. 2021;15:792264. doi:10.3389/fnins.2021.792264
25. Huang X, Tong Y, Qi CX, Xu YT, Dan HD, Shen Y. Disrupted topological organization of human brain connectome in diabetic retinopathy patients. Neuropsychiatr Dis Treat. 2019;15:2487–2502. doi:10.2147/NDT.S214325
26. Huang X, Tong Y, Qi CX, Dan HD, Deng QQ, Shen Y. Large-scale neuronal network dysfunction in diabetic retinopathy. Neural Plast. 2020;2020:6872508. doi:10.1155/2020/6872508
27. Damaraju E, Allen EA, Belger A, et al. Dynamic functional connectivity analysis reveals transient states of dysconnectivity in schizophrenia. Neuroimage Clin. 2014;5:298–308. doi:10.1016/j.nicl.2014.07.003
28. Liégeois R, Laumann TO, Snyder AZ, Zhou J, Yeo BTT. Interpreting temporal fluctuations in resting-state functional connectivity MRI. Neuroimage. 2017;163:437–455. doi:10.1016/j.neuroimage.2017.09.012
29. Hutchison RM, Womelsdorf T, Allen EA, et al. Dynamic functional connectivity: promise, issues, and interpretations. Neuroimage. 2013;80:360–378. doi:10.1016/j.neuroimage.2013.05.079
30. Yan CG, Wang XD, Zuo XN, Zang YF. DPABI: data processing & analysis for (resting-state) brain imaging. Neuroinformatics. 2016;14(3):339–351. doi:10.1007/s12021-016-9299-4
31. Van Dijk KRA, Sabuncu MR, Buckner RL. The influence of head motion on intrinsic functional connectivity MRI. Neuroimage. 2012;59(1):431–438. doi:10.1016/j.neuroimage.2011.07.044
32. Zuo XN, Kelly C, Adelstein JS, Klein DF, Castellanos FX, Milham MP. Reliable intrinsic connectivity networks: test-retest evaluation using ICA and dual regression approach. Neuroimage. 2010;49(3):2163–2177. doi:10.1016/j.neuroimage.2009.10.080
33. Shirer WR, Ryali S, Rykhlevskaia E, Menon V, Greicius MD. Decoding subject-driven cognitive states with whole-brain connectivity patterns. Cereb Cortex. 2012;22(1):158–165. doi:10.1093/cercor/bhr099
34. Wang D, Qin W, Liu Y, Zhang Y, Jiang T, Yu C. Altered resting-state network connectivity in congenital blind. Hum Brain Mapp. 2014;35(6):2573–2581. doi:10.1002/hbm.22350
35. Das T. Blindness and visual impairment profile and rapid assessment of avoidable blindness in south east asia: analysis of new data. 2017 APAO holmes lecture. Asia Pac J Ophthalmol. 2018;7(5):312–315. doi:10.22608/APO.2017425
36. Broadhead GK, Hong T, Bahrami B, Flood V, Liew G, Chang AA. Diet and risk of visual impairment: a review of dietary factors and risk of common causes of visual impairment. Nutr Rev. 2021;79(6):636–650. doi:10.1093/nutrit/nuaa100
37. Mendonca HR, Carpi-Santos R, da Costa Calaza K, Blanco Martinez AM. Neuroinflammation and oxidative stress act in concert to promote neurodegeneration in the diabetic retina and optic nerve: galectin-3 participation. Neural Regen Res. 2020;15(4):625–635. doi:10.4103/1673-5374.266910
38. Zhang G, Qi B, Li H, et al. A longitudinal multimodal MRI study of the visual network in postoperative delirium. Brain Imaging Behav. 2024;18(6):1394–1406. doi:10.1007/s11682-024-00929-z
39. Yu Y, Lan DY, Tang LY, et al. Intrinsic functional connectivity alterations of the primary visual cortex in patients with proliferative diabetic retinopathy: a seed-based resting-state fMRI study. Ther Adv Endocrinol Metab. 2020;11:2042018820960296. doi:10.1177/2042018820960296
40. Liu H, Zhong YL, Huang X. Specific static and dynamic functional network connectivity changes in thyroid-associated ophthalmopathy and it predictive values using machine learning. Front Neurosci. 2024;18:1429084. doi:10.3389/fnins.2024.1429084
41. Zhong YL, Liu H, Huang X. Altered dynamic large-scale brain networks and combined machine learning in primary angle-closure glaucoma. Neuroscience. 2024;558:11–21. doi:10.1016/j.neuroscience.2024.08.013
42. Spadone S, Wyczesany M, Della Penna S, Corbetta M, Capotosto P. Directed flow of beta band communication during reorienting of attention within the dorsal attention network. Brain Connect. 2021;11(9):717–724. doi:10.1089/brain.2020.0885
43. Proskovec AL, Heinrichs-Graham E, Wiesman AI, McDermott TJ, Wilson TW. Oscillatory dynamics in the dorsal and ventral attention networks during the reorienting of attention. Hum Brain Mapp. 2018;39(5):2177–2190. doi:10.1002/hbm.23997
44. Yener GG, Emek-Savaş DD, Güntekin B, Başar E. The visual cognitive network, but not the visual sensory network, is affected in amnestic mild cognitive impairment: a study of brain oscillatory responses. Brain Res. 2014;1585:141–149. doi:10.1016/j.brainres.2014.08.038
45. Dijkstra N, Zeidman P, Ondobaka S, van Gerven MA, Friston K. Distinct top-down and bottom-up brain connectivity during visual perception and imagery. Sci Rep. 2017;7(1):5677. doi:10.1038/s41598-017-05888-8
46. Bi Z, Li H, Tian L. Top-down generation of low-resolution representations improves visual perception and imagination. Neural Network. 2024;171:440–456. doi:10.1016/j.neunet.2023.12.030
47. Esposito R, Cieri F, Chiacchiaretta P, et al. Modifications in resting state functional anticorrelation between default mode network and dorsal attention network: comparison among young adults, healthy elders and mild cognitive impairment patients. Brain Imaging Behav. 2018;12(1):127–141. doi:10.1007/s11682-017-9686-y
48. Xiao L, Scheiffele P. Local and long-range circuit elements for cerebellar function. Curr Opin Neurobiol. 2018;48:146–152. doi:10.1016/j.conb.2017.12.016
49. Sormaz M, Murphy C, Wang HT, et al. Default mode network can support the level of detail in experience during active task states. Proc Natl Acad Sci USA. 2018;115(37):9318–9323. doi:10.1073/pnas.1721259115
50. Hemington KS, Wu Q, Kucyi A, Inman RD, Davis KD. Abnormal cross-network functional connectivity in chronic pain and its association with clinical symptoms. Brain Struct Funct. 2016;221(8):4203–4219. doi:10.1007/s00429-015-1161-1
51. Menon V. Large-scale brain networks and psychopathology: a unifying triple network model. Trends Cognit Sci. 2011;15(10):483–506. doi:10.1016/j.tics.2011.08.003
52. Goulden N, Khusnulina A, Davis NJ, et al. The salience network is responsible for switching between the default mode network and the central executive network: replication from DCM. Neuroimage. 2014;99:180–190. doi:10.1016/j.neuroimage.2014.05.052
53. Tang F, Li L, Peng D, et al. Abnormal static and dynamic functional network connectivity in stable chronic obstructive pulmonary disease. Front Aging Neurosci. 2022;14:1009232. doi:10.3389/fnagi.2022.1009232
54. Xing C, Chen YC, Shang S, et al. Abnormal static and dynamic functional network connectivity in patients with presbycusis. Front Aging Neurosci. 2021;13:774901. doi:10.3389/fnagi.2021.774901
55. Yang B, Wang M, Zhou W, et al. Disrupted network integration and segregation involving the default mode network in autism spectrum disorder. J Affect Disord. 2023;323:309–319. doi:10.1016/j.jad.2022.11.083
 © 2025 The Author(s). This work is published and licensed by Dove Medical Press Limited. The
full terms of this license are available at https://www.dovepress.com/terms
and incorporate the Creative Commons Attribution
- Non Commercial (unported, 4.0) License.
By accessing the work you hereby accept the Terms. Non-commercial uses of the work are permitted
without any further permission from Dove Medical Press Limited, provided the work is properly
attributed. For permission for commercial use of this work, please see paragraphs 4.2 and 5 of our Terms.
© 2025 The Author(s). This work is published and licensed by Dove Medical Press Limited. The
full terms of this license are available at https://www.dovepress.com/terms
and incorporate the Creative Commons Attribution
- Non Commercial (unported, 4.0) License.
By accessing the work you hereby accept the Terms. Non-commercial uses of the work are permitted
without any further permission from Dove Medical Press Limited, provided the work is properly
attributed. For permission for commercial use of this work, please see paragraphs 4.2 and 5 of our Terms.