Back to Journals » Diabetes, Metabolic Syndrome and Obesity » Volume 19
Extended Oral Glucose Tolerance Test Unmasks Intermediate Metabolic Phenotypes in Polycystic Ovary Syndrome
Received 15 January 2026
Accepted for publication 28 February 2026
Published 7 March 2026 Volume 2026:19 593979
DOI https://doi.org/10.2147/DMSO.S593979
Checked for plagiarism Yes
Review by Single anonymous peer review
Peer reviewer comments 2
Editor who approved publication: Professor Jae Woong Sull
Sanhu Wang,1 Xiqiang Gao,2 Fuxing Li1
1Department of Clinical Laboratory, Hunan University of Medicine General Hospital, Huaihua, Hunan, People’s Republic of China; 2Department of Reproductive Medicine, Hunan University of Medicine General Hospital, Huaihua, Hunan, People’s Republic of China
Correspondence: Xiqiang Gao, Department of Reproductive Medicine, Hunan University of Medicine General Hospital, No. 144, Jinxi South Road, Hecheng District, Huaihua, Hunan, 418000, People’s Republic of China, Tel +8618774795544, Email [email protected] Fuxing Li, Department of Clinical Laboratory, Hunan University of Medicine General Hospital, No. 144, Jinxi South Road, Hecheng District, Huaihua, Hunan, 418000, People’s Republic of China, Tel +8618874242328, Email [email protected]
Objective: This study aims to investigate the efficacy of an extended oral glucose tolerance test (OGTT) incorporating 1- and 3-h time points in detecting early, heterogeneous glycemic phenotypes in polycystic ovary syndrome (PCOS).
Methods: In this cross-sectional study, 103 treatment-naive patients with PCOS underwent a 75-g OGTT with measurements of glucose and insulin taken at 0, 1, 2, and 3 h. Participants were stratified into four groups: normal control, isolated 1-h glucose elevation (1-h plasma glucose [PG] ≥ 8.6 mmol/L), isolated 3-h glucose elevation (3-h PG > 6.1 mmol/L), and dysglycemia defined by conventional criteria. Comprehensive metabolic and endocrine profiles were evaluated and compared.
Results: Two distinct early glycemic phenotypes were identified: isolated 1-h glucose elevation (13.6%, 14/103) and isolated 3-h glucose elevation (20.4%, 21/103). The isolated 3-h elevation group exhibited an intermediate phenotype characterized by significant central adiposity, hyperandrogenism, and menstrual irregularities, despite systemic insulin resistance (IR) levels comparable to those of the normoglycemic group. Conversely, the isolated 1-h elevation group exhibited transient hyperinsulinemic hyperglycemia and elevated low-density lipoprotein cholesterol (LDL-C) levels. Both phenotypes were undetected by standard glycemic criteria.
Conclusion: An extended OGTT reveals two prevalent yet distinct early glycemic phenotypes in PCOS, suggesting heterogeneous pathophysiological pathways that may inform dynamic, phenotype-stratified assessment for risk stratification and targeted intervention. However, clinical implementation requires validation through prospective studies.
Keywords: Polycystic ovary syndrome, PCOS, Oral glucose tolerance test, OGTT, 1-h postprandial glucose, 3-h postprandial glucose, Insulin resistance, IR, metabolic phenotype heterogeneity
Introduction
Polycystic ovary syndrome (PCOS) represents one of the most prevalent endocrine disorders affecting women of reproductive age.1,2 It is strongly associated with significant metabolic risks, including insulin resistance (IR) and type 2 diabetes mellitus (T2DM).3 The clinical presentation of PCOS frequently encompasses features of metabolic syndrome, such as obesity, dyslipidemia, and notably, IR, which collectively elevate the risk of cardiovascular disease.4
Consequently, prompt assessment and intervention regarding glucose metabolism are critical in PCOS management. IR is highly prevalent in women with PCOS (affecting 50%–75%) and serves as a fundamental contributor to progressive glycemic decline.5,6 Robust evidence confirms that patients with PCOS exhibit significantly higher incidence and greater risks of progression from prediabetes to T2DM compared to non-PCOS individuals without PCOS.7 Notably, individuals with initially normal glucose tolerance still encounter a substantially elevated lifetime risk of developing T2DM.8 Consequently, international and national guidelines explicitly recognize PCOS as a high-risk factor for diabetes and advocate for regular screening.9,10
However, current screening methods primarily rely on fasting plasma glucose (FPG) and 2-h postprandial glucose (2-h PG) measurements obtained during an oral glucose tolerance test (OGTT), as recommended by major clinical guidelines. While FPG exhibits high specificity, its sensitivity remains limited, leading to significant underdiagnosis of PCOS; studies report that relying solely on FPG may miss up to 40% of patients with dysglycemia detected by OGTT.11,12 Furthermore, hemoglobin A1c has insufficient sensitivity for detecting prediabetes in this population and is not recommended as a sole screening tool.13 Despite the recognized superiority of OGTT over FPG, standard practice guidelines, even when recommending OGTT, frequently emphasize only FPG and 2-h PG values. Emerging evidence suggests that in some individuals with IR or early β-cell dysfunction, glycemic dysregulation may encompass alterations in the late postprandial phase.14 Critically, it is established that in individuals with normal glucose metabolism, PG levels typically return to the fasting range within 3 h after a glucose load.15 This well-established physiological norm raises a pivotal yet inadequately explored question regarding PCOS: Does a delayed return to normoglycemia at 3 h represent an early, specific marker of dysglycemia risk within this high-risk population? Therefore, investigating complementary markers that enable earlier, more sensitive risk detection is of considerable value for enhancing the metabolic risk assessment framework in PCOS.
Based on the aforementioned limitations of current screening practices and our clinical observation of frequent glucose dysregulation at non-standard time points during OGTT in women with PCOS, this study aims to systematically identify and characterize distinct early glycemic phenotypes, with a focus on subgroups defined by isolated glucose elevations at the 1-h (P1PG) or 3-h (P3PG) time point. By analyzing complete OGTT data (0, 1, 2, and 3 h) from newly diagnosed, treatment-naive PCOS patients, we evaluated the prevalence of these phenotypes, their association with conventional glycemic categories, and their related clinical-metabolic profiles. This work seeks to provide an empirical foundation for refining the metabolic risk assessment framework in PCOS by uncovering heterogeneous early pathways in the dysglycemia spectrum.
Material and Methods
Study Design and Ethics
This cross-sectional, observational study was conducted at the Reproductive Medicine Department of Hunan University of Medicine General Hospital. Participants were recruited from women with PCOS who visited the clinic between May 2021 and December 2023. The study protocol adhered to the principles of the Declaration of Helsinki and was reviewed and approved by the Ethics Committee of Hunan University of Medicine General Hospital (Approval No. Kuai-KY-2020070101). Each participant provided written informed consent after being fully informed of the study details.
Study Participants
Between May 2021 and December 2023, 217 consecutive adult women with suspected PCOS were initially examined at our center. PCOS diagnosis was confirmed according to the Rotterdam criteria, as illustrated in Figure 1. Briefly, participants were required to meet at least two of the three key features (oligoanovulation, hyperandrogenism, or polycystic ovarian morphology) after exclusion of other related endocrine disorders. A final cohort of 103 women with confirmed, newly diagnosed PCOS was included in the present cross-sectional analysis after applying the exclusion criteria, which included not meeting the full diagnostic criteria (n = 9), incomplete 3-h OGTT (n = 75), missing critical anthropometric data (n = 25), and pregnancy (n = 5). Every participant in the study was treatment-naive regarding medications that affect glucose or insulin metabolism.
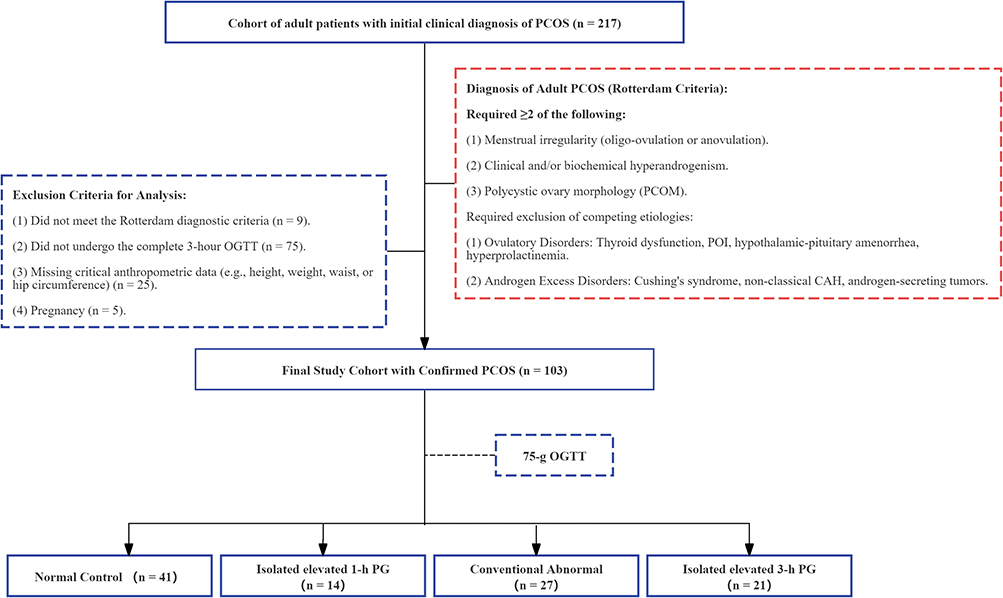 |
Figure 1 Flowchart illustrating the patient recruitment process and the study cohort’s inclusion and exclusion criteria. |
The final sample size of 103 was determined by the availability of eligible, treatment-naive patients with complete 3-h OGTT data during the study period, which was deemed sufficient for preliminary phenotypic characterization and cross-sectional comparisons.
Data Collection, Measurements, and Laboratory Assays
Clinical and Anthropometric Data
Basic information (age, sex, and history of hypertension) and menstrual history were obtained from electronic medical records. Clinical hyperandrogenism (hirsutism and acne) was assessed via standardized questionnaires and medical records. Anthropometric measurements were performed by trained staff using calibrated equipment, including height to the nearest 0.1 cm, weight to the nearest 0.1 kg, waist circumference (the distance between the lower rib margin and the iliac crest), and hip circumference (at the widest part of the hips). Body mass index, waist-to-hip ratio, and waist-to-height ratio were computed.
Blood Sampling and Laboratory Tests
All blood samples were collected after an overnight fast of at least 8 h, between days 2–5 of a natural or induced menstrual cycle.
Complete Blood Count and D-dimer: Data for the complete blood count (white blood cell count, neutrophil percentage, and mean platelet volume) were obtained using a Sysmex XN-9000 automated hematology analyzer. D-dimer levels were determined on a Sysmex automated coagulation analyzer. These data were retrieved directly from the Laboratory Information System (LIS).
Biochemical and Metabolic Parameters: Data about alanine aminotransferase, aspartate aminotransferase, total cholesterol, triglycerides, high-density lipoprotein cholesterol, LDL-C, and homocysteine—all standard clinical tests—were retrieved from the LIS. These assays were performed on a Beckman AU5800 automated biochemical analyzer.
Hormonal Profiles: Serum levels of luteinizing hormone, follicle-stimulating hormone, total testosterone, estradiol, progesterone, prolactin, and thyroid-stimulating hormone were measured using electrochemiluminescence immunoassays performed on a Roche Cobas e601 automated analyzer.
OGTT and Insulin Release Test
Following a 10–12 h overnight fast, participants consumed a 75-g anhydrous glucose load. Venous blood samples were drawn at fasting (0 h) and 1, 2, and 3 h post-load. PG levels were measured using the glucose oxidase assay method (Beckman AU5800). Corresponding serum insulin levels were determined by electrochemiluminescence immunoassay (Roche Cobas e601).
Definitions and Calculations
PCOS Phenotype Classification
Based on the Rotterdam criteria and utilizing the collected clinical and biochemical data, participants were classified into four phenotypes for subgroup analysis:16 Phenotype A (Classic): Oligo-/anovulation + hyperandrogenism + polycystic ovarian morphology. Phenotype B (Ovulatory): Hyperandrogenism + polycystic ovarian morphology. Phenotype C (Non-hyperandrogenic): Oligo-/anovulation + polycystic ovarian morphology. Phenotype D (Mild): Oligo-/anovulation + polycystic ovarian morphology (in the absence of hyperandrogenism by current criteria).
Glycemic Status and Study Subgroup Definitions
Glycemic status was first classified according to conventional criteria based on FPG and 2-h postprandial glucose (2-h PG), with reference to the Chinese guidelines for T2DM prevention and treatment (2020 edition).9,10 Specifically, DM was defined as FPG ≥ 7.0 mmol/L and/or 2-h PG ≥ 11.1 mmol/L; impaired glucose tolerance (IGT) as 2-h PG between 7.8 and 11.0 mmol/L; impaired fasting glucose (IFG) as FPG between 6.1 and 6.9 mmol/L. Participants meeting the criteria for IFG, IGT, or DM were collectively categorized as having conventional abnormal glucose metabolism.
For reference,17 emerging research suggests potential clinical utility of 1-h glucose levels during OGTT, with proposed cut-offs such as 1-h PG ≥ 8.6 mmol/L for identifying intermediate hyperglycemia risk and ≥ 11.6 mmol/L for indicating probable diabetes.
For the specific purpose of this study, participants were further stratified into four mutually exclusive subgroups based on their complete OGTT (0, 1, 2, and 3 h) profiles: (1) Normal control: normal glucose tolerance at all four time points (FPG, 1-h PG, 2-h PG, and 3h-PG); (2) isolated elevated 1-h PG: 1-h PG ≥ 8.6 mmol/L with normal FPG, 2-h PG, and 3-h PG;17 (3) isolated elevated 3-h PG: 3-h PG > 6.1 mmol/L with normal FPG, 1-h PG, and 2-h PG. This threshold was chosen based on the physiological principle that plasma glucose typically returns to fasting levels within 3 h after a glucose load.15 However, it is important to note that this cutoff is hypothesis-generating and, unlike the 1-h PG threshold (≥ 8.6 mmol/L), has not been validated by consensus guidelines or prospective outcome data. We therefore refer to this group as an “elevated 3-h PG phenotype” rather than an “abnormality” to reflect its exploratory nature.
Homeostatic Model Assessment of IR (HOMA-IR)
IR was estimated using the formula: HOMA-IR = [Fasting Insulin (μIU/mL) × Fasting Glucose (mmol/L)]/22.5.
Statistical Analysis
Continuous variables are presented as mean ± standard deviation when normally distributed, or as median (interquartile range) when not. Categorical variables are expressed by numerical values (percentages). Normality was assessed using the Shapiro–Wilk test. The primary statistical comparisons were conducted among the four main subgroups: standard control, isolated elevated 1-h PG, isolated elevated 3-h PG, and conventional abnormal. Group differences in continuous variables were analyzed using one-way analysis of variance or the Kruskal–Wallis H-test, as applicable. For categorical variables, either the Chi-square test or Fisher’s exact test was employed. When a significant overall difference was detected (P < 0.05), post-hoc pairwise comparisons were performed. For parametric data, the Bonferroni correction was applied. For non-parametric data, pairwise comparisons were conducted using Dunn’s procedure with a Bonferroni-adjusted significance level. A two-sided P-value < 0.05 was considered statistically significant. All analyses were conducted using Statistical Package for the Social Sciences software (version 25.0; IBM Corp., Armonk, NY, USA).
Results
Baseline Characteristics of the Study Cohort
A total of 103 adult women diagnosed with PCOS were incorporated in this study (Table 1). The cohort presented characteristic metabolic and endocrine features of PCOS, characterized by a high prevalence of overweight or obesity and central adiposity. The median age was 27.0 years, with a median body mass index of 24.56 kg/m2 and a median waist-to-height ratio of 0.53. Endocrinological disturbances were prevalent, as evidenced by irregular menstruation in 83.5% of patients and a median total testosterone level of 0.34 ng/mL. Significant IR (median HOMA-IR: 3.32) and dyslipidemia (median triglycerides: 1.40 mmol/L) were also identified.
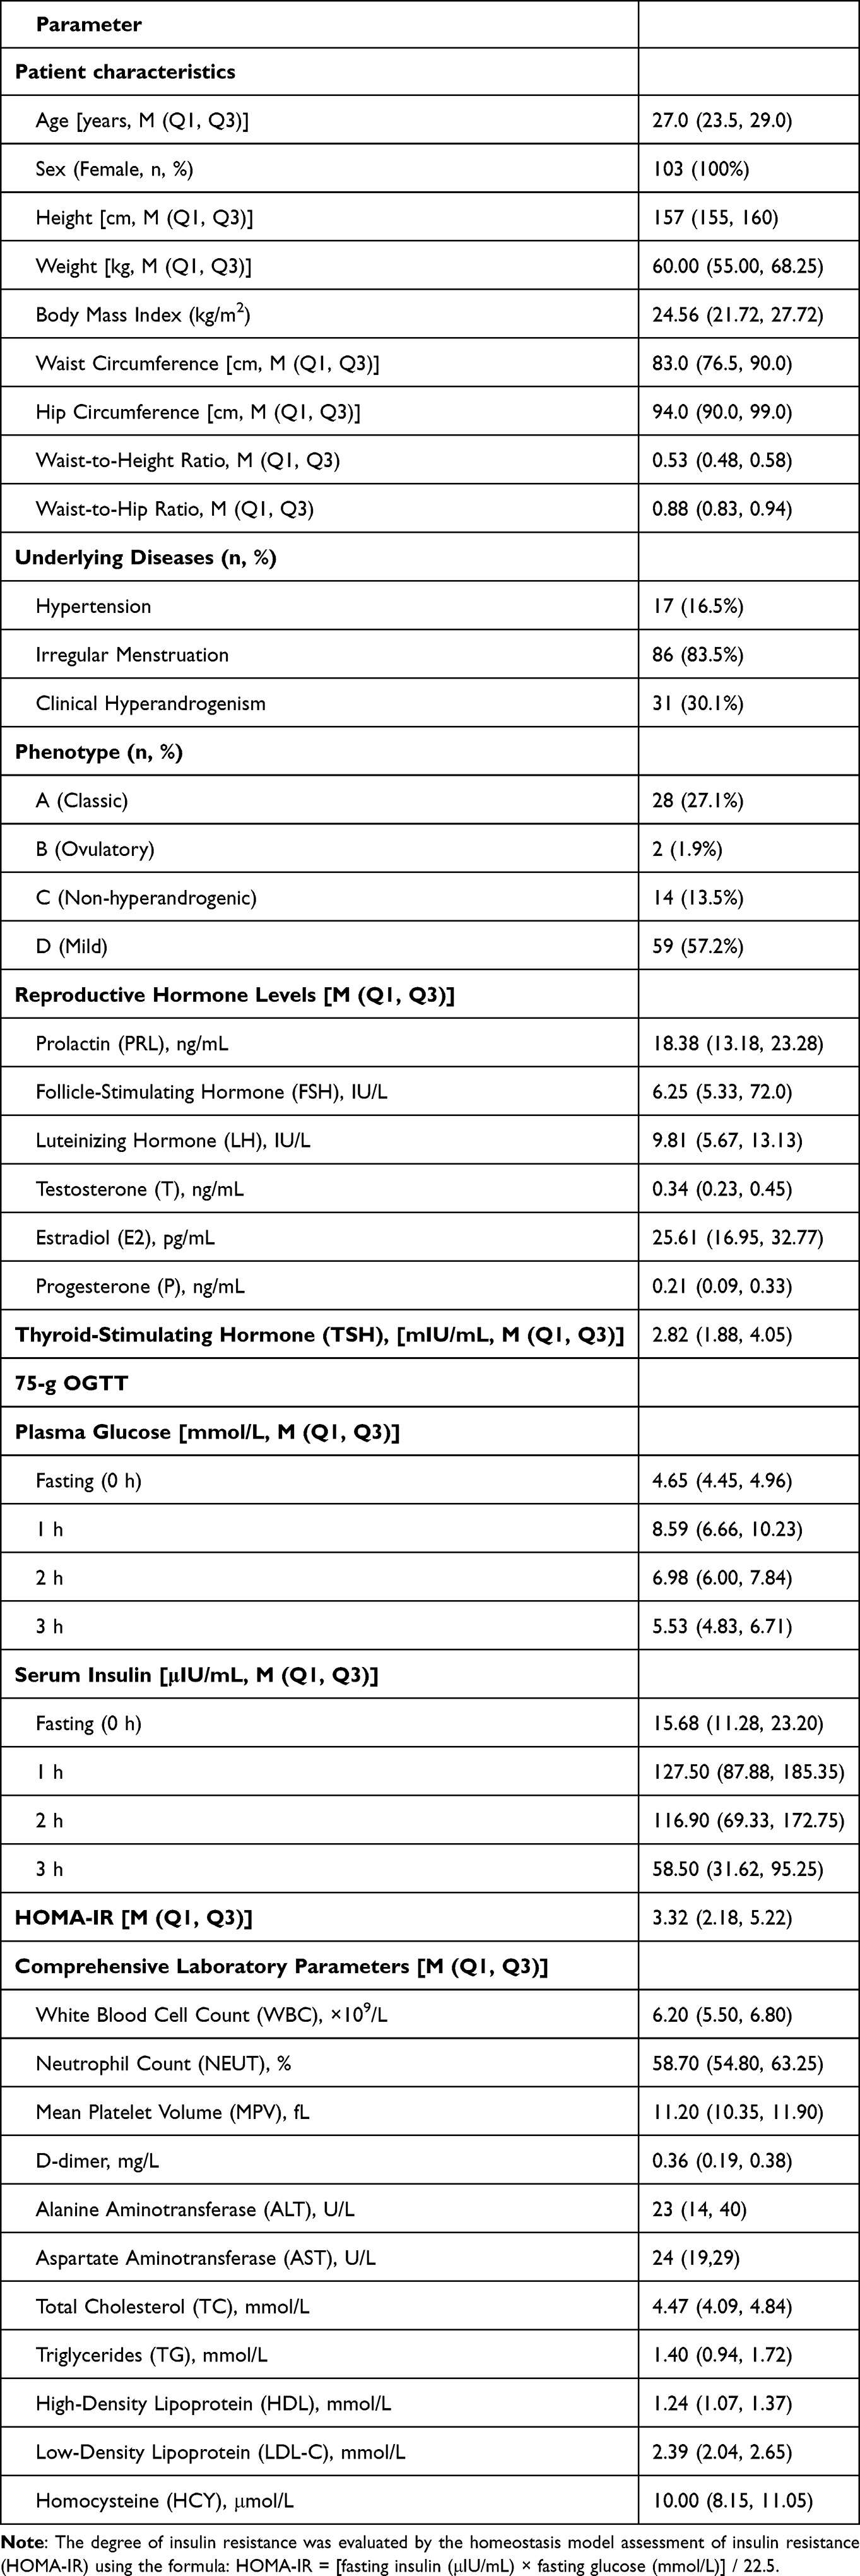 |
Table 1 Baseline Clinical Characteristics of the 103 Patients with Polycystic Ovary Syndrome |
Glucose Metabolism Status Based on 75-g OGTT
The comprehensive categorization of glucose metabolism status at each time point of the 75-g OGTT is presented in Table 2. According to standard criteria, most patients (97.2%) exhibited normal FPG. However, challenges in glucose homeostasis became evident post-glucose load. At 1 h, a considerable proportion of patients fell into the intermediate hyperglycemia (36.9%) or diabetic range (12.6%). By the 2-h time point, the prevalence in the diabetic range decreased to 5.8%. Notably, 37.8% of patients exhibited hyperglycemia (3-h PG > 6.1 mmol/L) at the 3-h time point, while a small subgroup (4.9%) experienced hypoglycemia (3-h PG < 3.89 mmol/L).
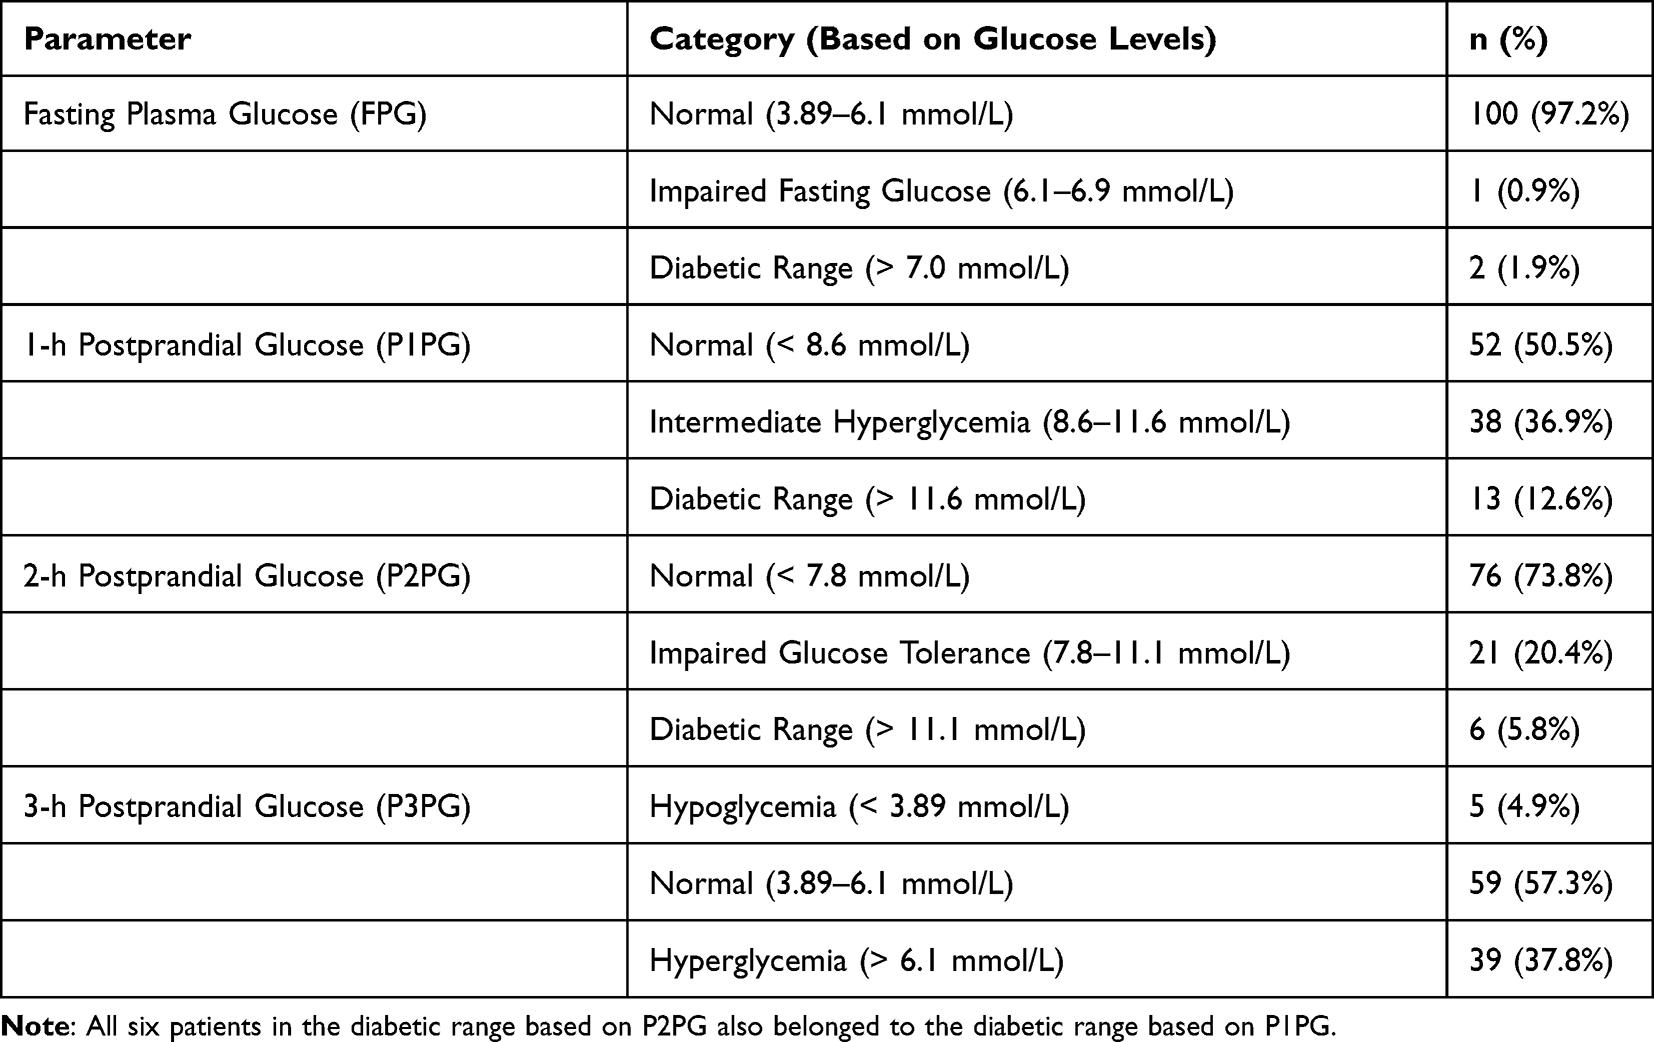 |
Table 2 Blood Glucose Levels During 75-g Oral Glucose Tolerance Test in 103 Patients with Polycystic Ovary Syndrome |
Stratification Based on Comprehensive OGTT and Associated Clinical Features
Based on their complete OGTT profiles, 103 patients were categorized into four mutually exclusive subgroups (see Methods for detailed criteria): Normal control (n = 41, 39.8%), isolated elevated 1-h PG (n = 14, 13.6%), isolated elevated 3-h PG (n = 21, 20.4%), and conventional abnormal (n = 27, 26.2%).
The conventional abnormal group exhibited the most pronounced metabolic disturbances. Compared with the control group, they were significantly older and exhibited elevated adiposity, IR, liver enzymes, and atherogenic lipids (Table 3). Conversely, the isolated elevated 3-h PG group displayed an intermediate phenotype. Although sharing comparable overall adiposity and systemic IR to the normal control group, this subgroup had already developed significantly greater central adiposity (waist-to-height ratio), a higher prevalence of irregular menstruation, and elevated testosterone levels (Table 3). Notably, the extent of central adiposity was comparable between the isolated elevated 3-h PG and conventional abnormal groups, and both were significantly greater than in the standard control and isolated elevated 1-h PG groups.
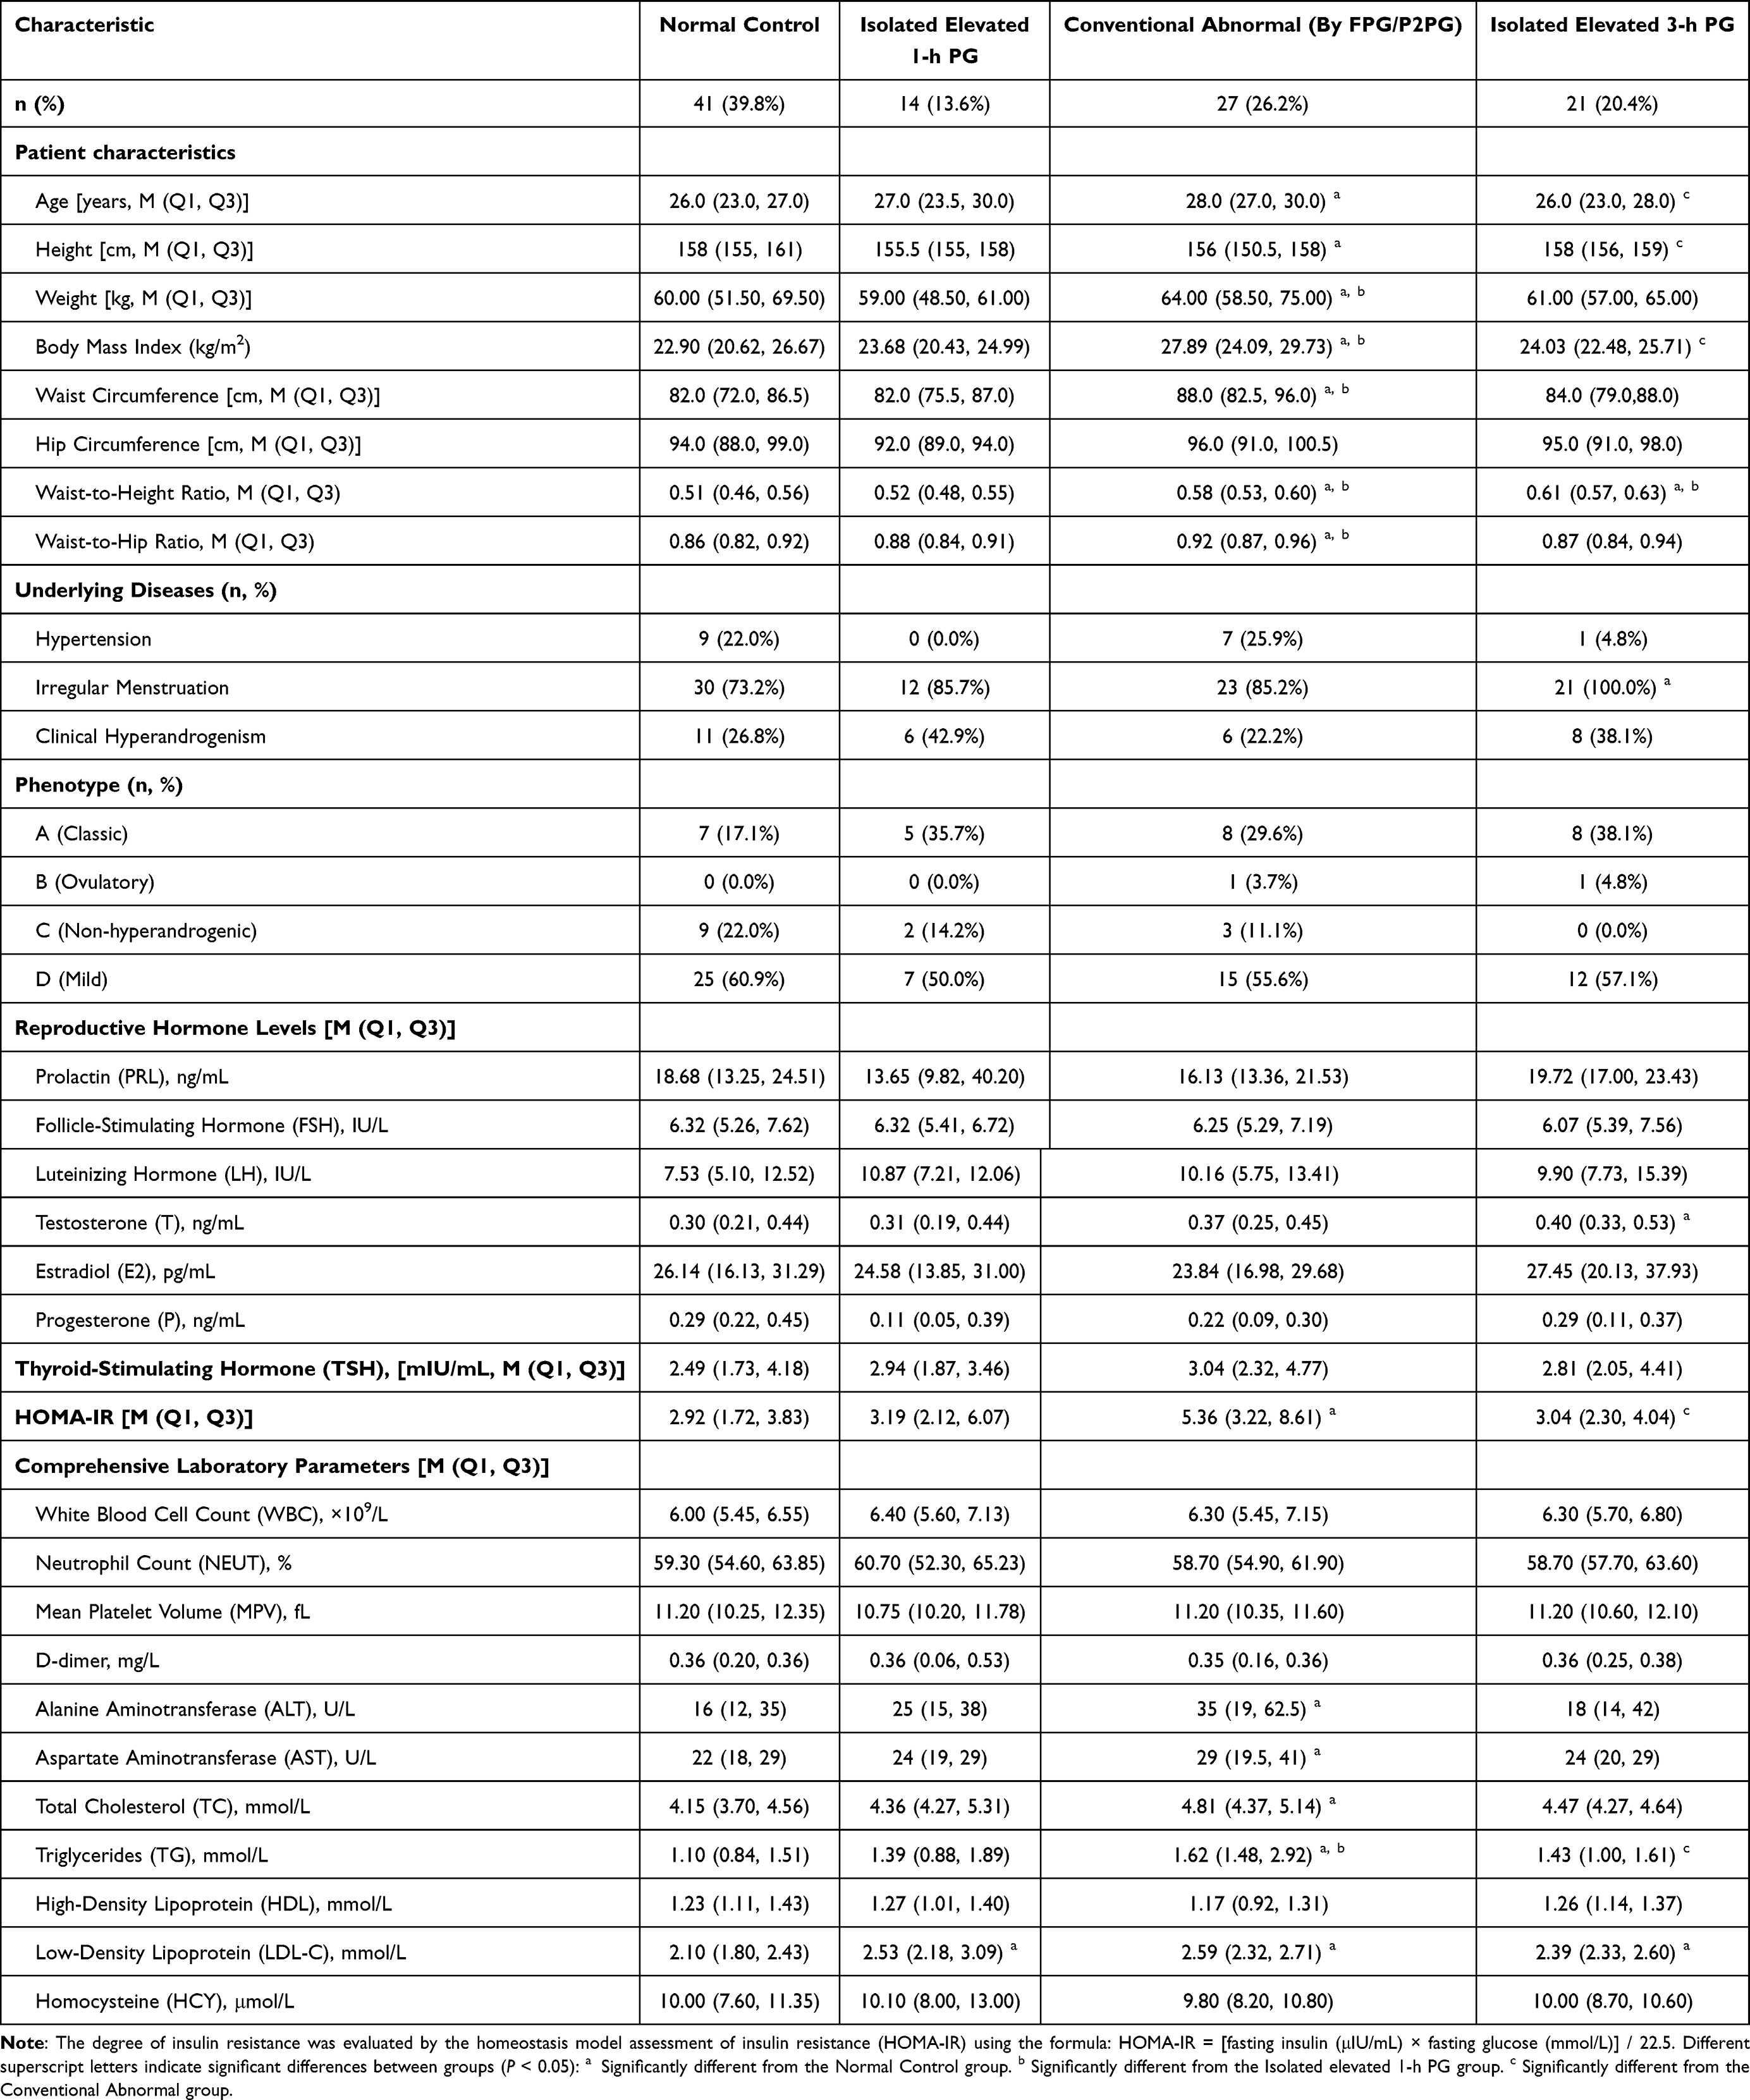 |
Table 3 Clinical Characteristics of PCOS Patients Stratified by Distinct OGTT Patterns |
The isolated elevated 1-h PG group, defined by an elevated 1-h glucose alone, exhibited a more limited metabolic perturbation. Its primary distinguishing feature compared to the normal control group was elevated LDL-C. However, it demonstrated significantly less severe central adiposity (waist-to-height ratio) and lower triglyceride levels as compared to the conventional abnormal group, and less severe central adiposity compared to the isolated elevated 3-h PG group (Table 3).
The glycemic and insulin profiles across the four subgroups are delineated in Figure 2. For glucose (Figure 2A), the isolated elevated 3-h PG group exhibited an intermediate trajectory, characterized by a significantly elevated 3-h level comparable to that of the conventional abnormal group. The isolated elevated 1-h PG group demonstrated early elevations (0–2 h) that normalized by 3 h. Insulin dynamics (Figure 2B) were predominantly concordant. The isolated elevated 3-h PG group displayed a specific 3-h elevation, whereas the isolated elevated 1-h PG group exhibited transient hyperinsulinemia at 1–2 h. The conventional abnormal group demonstrated sustained hyperinsulinemia across all time points. Notably, the isolated elevated 3-h PG group exhibited significantly lower fasting and 2-h insulin levels than the conventional abnormal group. The continuous dynamic curves of glucose and insulin secretion throughout the OGTT are depicted in Figure 3.
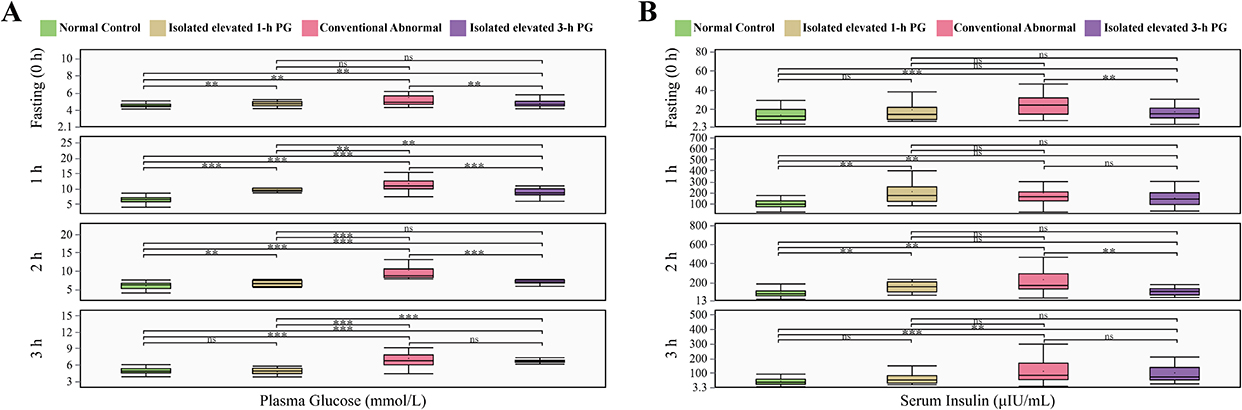 |
Figure 2 Comparison of glucose (A) and insulin (B) levels at each OGTT time point among the four primary glycemic subgroups: Normal control, isolated elevated 1-h PG, isolated elevated 3-h PG, and conventional abnormal groups. **P < 0.01; ***P < 0.001. Abbreviation: ns, no statistically significant difference. |
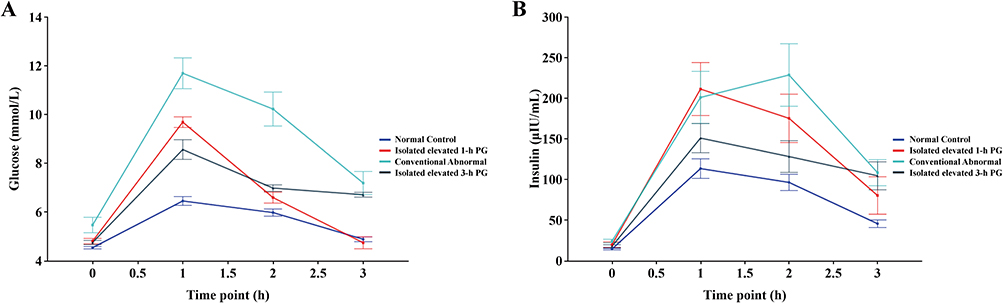 |
Figure 3 Dynamic curves of glucose (A) and insulin (B) secretion throughout the 75-g OGTT across the four glycemic subgroups. |
Discussion
This study demonstrates that extending the OGTT to 3 h reveals two distinct, early glycemic phenotypes in treatment-naive women with PCOS. The first phenotype, termed “isolated 3-h PG elevation” was present in 20.4% of the cohort and is characterized by normal fasting HOMA-IR despite pre-existing central adiposity and reproductive endocrine dysfunction, suggesting the possibility of tissue-specific or temporal insulin dysregulation that is not captured by fasting indices. In contrast, a second subgroup with “isolated 1-h PG elevation” (13.6%) presented with transient early hyperglycemia and hyperinsulinemia, accompanied by elevated LDL-C, yet with less pronounced adiposity. Both phenotypes evade diagnosis by standard glycemic criteria. Critically, the 3-h PG elevation subgroup represents a unique intermediate metabolic-endocrine phenotype that is younger and metabolically milder than those with conventional dysglycemia, while sharing a comparable degree of central adiposity. These findings reveal heterogeneous early pathways in PCOS-related dysglycemia, with isolated 3-h hyperglycemia specifically marking a divergence in body fat distribution and endocrine regulation preceding overt glucose intolerance.
It is important to note that HOMA-IR reflects primarily hepatic insulin resistance under fasting conditions and does not capture peripheral insulin resistance, impaired insulin clearance, or dynamic β-cell function. Therefore, the finding of normal HOMA-IR in the isolated 3-h PG elevation group should not be interpreted as evidence of preserved systemic insulin sensitivity, but rather as an indication that any insulin dysregulation in this phenotype is likely tissue-specific or temporal in nature, manifesting only under postprandial conditions.
The two distinct early glycemic phenotypes—isolated 1-h and 3-h PG elevations—probably arise from divergent initial pathophysiological triggers. The isolated 3-h PG elevation, characterized by delayed glucose normalization, points to impairments in the late phase of glucose homeostasis, which may stem from tissue-specific insulin sensitivity impairment (for instance, in skeletal muscle glucose uptake or hepatic glucose output regulation), that are not captured by HOMA-IR,18,19 altered β-cell secretory kinetics with insufficient late-phase insulin secretion,20 or a diminished incretin effect impacting postprandial glucose clearance.21,22 The concomitant manifestation of significant central adiposity and hyperandrogenism within this subgroup is pivotal. Visceral fat contributes to inflammation and dysregulated adipokine secretion, thereby impairing local insulin signaling.23,24 Furthermore, hyperandrogenism can exacerbate IR within critical metabolic tissues.25,26 We postulate that, in this phenotype, central obesity and hyperandrogenism synergistically contribute to a selective dysfunction in late-phase insulin action or secretion, subtle enough to preserve fasting and early postprandial glucose levels but manifesting as delayed recovery.
Conversely, the isolated 1-h PG elevation, marked by transient early hyperglycemia and hyperinsulinemia, suggests a distinct paradigm.17 This pattern is traditionally indicative of more pronounced systemic IR, eliciting a robust but potentially delayed compensatory hyperinsulinemia that restores glycemia by 3 h. The isolated LDL-C elevation in this group may represent an initial manifestation of IR-associated dyslipidemia. Accordingly, while the 3-h PG elevation may reflect a disruption in the timing or tissue specificity of insulin response, the 1-h PG elevation may primarily reflect an exaggerated but compensable state of IR. This dichotomy underscores the heterogeneous metabolic entry points in PCOS.
Positioning our findings within the framework of existing literature helps delineate their contribution and novelty. First, although the clinical relevance of the 3-h OGTT glucose level has been scarcely investigated in PCOS, our study systematically demonstrates that “isolated 3-h PG elevation” is a relatively prevalent (20.4%) and well-characterized phenotype, providing direct evidence to support extended metabolic assessment in this high-risk group. More importantly, by concurrently evaluating the 1-h time point with an improved threshold (≥ 8.6 mmol/L), we identified a distinct “isolated 1-h PG elevation” subgroup (13.6%). The existence of these two phenotypes, both of which do not meet standard criteria, underscores the heterogeneity of early dysglycemia in PCOS.
The contrasting features of these subgroups enhance comprehension of the underlying pathophysiology. The 1-h PG elevation, marked by transient early hyperglycemia and hyperinsulinemia, aligns with the established paradigm of compensated IR associated with increased diabetes risk, as supported by studies on 1-h glucose levels in other cohorts.17 Conversely, the 3-h PG elevation presents a novel trajectory. Its hallmark is significant central adiposity and hyperandrogenism despite normal HOMA-IR, challenging the direct obesity-IR link and suggesting an alternative sequence. Here, the visceral fat accumulation and its associated endocrine disturbances (for instance, hyperandrogenism) may serve as earlier causative factors,27,28 potentially instigating tissue-specific IR29 that primarily impairs late-phase glucose clearance without elevating fasting insulin levels. This subtle defect accounts for the observed disconnect between adiposity and HOMA-IR.
Consequently, our study advances beyond identifying isolated metrics. It reveals that early dysglycemia in PCOS can manifest via at least two divergent pathways: one related to generalized IR (partially reflected in 1-h glucose levels) and another influenced by body composition and endocrine factors that impair late-phase glycemic kinetics (captured only by 3-h glucose levels), that necessitates a transition from single-threshold screening towards integrated, dynamic phenotyping to assess individual metabolic risk accurately.
This study offers a phenotype-stratified framework for early metabolic management of PCOS. By extending the OGTT, two high-risk subgroups otherwise overlooked by conventional screening can be identified: the 3-h PG elevation subtype, characterized by delayed late glucose clearance, prominent central adiposity, and hyperandrogenism despite normal HOMA-IR; the 1-h PG elevation subtype, distinguished by transient early hyperglycemia, hyperinsulinemia, and elevated LDL-C. These findings may have clinical implications: for patients exhibiting phenotypic risk features (for instance, central obesity, hyperandrogenism), supplementing standard glucose tests with a 3-h OGTT to assess late-phase glucose kinetics could be considered, though further studies in non-PCOS populations are needed to determine the specificity of these observations. We acknowledge that widespread implementation of a routine 3-h OGTT would require careful consideration of cost, patient burden, and healthcare infrastructure, as discussed in the preceding paragraph. Early intervention should consequently be stratified, emphasizing improving body fat distribution and hyperandrogenism in the 3-h PG elevation subgroup, and prioritizing enhancing insulin sensitivity and cardiovascular risk management in the 1-h PG elevation subgroup. Collectively, our findings advocate a transition from reliance on individual glycemic thresholds toward an integrated, dynamic phenotypic assessment to enable personalized prevention strategies in PCOS, providing an evidence-based rationale for revising clinical guidelines.
It is also important to acknowledge that, while this study identifies isolated 1-h or 3-h glucose elevations in a subset of women with PCOS, and these phenotypes may indeed signify distinct metabolic risk pathways, their integration into routine clinical screening warrants caution. Currently, extending the OGTT has not led to fundamental shifts in PCOS treatment paradigms. On the contrary, it may increase testing complexity and associated costs, posing challenges to healthcare resource allocation and potentially impacting patient compliance. Therefore, future research must prioritize establishing the prognostic value of these phenotypes and demonstrating that phenotype-guided interventions translate to improved clinical outcomes before widespread adoption can be recommended.
This study possesses several limitations. First, as a single-center cross-sectional study, the generalizability of our findings is inherently limited. Additionally, the relatively small sample size (n = 103) may have reduced our statistical power to detect subtle differences among subgroups and precluded more detailed stratified analyses. Second, the exclusion of 75 patients (34.6% of the initially screened cohort) due to incomplete 3-h OGTT data raises the potential for selection bias. Patients who are able and willing to complete a prolonged 3-h OGTT may differ systematically from those who do not—for example, in terms of symptom burden, metabolic health, or socioeconomic factors—which could influence the estimated prevalence of the isolated 1-h and 3-h PG elevations. While we were unable to compare baseline characteristics between included and excluded patients due to data limitations, we acknowledge that this may affect the generalizability of our findings and should be considered when interpreting the prevalence estimates. Third, the design precludes the ability to draw causal inferences concerning the observed metabolic-endocrine associations and longitudinal assessment of diabetes risk. Fourth, although HOMA-IR was employed, it does not capture tissue-specific insulin sensitivity or dynamic β-cell function, which may be particularly relevant to the distinct phenotypes identified. Furthermore, the lack of both healthy control women and non-PCOS individuals with IR restricts our capacity to determine the specificity of the isolated 1-h and 3-h PG elevations to PCOS. Finally, the glycemic thresholds applied in this study require further validation. While the 1-h PG threshold (≥ 8.6 mmol/L) is supported by the International Diabetes Federation and other consensus statements, the 3-h PG threshold (> 6.1 mmol/L) is hypothesis-generating and derived from physiological principles rather than empirical outcome data. Although this threshold is grounded in the well-established observation that glucose normally returns to fasting levels by 3 h post-load, its clinical significance as a predictor of incident diabetes or cardiovascular risk remains to be established. We have therefore deliberately used the term “elevated 3-h PG phenotype” throughout the manuscript to emphasize its exploratory nature. Establishing a definitive, prognostically validated cutoff for 3-h PG will require large-scale, prospective, multi-ethnic cohort studies.
To address these limitations, future research should: First, multicenter, prospective cohort studies should be conducted to validate the prognostic value of elevated 1-h and 3-h PG phenotypes for incident diabetes and to establish robust diagnostic cut-offs. Such studies are essential to determine whether these phenotypes predict long-term metabolic outcomes independent of conventional risk factors. Second, gold-standard methods (for instance, hyperinsulinemic-euglycemic clamps, intravenous GTT) should be employed to elucidate the tissue-specific mechanisms underlying each phenotype. Third, appropriately matched control groups (healthy and insulin-resistant non-PCOS individuals) should be incorporated to ascertain the PCOS-specificity of these early dysglycemic patterns. Fourth, genetic, epigenetic, or metabolomic biomarkers associated with each phenotype should be explored to facilitate early detection. Fifth, it should be evaluated through randomized controlled trials whether phenotype-targeted early interventions (for instance, focusing on visceral adiposity reduction for the elevated 3-h PG phenotype versus insulin sensitization for the elevated 1-h PG phenotype) can improve metabolic and reproductive outcomes.
Conclusion
In conclusion, this study reveals that extending the OGTT to 3 h uncovers two distinct early glycemic phenotypes in PCOS missed by conventional criteria: an isolated 3-h elevation (≈20%) linked to central adiposity and hyperandrogenism, and an isolated 1-h elevation (≈14%) reflecting compensated insulin resistance. Both phenotypes signify elevated metabolic risk and support a shift toward dynamic, phenotype-stratified assessment for earlier detection and targeted intervention. However, clinical implementation requires caution and validation through prospective studies, including comparisons with non-PCOS populations to determine whether these phenotypes are specific to PCOS or reflect broader metabolic disturbances.
Data Sharing Statement
All data generated or analyzed during this study are included in this published article.
Ethics Approval and Consent to Participate
Informed consent was acquired from each participant included in the study. This study conformed to the guidelines of the Helsinki Declaration. This study was approved by the Ethics Committee of Hunan University of Medicine General Hospital (Approval No. Kuai-KY-2020070101). All patient data were de-identified prior to analysis to ensure confidentiality.
Consent for Publication
Written informed consent for publication was obtained from all participants.
Author Contributions
Sanhu Wang: Conceptualization, Investigation, Methodology, Visualization, Writing-original draft, Writing – review & editing. Xiqiang Gao: Conceptualization, Supervision, Visualization, Writing – review & editing. Fuxing Li: Conceptualization, Supervision, Visualization, Writing – review & editing. All authors gave final approval of the version to be published; have agreed on the journal to which the article has been submitted; and agree to be accountable for all aspects of the work.
Funding
This study was supported by the Natural Science Foundation of Hunan Province, China (Grant No. 2026JJ80528).
Disclosure
The authors report no conflicts of interest in this work.
References
1. Helvaci N, Yildiz BO. Polycystic ovary syndrome as a metabolic disease. Nat Rev Endocrinol. 2025;21(4):230–15. doi:10.1038/s41574-024-01057-w
2. Zhang Y, Chen ZJ, Zhao H. Polycystic ovary syndrome: a metabolic disorder with therapeutic opportunities. Cell Metab. 2025;37(10):1932–1949. doi:10.1016/j.cmet.2025.08.002
3. Sanchez-Garrido MA, Tena-Sempere M. Metabolic dysfunction in polycystic ovary syndrome: pathogenic role of androgen excess and potential therapeutic strategies. Mol Metab. 2020;35:100937. doi:10.1016/j.molmet.2020.01.001
4. Li J, Qiao J, Li Y, et al. Metabolic disorders in polycystic ovary syndrome: from gut microbiota biodiversity to clinical intervention. Front Endocrinol. 2025;16:1526468. doi:10.3389/fendo.2025.1526468
5. Al-Mutawa J. Genetic contribution between APE1 variants in polycystic ovarian syndrome. Saudi J Biol Sci. 2023;30(3):103563. doi:10.1016/j.sjbs.2023.103563
6. Muharam R, Ph D, Srilestari A, et al. Combination of electroacupuncture and pharmacological treatment improves insulin resistance in women with polycystic ovary syndrome: double-blind randomized clinical trial. Int J Reprod Biomed. 2022;20(4):289–298. doi:10.18502/ijrm.v20i4.10900
7. NYH N, Jiang G, Cheung LP, et al. Progression of glucose intolerance and cardiometabolic risk factors over a decade in Chinese women with polycystic ovary syndrome: a case-control study. PLoS Med. 2019;16(10):e1002953. doi:10.1371/journal.pmed.1002953
8. Norman RJ, Masters L, Milner CR, et al. Relative risk of conversion from normoglycaemia to impaired glucose tolerance or non-insulin dependent diabetes mellitus in polycystic ovarian syndrome. Hum Reprod. 2001;16(9):1995–1998. doi:10.1093/humrep/16.9.1995
9. Chinese Diabetes Society. Guideline for the prevention and treatment of type 2 diabetes mellitus in China (2020 edition) (Part 1). Chin J Pract Intern Med. 2021;41(08):668–695. [In Chinese]. doi:10.19538/j.nk2021080106
10. Chinese Diabetes Society. Guideline for the prevention and treatment of type 2 diabetes mellitus in China (2020 edition) (Part 2). Chin J Pract Intern Med. 2021;41(09):757–784. [In Chinese]. doi:10.19538/j.nk2021090106
11. Li HW, Lam KS, Tam S, et al. Screening for dysglycaemia by oral glucose tolerance test should be recommended in all women with polycystic ovary syndrome. Hum Reprod. 2015;30(9):2178–2183. doi:10.1093/humrep/dev166
12. Ortiz-Flores AE, Luque-Ramirez M, Fernandez-Duran E, et al. Diagnosis of disorders of glucose tolerance in women with polycystic ovary syndrome (PCOS) at a tertiary care center: fasting plasma glucose or oral glucose tolerance test? Metabolism. 2019;93:86–92. doi:10.1016/j.metabol.2019.01.015
13. Velling Magnussen L, Mumm H, Andersen M, et al. Hemoglobin A1c as a tool for the diagnosis of type 2 diabetes in 208 premenopausal women with polycystic ovary syndrome. Fertil Steril. 2011;96(5):1275–1280. doi:10.1016/j.fertnstert.2011.08.035
14. Mittendorfer B, Patterson BW, Smith GI, et al. beta cell function and plasma insulin clearance in people with obesity and different glycemic status. J Clin Invest. 2022;132(3). doi:10.1172/JCI154068
15. Kaiyue G. To Investigate the Application of Simple OGTT in Polycystic Ovarian Syndrome [in Chinese] [Master’s thesis]. Zhengzhou University; 2023. doi:10.27466/d.cnki.gzzdu.2023.003199
16. Singh S, Pal N, Shubham S, et al. Polycystic ovary syndrome: etiology, current management, and future therapeutics. J Clin Med. 2023;12(4):1454. doi:10.3390/jcm12041454
17. Bergman M, Manco M, Satman I, et al. International Diabetes Federation Position Statement on the 1-hour post-load plasma glucose for the diagnosis of intermediate hyperglycaemia and type 2 diabetes. Diabetes Res Clin Pract. 2024;209:111589. doi:10.1016/j.diabres.2024.111589
18. Manolopoulos KN, O’Reilly MW, Bujalska IJ, et al. Acute hypercortisolemia exerts depot-specific effects on abdominal and femoral adipose tissue function. J Clin Endocrinol Metab. 2017;102(4):1091–1101. doi:10.1210/jc.2016-3600
19. Velasco M, Ortiz-Huidobro RI, Larque C, et al. Sexual dimorphism in insulin resistance in a metabolic syndrome rat model. Endocr Connect. 2020;9(9):890–902. doi:10.1530/EC-20-0288
20. Liu S, Zhang R, Zhang L, et al. Oxidative stress suppresses PHB2-mediated mitophagy in beta-cells via the Nrf2/PHB2 pathway. J Diabetes Investig. 2024;15(5):559–571. doi:10.1111/jdi.14147
21. Kawaguchi Y, Hajika Y, Rinka M, et al. Comparison of efficacy and safety of insulin degludec/liraglutide and insulin glargine U-100/lixisenatide in individuals with type 2 diabetes mellitus using professional continuous glucose monitoring. J Diabetes Investig. 2024;15(5):598–607. doi:10.1111/jdi.14151
22. Krystynik O, Karasek D, Kahle M, et al. Non-altered incretin secretion in women with impaired fasting plasma glucose in the early stage of pregnancy: a case control study. Diabetol Metab Syndr. 2023;15(1):12. doi:10.1186/s13098-023-00981-7
23. Pluta D, Stasczak A, Stokowy T, et al. Visceral adiposity index in relation to Rotterdam phenotypes of polycystic ovary syndrome. Biomedicines. 2025;13(8):1997. doi:10.3390/biomedicines13081997
24. Lionett S, Kiel IA, Rosbjorgen R, et al. Absent exercise-induced improvements in fat oxidation in women with polycystic ovary syndrome after high-intensity interval training. Front Physiol. 2021;12:649794. doi:10.3389/fphys.2021.649794
25. Song DK, Hong YS, Sung YA, et al. Insulin resistance according to beta-cell function in women with polycystic ovary syndrome and normal glucose tolerance. PLoS One. 2017;12(5):e0178120. doi:10.1371/journal.pone.0178120
26. Unluhizarci K, Karaca Z, Kelestimur F. Role of insulin and insulin resistance in androgen excess disorders. World J Diabetes. 2021;12(5):616–629. doi:10.4239/wjd.v12.i5.616
27. Zhang J, Sun Z, Jiang S, et al. Probiotic bifidobacterium lactis V9 regulates the secretion of sex hormones in polycystic ovary syndrome patients through the gut-brain axis. mSystems. 2019;4(2):e00017–19. doi:10.1128/mSystems.00017-19
28. Na Z, Jiang H, Meng Y, et al. Association of galactose and insulin resistance in polycystic ovary syndrome: a case-control study. EClinicalMedicine. 2022;47:101379. doi:10.1016/j.eclinm.2022.101379
29. Neff AM, Yu J, Taylor RN, et al. Insulin signaling via progesterone-regulated insulin receptor substrate 2 is critical for human uterine decidualization. Endocrinology. 2020;161(1):bqz021. doi:10.1210/endocr/bqz021
 © 2026 The Author(s). This work is published and licensed by Dove Medical Press Limited. The
full terms of this license are available at https://www.dovepress.com/terms
and incorporate the Creative Commons Attribution
- Non Commercial (unported, 4.0) License.
By accessing the work you hereby accept the Terms. Non-commercial uses of the work are permitted
without any further permission from Dove Medical Press Limited, provided the work is properly
attributed. For permission for commercial use of this work, please see paragraphs 4.2 and 5 of our Terms.
© 2026 The Author(s). This work is published and licensed by Dove Medical Press Limited. The
full terms of this license are available at https://www.dovepress.com/terms
and incorporate the Creative Commons Attribution
- Non Commercial (unported, 4.0) License.
By accessing the work you hereby accept the Terms. Non-commercial uses of the work are permitted
without any further permission from Dove Medical Press Limited, provided the work is properly
attributed. For permission for commercial use of this work, please see paragraphs 4.2 and 5 of our Terms.