Back to Journals » Cancer Management and Research » Volume 11
Expression profiles and prognostic significance of RNA N6-methyladenosine-related genes in patients with hepatocellular carcinoma: evidence from independent datasets
Authors Zhou Y, Yin Z ![]() , Hou BH, Yu M, Chen R
, Hou BH, Yu M, Chen R ![]() , Jin H, Jian Z
, Jin H, Jian Z
Received 20 October 2018
Accepted for publication 1 April 2019
Published 1 May 2019 Volume 2019:11 Pages 3921—3931
DOI https://doi.org/10.2147/CMAR.S191565
Checked for plagiarism Yes
Review by Single anonymous peer review
Peer reviewer comments 2
Editor who approved publication: Dr Chien-Feng Li
Yu Zhou,1 Zi Yin,1 Baohua Hou,1 Min Yu,1 Ruiwan Chen,2 Haosheng Jin,1 Zhixiang Jian1
1Department of General Surgery, Guangdong General Hospital, Guangdong Academy of Medical Sciences, Guangzhou, Guangdong, People’s Republic of China; 2Department of Radiation Oncology, The First Affiliated Hospital, Sun Yat-sen University, Guangzhou, Guangdong, People’s Republic of China
Background: N6-methyladenosine (m6A) is the most prevalent modification of mammalian RNA. Emerging evidence suggest that m6A has critical roles in multiple biological activities, but little is known about its roles in cancer pathogenesis. Herein, we report the expression profiles and prognostic relevance of twelve m6A-related genes in hepatocellular carcinoma (HCC) by analyzing four independent datasets.
Materials and methods: RNA levels of twelve m6A-related genes were detected in samples of 162 HCC patients who underwent curative resection (the Guangdong General Hospital dataset). We additionally analyzed the expression profiles of m6A-related genes in The Cancer Genome Atlas liver HCC dataset and two Gene Expression Omnibus datasets (GSE14520, GSE63898). Prognostic value of genes was evaluated by Kaplan–Meier curves of overall survival (OS) with the log-rank test and multivariate Cox regression analysis. Gene set enrichment analysis (GSEA) was conducted to identify associated KEGG pathways.
Results: Five genes (METTL3, YTHDF1, YTHDF2, YTHDF3, and EIF3) showed consistent upregulation in all four datasets. Abnormal expressions of either METTL3 or YTHDF1 but not the other ten genes were associated with OS. Protein expression of METTL3 and YTHDF1 were confirmed in HCC tissues by immunohistochemical staining. Multivariate Cox regression analysis confirmed the independent predictive value of both METTL3 and YTHDF1 on OS. We further divided patients into three groups based on the median expression values of METTL3 and YTHDF1. In all datasets, the low METTL3/low YTHDF1 group showed a consistent better prognosis than other groups. GSEA revealed that both METTL3 and YTHDF1 regulate HCC cell cycle, RNA splicing, DNA replication, base excision repair, and RNA degradation.
Conclusion: Both METTL3 and YTHDF1 were upregulated in HCC, and they were independent poor prognostic factors. Combination of METTL3 and YTHDF1 can be regarded as the biological marker that reflect malignant degree and evaluate prognosis in HCC.
Keywords: hepatocellular carcinoma, N6-methyladenosine, m6A, prognosis
Introduction
HCC represents a major public health problem, with an incidence currently rising in almost all countries.1 It is generally admitted that liver tumorigenesis is a consequence of the multistep process that involves complicated interplays between genetic, epigenetics, and transcriptomic alterations.2,3 However, till now, the detailed mechanics regulating progression of HCC are still not fully elucidated. The recent discovery of reversible N6-methyladenosine (m6A) of RNA provided a novel layer of post-transcriptional gene regulation.4 Modifications of m6A are dynamic and reversible in mammalian cells, which have been recognized as the most abundant internal modification in eukaryotic mRNA. m6A-dependent mRNA regulation is essential in diverse key biological processes, including embryonic development, stem cell differentiation, neural development, and stress responses.5–8 Consistent with its significant roles, the effects of m6A mRNA methylation on cancer progression are beginning to emerge.9,10
The m6A modifications are mediated through a complex interplay among “writer”, “eraser”, and “reader” proteins.4,11 Writers and erasers regulate the abundance, prevalence, and distribution of m6A, whereas readers modulate m6A modification-related functions, such as mRNA splicing, RNA export, RNA stability, and translation. A series of proteins function as writers, erasers or readers have been uncovered, such as methyltransferase-like 3 (METTL3), methyltransferase-like 14 (METTL14), members of YT521-B homology (YTH) domain family, alkB homologue protein family, and so on.12–15 Although previous studies have reported some m6A-associated proteins were involved in the progression of several cancers,16,17 the expression pattern as well as the prognosis value have not been fully elucidated in HCC. In this study, we investigated the expression pattern and prognostic value of writer”, “eraser”, and “reader” proteins in patients with HCC through analyzing a HCC cohort of our center, the TCGA, and a Gene Expression Omnibus (GEO) dataset.
Methods
Patients and clinical samples
A total of 162 frozen tumor specimens and the paired para-tumor non-tumor tissues were collected from patients with hepatocellular carcinoma (HCC) who underwent surgery at Guangdong General Hospital (Guangzhou, China) between February January 2013 and May 2014. All fresh tissues were immediately frozen in liquid nitrogen and stored at −80°C until required. Patients were staged according to the seventh edition of the International Union against Cancer TNM classification system. The 162 patients were classified to the Guangdong General Hospital (GDGH) cohort in this study. All protocols were approved by the Research Ethics Committee of Guangdong General Hospital (No. GDREC2015151H(R1)), and written informed consent was obtained from all participants. All study procedures were carried out in accordance with the ethical standards of the Helsinki Declaration.
Data resources and reprocessing
The datasets GSE14520 and GSE63898 were downloaded from expression database GEO (Gene Expression Omnibus,
RNA isolation and qRT-PCR
Total RNA was extracted from tissue samples using TRIzol (Invitrogen, Carlsbad, CA) according to the manufacturer’s instructions. Total RNA was converted to complementary DNA by reverse-transcription using oligodT primers and SuperScript II reverse transcriptase (Invitrogen). For qRT-PCR, three replicates per sample were amplified and analyzed. Reactions were carried out in a 20-μL volume using SYBR Green Reaction Mix (Qiagen Science, GER) with 0.5 mM primer. To detect the mRNA expression levels in the tissues, GAPDH was used as the normalization control. Primers aree listed in
Immunohistochemistry
Tissue samples were fixed with 10% formaldehyde in PBS, embedded in paraffin, and cut into serial 4-μm sections. The tissue sections were deparaffiized in xylene and rehydrated with graded ethanol and then treated with 0.3% hydrogen peroxide for 10 mins, followed by antigen retrieval in 0.01 M citrate buffer (p H: 6.0, 10×). After 20 min cooling, sections were incubated with the primariy METTL3 antibody (rabbit monoclonal; no. ab195352, Abcam Inc., USA) or primarily YTHDF1 antibody (rabbit monoclonal; no. ab230330, Abcam Inc., USA) at 4°C overnight. The sections were then incubated with the secondary antibody and then were visualized.
Gene set enrichment analysis (GSEA)
GSEA was performed using normalized data by GSEAv3.0 tool (
Statistics
All quantitative data are presented as the mean ± standard deviation from at least three independent experiments. Unless otherwise noted, continuous variables were analyzed using the Student’s t-test, and the Mann–Whitney U test was used for independent samples when the population could not be assumed to be normally distributed. Kaplan–Meier curves of overall survival (OS) were compared with the log-rank test. Associations between the variables and survival were also evaluated by using univariate and multivariate analyses with the Cox proportional hazard model. All tests were two-sided, and p-values <0.05 were considered statistically significant. All statistical analyses were conducted using SPSS 17.0 (SPSS Inc., Chicago, IL, USA).
Results
Identification of differentially expressed m6A-related genes in hepatocellular carcinoma
To acquire the transcriptional profiles of m6A-related genes in HCC, HCC tissues (n=162) and paired adjacent non-tumor tissues (n=162) were analyzed using qRT-PCR. We found that two m6A writers (METTL3, WTAP) and six readers (EIF3, YTHDC1, YTHDF1, YTHDF2, YTHDF3, and HNRNPA2B1) were significantly upregulated in cancer tissues compared with paired non-tumor tissues (Figure 1A). To verify our result, the expression of m6A-related genes were also examined in the TCGA dataset and two GEO datasets (GSE14520, GSE63898). The heatmaps of genes in TCGA, GSE63898, and GSE14520 are shown in Figure 1B–D, respectively. As summarized in Figure 1E, a total of five genes, including METTL3, YTHDF1, YTHDF2, YTHDF3, and EIF3, showed consistent trends of upregulation in HCC tissues across all four datasets.
 | Figure 1 Expression profiles of m6A-related genes in four independent datasets. (A) Expression levels of twelve m6A-related genes in 162 paired HCC tissues and corresponding adjacent non-tumor tissues (GDGH cohort) was examined via quantitative reverse transcription-polymerase chain reaction (qRT-PCR). GAPDH was used as internal control. Relative gene expression was determined using the comparative delta-delta CT method, and data are presented as △△Ct. (B, C, D) Expression heatmap plotting of m6A-related genes in TCGA dataset (B), GSE63898 dataset (C), and GSE14520 dataset (D). (E) The change profiles of m6A-related genes in the four datasets are summarized and compared. The red block indicates the corresponding gene was significantly upregulated in HCC tissues compared with the non-tumor control tissues; the green red block indicates the corresponding gene was significantly downregulated in HCC tissues compared with the non-tumor control tissues; the black red block indicates the expression of corresponding gene was not significantly changed in HCC tissues compared with the non-tumor control tissues; the grey block indicates the expression level of corresponding gene was not available. |
Prognosis significance of m6A related genes in hepatocellular carcinoma
To further investigate the clinical significance of m6A-related genes, we assessed survival rates in three independent datasets with prognosis information (TCGA, GSE14520, and GDGH cohort). The clinical characteristics of patients in each cohort are summarized in Table 1. In each dataset, patients were divided into two groups by the median value of the candidate gene, and OS curves for each gene were plotted by the Kaplan–Meier method. Analysis of these datasets revealed that among all genes examined (
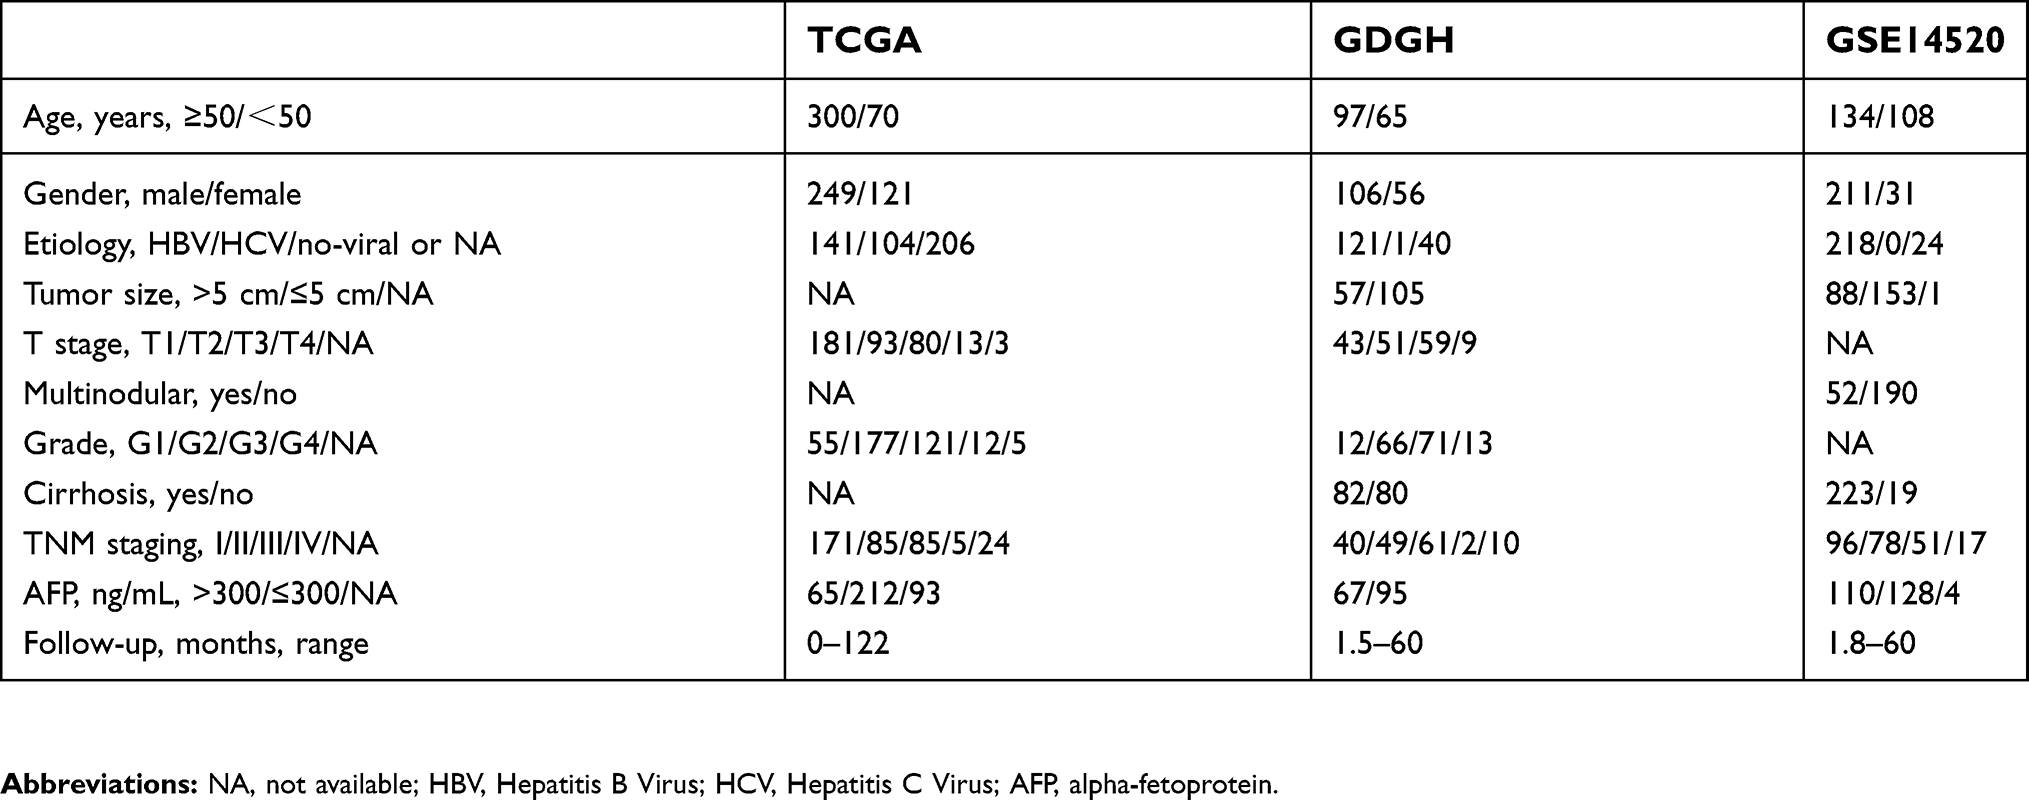 | Table 1 Clinical characteristics of patients in the TCGA, GDGH, and GSE14520 cohorts |
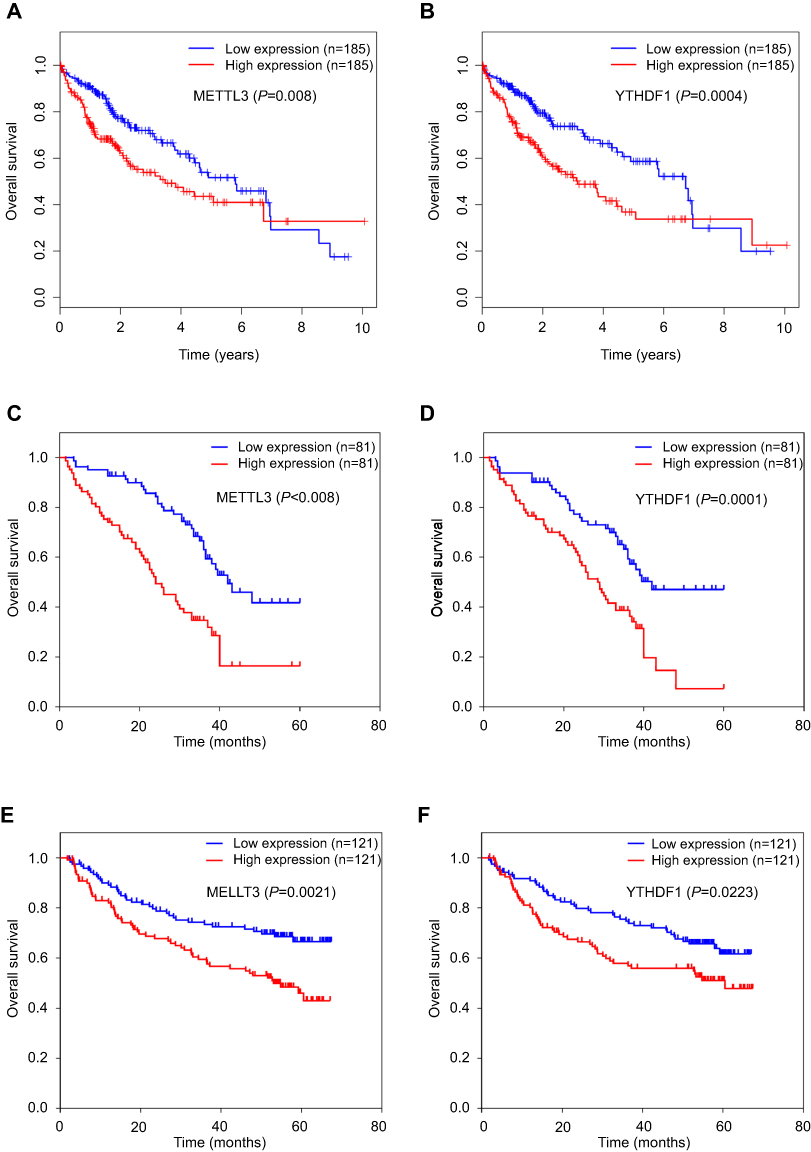 | Figure 2 Correlation between METTL3 or YTHDF1 expressions and survival rates in patients with HCC. (A, B) Kaplan–Meier OS curve based on METTL3 expression (A) and YTHDF1 expression (B) in TCGA dataset. (C, D) Kaplan–Meier OS curve based on METTL3 expression (C) and YTHDF1 expression (D) in GDGH dataset. (E, F) Kaplan–Meier OS curve based on METTL3 expression (E) and YTHDF1 expression (F) in GSE14520 dataset. Patients were grouped into low- vs high-expression levels based on the median values of METTL3 or YTHDF1 expressions in each dataset. Log-rank test was used to compare differences in survival times. |
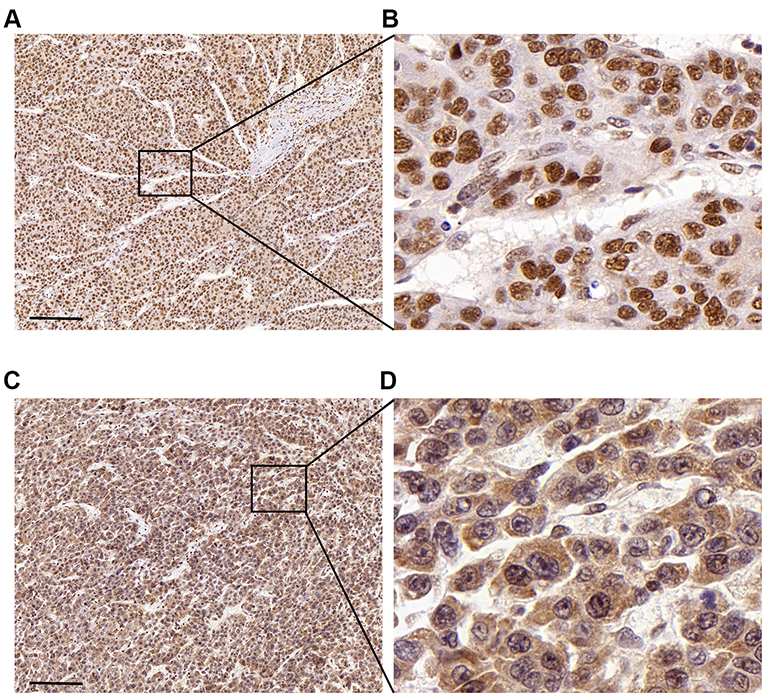 | Figure 3 Immunohistochemical staining of METTL3 (A, B) and YTHDF1 (C, D) in HCC tissues Scale bars: 200 μm. |
Cox regression analysis for the prognosis significance of METTL3 and YTHDF1
Since survival curves showed that both METTL3 and YTHDF1 were correlated with survival, we performed multivariate Cox proportional-hazards analyses to further investigate the prognostic value of METTL3 and YTHDF1. According to the results of multivariate Cox regression in the GDGH cohort, METTL3 expression (HR =1.78, 95%CI =1.09–2.91, P=0.021) and YTHDF1 expression (HR =1.53, 95%CI =1.08–2.16, P=0.017) were both independent prognostic factors for patients with HCC (Table 2).
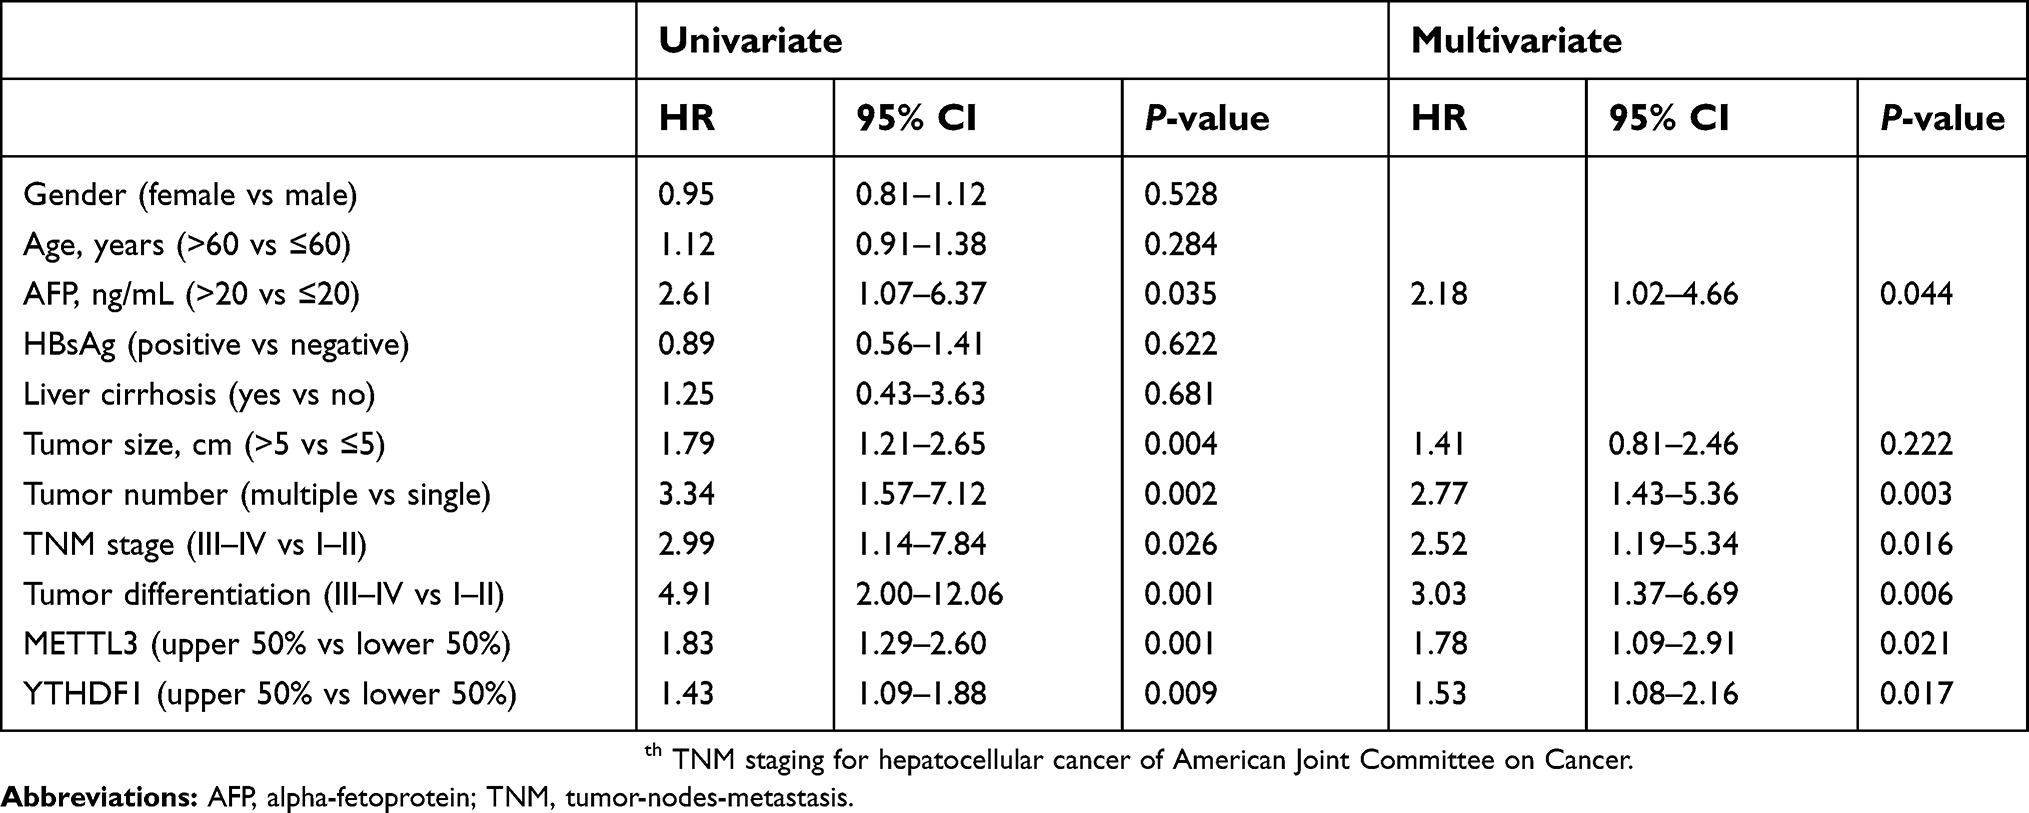 | Table 2 Univariate and multivariate analyses of factors associated with survival |
The two-gene signature predicts the survival of patients with HCC
Due to the importance of m6A modifications in biological processes, as well as the significant prognostic value of METTL3 and YTHDF1 in HCC, we developed a risk stratification method based on these two genes. Patients were divided into three groups based on median expression levels of METTL3 and YTHDF1 (Figure 4). Kaplan–Meier curves showed that patients in low-risk groups had significantly increased survival than those in other risk groups (log-rank test, P=0.0002 in TCGA, P=0.0249 in GSE14520, P<0.0001 in GDGH cohort) (Figure 4A–C). Overall, after we integrated all patients in one survival analysis, we observed that patients in different groups had distinctively different outcomes (P<0.0001) (Figure 4D).
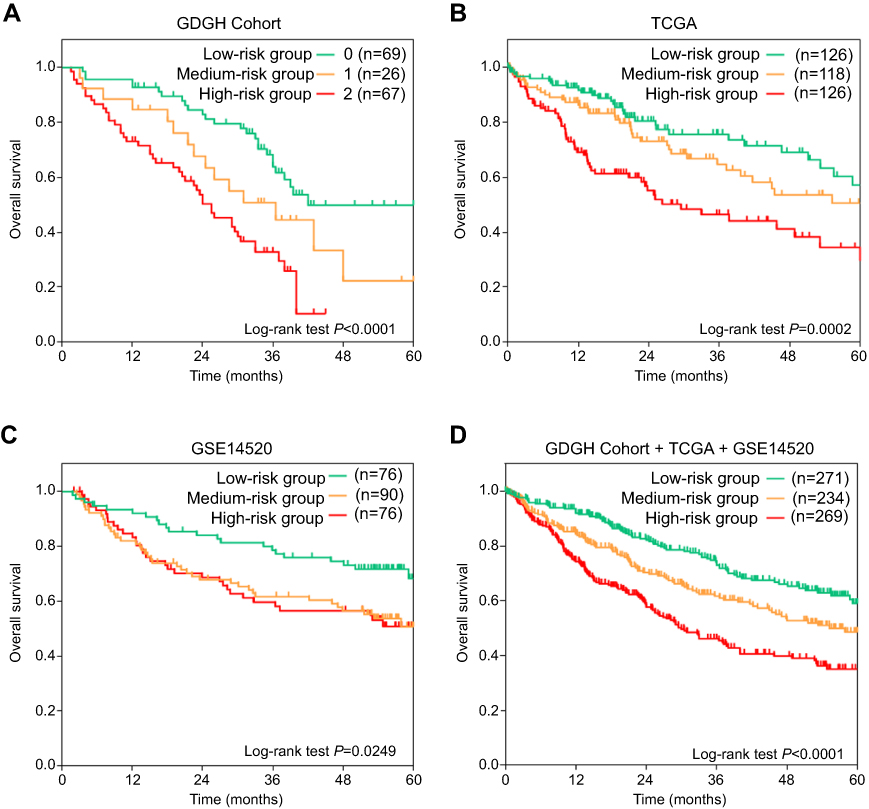 | Figure 4 Kaplan–Meier OS curves of HCC patients stratified into low-, medium-, and high-risk groups in GDGH dataset (A), TCGA dataset (B), GSE14520 dataset (C), and the integration of three databases (D). Low-risk group was defined as patients with both low METTL3 expression (<50% patients) and low YTHDF1 expression (<50% patients); medium-risk group was defined as patients with either high METTL3 expression (≥50% patients) or high YTHDF1 expression (≥50% patients). High-risk group was defined as patients with both high METTL3 expression (≥50% patients) and high YTHDF1 (≥50% patients) expression. Log-rank test was used to compare differences in survival times. |
GSEA and functional annotation of METTL3 and YTHDF1
To explore the potential function of METTL3 and YTHDF1 in HCC, we applied GSEA on the TCGA and GSE14520 datasets using the KEGG gene sets (c2.cp.kegg.v6.2.symbols). The results of GSEA are listed in
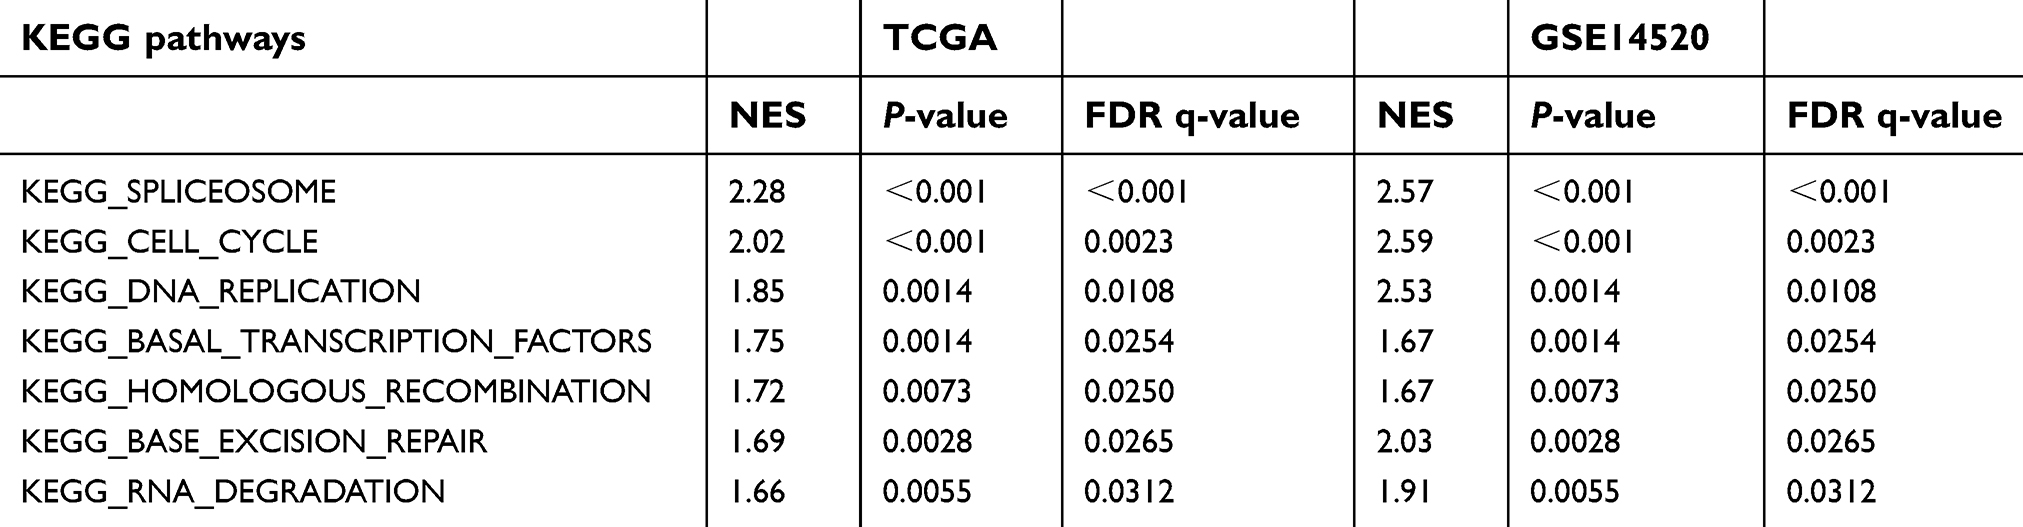 | Table 3 Gene set enrichment analysis for METTL3 with KEGG pathway gene sets gene symbols using the TCGA and GSE14520 datasets |
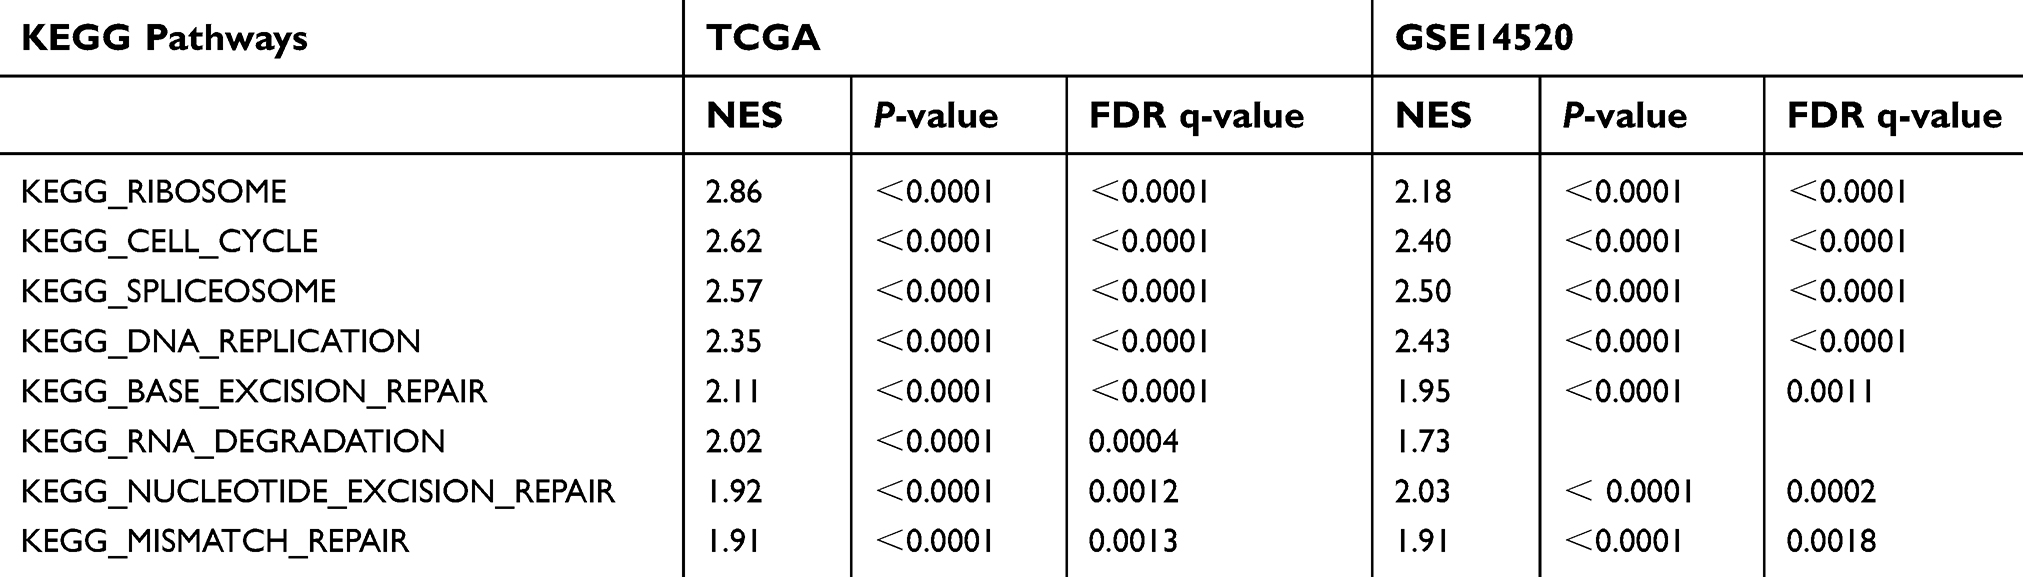 | Table 4 Gene set enrichment analysis for YTHDF1 with KEGG pathway gene sets gene symbols using the TCGA and GSE14520 datasets |
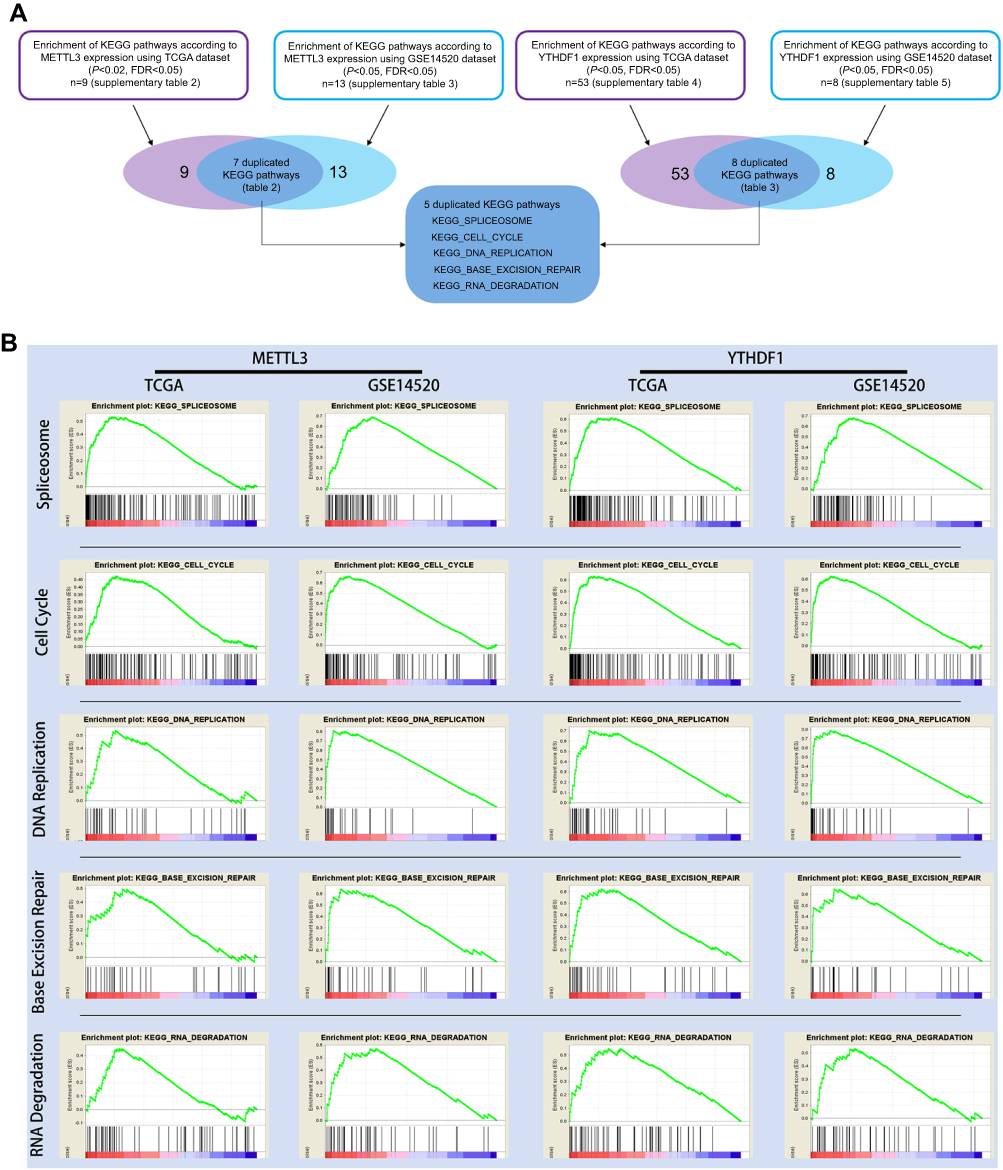 | Figure 5 GSEA results of METTL3 and YTHDF1 in TCGA and GSE14520 patients. (A) Flow chart showing the screening process to identify KEGG pathways associated with METTL3 expression, YTHDF1 expression, or both METTL3 and YTHDF1 expression. (B) GSEA plots displayed the significant association between five KEGG pathways, including spliceosome, cell cycle, DNA replication, base excision repair, and RNA degradation, and both METTL3/YTHDF1 expression. |
Because we found that patients with high expression of both METTL3 and YTHDF1 had the worst prognosis, we further screened the enriched KEGG pathways associated with both METTL3 expression and YTHDF1 expression (Figure 5A), they were spliceosome, cell cycle, DNA replication, base excision repair, and RNA degradation. The GSEA plots are shown in Figure 5B. This result indicated that both METTL3 and YTHDF1 play important roles in the above five biological processes.
Discussion
RNA can be modified by more than one hundred distinct post-transcriptional modifications, and m6A is now recognized the most abundant internal modification in eukaryocyte since it was discovered in the 1970s.22,23 However, due to the lack of effective techniques, functional characterizations of m6A was just beginning to emerge since the antibody-based high-throughput sequencing technology appeared.24 Recent work has uncovered that the m6A modifications were controlled by the complex interplay of m6A deposition, removal, and recognition factors (writers”, “erasers”, and “readers”). Although the role and mechanism of these factors in regulating m6A were conservative, their pathological implications can be different depending on the disease. For example, a major m6A “writer”, METTL3, is significantly up-regulated in HCC and serve as an oncogene,17 but a recent study revealed that knockdown of METTL3 in endometrial cancer cell lines promoted cell proliferation, anchorage-independent growth, colony formation, migration, and invasion,1 which was totally opposite to its role in HCC.
To explore the role of m6A-related factors in HCC, we evaluated their expression pattern and prognosis significance in four HCC cohorts. By comparing results from TCGA data, two GEO datasets, and our HCC cohort, we found that the expression trends of five genes (METTL3, YTHDF1-3, EIF3) were consistent throughout all datasets. We also identified that overexpression of METTL3 or YTHDF1, but not other genes, was associated with poor prognosis in patients with HCC. Moreover, patients with co-overexpression of METTL3 and YTHDF1 showed the poorest prognosis. These findings suggested important roles of METTL3 and YTHDF1 as oncogenes in the progression of HCC.
METTL3 is a key component of m6A methyltransferase complex, and it determines the levels and distribution of target-specific m6A modifications through a complex interplay with other components.25 A recent study reported that knockout of METTL3 remarkably suppressed HCC tumorigenesis and progression in vitro and in vivo via a YTHDF2-dependent mechanism, suggesting a close collaboration between m6A “writers” and “readers” in HCC.2 The YT521-B homology (YTH) domain family of proteins (YTHDF1, YTHDF2, YTHDF3, YTHDC1, and YTHDC2) are direct readers of m6A and have a conserved m6A-binding pocket.26–28 Although YTHDF1, YTHDF2, YTHDF3, YTHDC1, and YTHDC2 all belong to YTH domain family, their functions are different. For example, YTHDC1-2 locate in the nuclear compartment and YTHDF1-3 locate in the cytoplasmic compartment.29,30 The nuclear reader YTHDC1 regulates alternative splicing by binding m6A directly and recruiting the splicing factors,29 while cytoplasmic reader YTHDF1 mediates translation initiation of m6A-containing transcripts,26 and YTHDF2 promotes mRNA decay by facilitating the recruitment of the CCR4–NOT complex to target mRNA.31 Intriguingly, our present study showed that all of the three cytoplasmic m6A readers (YTHDF1, YTHDF2, and YTHDF3) were overexpressed in HCC patients throughout the four datasets. Therefore, overexpression of YTHDF1, YTHDF2, and YTHDF3 might be a common feature of the expression profile of m6A-related genes in HCC. Moreover, among the overexpressed m6A readers, YTHDF1 showed a significant and consistent prognostic value among all four datasets, suggesting a potential important role of YTHDF1 in HCC progression. Further investigations will be required to address the role of YTHDF1 in HCC.
All together, we reported that both METTL3 and YTHDF1 were independent prognostic factors in patients with HCC. Moreover, patients with different co-expression levels of METTL3 and YTHDF1 showed diverse survival outcomes. Future studies could focus on the molecular mechanisms of the potential interplay between METTL3 and YTHDF1 in HCC progression.
Abbreviation list
Hepatocellular carcinoma, HCC; OS, overall survival; Uni, univariate analysis; Multi, multivariate analysis; HR, hazards ratio; CI, confidence interval; TCGA, The Cancer Genome Atlas; GEO, Gene Expression Omnibus; qRT-PCR, quantitative real time polymerase chain reaction.
Acknowledgments
We thank Dr. Chao Liu for her assistance with the immunohistochemical experiment and pathological evaluation of immunohistochemical results. This work was supported by grants from Science and Technology Planning Project of Guangdong Province of China (2016A020215126), National Natural Science Foundation of China (81602172), and Guangzhou Science and Technology Plan of Scientifc Research Projects, People’s Republic of China (No 201510010286).
Disclosure
The authors declare that they have no conflicts of interest in this work.
References
1. Ferlay J, Soerjomataram I, Dikshit R, et al. Cancer incidence and mortality worldwide: sources, methods and major patterns in GLOBOCAN 2012. Int J Cancer. J Int Du Cancer. 2015;136(5):E359–386. doi:10.1002/ijc.29210
2. Aravalli RN, Cressman EN, Steer CJ. Cellular and molecular mechanisms of hepatocellular carcinoma: an update. Arch Toxicol. 2013;87(2):227–247. doi:10.1007/s00204-012-0931-2
3. Arzumanyan A, Reis HM, Feitelson MA. Pathogenic mechanisms in HBV- and HCV-associated hepatocellular carcinoma. Nat Rev Cancer. 2013;13(2):123–135. doi:10.1038/nrc3449
4. Zhao BS, Roundtree IA, He C. Post-transcriptional gene regulation by mRNA modifications. Nat Rev Mol Cell Biol. 2017;18(1):31–42. doi:10.1038/nrm.2016.132
5. Yoon KJ, Ringeling FR, Vissers C, et al. Temporal control of mammalian cortical neurogenesis by m(6)A methylation. Cell. 2017;171(4):877–889.e817. doi:10.1016/j.cell.2017.09.003
6. Mendel M, Chen KM, Homolka D, et al. Methylation of structured RNA by the m(6)A writer METTL16 is essential for mouse embryonic development. Mol Cell. 2018;71(6):986–1000.e1011. doi:10.1016/j.molcel.2018.08.004
7. Engel M, Eggert C, Kaplick PM, et al. The role of m(6)A/m-RNA methylation in stress response regulation. Neuron. 2018;99(2):389–403.e389. doi:10.1016/j.neuron.2018.07.009
8.
9. Wang S, Chai P, Jia R, Jia R. Novel insights on m(6)A RNA methylation in tumorigenesis: a double-edged sword. Mol Cancer. 2018;17(1):101. doi:10.1186/s12943-018-0847-4
10. Liu J, Eckert MA. m(6)A mRNA methylation regulates AKT activity to promote the proliferation and tumorigenicity of endometrial cancer. Nat Cell Biol. 2018;20(9):1074–1083. doi:10.1038/s41556-018-0174-4
11. Wang X, He C. Reading RNA methylation codes through methyl-specific binding proteins. RNA Biol. 2014;11(6):669–672.
12. Yue Y, Liu J, He C. RNA N6-methyladenosine methylation in post-transcriptional gene expression regulation. Genes Dev. 2015;29(13):1343–1355. doi:10.1101/gad.262766.115
13. Bokar JA, Rath-Shambaugh ME, Ludwiczak R, Narayan P, Rottman F. Characterization and partial purification of mRNA N6-adenosine methyltransferase from HeLa cell nuclei. Internal mRNA methylation requires a multisubunit complex. J Biol Chem. 1994;269(26):17697–17704.
14. Jia G, Fu Y, Zhao X, et al. N6-methyladenosine in nuclear RNA is a major substrate of the obesity-associated FTO. Nat Chem Biol. 2011;7(12):885–887. doi:10.1038/nchembio.687
15. Zheng G, Dahl JA, Niu Y, et al. ALKBH5 is a mammalian RNA demethylase that impacts RNA metabolism and mouse fertility. Mol Cell. 2013;49(1):18–29. doi:10.1016/j.molcel.2012.10.015
16. Luo J, Liu H, Luan S, He C, Li Z. Aberrant Regulation of mRNA m⁶A Modification in Cancer Development. Int J Mol Sci. 2018;19(9). pii: E2515. doi: 10.3390/ijms19092515.
17. Chen M, Wei L, Law CT, et al. RNA N6-methyladenosine methyltransferase-like 3 promotes liver cancer progression through YTHDF2-dependent posttranscriptional silencing of SOCS2. Hepatology. 2018;67(6):2254–2270. doi: 10.1002/hep.29683.
18. Roessler S, Jia HL, Budhu A, et al. A unique metastasis gene signature enables prediction of tumor relapse in early-stage hepatocellular carcinoma patients. Cancer Res. 2010;70(24):10202–10212. doi:10.1158/0008-5472.CAN-10-2607
19. Villanueva A, Portela A, Sayols S, et al. DNA methylation-based prognosis and epidrivers in hepatocellular carcinoma. Hepatology (Baltimore, Md). 2015;61(6):1945–1956. doi:10.1002/hep.27732
20. Subramanian A, Tamayo P, Mootha VK, et al. Gene set enrichment analysis: a knowledge-based approach for interpreting genome-wide expression profiles. Proc Natl Acad Sci U S A. 2005;102(43):15545–15550. doi:10.1073/pnas.0506580102
21. Mootha VK, Lindgren CM, Eriksson KF, et al. PGC-1alpha-responsive genes involved in oxidative phosphorylation are coordinately downregulated in human diabetes. Nat Genet. 2003;34(3):267–273. doi:10.1038/ng1180
22. Desrosiers R, Friderici K, Rottman F. Identification of methylated nucleosides in messenger RNA from novikoff hepatoma cells. Proc Natl Acad Sci U S A. 1974;71(10):3971–3975.
23. Furuichi Y, Morgan M, Shatkin AJ, Jelinek W, Salditt-Georgieff M, Darnell JE. Methylated, blocked 5 termini in HeLa cell mRNA. Proc Natl Acad Sci U S A. 1975;72(5):1904–1908.
24. Dominissini D, Moshitch-Moshkovitz S, Schwartz S, et al. Topology of the human and mouse m6A RNA methylomes revealed by m6A-seq. Nature. 2012;485(7397):201–206. doi:10.1038/nature11112
25. Liu J, Yue Y, Han D, et al. A METTL3-METTL14 complex mediates mammalian nuclear RNA N6-adenosine methylation. Nat Chem Biol. 2014;10(2):93–95. doi:10.1038/nchembio.1432
26. Wang X, Zhao BS, Roundtree IA, et al. N(6)-methyladenosine modulates messenger RNA translation efficiency. Cell. 2015;161(6):1388–1399. doi:10.1016/j.cell.2015.05.014
27. Wang X, Lu Z, Gomez A, et al. N6-methyladenosine-dependent regulation of messenger RNA stability. Nature. 2014;505(7481):117–120. doi:10.1038/nature12730
28. Zhu T, Roundtree IA, Wang P, et al. Crystal structure of the YTH domain of YTHDF2 reveals mechanism for recognition of N6-methyladenosine. Cell Res. 2014;24(12):1493–1496. doi:10.1038/cr.2014.152
29. Xiao W, Adhikari S, Dahal U, et al. Nuclear m(6)A reader YTHDC1 regulates mRNA splicing. Mol Cell. 2016;61(4):507–519. doi:10.1016/j.molcel.2016.01.012
30. Li A, Chen YS, Ping XL, et al. Cytoplasmic m(6)A reader YTHDF3 promotes mRNA translation. Cell Res. 2017;27(3):444–447. doi:10.1038/cr.2017.10
31. Du H, Zhao Y, He J, et al. YTHDF2 destabilizes m(6)A-containing RNA through direct recruitment of the CCR4-NOT deadenylase complex. Nat Commun. 2016;7:12626. doi:10.1038/ncomms12626
 © 2019 The Author(s). This work is published and licensed by Dove Medical Press Limited. The
full terms of this license are available at https://www.dovepress.com/terms
and incorporate the Creative Commons Attribution
- Non Commercial (unported, 3.0) License.
By accessing the work you hereby accept the Terms. Non-commercial uses of the work are permitted
without any further permission from Dove Medical Press Limited, provided the work is properly
attributed. For permission for commercial use of this work, please see paragraphs 4.2 and 5 of our Terms.
© 2019 The Author(s). This work is published and licensed by Dove Medical Press Limited. The
full terms of this license are available at https://www.dovepress.com/terms
and incorporate the Creative Commons Attribution
- Non Commercial (unported, 3.0) License.
By accessing the work you hereby accept the Terms. Non-commercial uses of the work are permitted
without any further permission from Dove Medical Press Limited, provided the work is properly
attributed. For permission for commercial use of this work, please see paragraphs 4.2 and 5 of our Terms.