Back to Journals » OncoTargets and Therapy » Volume 9
Expression profile analysis of long noncoding RNA in HER-2-enriched subtype breast cancer by next-generation sequencing and bioinformatics
Authors Yang F, Lv S, Dong S, Liu Y, Zhang X, Wang O
Received 5 October 2015
Accepted for publication 11 December 2015
Published 12 February 2016 Volume 2016:9 Pages 761—772
DOI https://doi.org/10.2147/OTT.S97664
Checked for plagiarism Yes
Review by Single anonymous peer review
Peer reviewer comments 3
Editor who approved publication: Dr William C. Cho
Fan Yang, Shixu Lyu, Siyang Dong, Yehuan Liu, Xiaohua Zhang, Ouchen Wang
Department of Surgical Oncology, The First Affiliated Hospital of Wenzhou Medical University, Wenzhou, Zhejiang, People’s Republic of China
Background: Human epidermal growth factor receptor 2 (HER-2)-enriched subtype breast cancer is associated with a more aggressive phenotype and shorter survival time. Long noncoding RNAs (LncRNAs) have essential roles in tumorigenesis and occupy a central place in cancer progression. Notably, few studies have focused on the dysregulation of LncRNAs in the HER-2-enriched subtype breast cancer. In this study, we analyzed the expression profile of LncRNAs and mRNAs in this particular subtype of breast cancer.
Methods: Seven pairs of HER-2-enriched subtype breast cancer and normal tissue were sequenced. We screened out differently expressed genes and measured the correlation of the expression levels of dysregulated LncRNAs and HER-2 by Pearson’s correlation coefficient analysis. Gene ontology analysis and pathway analysis were used to understand the biological roles of these differently expressed genes. Pathway act network and coexpression network were constructed.
Results: More than 1,300 LncRNAs and 2,800 mRNAs, which were significantly differently expressed, were identified. Among these LncRNAs, AFAP1-AS1 was the most dysregulated LncRNA, while ORM2 was the most dysregulated mRNA. LOC100288637 had the highest positive correlation coefficient of 0.93 with HER-2, while RPL13P5 had the highest negative correlation coefficient of -0.87. The pathway act network showed that MAPK signaling pathway, PI3K-Akt signaling pathway, metabolic pathways, cell cycle, and regulation of actin cytoskeleton were highly related with HER-2-enriched subtype breast cancer. Coexpression network recognized LINC00636, LINC01405, ADARB2-AS1, ST8SIA6-AS1, LINC00511, and DPP10-AS1 as core genes.
Conclusion: These results analyze the functions of LncRNAs and provide useful information for exploring candidate therapeutic targets and new molecular biomarkers for HER-2-enriched subtype breast cancer.
Keywords: ncRNA, breast cancer, gene ontology, pathway analysis, coexpression network
Background
Breast cancer, one of the most common malignant tumors, is a molecularly heterogeneous disease that includes four major tumor subtypes at least.1–3 Human epidermal growth factor receptor 2 (HER-2)-enriched subtype is characterized by HER-2 overexpression and/or amplification with a lack of hormone receptor. HER-2-enriched subtype breast cancer is associated with a more aggressive phenotype and shorter survival time.4,5 Although HER-2-targeted agents such as trastuzumab have dramatically improved prognosis of patients with HER-2 overexpression, resistance to such agents remained a severe problem.6 Hence, the underlying molecular mechanisms of the malignant phenotype of HER-2-enriched subtype breast cancer need to be elucidated, and new therapeutic targets need further research.
Noncoding RNAs (ncRNAs) are RNA transcripts that do not code for proteins. General conventions divide ncRNAs into two main categories: small ncRNAs <200 bp and long noncoding RNAs (LncRNAs) >200 bp.7 Recent discoveries analyzed the functions of LncRNAs in human cancers, supporting the fact that they had essential roles in tumorigenesis and occupied a central place in cancer progression.8,9
Notably, few studies have focused on the dysregulation of LncRNAs in the HER-2-enriched subtype breast cancer. In this study, we sequenced the expression profile of LncRNAs and messenger RNAs (mRNAs) in HER-2-enriched subtype breast cancer samples and adjacent nontumorous tissue. More than 1,300 LncRNAs and 2,800 mRNAs that were significantly differently expressed were identified. Gene ontology (GO) analysis and pathway analysis were used to understand the biological roles of these differently expressed genes. Pathway act network illustrated the pathways occupying a central place in HER-2-enriched subtype breast cancer. Coexpression network revealed several LncRNAs having important regulation and control ability, which might hopefully work as candidate therapeutic targets and new molecular biomarkers for HER-2-enriched subtype breast cancer.
Materials and methods
Patient samples
Written informed consent was obtained from all patients and the study was approved by the Ethics Committee of the First Affiliated Hospital of Wenzhou Medical University, Wenzhou, Zhejiang, People’s Republic of China. Seven breast cancer patients who received modified radical mastectomy were included in this study. All patients were diagnosed with HER-2-enriched subtype breast cancer by pathology and immunohistochemistry (IHC) after surgery. IHC results showing a 2+ HER-2 level were further tested using fluorescence in situ hybridization (FISH). Patients having a 3+ HER-2 level as tested by IHC or having HER-2 gene amplification as evidenced by FISH along with a lack of both estrogen receptor and progesterone receptor were regarded as having HER-2-enriched subtype breast cancer. Primary breast cancer tissues and their adjacent normal breast tissues were snap-freezed in liquid nitrogen immediately after resection and then stored at −80°C before RNA extraction. Detailed information of all cases in the study is summarized in Table S1.
RNA extraction and sequencing
Total RNA was extracted from tissue samples using the TRIzol reagent (Thermo Fisher Scientific, Waltham, MA, USA) according to the manufacturer’s protocol. The cDNA libraries for single-end sequencing were prepared using Ion Total RNA-Seq Kit v2.0 (Life Technologies) according to the manufacturer’s instructions. The cDNA libraries were then processed for the Proton (Life Technologies) sequencing process according to the commercially available protocols.
Mapping and identification of differently expressed genes
Before reads mapping, clean reads were obtained from the raw reads by removing the adaptor sequences, reads with >5% ambiguous bases, and low-quality reads. The clean reads were then aligned to the human genome (version: GRCH37) using the MapSplice program (v2.1.6, University of Kentucky, Lexington, KY, USA). We applied EBseq algorithm to screen out the differently expressed genes using the following criteria: 1) fold change (FC) >2 for up- or downregulation and 2) false discovery rate (FDR) <0.05. A volcano plot was drawn by the R based on the differently expressed gene analysis and the color was determined by the filtering criteria. Pearson’s correlation coefficient was calculated to measure the linear correlation of the expression levels of LncRNAs and HER-2.
GO analysis and pathway analysis
GO analysis was carried out to facilitate elucidating the biological implications of unique genes in the significant or representative profiles of the differently expressed genes in the experiment.10 We downloaded the GO annotations from Gene Ontology (http://www.geneontology.org/). Fisher’s exact test was applied to identify the significant GO terms, and FDR was utilized to correct the P-values. Pathway analysis was utilized to find out the significant pathways of the differently expressed genes according to Kyoto Encyclopedia of Genes and Genomes database (KEGG). We turned to the Fisher’s exact test to select the significant pathways, and the threshold of significance was defined by P-value and FDR.11
Construction of pathway act network and coexpression network
We chose genes enriched in significant biological pathways (P<0.05) and used Cytoscape (V3.2.0; Institute of Systems Biology, Seattle, WA, USA) to construct a pathway act network for graphical representations of central pathways.12 A coexpression network based on the correlation analysis between the differently expressed LncRNAs and mRNAs associated with cancer was constructed.13 LncRNAs and mRNAs with Pearson’s correlation coefficients >0.99 were used to construct the network. K-core scoring was used to identify core regulatory genes in networks. A k-core of a given gene indicated its hub or nodal status with connections to other genes in a network.14 Accordingly, a higher k-core score meant a more central location of a gene within a network. Core regulatory factors were determined by the k-core difference (difk-core) between two groups of samples.
Results
LncRNAs and mRNAs expression profiles in HER-2-enriched subtype breast cancer
Volcano plot was used for assessing gene expression variation between the HER-2-enriched subtype breast cancer and adjacent normal tissue (Figure 1A). Genes with FC >2 for both up- or downregulation and FDR <0.05 were identified as significantly differently expressed. Compared to the normal breast tissues, a total of 1,382 LncRNAs displayed differential expression in tumor tissues, including 722 upregulated LncRNAs and 660 downregulated LncRNAs (Figure 1B). We found 2,879 differently expressed mRNAs, of which 722 were upregulated and were 2,157 downregulated (Figure 1C). Hierarchical clustering showed systematic variations in the expression of LncRNAs and mRNAs in the HER-2-enriched subtype breast cancer samples (Figure 1D and E). The most dysregulated LncRNAs and mRNAs are shown in Tables 1 and 2. Among these significantly differently expressed LncRNAs, AFAP1-AS1 (GeneID 84740) was the most dysregulated LncRNA with an FC of 9.79, while ORM2 (GeneID 5005) was the most dysregulated mRNA with an FC of 9.85.
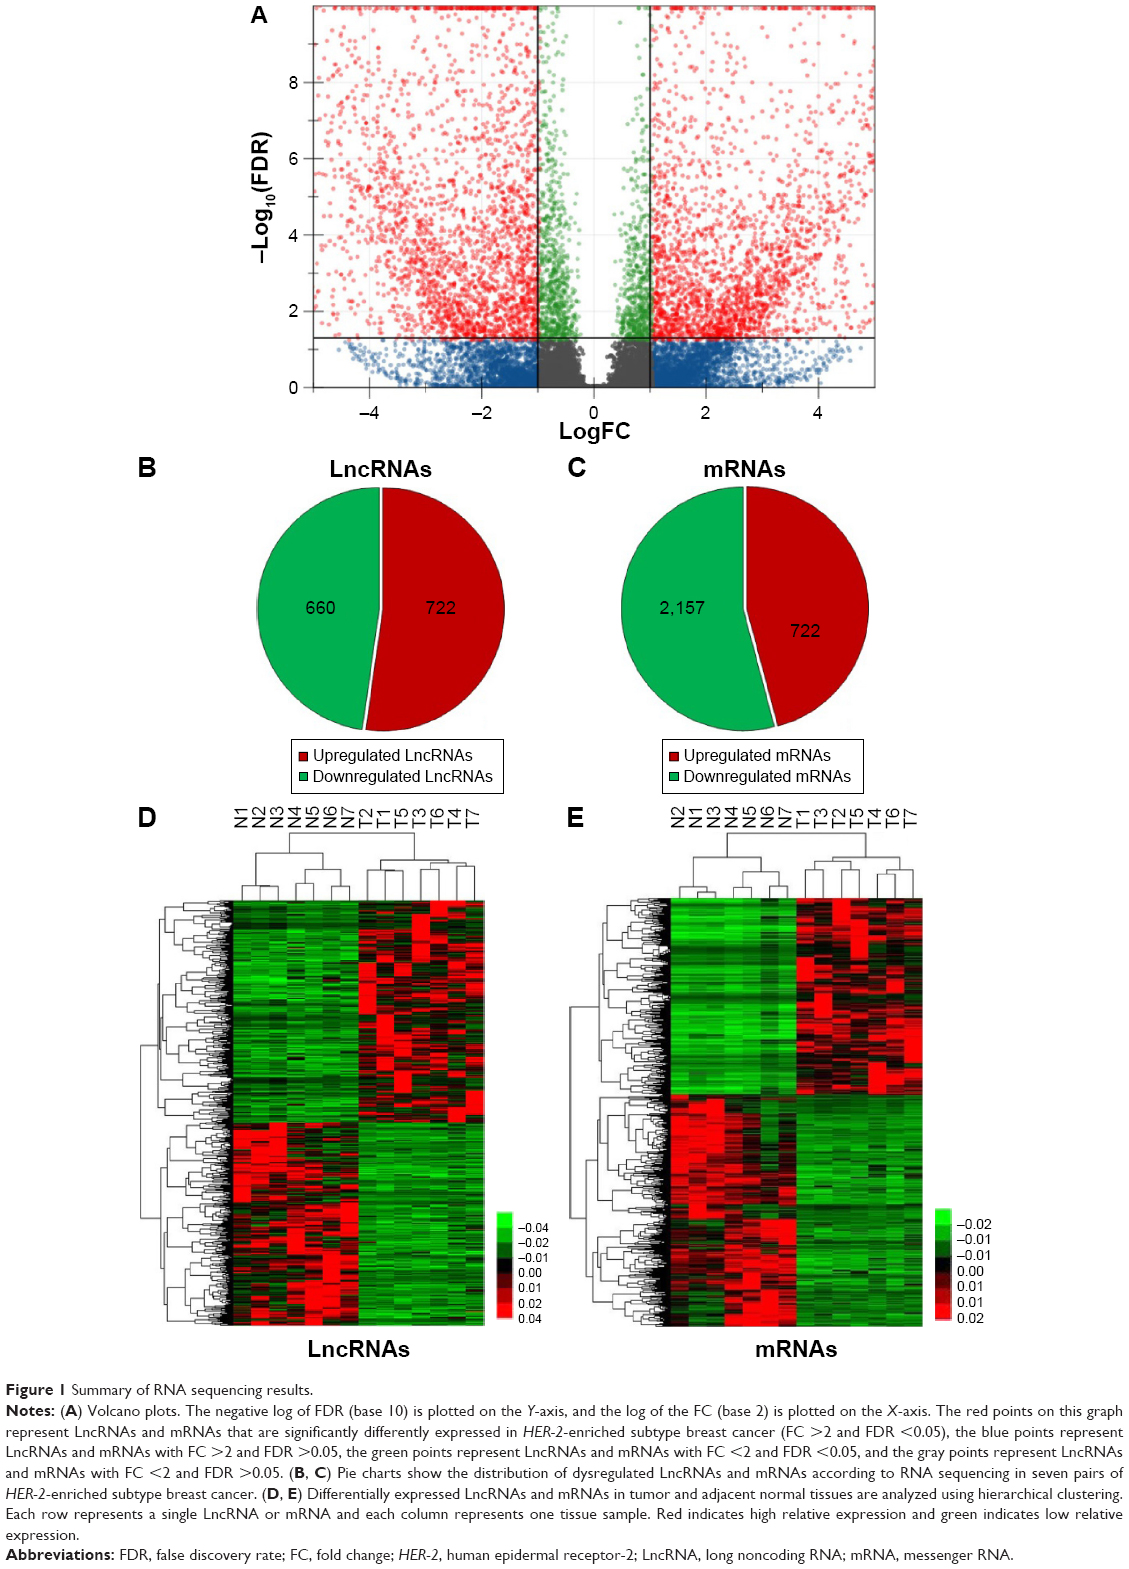 | Figure 1 Summary of RNA sequencing results. |
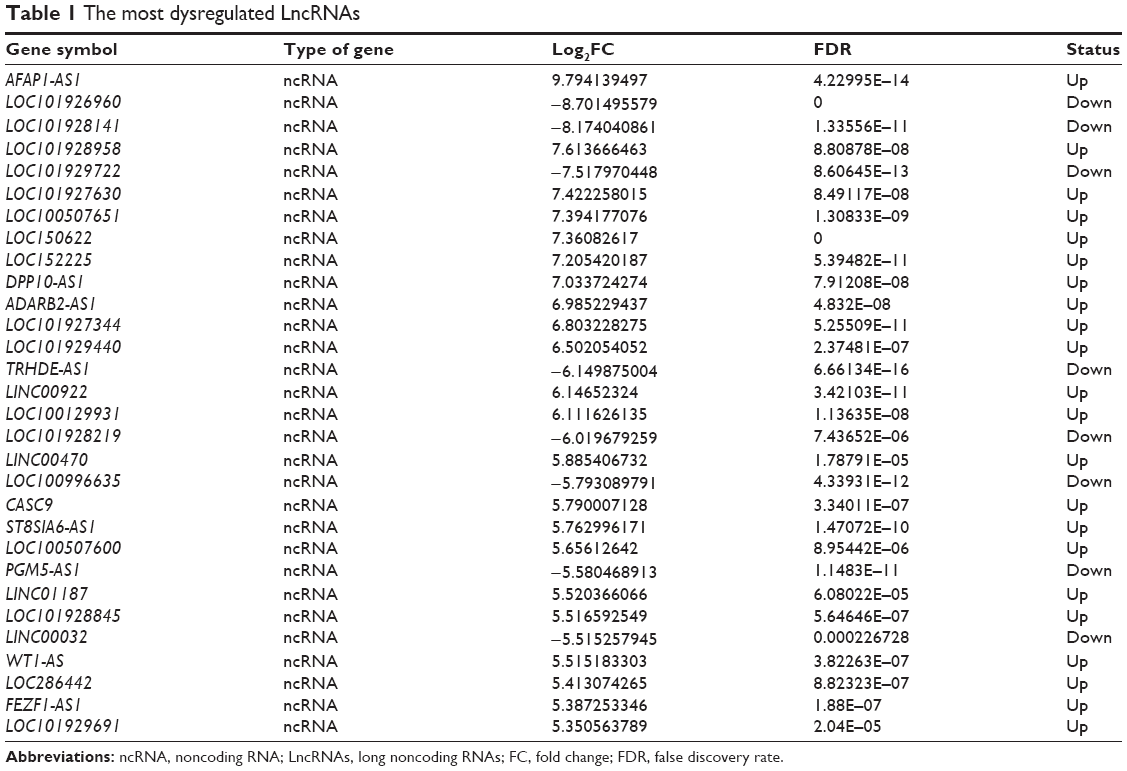 | Table 1 The most dysregulated LncRNAs |
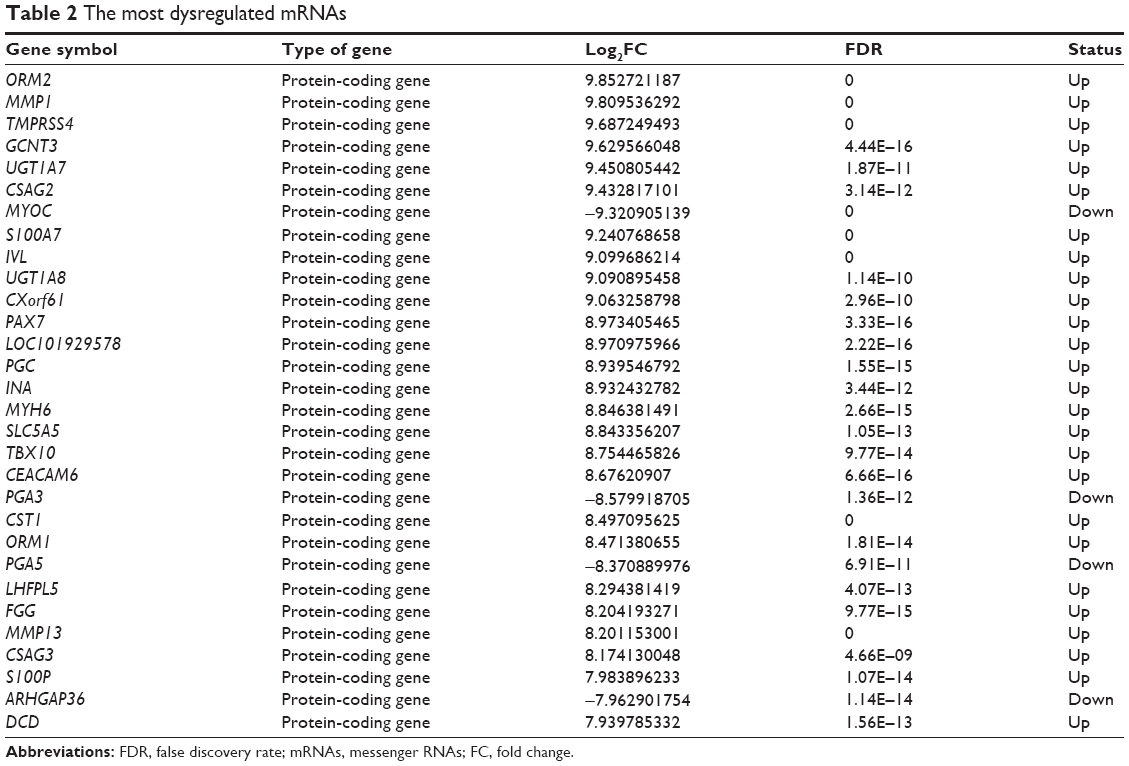 | Table 2 The most dysregulated mRNAs |
Expression correlation between LncRNAs and HER-2
We performed Pearson’s correlation coefficient analysis to measure the correlation of the expression levels between the 1,382 dysregulated LncRNAs and HER-2 (Table S2). LOC100288637 (GeneID 100288637) had the highest positive correlation coefficient of 0.93 with HER-2, while RPL13P5 (GeneID 283345) had the highest negative correlation coefficient of −0.87.
Function analysis of differently expressed genes
GO and KEGG pathway analysis of differently expressed mRNAs provided a measure of the critical function. We included all differently expressed mRNAs for GO analysis and found that the most enriched GO was correlation with cell adhesion in the GO biological process analysis (Figure 2A). Meanwhile, the majority of the genes were proven to be related to the extracellular region in the cellular component analysis and calcium ion binding in the molecular function (Figure 2B and C). In the KEGG pathway analysis, the dysregulated mRNAs were found to be enriched in 41 pathways (Table S3). The most enriched pathway included cytokine–cytokine receptor interaction, steroid hormone biosynthesis, and protein digestion and absorption (Figure 2D).
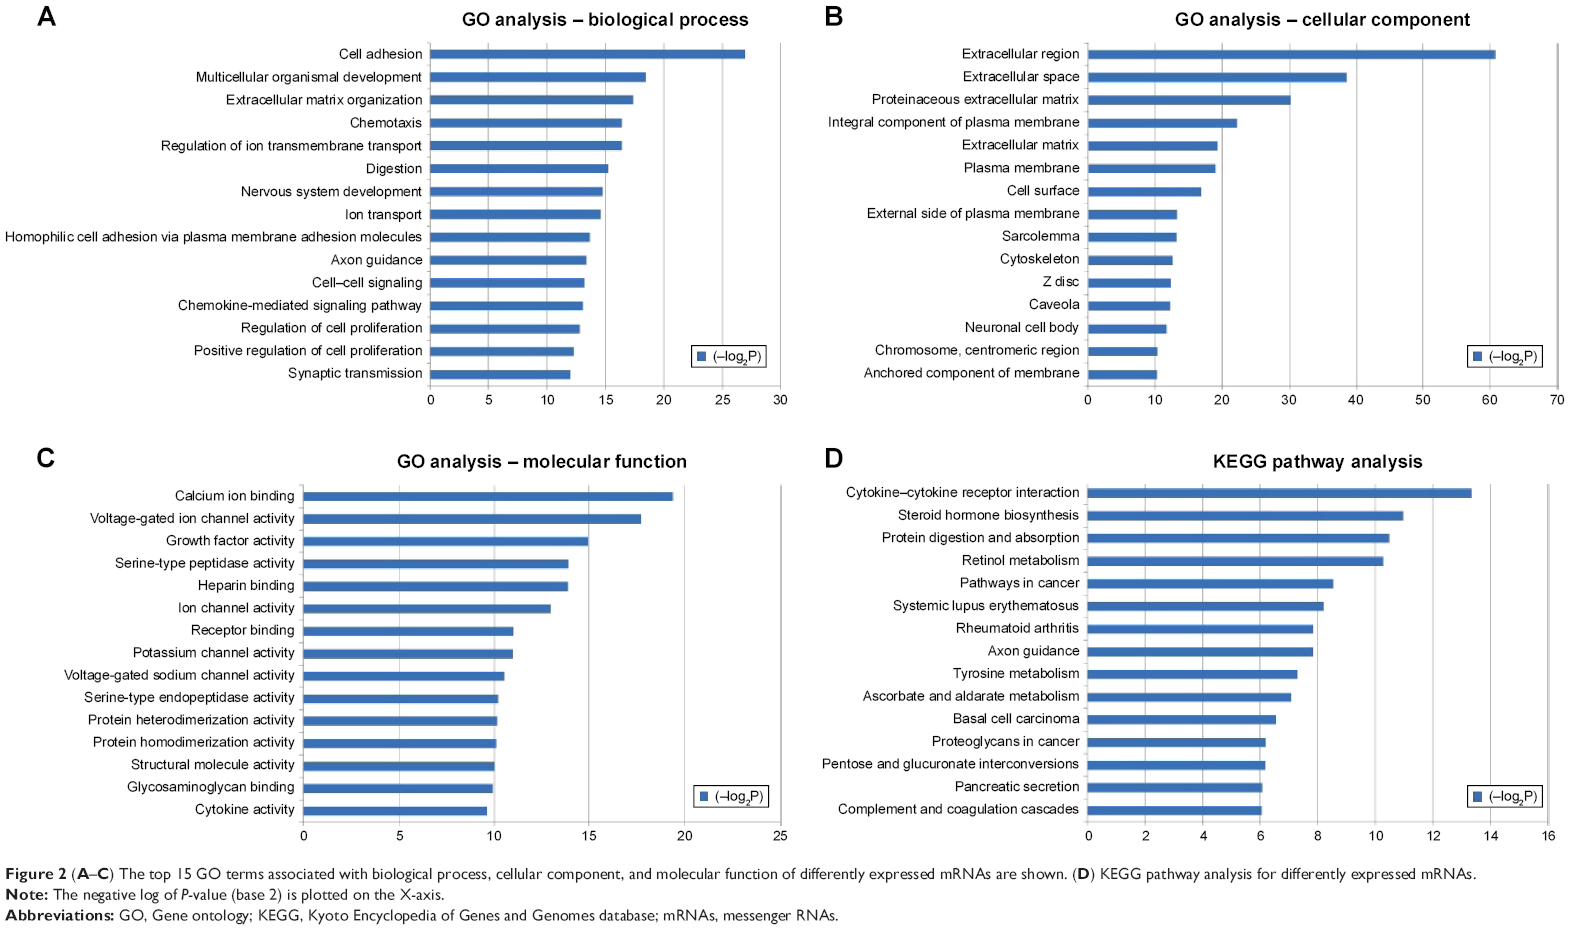 | Figure 2 (A–C) The top 15 GO terms associated with biological process, cellular component, and molecular function of differently expressed mRNAs are shown. (D) KEGG pathway analysis for differently expressed mRNAs. |
Pathway act network
A pathway act network was constructed using 41 significantly enriched pathways to illustrate the key pathways in the process of HER-2-enriched subtype breast cancer (Figure 3). Our finding indicated that the MAPK signaling pathway, PI3K-Akt signaling pathway, metabolic pathways, and cell cycle and regulation of actin cytoskeleton were considered to be the most important nodes in the net because the component exchanges with other pathways were strongly dependent on their existence.
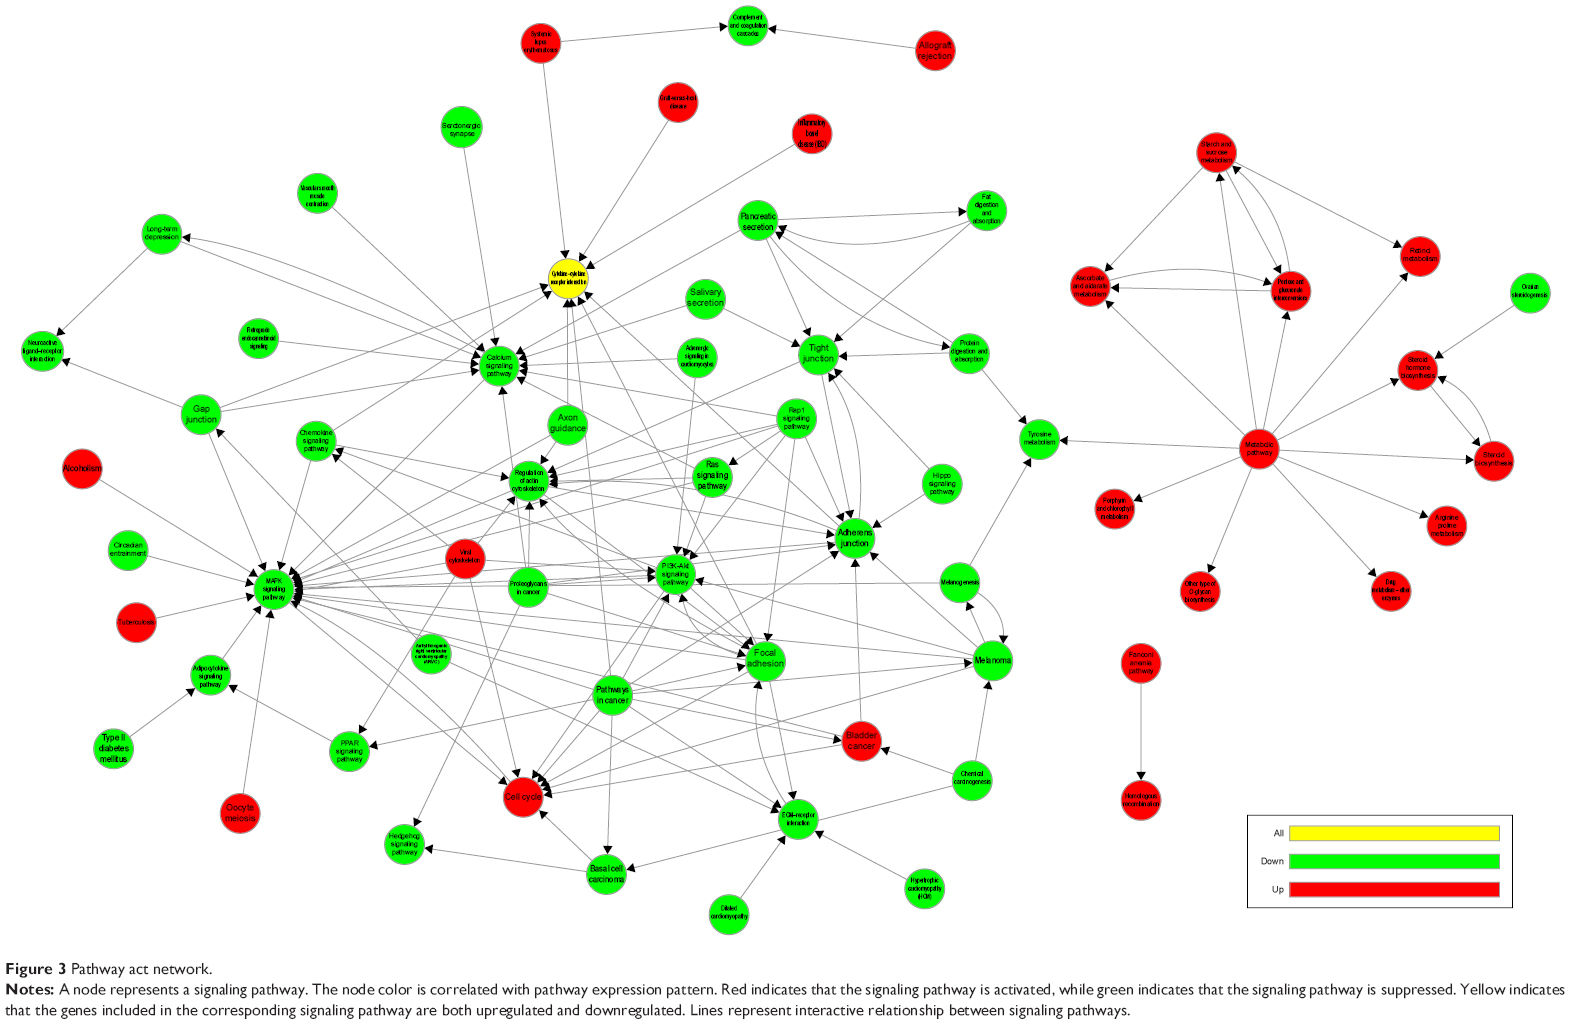 | Figure 3 Pathway act network. |
Coexpression network
Coexpression network was constructed for HER-2 enriched subtype breast cancer group and adjacent normal tissue group, using expressed LncRNAs and mRNAs that were significantly different. (Figure 4A and B). The coexpression network in the tumor group comprised 649 network nodes and 2,169 connections, including 27 that were negatively connected and 2,142 that were positively connected. The network in the normal group contains 729 network nodes and 2,341 connections, including 1,785 pairs that presented as positive, and 556 pairs that presented as negative. This result demonstrated that there were obviously different coexpression patterns between the tumor group and the normal group. LINC00636 (GeneID 285205) and LINC01405 (GeneID 100131138) had the highest k-core score in the tumor group. ADARB2-AS1 (GeneID 642394), ST8SIA6-AS1 (GeneID 100128098), LINC00511 (GeneID 400619), and DPP10-AS1 (GeneID 389023) had the highest k-core score in the normal group. Coexpressed genes with higher difk-core scoring were considered to have important regulation and control ability. Our data indicated that the aforementioned six LncRNAs, having highest difk-core scoring, were the central genes within the coexpression network (Figure 4C).
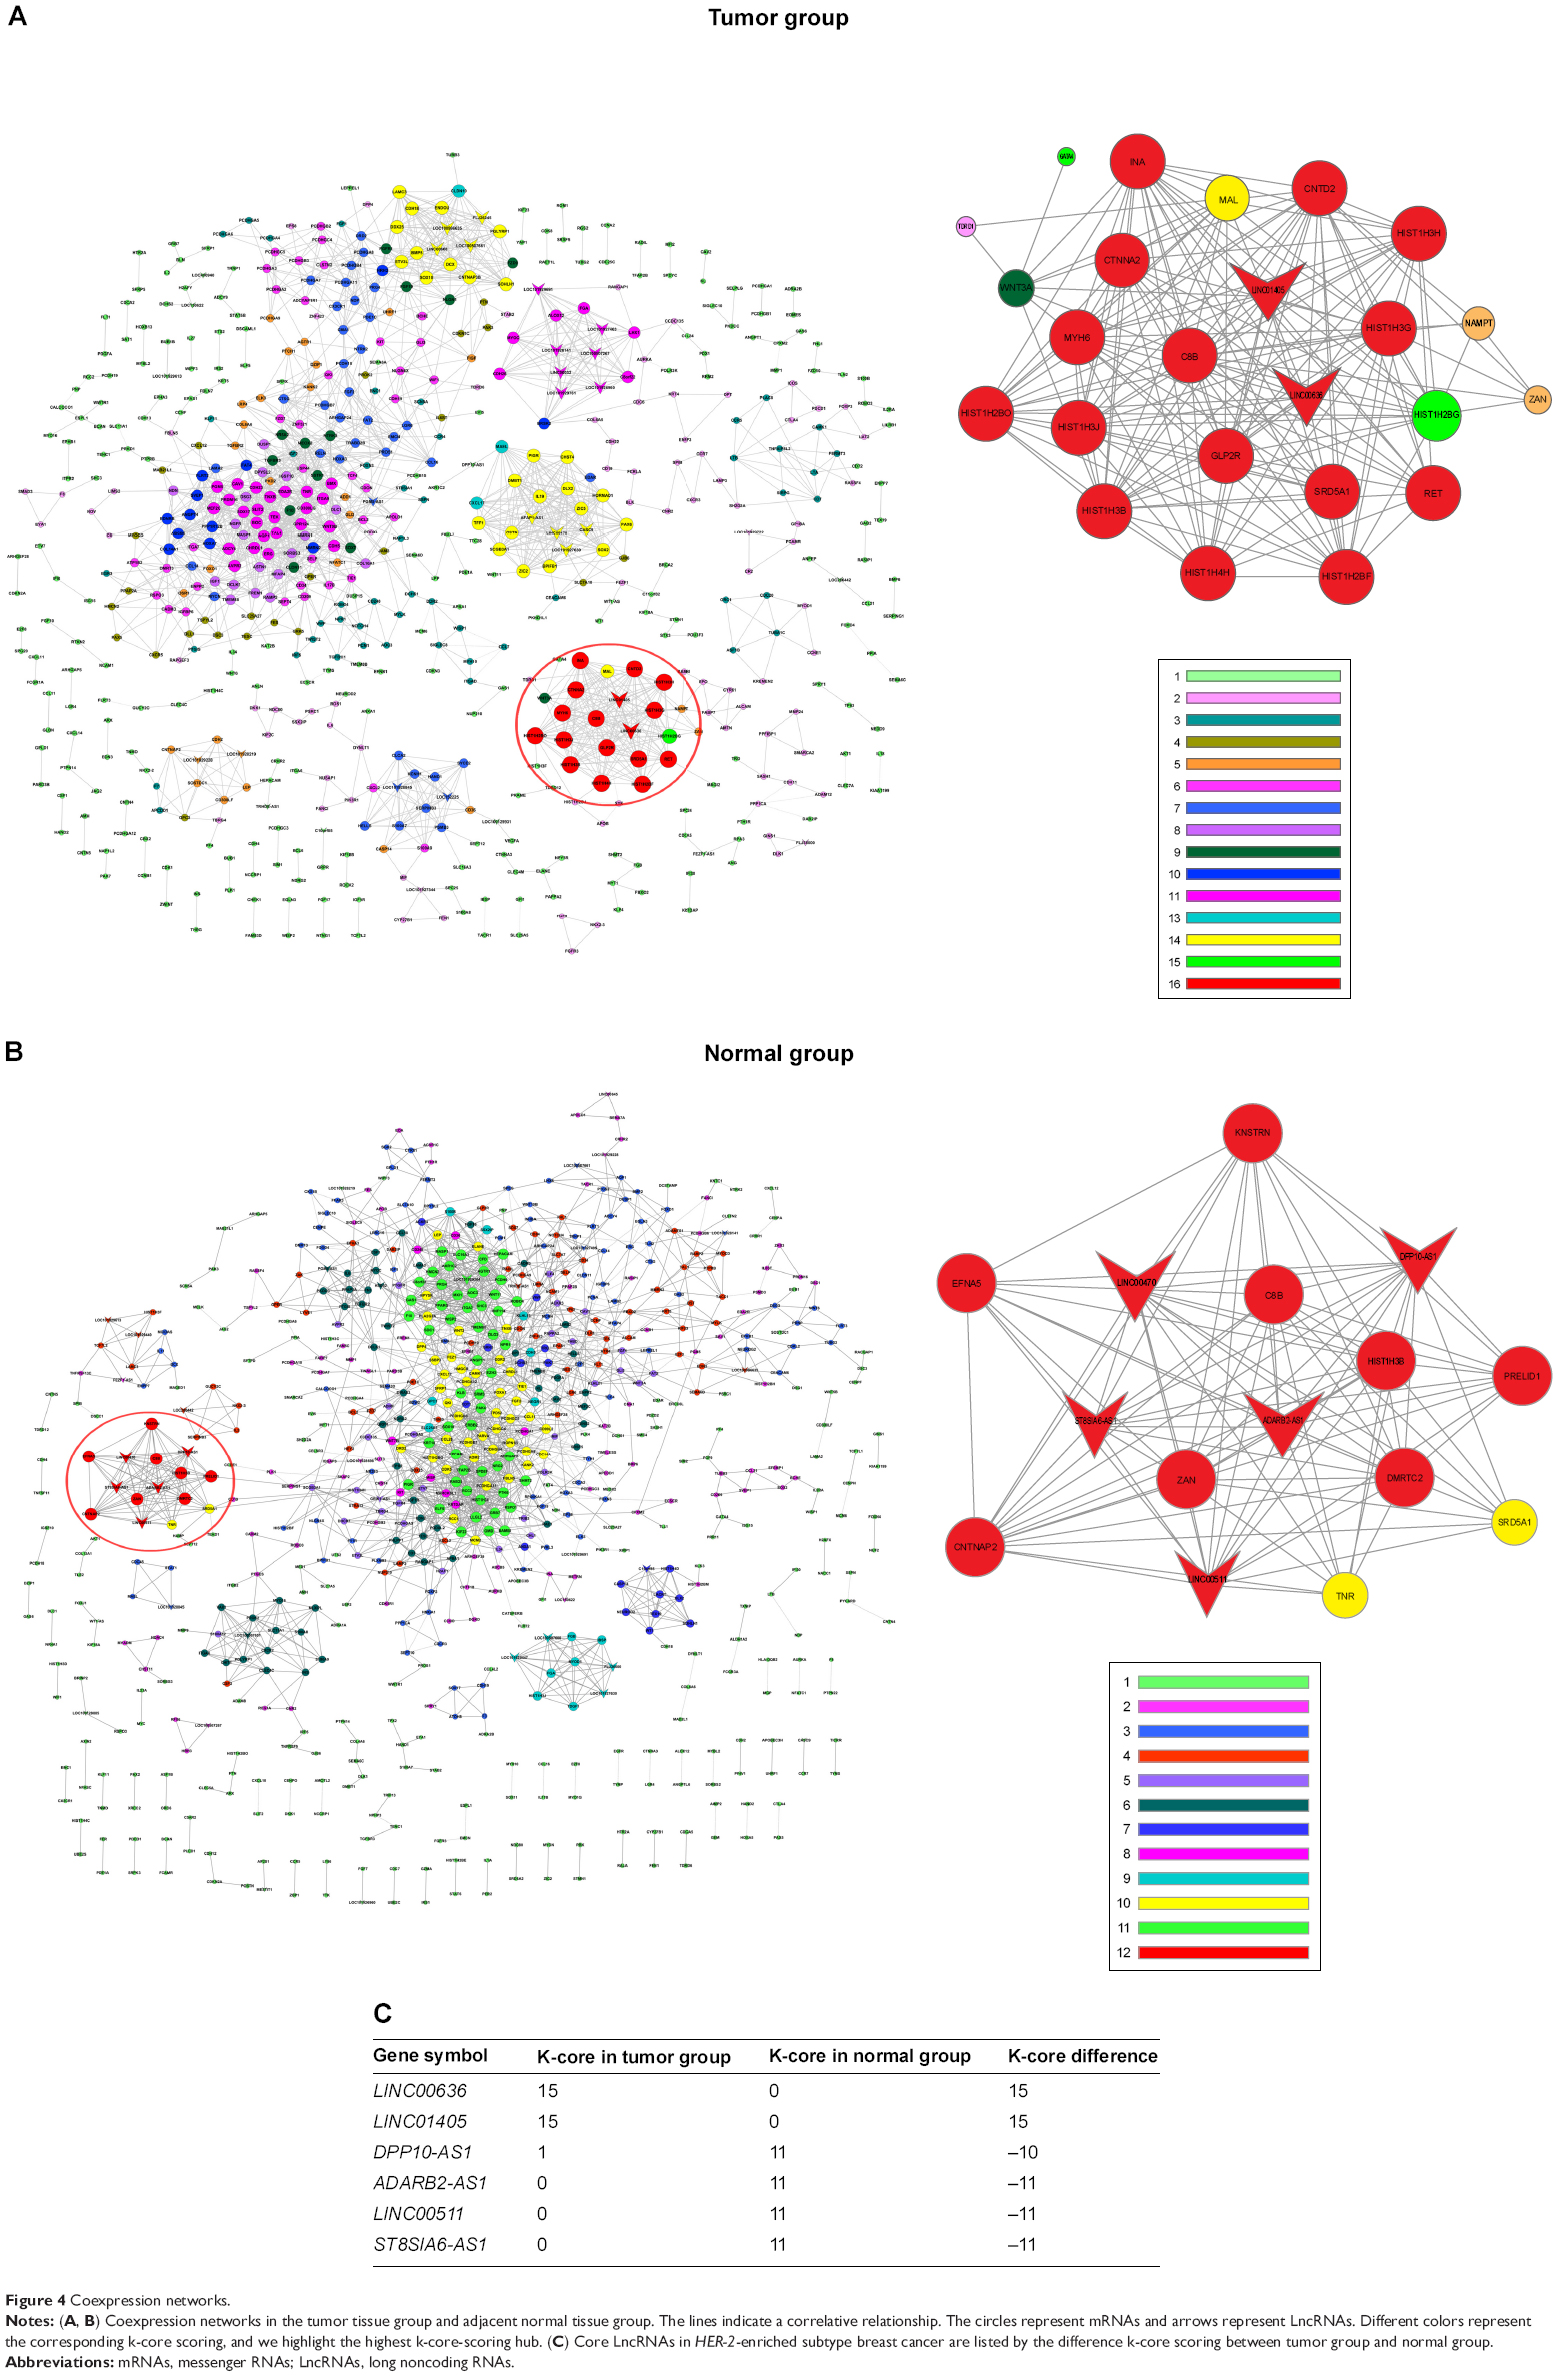 | Figure 4 Coexpression networks. |
Discussion
With the emergence of studies focusing on the functional attributes of LncRNAs, it has been revealed that LncRNAs may contribute significantly to physiological processes as well as pathological conditions. Some LncRNAs may act as tumor suppressor genes,15–17 whereas others may be defined as oncogenes.18–20 However, LncRNAs have just begun to be understood, and the majority of them have yet to be researched. Xu et al21 analyzed LncRNAs’ expression profile in human breast cancers by using microarrays. Then, Shen et al22 researched LncRNAs’ expression in triple-negative breast cancer and found that a lot of LncRNAs were differently expressed. Breast cancer is a molecularly heterogeneous disease, and so LncRNAs’ expression pattern in other subtypes needs to be identified. To the best of our knowledge, this study is the first comprehensive description of differentially expressed LncRNAs in HER-2-enriched subtype breast cancer. We sequenced seven pairs of HER-2-enriched subtype breast cancer and normal tissue and found significantly differently expressed genes. Furthermore, functions of these genes were analyzed by bioinformatics.
Pathway act network showed that MAPK signaling pathway, PI3K-Akt signaling pathway, metabolic pathways, and cell cycle and regulation of actin cytoskeleton were highly related with HER-2-enriched subtype breast cancer. It has been reported that MAPK signaling pathway could promote proliferation and angiogenesis. HER-2-targeted drugs, trastuzumab and lapatinib, may exert their action through MAPK signaling pathway.23 Agents targeting the PI3K-Akt pathway could restore sensitivity to standard breast cancer therapies, including endocrine, HER-2-targeted agents, and chemotherapy.24 Guerram et al25 found that targeting inhibited apoptotic and metabolic signaling pathways could lead to cancer cell death, especially in HER-2-overexpressed breast cancer. It was also pointed out that suppressed actin cytoskeleton pathway inhibited cell motility in breast cancer.26 These reports are consistent with our finding that these pathways are worth being further studied for potential therapeutic value.
Coexpression network showed six LncRNAs as core genes in HER-2-enriched subtype breast cancer. Except for LINC00511 (also known as onco-LncRNA-12), there is a dearth of research on the other LncRNAs. LINC00511 was reported to be upregulated in breast cancer and led to lung cancer cell growth decrease when LINC00511 was knocked down.27 Hence, LINC00511 was defined as an oncogene. This supports our findings that these LncRNAs are crucial genes in tumorigenesis. The remaining five LncRNAs, which might hopefully become candidate therapeutic targets and new molecular biomarkers, are still worth further research.
Limitations
Our study still has several limitations. For one thing, breast cancer is a highly heterogeneous disease while our sample size of sequenced tissues is limited. Therefore, our results might not represent robust LncRNAs expression signature in HER-2-enriched subtype breast cancer. Another limitation is that the functions of these core LncRNAs have yet to be determined. Further in vitro and in vivo experiments are currently being conducted by our group to investigate the biological effects of the aforementioned LncRNAs.
Conclusion
The dysregulated LncRNAs and mRNAs expression profiles were sequenced and analyze in HER-2 enriched subtype breast cancer in this study. These results analyze the functions of LncRNAs and provide useful information for exploring candidate therapeutic targets and new molecular biomarkers for HER-2 enriched subtype breast cancer.
Acknowledgments
This study was funded by Key Project of Science and Technology Innovation Team of Zhejiang Province (2013TD10) and National Natural Science Foundation of China (Number 81372380).
Disclosure
The authors report no conflicts of interest in this work.
References
Siegel RL, Miller KD, Jemal A. Cancer statistics. CA Cancer J Clin. 2015;65(1):5–29. | ||
Perou CM, Sorlie T, Eisen MB, et al. Molecular portraits of human breast tumours. Nature. 2000;406(6797):747–752. | ||
Sorlie T, Perou CM, Tibshirani R, et al. Gene expression patterns of breast carcinomas distinguish tumor subclasses with clinical implications. Proc Natl Acad Sci U S A. 2001;98(19):10869–10874. | ||
Sorlie T, Tibshirani R, Parker J, et al. Repeated observation of breast tumor subtypes in independent gene expression data sets. Proc Natl Acad Sci U S A. 2003;100(14):8418–8423. | ||
Chien AJ, Rugo HS. Emerging treatment options for the management of brain metastases in patients with HER2-positive metastatic breast cancer. Breast Cancer Res Treat. 2013;137(1):1–12. | ||
Moasser MM, Krop IE. The evolving landscape of HER2 targeting in breast cancer. JAMA Oncol. 2015;1(8):1154–1161. | ||
Gibb EA, Brown CJ, Lam WL. The functional role of long non-coding RNA in human carcinomas. Mol Cancer. 2011;10(1):38. | ||
Gupta RA, Shah N, Wang KC, et al. Long non-coding RNA HOTAIR reprograms chromatin state to promote cancer metastasis. Nature. 2010;464(7291):1071–1076. | ||
Pauli A, Rinn JL, Schier AF. Non-coding RNAs as regulators of embryogenesis. Nat Rev Genet. 2011;12(2):136–149. | ||
Ashburner M, Ball CA, Blake JA, et al. Gene ontology: tool for the unification of biology. The Gene Ontology Consortium. Nat Genet. 2000;25(1):25–29. | ||
Draghici S, Khatri P, Tarca AL, et al. A systems biology approach for pathway level analysis. Genome Res. 2007;17(10):1537–1545. | ||
Smoot ME, Ono K, Ruscheinski J, Wang PL, Ideker T. Cytoscape 2.8: new features for data integration and network visualization. Bioinformatics. 2011;27(3):431–432. | ||
Prieto C, Risueno A, Fontanillo C, De las Rivas J. Human gene coexpression landscape: confident network derived from tissue transcriptomic profiles. PLoS One. 2008;3(12):e3911. | ||
Ravasz E, Somera AL, Mongru DA, Oltvai ZN, Barabasi AL. Hierarchical organization of modularity in metabolic networks. Science. 2002;297(5586):1551–1555. | ||
Hu L, Ye H, Huang G, et al. Long noncoding RNA GAS5 suppresses the migration and invasion of hepatocellular carcinoma cells via miR-21. Tumour Biol. Epub 2015 Sep 24. doi:10.1007/s13277–015–4111-x. | ||
Russell MR, Penikis A, Oldridge DA, et al. CASC15-S is a tumor suppressor lncRNA at the 6p22 neuroblastoma susceptibility locus. Cancer Res. 2015;75(15):3155–3166. | ||
Salameh A, Lee AK, Cardo-Vila M, et al. PRUNE2 is a human prostate cancer suppressor regulated by the intronic long noncoding RNA PCA3. Proc Natl Acad Sci U S A. 2015;112(27):8403–8408. | ||
Huang JL, Ren TY, Cao SW, et al. HBx-related long non-coding RNA DBH-AS1 promotes cell proliferation and survival by activating MAPK signaling in hepatocellular carcinoma. Oncotarget. 2015;6(32):33791–33804. | ||
Li T, Xie J, Shen C, et al. Upregulation of long noncoding RNA ZEB1-AS1 promotes tumor metastasis and predicts poor prognosis in hepatocellular carcinoma. Oncogene. Epub 2015 Jun 15. doi:10.1038/onc.2015.223. | ||
Li T, Xie J, Shen C, et al. Amplification of long noncoding RNA ZFAS1 promotes metastasis in hepatocellular carcinoma. Cancer Res. 2015;75(15):3181–3191. | ||
Xu N, Wang F, Lv M, Cheng L. Microarray expression profile analysis of long non-coding RNAs in human breast cancer: a study of Chinese women. Biomed Pharmacother. 2015;69:221–227. | ||
Shen X, Xie B, Ma Z, et al. Identification of novel long non-coding RNAs in triple-negative breast cancer. Oncotarget. 2015;6(25):21730–21739. | ||
Adeyinka A, Nui Y, Cherlet T, Snell L, Watson PH, Murphy LC. Activated mitogen-activated protein kinase expression during human breast tumorigenesis and breast cancer progression. Clin Cancer Res. 2002;8(6):1747–1753. | ||
Abraham J. PI3K/AKT/mTOR pathway inhibitors: the ideal combination partners for breast cancer therapies? Expert Rev Anticancer Ther. 2015;15(1):51–68. | ||
Guerram M, Jiang ZZ, Yousef BA, et al. The potential utility of acetyltanshinone IIA in the treatment of HER2-overexpressed breast cancer: induction of cancer cell death by targeting apoptotic and metabolic signaling pathways. Oncotarget. 2015;6(26):21865–21877. | ||
Hu X, Guo J, Zheng L, et al. The heterochronic microRNA let-7 inhibits cell motility by regulating the genes in the actin cytoskeleton pathway in breast cancer. Mol Cancer Res. 2013;11(3):240–250. | ||
Cabanski CR, White NM, Dang HX, et al. Pan-cancer transcriptome analysis reveals long noncoding RNAs with conserved function. RNA Biol. 2015;12(6):628–642. |
 © 2016 The Author(s). This work is published and licensed by Dove Medical Press Limited. The
full terms of this license are available at https://www.dovepress.com/terms
and incorporate the Creative Commons Attribution
- Non Commercial (unported, 3.0) License.
By accessing the work you hereby accept the Terms. Non-commercial uses of the work are permitted
without any further permission from Dove Medical Press Limited, provided the work is properly
attributed. For permission for commercial use of this work, please see paragraphs 4.2 and 5 of our Terms.
© 2016 The Author(s). This work is published and licensed by Dove Medical Press Limited. The
full terms of this license are available at https://www.dovepress.com/terms
and incorporate the Creative Commons Attribution
- Non Commercial (unported, 3.0) License.
By accessing the work you hereby accept the Terms. Non-commercial uses of the work are permitted
without any further permission from Dove Medical Press Limited, provided the work is properly
attributed. For permission for commercial use of this work, please see paragraphs 4.2 and 5 of our Terms.