
Back to Journals » Journal of Inflammation Research » Volume 18
Exploring the Potential Value of Lactylation and Macrophage Polarization-Related Genes as Biomarkers for TNF-α Inhibitor Response in Inflammatory Bowel Disease
Authors Han L  , Lin G, Lv X, Li S, Huang Z, Li Y, Chen D , Chen X, Lin J, Chen L, Lv X
Received 29 July 2025
Accepted for publication 16 December 2025
Published 30 December 2025 Volume 2025:18 Pages 18205—18228
DOI https://doi.org/10.2147/JIR.S556906
Checked for plagiarism Yes
Review by Single anonymous peer review
Peer reviewer comments 2
Editor who approved publication: Dr Nadia Andrea Andreani
Lichun Han,1,* Guangfu Lin,1,* Xiaodan Lv,2 Shiquan Li,1 Zhixi Huang,1 Yu Li,1 Deyi Chen,1 Xuemin Chen,1 Jianing Lin,1 Liyan Chen,1 Xiaoping Lv1
1Department of Gastroenterology, The First Affiliated Hospital of Guangxi Medical University, Nanning, People’s Republic of China; 2Department of Clinical Experimental Medicine, The First Affiliated Hospital of Guangxi Medical University, Nanning, People’s Republic of China
*These authors contributed equally to this work
Correspondence: Xiaoping Lv, Department of Gastroenterology, The First Affiliated Hospital of Guangxi Medical University, No. 6 Shuang Yong Road, Nanning, 530021, People’s Republic of China, Email [email protected]
Background: Lactylation has emerged as a novel post-translational modification, and genes linked to both lactylation and macrophage polarization may play a role in inflammatory bowel disease (IBD). However, the connection between these genes and TNF-α inhibitor response in IBD remained unclear.
Methods: This study used bioinformatic tools including weighted gene co-expression network analysis (WGCNA), immune infiltration analysis, and machine learning algorithms to identify correlations between lactylation and macrophage-related genes and TNF-α inhibitor response in IBD.
Results: Significant differential expression of MNDA, CALD1, RECQL, and RBM10 was identified between the remission and non-remission groups in the pre-treatment data. Based on these findings, we established a predictive model for TNF-α inhibitor response, achieving an ROC performance with training AUC reaching 0.894 and validation AUC reaching 0.883. Furthermore, MNDA, LGALS1, ZYX, ADAR, and WAS were significantly elevated in the non-remission group 4– 6 weeks after initial treatment. Immune infiltration analysis further indicated strong correlations between hub genes expression and immune cell proportions. In addition, GSEA identified signaling pathways associated with TNF-α inhibitor response. To validate these observations, TNF-α inhibitor was administered to mice with TNBS-induced colitis, and the expression of hub genes was confirmed by RT-qPCR. Importantly, combination therapy with lactate supplementation enhanced the efficacy of TNF-α inhibitor treatment compared with monotherapy. Finally, analysis of lactylation levels indicated intergroup differences associated with TNF-α inhibitor treatment in IBD.
Conclusion: Overall, we identified lactylation and macrophage-related genes as potential biomarkers for TNF-α inhibitor response. Lactate supplementation was found to enhance the efficacy of TNF-α inhibitor based on animal experimental validation. Nevertheless, the findings were based on secondary analyses of public datasets, and the animal experiments remained preliminary. Further studies should be conducted to validate these findings and explore the molecular pathways involved.
Keywords: inflammatory bowel disease, TNF-α inhibitor, lactylation-related genes, macrophage polarization-related genes, treatment response
Introduction
Inflammatory bowel disease (IBD) refers to a group of long-term, nonspecific inflammatory conditions of the gastrointestinal tract, encompassing Crohn’s disease (CD) and ulcerative colitis (UC).1,2 While the exact etiology remains unclear, research has indicated that genetic predisposition, immune system abnormalities, and environmental factors might be involved in the pathogenesis.3 IBD is usually a lifelong condition involving alternating periods of inflammation and remission.4 This recurrent disease course can affect patients’ quality of life to varying degrees, and in severe cases may lead to complications such as intestinal perforation, strictures, or malignancy, which may even require surgical treatment.5
The most commonly used conventional therapeutic agents for IBD treatment are 5-aminosalicylic acid (5-ASA) and glucocorticoids, yet of which the remission rates and side-effect profiles are often unsatisfactory.6 While biologics have significantly improved the inflammatory state and overall quality of life of patients with IBD, a subset of patients remains non-responsive to these therapies, meaning they do not benefit from biologics.7 Thus, exploring the phenomenon of non-response to biologics in IBD patients and the potential mechanism of occurrence was increasingly important, as is exploring ways to improve response to biologics.
Tumor necrosis factor-alpha (TNF-α) inhibitor is the first class of biologics approved for IBD treatment. Despite the significant improvement in patients’ inflammatory state, around one-third of patients exhibited primary non-response to TNF-α inhibitor, and almost 50% of early responders developed secondary resistance within 12 months.8 It has been reported that the mechanism of response to TNF-α inhibitor was associated with anti-drug antibodies development,9 but the exact mechanisms underlying this process remain unclear and require further investigation.
The concept of lactylation modification originated from the first report of histone lactylation modification in macrophages by Zhang et al in 2019.10 Since then, subsequent studies have identified lactylation as being associated with the development and metastasis of diverse cancers.11,12 In 2024, Hu et al further reported that lactylation was also closely linked to inflammatory processes, involving macrophages, as well as to mechanisms related to TLR and the PI3K/Akt signaling pathways.13,14 The relationship between lactylation and tumor or inflammatory disease progression has received increasing attention. Lactylation-related genes, identified through previous studies,10,15–17 have been reported to be associated with the metabolic and immune microenvironment of IBD.18,19
Monocytes circulating in the blood can develop into M0-type macrophages, which serve as essential components of the immune system. In response to different microenvironmental stimuli, M0 macrophages can further polarize into M1 or M2 subtypes. The M1 subtype primarily exerts pro-inflammatory effects, whereas the M2 subtype is mainly involved in anti-inflammatory responses and tissue repair.20 IBD is characterized by recurrent episodes of active inflammation and periods of remission. Studies have shown that during the active phase of IBD, macrophages tend to polarize towards the M1 subtype. Both in vivo and in vitro studies have demonstrated that macrophages promote M1 polarization through specific signaling pathways, thereby exacerbating inflammation and promoting disease activity in IBD patients. Therefore, macrophage polarization plays a crucial role in the progression of IBD.21
Recent studies have reported that lactylation modification influences disease states by regulating macrophage polarization.22 Based on this, we recognized a potential connection among lactylation-related genes, macrophage polarization-related genes, and IBD. However, the relationship between these genes and the TNF-α inhibitor response in IBD remains unclear. In this research, we integrated differential gene expression analysis, WGCNA, machine learning approaches, GSEA, and immune infiltration analysis, to identify biomarkers associated with TNF-α inhibitor response in IBD and to explore potential mechanisms underlying treatment non-response. Additionally, we constructed a transcription factor (TF)–microRNA–mRNA regulatory network based on hub genes. Finally, to validate our bioinformatics findings and to further investigate potential strategies for enhancing response to TNF-α inhibitor therapy, we established a TNBS-induced colitis mouse model and administered oral lactate alongside TNF-α inhibitor treatment. This enabled us to evaluate the effect of exogenous lactate on enhancing the efficacy of TNF-α inhibitor therapy in IBD.
Materials and Methods
Data Acquisition
Datasets
We obtained the datasets related to TNF-α inhibitor therapy in patients with IBD from the Gene Expression Omnibus database (GEO). GSE16879 was utilized for model training, while GSE73661 served as the validation dataset. Both datasets included gene expression microarray data collected before first infusion and 4–6 weeks after first infusion. Detailed characteristics were provided in Supplementary Table 1. Samples from patients with UC and CD, both forms of IBD, were analyzed together. Gene expression data were normalized using normalizeBetweenArrays function in the limma package and log2-transformation was applied.
Lactylation-Related Genes
In this study, we referred to previously published literature and included lactylation-related genes.15–17 Detailed information was provided in Supplementary Table 2.
Macrophage Polarization-Related Genes
We obtained 9959 genes related to macrophage polarization from the GeneCards database (https://www.genecards.org/). Further details could be found in Supplementary Table 3.
Differential Expression Analysis
Differential gene expression analysis was conducted utilizing the “limma” package in R to compare the TNF-α inhibitor remission group and the non-remission group, and p-values were adjusted for multiple testing by controlling the false discovery rate (FDR) using the Benjamini-Hochberg method. Differentially expressed genes (DEGs) were visualized through the application of volcano plots.
WGCNA
WGCNA was performed to pinpoint significant gene modules. First, the input data were normalized using the limma package, and the soft-thresholding power (β) was determined as 5 for the pre-treatment data and 6 for the data collected 4–6 weeks after the initial treatment. Next, a weighted network was constructed using the “WGCNA” package, followed by hierarchical clustering to identify the gene modules. The obtained modules were then correlated with treatment response characteristics to identify the most relevant ones. Finally, genes from the module most strongly associated with treatment response were selected for further analysis.
Identification of Common Genes
Based on the DEGs and the key module genes identified by WGCNA, we first merged the two sets to obtain a combined gene set. We then intersected the combined set with lactylation-related genes and macrophage polarization–related genes, and defined the overlapping genes as common genes. These common genes might be involved in the therapeutic response to TNF-α inhibitor in IBD, while also being linked to lactylation and macrophage polarization.
Machine Learning
We applied three machine learning algorithms (LASSO, SVM, and Random Forest) to further select hub genes from the common genes. Hub genes were identified as the overlapping genes from three machine learning approaches, visualized via Venn diagrams. To ensure reproducibility, random seeds were set for each machine learning algorithm (pre-treatment: Random Forest = 1111, LASSO = 111111, SVM = 2222; 4–6 weeks after the initial treatment: Random Forest = 222, LASSO = 1111, SVM = 1111). Machine learning algorithms were conducted using distinct validation strategies. The LASSO model was trained with 10-fold cross-validation to select the optimal λ and reduce overfitting risk, yielding values of 0.0379 for the pre-treatment data and 0.0113 for the data collected 4–6 weeks after the initial treatment. Feature selection was further performed with the Random Forest algorithm using leave-group-out cross-validation (LGOCV) repeated 10 times to obtain reliable accuracy estimates, while SVM algorithm employed a 5-fold cross-validation strategy to assess model performance and ensure reliable feature selection.
Hub Genes Validation
Based upon the recognized hub genes, we utilized data from both internal and external sources to generate box plots and Receiver Operating Characteristic (ROC) Curve. The Area Under the Curve (AUC) was then calculated to evaluate the potential value of the hub genes as biomarkers.
Construction of a Nomogram
Using logistic regression, we developed a predictive model based on the pre-treatment expression level of hub genes to forecast the response to TNF-α inhibitor. We constructed a nomogram alongside a calibration curve to evaluate the accuracy and reliability of the model, and conducted the Hosmer-Lemeshow (H-L) test.
Immune Infiltration Analysis
Using gene expression profiles from both pre-treatment and 4–6 weeks after the initial treatment, we conducted immune infiltration analysis using the CIBERSORT method. We calculated and visualized the proportions of 22 immune cell types across different samples using box plots and bar charts. Additionally, a Pearson correlation analysis was performed to assess the relationship between hub genes and immune cell composition.
Gene Set Enrichment Analysis (GSEA)
To explore the key pathways mediating the impact of hub genes on the response to TNF-α inhibitor, we performed GSEA using the “clusterProfiler” package. Enrichment plots were generated to visualize these pathways, with each pathway annotated for Normalized Enrichment Score (NES), P-value, and Adjusted P-value.
TF–microRNA–mRNA Regulatory Network Construction
We predicted microRNAs corresponding to the hub genes using the starBase Database.23 Next, transcription factors that regulated these microRNAs were identified using the TransmiR v3.0 Database.24 In parallel, transcription factors associated with hub genes were identified through analysis with the Network Analyst Database.25 The transcription factors regulating both microRNAs and hub genes were identified as their shared transcription factors. Based on these findings, we constructed the TF–microRNA–mRNA regulatory network.
Prediction of Potential Targets for Lactate in Modulating TNF-α Inhibitor Response
Potential locate targets of lactate were predicted using the SwissTargetPrediction, SuperPred, and Similarity Ensemble Approach Databases.26–28 These targets were then integrated with the key pathways identified in the GSEA that were associated with TNF-α inhibitor response. Selecting targets related to these pathways enabled the construction of a hub genes–pathways–drug targets network to investigate the underlying pathways through which lactate affects TNF-α inhibitor efficacy.
Animal Model Construction
BALB/c mice (female, 7–8 weeks old, SPF grade) were acquired from Jiangsu Huachuang sino Pharma Tech Co. Ltd (license: SCXK (Jiangsu) 2020–0009) and acclimated for one week before the experiment commenced. The animal study received approval from the Ethics Committee of the First Affiliated Hospital of Guangxi Medical University (No.2025-E0308) and was conducted in accordance with the ARRIVE guidelines. Mice were randomly assigned into four groups (n = 6 per group): control group, IBD group, TNF-α inhibitor group, and lactate combined with TNF-α inhibitor group. Randomization was performed using a computer-generated random number sequence to minimize selection bias. IBD was induced using a TNBS (2,4,6-Trinitrobenzenesulfonic acid) enema. The mice were pre-sensitized with a 150 µL of a 1% (wt/v) solution of TNBS in a mixture of olive oil and acetone. Seven days later, they received an intrarectal administration of a 2.5% (wt/v) TNBS solution in a 1:1 ethanol–water mixture following 24 hours of fasting. The normal control group underwent the same fasting procedure, but received an equivalent amount of phosphate-buffered saline (PBS) instead. The TNF-α inhibitor group and the lactate combined TNF-α inhibitor group received 10 mg/kg of TNF-α inhibitor (MedChemExpress, 170277–31-3, USA) via intraperitoneal injection three times per week after the TNBS enema.29 The control and IBD groups were injected with an equal volume of normal saline. Seven days prior to the TNBS enema, the lactate combined TNF-α inhibitor group received drinking water supplemented with 30 mM L-lactate until the end of the experiment. The other groups received orally administered autoclaved water as a control.30 To reduce observer bias, sample collection and subsequent analyses were performed by investigators blinded to the group allocation. All mice were euthanized under anesthesia 7 days after enema, and samples were collected for subsequent experimental procedures. Visual representation of the procedure was shown in Supplementary Figure 1.
Reverse Transcription-Quantitative Polymerase Chain Reaction (RT-qPCR)
In order to verify the expression of hub genes, we homogenized mouse colon tissue and extracted the total RNA using the TRIzol method. Subsequently, a reverse transcription kit was employed to convert RNA into cDNA. Quantitative fluorescence analysis of hub gene expression was performed using SYBR Green dye, with GAPDH as the housekeeping gene. The primer sequences used in RT-qPCR are provided in Supplementary Table 4.
Western Blot
We lysed animal tissue using RIPA buffer containing protease inhibitors. Protein concentration was determined using the BCA method. The protein samples were denatured by boiling for 10 minutes at 100°C, after which loading buffer was added to the lysate at a ratio of 1:4. Equal amounts of protein were loaded onto a 4–20% polyacrylamide gel for sodium dodecyl sulfate-polyacrylamide gel electrophoresis (SDS-PAGE) separation, followed by transfer onto a polyvinylidene difluoride (PVDF) membranes. The membrane was blocked with 5% non-fat milk in Tris-buffered saline with Tween-20 (TBST) for one hour at room temperature, then washed three times before being incubated with a pan-lactylated lysine polyclonal antibody (Bioprofile, SHBP0618, CN) at 4°C overnight. The following day, the membrane was incubated with a fluorescent secondary antibody at room temperature for 1 hour before detection.
Statistical Analysis
This study’s statistical analysis in this study was conducted using R software. Differences between two normally distributed groups were evaluated using Student’s t-test, while comparisons among more than two groups were performed using one-way ANOVA. For non-normally distributed data, the Mann–Whitney U-test was used for two-group comparisons, while the Kruskal–Wallis test was applied to multiple-group comparisons. A p-value < 0.05 was considered statistically significant, indicating a meaningful difference between groups.
Results
Differential Expression Analysis
We analyzed data from GSE16879 related to TNF-α inhibitor treatment before treatment and 4–6 weeks after the first injection to identify DEGs between the remission group and the non-remission group. A total of 911 DEGs were identified in the pre-treatment expression profile, including 165 upregulated and 746 downregulated genes, with a cut-off value of 0.795. The volcano plot illustrating changes in gene expression levels before treatment was displayed in Figure 1A, and the top 15 most significantly upregulated and downregulated genes were displayed in Figure 1B. Among these, several genes with known roles in inflammation and immune regulation were notably dysregulated. For example, Triggering Receptor Expressed on Myeloid Cells 1 (TREM1), a key amplifier of inflammatory responses through the innate immune system, was markedly upregulated in the non-remission group. Similarly, C-X-C Motif Chemokine Ligand 6 (CXCL6), a chemokine involved in neutrophil recruitment, showed elevated expression, indicating enhanced inflammatory cell infiltration. In contrast, genes such as Claudin 8 (CLDN8) and Bestrophin 4 (BEST4), which are associated with intestinal barrier, were significantly downregulated in the non-remission group, reflecting potential mucosal dysfunction.
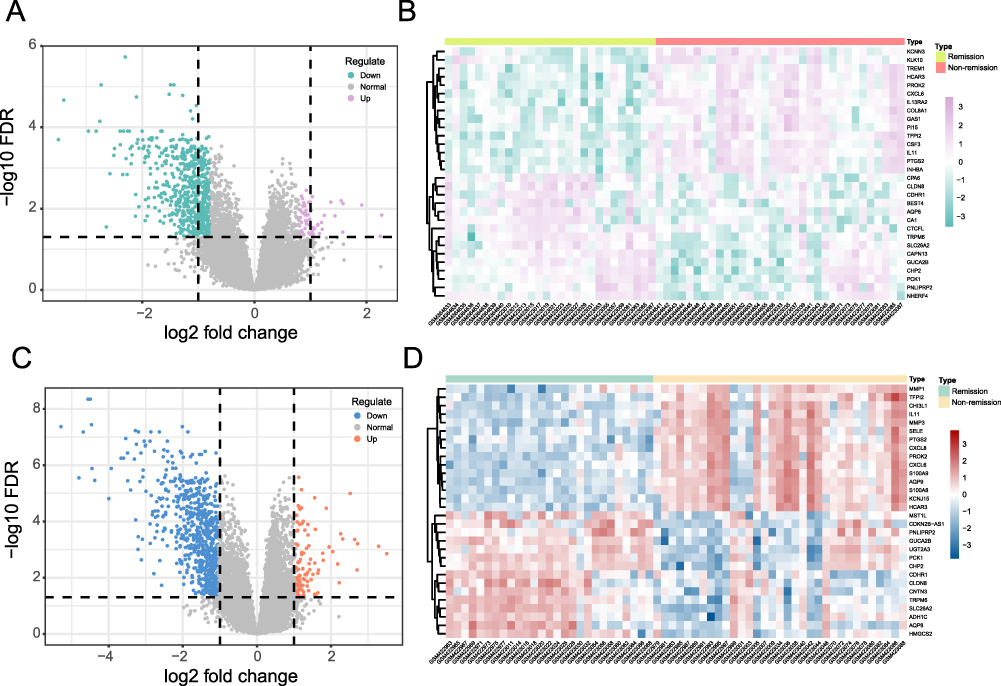 |
Figure 1 Differential expression analysis. (A) Volcano plot of DEGs in the pre-treatment expression profile. (B) Heatmap of the top 15 most significantly upregulated and downregulated genes before treatment. (C) Volcano plot of DEGs in the expression profile 4–6 weeks after the first injection. (D) Heatmap of the top 15 most significantly upregulated and downregulated genes 4–6 weeks after the first injection. |
The analysis of data collected 4–6 weeks after the first injection identified 837 DEGs, including 118 upregulated and 719 downregulated genes, with a cut-off value of 1.051. Changes in gene expression levels were showed in Figure 1C, while the top 15 most significantly upregulated and downregulated genes were showed in Figure 1D. In the non-remission group, inflammation-associated genes such as Chitinase-3-like protein 1 (CHI3L1) and S100 Calcium Binding Protein A9 (S100A9) were significantly upregulated, which was consistent with enhanced macrophage activation and neutrophil recruitment. In contrast, the metabolism-related gene 3-Hydroxy-3-Methylglutaryl-CoA Synthase 2 (HMGCS2), encoding the rate-limiting enzyme in ketogenesis and linking cellular energy metabolism to immune regulation, was markedly downregulated.
WGCNA
To investigate gene modules underlying therapeutic response to TNF-α inhibitor, WGCNA was performed on pre-treatment data. The Scale-Free Topology Model Fit (signed R2) and Mean Connectivity were shown in Figure 2A. The clustering dendrogram was presented in Figure 2B. We then calculated the correlation and p-values between modules and TNF-α inhibitor response. As illustrated in Figure 2C, the brown module exhibited the strongest correlation with TNF-α inhibitor response (p<0.05) among the 25 identified modules, comprising 2105 genes. Further analysis of the correlation between gene significance and module membership within this module revealed a significant association (cor = 0.79, p < 1e-200), as illustrated in Figure 2D.
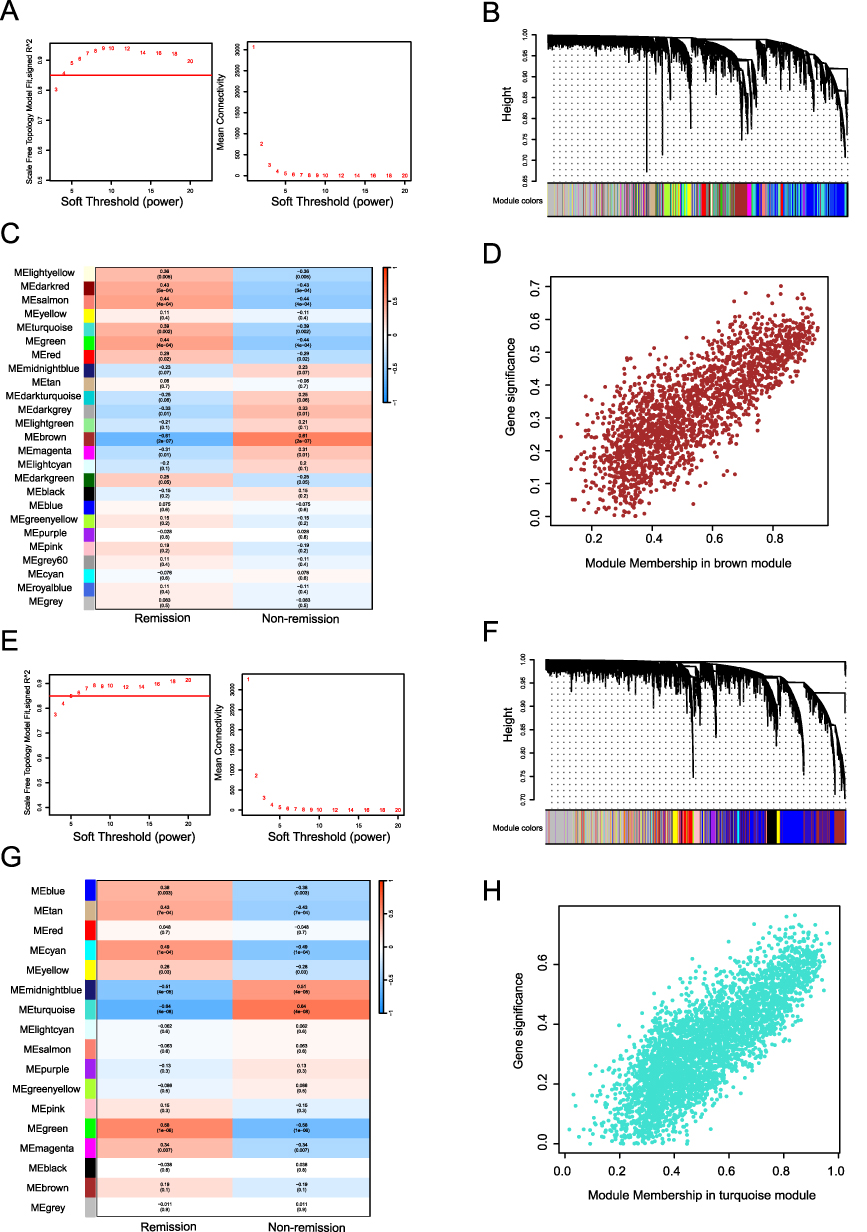 |
Figure 2 WGCNA. (A) Determination of the soft threshold (pre-treatment). (B) Cluster Dendrogram (pre-treatment). (C) Module−trait relationships (pre-treatment). (D) GS-MM correlation (pre-treatment, cor=0.79, p<1e−200). (E) Determination of the soft threshold (4–6 weeks after the first injection). (F) Cluster Dendrogram (4–6 weeks after the first injection). (G) Module−trait relationships (4–6 weeks after the first injection). (H) GS-MM correlation (4–6 weeks after the first injection, cor=0.81, p<1e−200). |
For the dataset obtained 4–6 weeks after the initial treatment, the Scale-Free Topology Model Fit (signed R2) and Mean Connectivity were shown in Figure 2E. The clustering dendrogram was shown in Figure 2F. We identified 17 modules, among which the turquoise module showed the strongest correlation with TNF-α inhibitor response (p<0.05) and encompassed 3648 genes (Figure 2G). Analysis of the correlation between gene significance and module membership in the turquoise module also revealed a significant association (cor=0.81, p<1e-200), as illustrated in Figure 2H.
Identification of Common Genes
As shown in Figure 3A, we identified common genes in the pre-treatment data by using the merged set of DEGs and the genes obtained through WGCNA. This merged set was then intersected with lactylation-related genes and macrophage polarization–related genes, yielding 17 common genes, as illustrated in Figure 3B. The same analysis was performed on data collected 4–6 weeks after the initial treatment, which resulted in the identification of 24 common genes (Figure 3C and D).
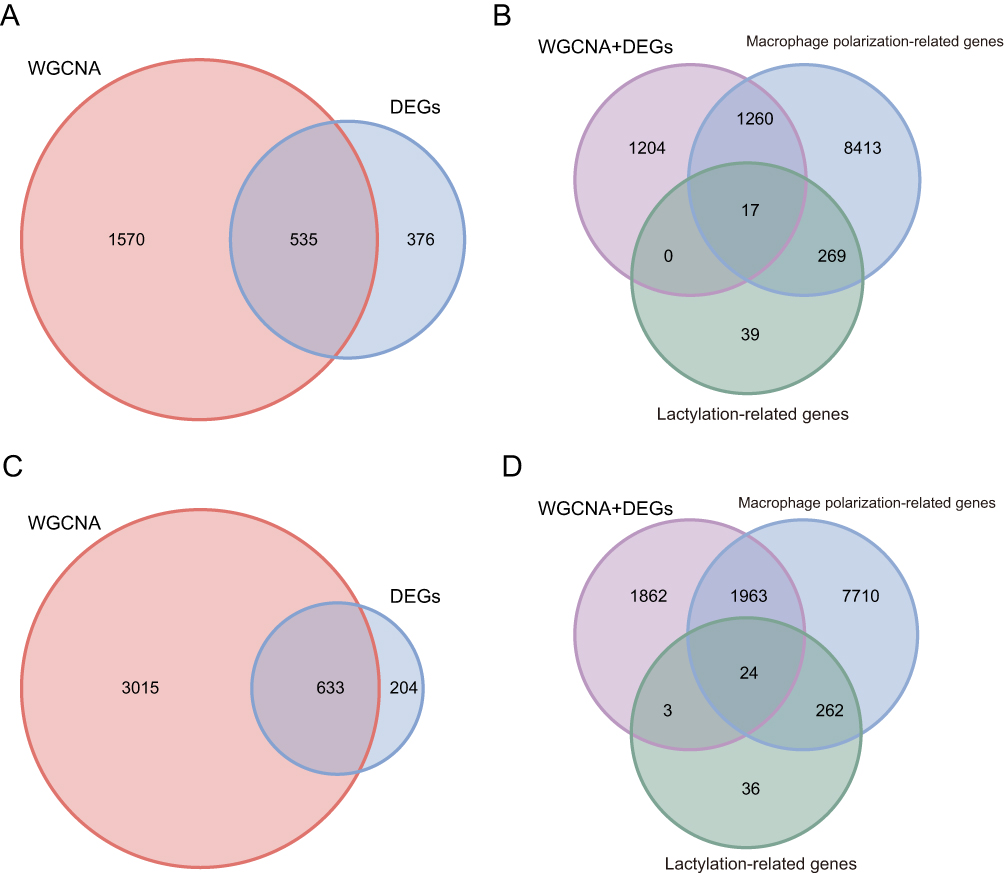 |
Figure 3 Identification of common genes. (A) Overlapping genes from differential expression and WGCNA (pre-treatment). (B) Intersection with Lactylation and macrophage polarization-related genes (pre-treatment). (C) Overlapping genes from differential expression and WGCNA (4–6 weeks after the first injection). (D) Intersection with Lactylation and macrophage polarization-related genes (4–6 weeks after the first injection). |
Three Machine Learning Methods
To further screen for hub genes, we analyzed the identified common genes using three machine learning approaches. For the 17 common genes in the pre-treatment data, three machine learning methods were applied. As shown in Figure 4A, the LASSO regression method identified 8 characteristic genes. In Figure 4B, the Random Forest method selected 14 characteristic genes. Additionally, the SVM-RFE analysis revealed that with 14 features, we achieved minimal error and maximum accuracy (Figure 4C). By identifying the intersection of the characteristic genes found through these three machine learning methods, we obtained 8 hub genes associated with TNF-α inhibitor response in the pre-treatment data (Figure 4D).
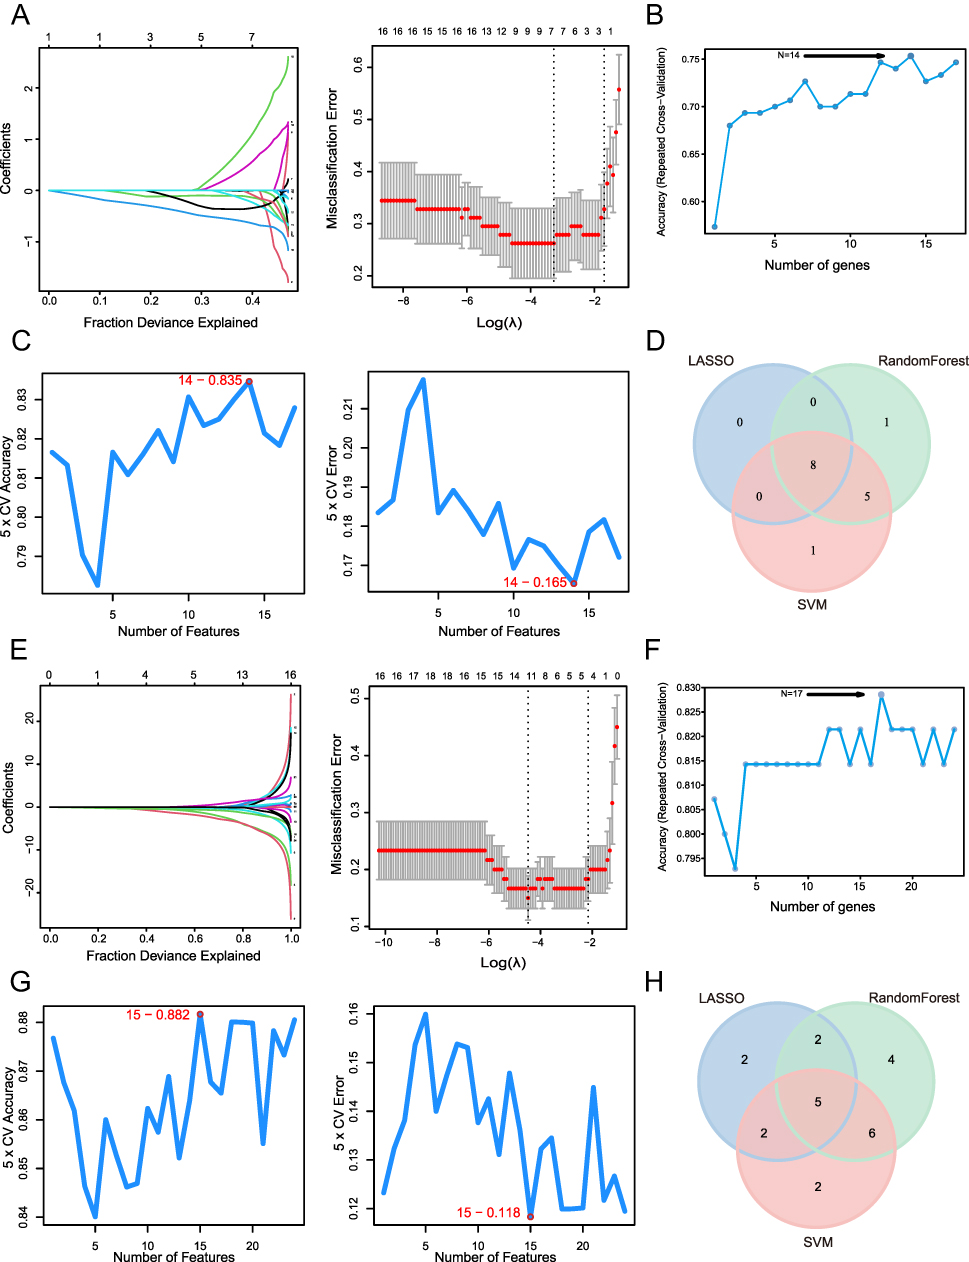 |
Figure 4 Machine learning. (A) LASSO (pre-treatment). (B) Random forest (pre-treatment). (C) SVM-RFE (pre-treatment). (D) Intersection of three machine learning methods (pre-treatment). (E) LASSO (4–6 weeks after the first injection). (F) Random forest (4–6 weeks after the first injection). (G) SVM-RFE (4–6 weeks after the first injection). (H) Intersection of three machine learning methods (4–6 weeks after the first injection). |
Similarly, we applied LASSO regression to 24 common genes, identifying 11 characteristic genes (Figure 4E). The Random Forest method selected 17 characteristic genes, as illustrated in Figure 4F. Fifteen characteristic genes were selected through SVM-RFE analysis (Figure 4G), achieving minimal error and maximum accuracy at this feature count. Using the same intersection approach across the three machine learning algorithms, we screened five hub genes related to TNF-α inhibitor response at 4–6 weeks after the initial treatment (Figure 4H).
Construction of a Predictive Model
We focused on evaluating the predictive value of the hub genes in response to TNF-α inhibitor therapy for the pre-treatment expression profile data. To perform this, we further examined their ability to predict treatment response. In the training set, the expression patterns of 8 hub genes in the remission and non-remission groups were illustrated in Figure 5A. Statistical analysis using the Mann–Whitney U-test revealed significant differences in gene expression between the two groups. Next, we evaluated the discriminatory power of these 8 hub genes by generating ROC for both the training and validation datasets. In Figure 5B, the AUC values revealed strong discriminatory capability for MNDA, CALD1, MSN, RECQL, and RBM10 across both datasets. Specifically, MNDA had an AUC of 0.8485 and 0.7667 in the training and validation set, respectively; CALD1 had an AUC of 0.7868 in the training set and 0.75 in the validation set; MSN had an AUC of 0.8214 in the training set and 0.8 in the validation set; RECQL had an AUC of 0.7219 in the training set and 0.8667 in the validation set; and RBM10 had an AUC of 0.7002 in the training set and 0.7167 in the validation set. Based on these results, we selected the most discriminatory hub genes to construct a predictive model for drug response, visualized using a nomogram. As shown in Figure 5C, the model’s ROC curve yielded AUC values of 0.8939 (training set) and 0.8833 (validation cohort), highlighting its consistent discriminative power in identifying remission status. During the development of the model, we observed that MSN contributed minimally to predictive performance. This led us to finalize MNDA, CALD1, RECQL, and RBM10 as the 4 hub genes for model construction (Figure 5D). Additionally, the calibration curve of the predictive model was showed in Figure 5E. The H-L test indicated that the model exhibited a good fit, suggesting that the predicted probabilities align well with the observed outcomes. In additional, to further evaluate the stability of the model, cross-validation was performed, which provided multiple performance metrics. The results indicated that the model had good discriminative ability and acceptable overall predictive accuracy, although its calibration performance was less satisfactory. The corresponding validation results were summarized in Supplementary Table 5.
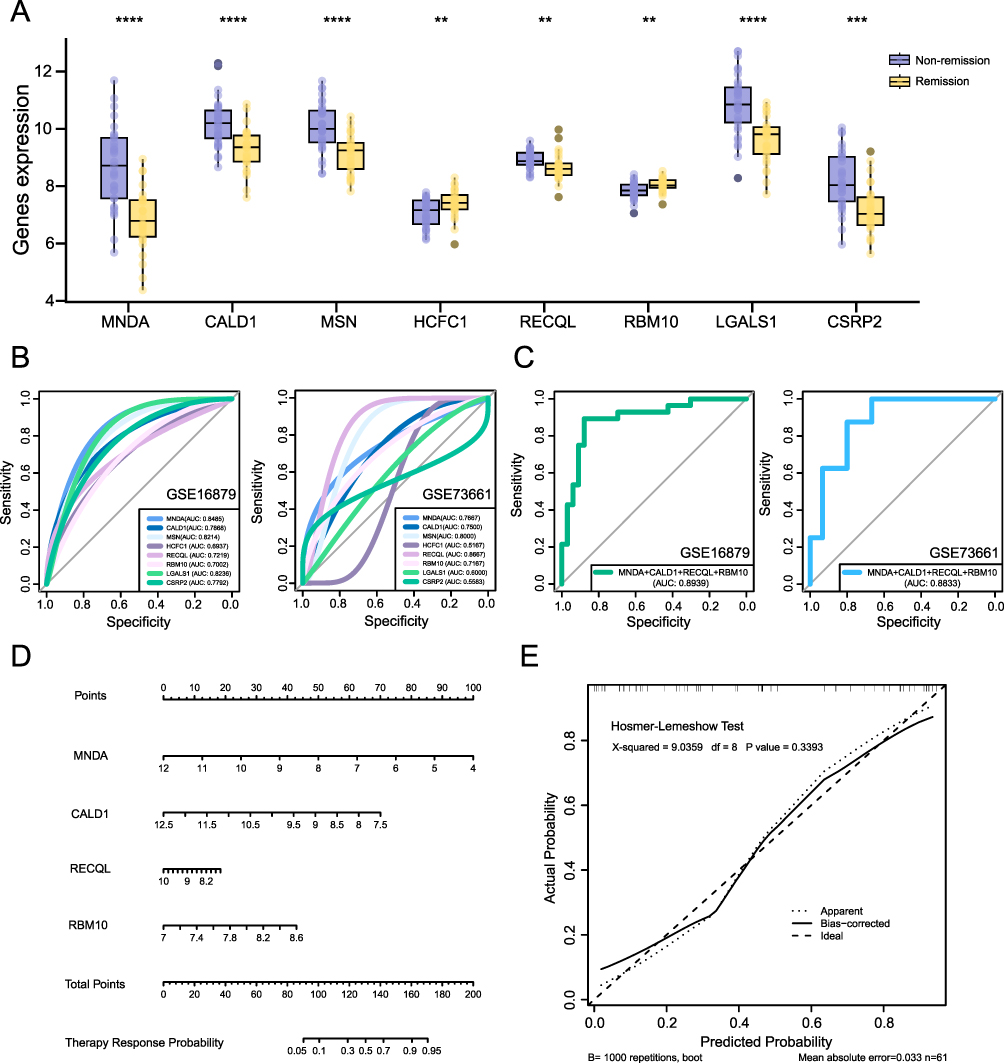 |
Figure 5 Predictive model based on hub genes. (A) Expression patterns of hub genes in remission and non-remission groups. (B) ROC for hub genes in training and validation datasets. (C) ROC of the predictive model. (D) Nomogram for predictive model. (E) Calibration curve and model fit assessment. **P<0.01, ***P<0.001, ****P<0.0001. |
Hub Gene Expression Analysis 4–6 Weeks After the Initial Treatment
For gene expression data in 4–6 weeks after the initial treatment, we focused on the significant changes in hub gene expression before and after treatment. To visualize these variations, we generated box plots depicting the expression patterns of 5 hub genes. As shown in Figure 6A, significant differences were observed between the remission and non-remission groups for these hub genes. By comparing the statistical significance of the differences in gene expression before treatment (Figure 6B), we observed that the distinction between the remission and non-remission groups became more pronounced 4–6 weeks after the initial therapy, particularly for ZYX, ADAR, and WAS. These expression changes were further validated in an external dataset. As illustrated in Figure 6C, the validation cohort exhibited significant differences in the expression of the 5 hub genes between the remission and non-remission groups after 4–6 weeks of therapy.
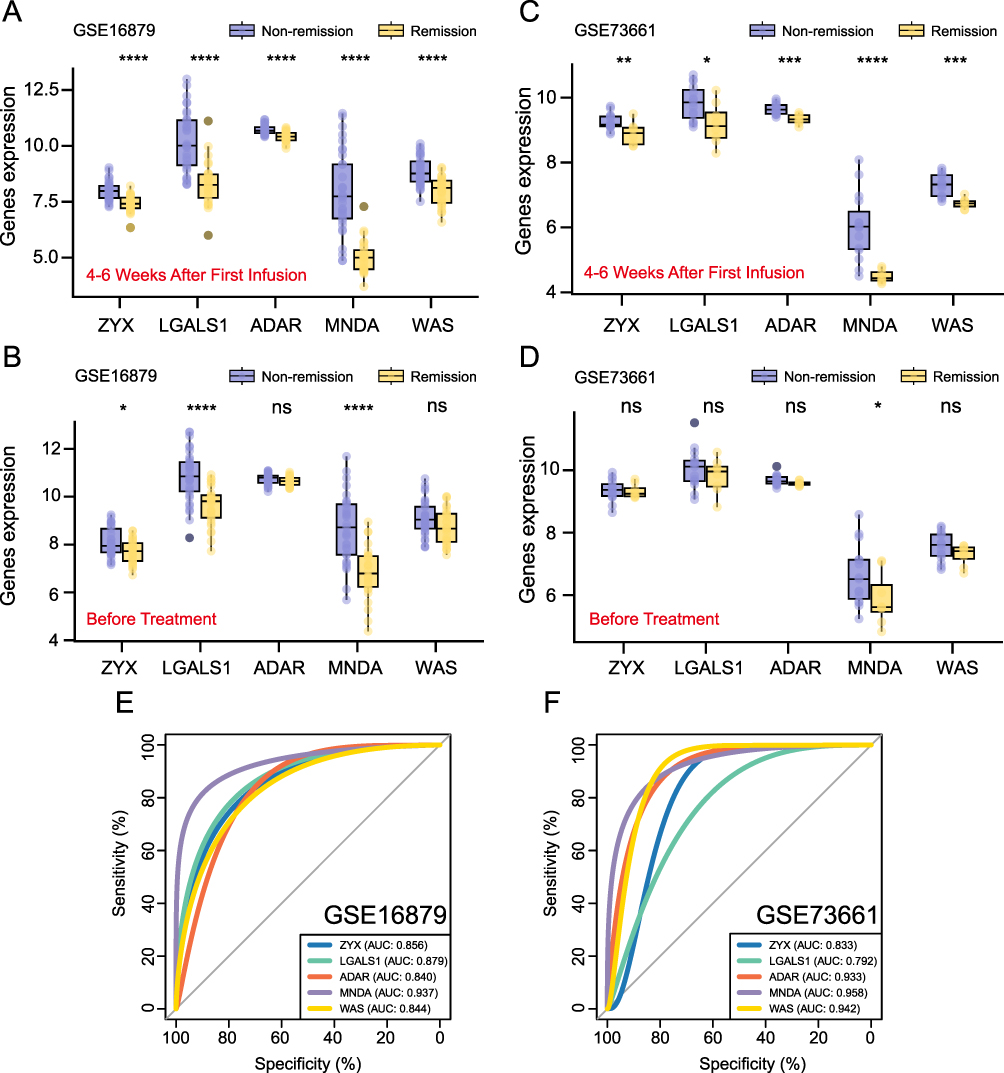 |
Figure 6 Hub genes analysis 4–6 weeks after the first treatment. (A) Box plot of hub genes (4–6 weeks after the first injection, training dataset). (B) Box plot of hub genes (before treatment, training dataset). (C) Box plot of hub genes (4–6 weeks after the first injection, validation dataset). (D) Box plot of hub genes (before treatment, validation dataset). (E) ROC for hub genes (training dataset). (F) ROC for hub genes (validation dataset). *P< 0.05, **P<0.01, ***P<0.001, ****P<0.0001, ns, P> 0.05 (not significant). |
In contrast, MNDA was the only gene showing a significant difference (P<0.05), with no significant difference observed for ZYX, LGALS1, ADAR, and WAS between the remission and non-remission groups before treatment (Figure 6D). To illustrate the differential expression of hub genes between remission and non-remission groups before and after 4–6 weeks of therapy, we included the |Log Fold Change| values in Supplementary Table 6. These variations in gene expression, especially those related to lactylation and macrophage polarization, might be associated with treatment response. Furthermore, we assessed the ability of the 5 hub genes to discriminate remission status within both the training (Figure 6E) and validation datasets (Figure 6F). Among these genes, MNDA exhibited the strongest classification capability, achieving AUC values above 0.9 in both datasets. These results suggested that MNDA could be valuable in identifying patients’ response to TNF-α inhibitor at an early stage.
Immune Infiltration Analysis
Based on the changes observed in the expression patterns of the 5 hub genes (ZYX, LGALS1, ADAR, MNDA and WAS) in the previous analysis, we conducted an immune infiltration analysis to explore the relationship between these hub genes, immune cells, and treatment response, as well as to investigate the potential mechanisms underlying non-response to therapy. The proportions and composition of 22 immune cell types in the remission and non-remission groups before treatment are illustrated (Figure 7A and B). We found that the non-remission group had significantly elevated levels of activated dendritic cells and neutrophils, while the proportions of B cells memory, T cells CD4 memory resting, T cells follicular helper, and dendritic cells resting were markedly lower. The composition and proportions of the same 22 immune cell types in both groups 4–6 weeks after the first treatment were shown in Figure 7C and D. At this time point, we observed that the proportions of plasma cells, T cells CD4 memory activated, macrophages M1, dendritic cells activated, and neutrophils remained markedly elevated in the non-remission group, while resting CD4 memory T cells, regulatory T cells (Tregs), resting NK cells, and resting dendritic cells were markedly reduced. These differences in immune cell proportions, both before and 4–6 weeks subsequent the initial treatment, suggested that the effect of the TNF-α inhibitor might be closely associated with the immune cell composition.
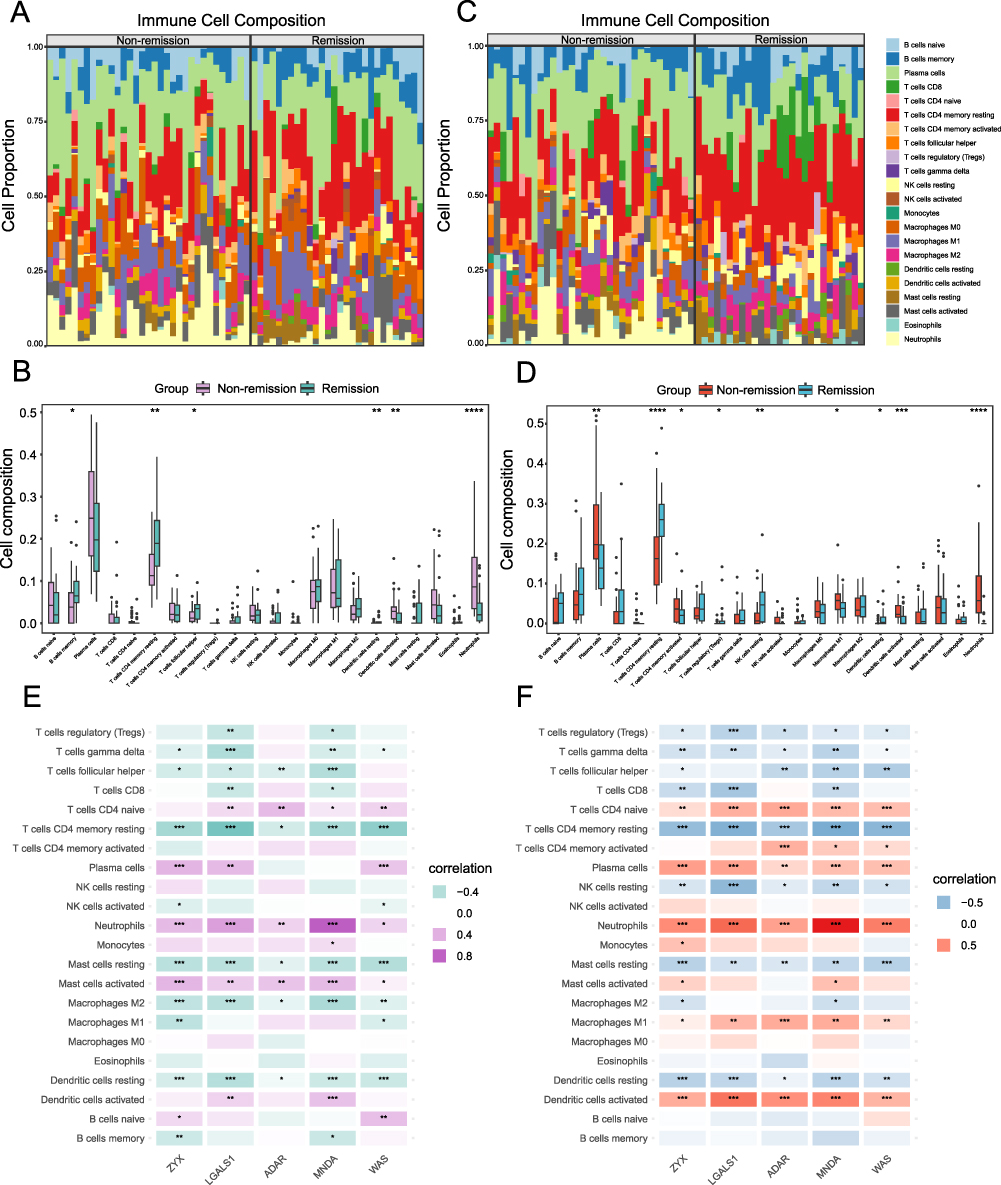 |
Figure 7 Immune Infiltration Analysis. (A) Immune cell stacking bar plot (before treatment). (B) Box plots of immune cell composition (before treatment). (C) Immune cell stacking bar plot (4–6 weeks after the first injection). (D) Box plots of immune cell composition (4–6 weeks after the first injection). (E) Correlation analysis between hub genes and immune cells (before treatment). (F) Correlation analysis between hub genes and immune cells (4–6 weeks after the first injection). *P< 0.05, **P<0.01, ***P<0.001, ****P<0.0001. |
We observed a relative increase in the proportion of macrophages M1 cells in the non-remission group 4–6 weeks after initial treatment, compared to pre-treatment levels, while macrophages M0 and M2 showed no apparent upward or downward trends. This pattern suggested a potential role of macrophage polarization in the response to TNF-α inhibitor therapy. To investigate this further, we analyzed microarray expression data before treatment (Figure 7E) and 4–6 weeks after the initial treatment (Figure 7F), exploring the correlation of 5 hub genes and immune cells. Our findings revealed that ZYX, LGALS1, ADAR, MNDA, and WAS were significantly associated with multiple immune cells, particularly T cells, neutrophils, mast cells, macrophages and dendritic cells. Before treatment, these hub genes exhibited a stronger association with macrophages M2, while after 4–6 weeks of therapy, their association shifted toward macrophages M1. Macrophages M0 exhibited no significant correlation at either time point. These results suggested possible relative changes in macrophage subsets during TNF-α inhibitor therapy.
GSEA
We conducted GSEA to investigate the pathway enrichment of 5 hub genes (ZYX, LGALS1, ADAR, MNDA and WAS) in the samples. The findings indicated that these genes were enriched across multiple biological pathways, including immune-associated pathways, notably the Th1 and Th2 cell differentiation pathways, the T cell receptor signaling pathway, and the B cell receptor signaling pathway. The genes were also associated with inflammatory pathways such as the NF-kappa B signaling pathway, HIF-1 signaling pathway, Hippo signaling pathway, and WNT signaling pathway, as well as drug metabolism pathways including drug metabolism, pyruvate metabolism, butanoate metabolism, and glycolysis/gluconeogenesis. Ten enriched pathways for each hub gene were displayed, along with details on NES, P value, and Adjusted P value (Figure 8A–E). These findings suggested the potential functional roles of these genes in immune regulation, inflammation, and metabolic processes, and highlighted their possible involvement in the response to TNF-α inhibitor.
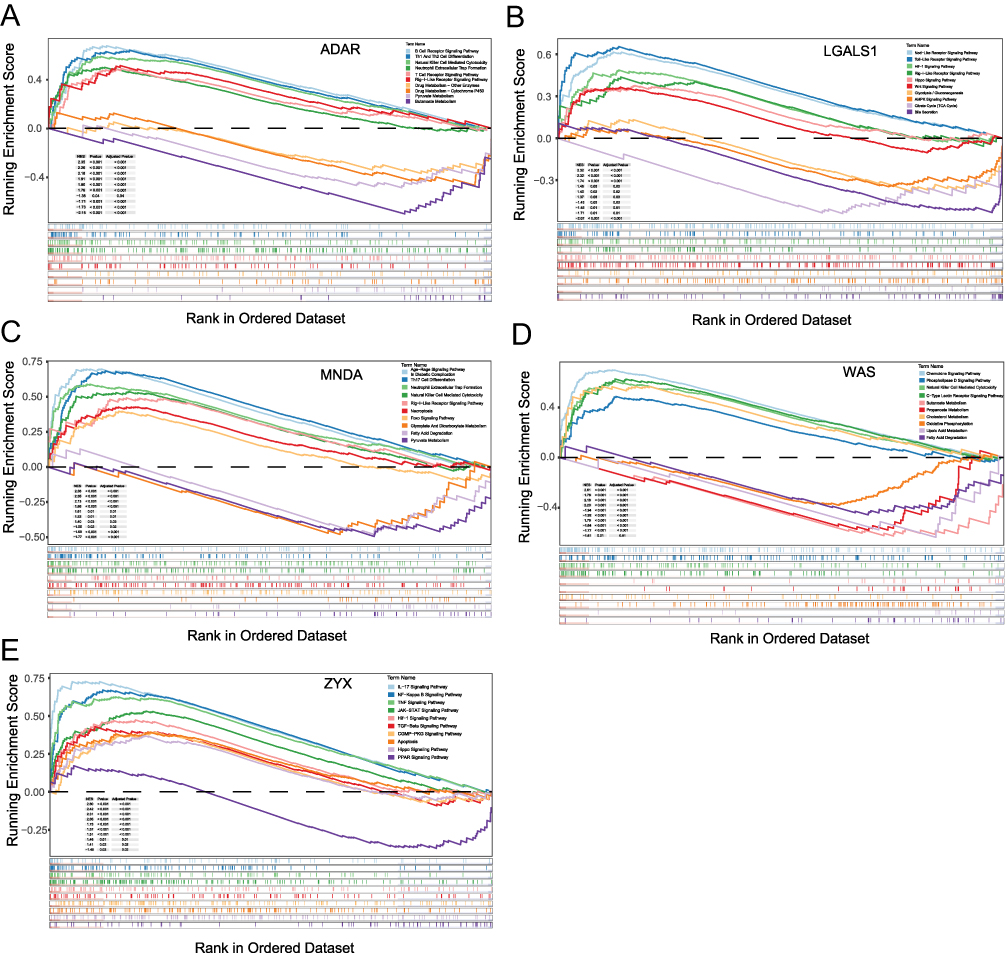 |
Figure 8 GSEA. (A) Enriched signaling pathways for ADAR. (B) Enriched signaling pathways for LGALS1. (C) Enriched signaling pathways for MNDA. (D) Enriched signaling pathways for WAS. (E) Enriched signaling pathways for ZYX. |
TF-microRNA-mRNA Regulatory Network
To explore the regulatory relationships between hub genes, transcription factors, and microRNAs, we utilized the starBase database to predict microRNAs associated with the hub genes. Based on the 41 identified microRNAs (Figure 9A), we then used the TransmiR v3.0 database to predict their transcription factors (Figure 9B). Additionally, the NetworkAnalyst database was also employed to predict transcription factors regulating the hub genes. Ultimately, we integrated microRNAs associated with hub genes, the transcription factors regulating these microRNAs, and the transcription factors corresponding to the hub genes to construct a TF-microRNA-mRNA regulatory network (Figure 9C).
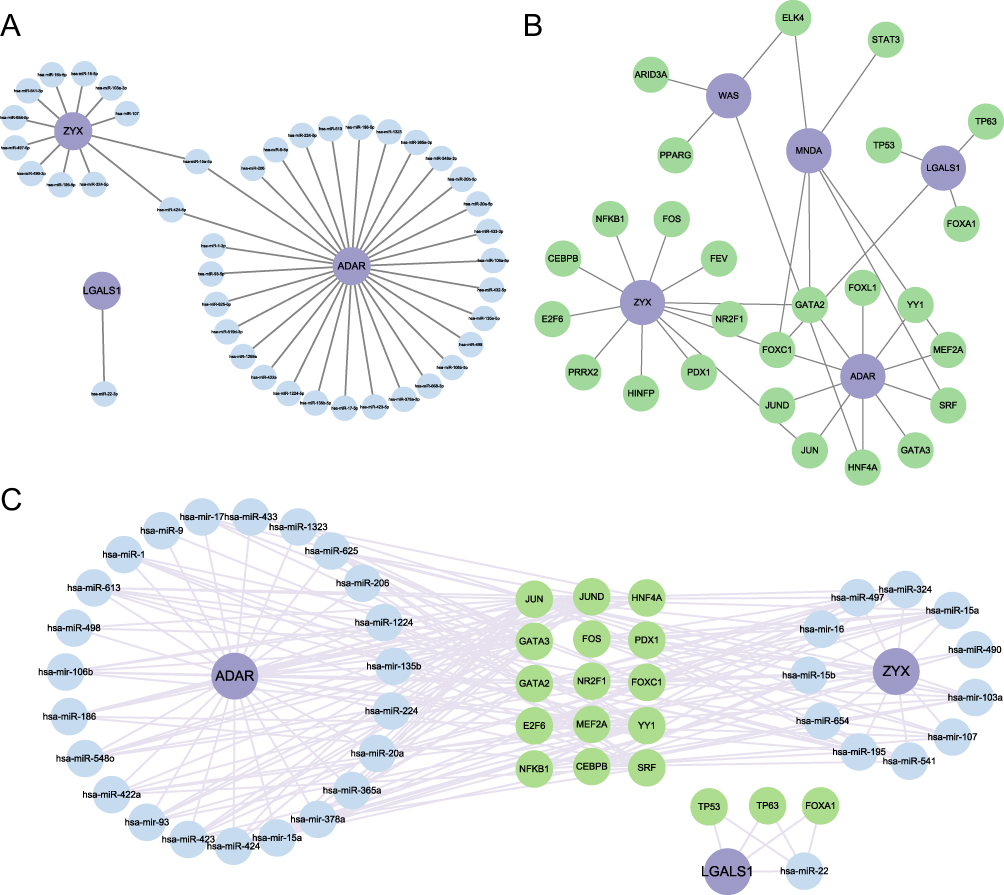 |
Figure 9 The TF-microRNA-mRNA Regulatory Network Established by Cytoscape Software. (A) The microRNA-mRNA regulatory network. (B) The TF-mRNA regulatory network. (C) The TF-microRNA-mRNA regulatory network. |
Potential Drug Targets
Lactate was identified as an essential metabolic molecule in the body, with a close association to lactylation processes. Recent studies reported that exogenous lactate intervention could alleviate colitis symptoms in mice models. To explore the potential drug targets for lactate, we utilized the SwissTargetPrediction, Similarity ensemble approach, and SuperPred databases. Integrating these predicted targets with the signaling pathways which were identified in our GSEA, revealed that several potential lactate drug targets played crucial roles within these pathways. Based on these findings, we constructed a network of drug targets and signaling pathway to predict how lactate might influence the response to TNF-α inhibitor via key signaling pathways. The network was shown in Figure 10, with purple nodes representing hub genes, green nodes denoting signaling pathways enriched by these hub genes, and orange nodes indicating lactate’s potential drug targets. This network provided insights into the molecular mechanisms by which lactate might modulate therapeutic responses.
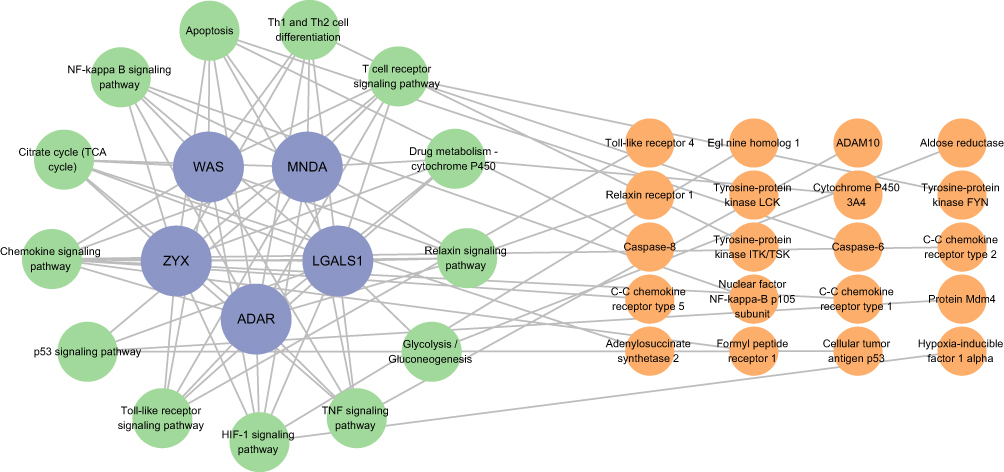 |
Figure 10 Potential drug targets and signaling pathways. |
Animal Model Establishment
To evaluate the expression of hub genes and the lactylation levels associated with the response to TNF-α inhibitor, we established a TNBS-induced mouse colitis model. After successfully inducing the model, we administered TNF-α inhibitor to the treatment group and subsequently divided them into remission and non-remission subgroups based on their therapeutic response. In Figure 11A, representative images of intestinal specimens from 4 groups: normal group, IBD group, remission group, and non-remission group were presented. Colon shortening and obvious ulcerations were apparent in the IBD group and non-remission group. Histological images of the intestinal specimens revealed disrupted tissue architecture and obvious infiltration of inflammatory cells in the IBD and non-remission groups (Figure 11B). Body weight changes and the weight ratio (Day 7/Day 0) were presented in Figure 11C. The disease activity index (DAI) scores and the colon mucosa damage index (CMDI) across the four groups were displayed in Figure 11D. We conducted RT-qPCR analysis to examine inflammatory cytokine levels in each group. The results showed elevated TNF-α and IL-6 levels in the IBD and non-remission groups, while IL-10 level was significantly increased in the remission group (Figure 11E–G).
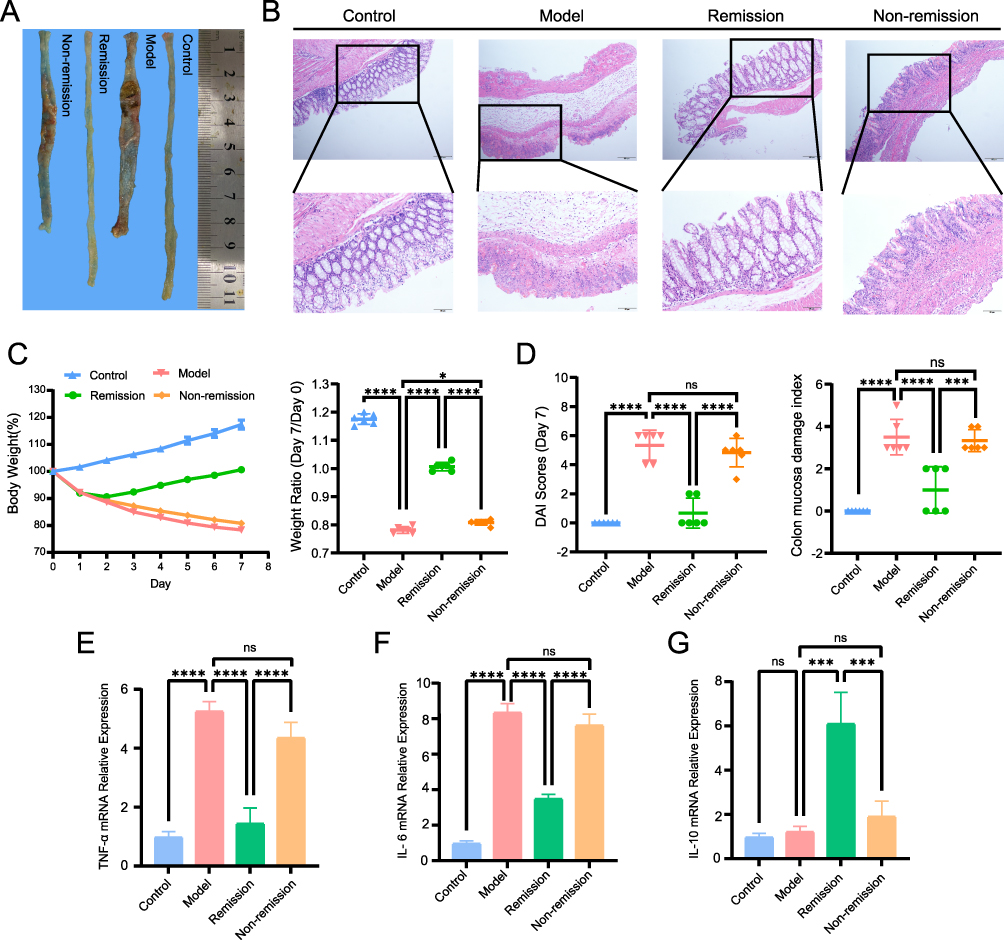 |
Figure 11 Establishment of animal models. (A) Colon tissue. (B) Representative histological images of intestinal specimens. (C) Body weight and weight ratio (Day7/Day0). (D) DAI scores (Day7) and colon mucosa damage index. (E) RT-PCR of TNF-α expression levels. (F) RT-PCR of IL-6 expression levels. (G) RT-PCR of IL-10 expression levels. *P< 0.05, ***P<0.001, ****P<0.0001, ns, P> 0.05 (not significant). |
RT-qPCR Validation of Hub Genes Expression
In the TNF-α inhibitor-treated mouse colitis model, Further validation of hub genes expression confirmed consistency with the bioinformatics findings. Compared to the remission group, the non-remission group exhibited elevated expression levels of ZYX, LGALS1, ADAR, MNDA, and WAS 4–6 weeks after the initial treatment (Figure 12).
 |
Figure 12 RT-PCR verification of hub genes expression. (A) ZYX mRNA relative expression. (B) LGALS1 mRNA relative expression. (C) MNDA mRNA relative expression. (D) WAS mRNA relative expression. (E) ADAR mRNA relative expression. **P<0.01, ***P<0.001, ****P<0.0001. |
Effects of Lactate on the Response to TNF-α Inhibitor
In our study, we evaluated the impact of oral lactate supplementation in combination with TNF-α inhibitor compared with TNF-α inhibitor alone in mice. Our results showed that the application of combination therapy led to enhanced symptom improvement in comparison to TNF-α inhibitor monotherapy. RT-qPCR analysis revealed that TNF-α and IL-6 levels were elevated in the IBD group, reduced in the TNF-α inhibitor monotherapy group, and further decreased in the combination therapy group (Figure 13A and B). IL-10 expression was increased in the monotherapy group and was further elevated in the combination therapy group with lactate supplementation. (Figure 13C). To further explore the involvement of lactylation modifications in TNF-α inhibitor therapy, we measured lactylation levels across different groups. Results indicated that lactylation levels were markedly elevated in colitis mice compared to healthy controls. Furthermore, lactylation levels exhibited a more pronounced increase in the combination therapy group than in the monotherapy group (Figure 13D and E). These results suggested that lactate supplementation enhanced the therapeutic response to TNF-α inhibitor, and variations in lactylation levels among groups indicated that lactylation modifications could be involved in the mechanisms regulating this response.
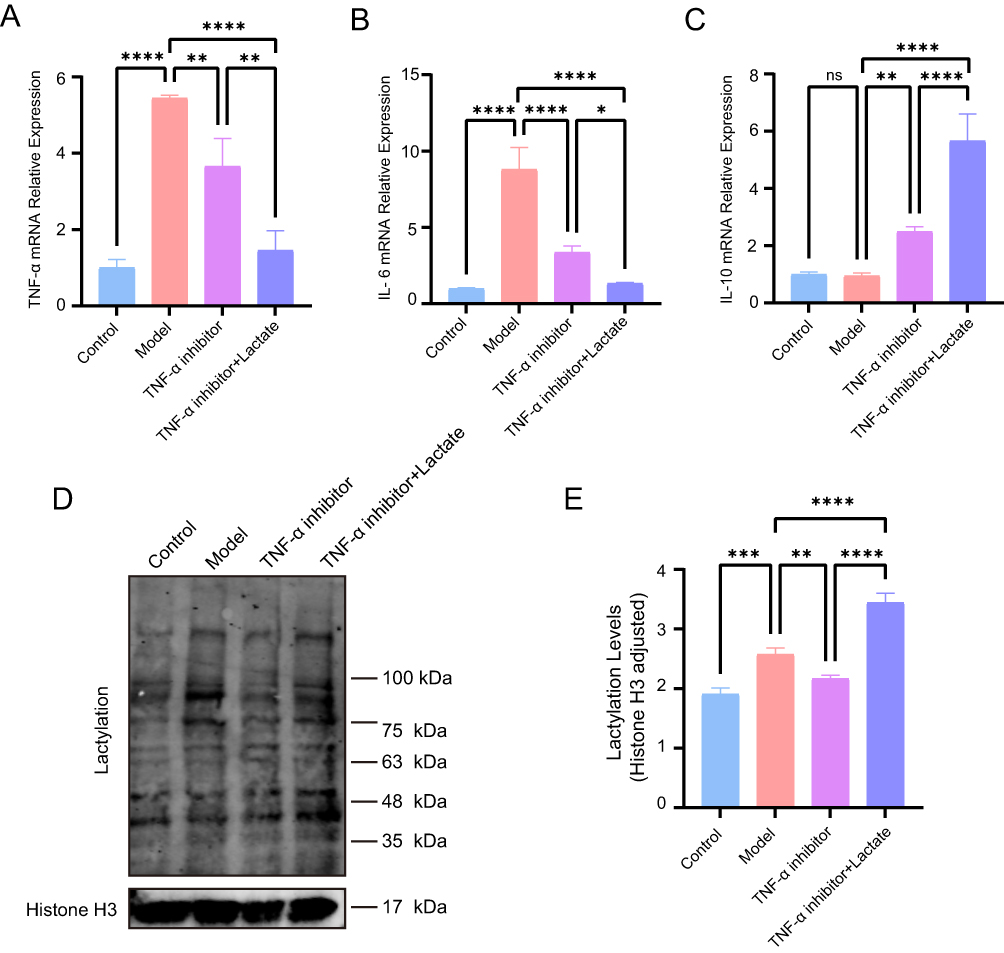 |
Figure 13 Effects of Lactate on TNF-α inhibitor Response. (A) RT-PCR of TNF-α expression levels. (B) RT-PCR of IL-6 expression levels. (C) RT-PCR of IL-10 expression levels. (D) Lactylation modifications. (E) Lactylation modifications relative level, Histone H3 served as loading control. *P< 0.05, **P<0.01, ***P<0.001, ****P<0.0001. |
Discussion
In this study, we integrated multiple bioinformatics methods, including differential expression analysis, WGCNA, and machine learning approaches, to identify hub genes (MNDA, CALD1, RECQL and RBM10) that could predict TNF-α inhibitor treatment response. We also explored hub genes whose expression levels changed during TNF-α inhibitor therapy (ZYX, LGALS1, ADAR, MNDA and WAS). Furthermore, we investigated the signaling pathways enriched by these hub genes through GSEA, and immune infiltration analysis allowed us to characterize the immune cell composition within the samples. Rather than focusing solely on intergroup differences based on pretreatment data, we also analyzed gene expression profiles 4–6 weeks after the initial treatment. By comparing these profiles with pretreatment data, we identified hub genes and immune cell compositions that underwent significant changes. Animal experiments were conducted to examine the expression levels of hub genes and to assess variations in lactylation modifications across different groups. The results suggested that exogenous lactate supplementation might enhance the response to TNF-α inhibitor. These observations provided preliminary insights into the molecular mechanisms that might underlie treatment response and indicated a potential role of lactate in influencing therapeutic outcomes.
Patients with IBD may experience symptoms such as abdominal pain, diarrhea, weight loss, and malnutrition.31,32 Current pharmacological treatments primarily include aminosalicylates, corticosteroids, immunosuppressants, and biologics such as TNF-α inhibitors.6 Tumor necrosis factor-alpha (TNF-α) is a pro-inflammatory cytokine that is elevated in IBD patients that drives intestinal inflammation and tissue damage.33 TNF-α inhibitors, a class of biologic drugs, play a crucial role in IBD treatment by inhibiting TNF-α activity and reducing inflammation. However, the therapeutic response to TNF-α inhibitors varies among patients.34 Evidence from previous studies has indicated that non-response to TNF-α inhibitors might involve the antibodies against the drug and genetic factors.8,35 Recent reports have indicated that the composition of the gut microbiota in IBD patients underwent significant alterations, with a reduction in Firmicutes and Bacteroidetes levels and an increase in Proteobacteria and Actinobacteria levels.36
Patients with IBD are often accompanied by microbial dysbiosis, which can promote macrophage infiltration into the intestinal mucosa, and trigger the secretion of pro-inflammatory cytokines and chemokines, and further promote the production of TNF-α.37 Furthermore, significant variations in gut microbial profiles have been identified between TNF-α inhibitor responders and non-responders, implying a potential role of the gut microbiota as a predictive biomarker.38 Lactobacillus is a key member of the Firmicutes phylum that plays an essential role in maintaining gut microbiota balance and overall intestinal health.39 Lactate metabolism is closely linked to the activity of Lactobacillus in the intestine.40 Lactobacillus produces lactate through glycolytic pathways, including homofermentative and heterofermentative fermentation pathways. These metabolic processes not only contribute to maintaining intestinal microbiota homeostasis but also regulate immune and inflammatory responses via lactylation modifications.41 In the hypoxic inflammatory intestinal environment of patients with IBD, the HIF-1 signaling pathway could be activated, promoting glycolysis in intestinal epithelial cells and influencing energy metabolism and immune regulation.42 Increased glycolysis led to lactate accumulation.43 While lactate was historically considered a metabolic waste product, recent studies have highlighted its crucial role in tumor progression, inflammation, and immune-related diseases.44–46 Consistent with these emerging evidence, one study has reported that supplementation with exogenous lactate could improve experimental colitis, suggesting a potential protective role of lactate in the regulation of inflammation.30 Lactate has been shown to mediate histone lactylation, facilitating the transition of macrophages from the pro-inflammatory M1 phenotype to the anti-inflammatory M2 phenotype, thereby contributing to the regulation of immune responses. The relevant mechanisms may involve signaling pathways such as HIF-1α, NF-κB, mTORC1, and TH17 polarization.47 These findings suggest that complex interactions exist among the gut microbiota, lactylation modifications, and signaling pathways in the regulation of inflammation and immunity.
Macrophages respond to microenvironmental stimuli by undergoing polarization, leading to differentiation into pro-inflammatory M1 and anti-inflammatory M2 subtypes.20 Lactylation plays a critical role in regulating the function of macrophages. Studies have shown that lactylation was involved in macrophage transitions between macrophage subtypes and might serve as a key mechanism in modulating inflammatory responses and tissue repair.48 Under inflammatory conditions, M1 macrophages predominantly relied on glycolysis for energy production, leading to elevated lactate levels. This increase in lactate might influence inflammatory responses via histone lactylation, while lactylation itself might enhance M2 macrophage function, thereby promoting tissue repair and anti-inflammatory effects.22 Our bioinformatics findings were consistent with these observations. Specifically, 4–6 weeks after the initial treatment with TNF-α inhibitor, the expression of hub genes was significantly elevated. Furthermore, our validation experiments demonstrated that combining TNF-α inhibitor therapy with exogenous lactate supplementation enhanced lactylation levels and led to a more pronounced improvement in colonic inflammation compared to TNF-α inhibitor monotherapy. The findings indicated that lactylation could play a crucial role in the response to TNF-α inhibitor treatment in IBD.
The pathogenesis of IBD involves complex immune regulatory processes.49 Lactylation has previously been reported to be associated with various cancers.50 However, its role in the intestinal inflammation is attracting increasing attention.51 Lactate, a crucial metabolic molecule, is elevated in inflammatory or tumor microenvironments and has been shown to influence immune cell function.44 As well as being a metabolic byproduct of glucose metabolism, lactate can modulate gene expression via the lactylation of histone proteins, resulting in the regulation of macrophage polarization.22 A recent study has shown that lactate repressed macrophage inflammatory responses by enhancing immunosuppressive gene expression while suppressing pro-inflammatory genes, suggesting that lactate functions not merely as a metabolic byproduct but also as a key signaling molecule in immune regulation.52 In our study, we investigated the effects of combining exogenous lactate supplementation combined with TNF-α inhibitor therapy in a colitis mouse model. The combination therapy group exhibited significantly increased lactylation levels and demonstrated enhanced anti-inflammatory effects compared to the monotherapy group receiving TNF-α inhibitor. The results aligned with previous studies and supported the therapeutic potential of lactate in enhancing the efficacy of TNF-α inhibitor therapy in colitis.
Although predictive models for response to biologic therapies in IBD have been developed based on clinical, genetic, immunological, pharmacokinetic, and microbiome-derived biomarkers, the predictive accuracy of individual biomarker-based approaches remains suboptimal, often remaining below 60%.53 Multi-omics predictive models have demonstrated greater accuracy, with some studies reporting predictive capabilities of over 80%.54 These findings highlight the promise of integrative, multi-omics strategies in advancing precision medicine for IBD.
Through bioinformatics analysis, we identified several hub genes (ZYX, LGALS1, ADAR, MNDA, and WAS). Notably, these genes were closely linked to lactylation and macrophage polarization, indicating that these biological processes were potentially crucial in mediating treatment response. GSEA further suggested that five key genes—ZYX, LGALS1, ADAR, MNDA, and WAS—were found to be enriched across multiple pathways, including immune-related pathways (B cell receptor signaling, T cell receptor signaling, and Th1/Th2 cell differentiation), inflammatory pathways (NF-κB, HIF-1, Hippo, and WNT), as well as metabolic pathways (drug metabolism, pyruvate metabolism, butyrate metabolism, and glycolysis/gluconeogenesis). Taken together, these results indicated that the hub genes might be involved in immune regulation, inflammatory responses, and drug metabolism. These findings may help to elucidate the molecular mechanisms underlying responses to TNF-α inhibitor treatment.
Transcription factors regulate microRNA transcription via promoter regions.55 MicroRNAs, bind to target mRNAs and thereby modulate translation efficiency and gene expression.56 In our study, we predicted multiple transcription factors that might influence microRNA expression and identified 41 microRNAs that were potentially involved in regulating these 5 hub genes. Subsequent construction of a TF–microRNA–mRNA regulatory network provided important insights into gene regulatory mechanisms associated with TNF-α inhibitor response in IBD patients and might inform the exploration of candidate therapeutic targets.
Using bioinformatics approaches, we constructed a network of hub genes, drug targets, and signalling pathways to identify potential mechanisms by which lactate may modulate responsiveness to TNF-α inhibitor therapy in IBD. Subsequent experimental validation confirmed that lactate enhanced the efficacy of TNF-α inhibitor treatment, a process that may be mediated by lactylation. These findings suggested possible approaches to improve responses to TNF-α inhibitor in IBD.
This study has certain limitations. First, the transcriptomic data were derived from the GEO database, which does not include clinical information such as age, sex, disease severity, and prior treatment history. In addition, due to the limited number of available datasets, UC and CD subtypes were analyzed together, and the validation cohort was small, potentially introducing confounding factors. Second, the animal experiments were limited with a small sample size and a preliminary design, and multi-level validation using clinical specimens or cellular models was not performed. As a result, the specific mechanisms underlying macrophage polarization and lactylation modifications remained to be clarified. In addition, the TNBS-induced colitis model employed in this study predominantly resembles CD, which represents a limitation. More comprehensive validation may be obtained in future studies using models such as DSS-induced colitis. Third, although bioinformatics and preliminary experiments supported our transcriptomic findings, the evidence remained mainly inferential. Moreover, one study suggested that lactate, beyond its role in histone lactylation, might serve as a metabolic substrate in the tricarboxylic acid (TCA) cycle and act as a signaling metabolite regulating immune responses.57 In summary, the transcriptomic findings from this study were preliminary and still required multi-level and mechanistic validation.
Conclusion
This study provided preliminary evidence that exogenous lactate may enhance the efficacy of TNF-α inhibitor, potentially through immune regulatory mechanisms and lactylation, as suggested by integrative bioinformatics and animal experiments. The derived gene regulatory networks provided initial mechanistic insights into how lactate may enhance the therapeutic efficacy of TNF-α inhibitor in IBD. However, these findings remained preliminary and should be interpreted with caution. Further studies are needed to explore the mechanistic contributions of lactate and lactylation to TNF-α inhibitor efficacy.
Abbreviations
IBD, inflammatory bowel disease; CD, Crohn’s disease; UC, ulcerative colitis; WGCNA, weighted gene co-expression network analysis; GSEA, gene set enrichment analysis; 5-ASA, 5-aminosalicylic acid; TNF-α, tumor necrosis factor-alpha; GEO, Gene Expression Omnibus; LASSO, least absolute shrinkage and selection operator; SVM-RFE, support vector machine recursive feature elimination; RF, random forest; TNBS, 2,4,6-Trinitrobenzenesulfonic acid; ROC, receiver operating characteristic; AUC, area under the curve; NES, normalized enrichment score; H-L, Hosmer-Lemeshow; RT-qPCR, reverse transcription-quantitative polymerase chain reaction; SDS-PAGE, sodium dodecyl sulfate-polyacrylamide gel electrophoresis; PVDF, polyvinylidene difluoride; TBST, tris-buffered saline with tween-20; PBS, phosphate-buffered saline; DEGs, differentially expressed genes; LGOCV, leave-group-out cross-validation; TF, transcription factor; FDR, false discovery rate; TREM1, Triggering Receptor Expressed on Myeloid Cells 1; CXCL6, C-X-C Motif Chemokine Ligand 6; CLDN8, Claudin 8; BEST4, Bestrophin 4; CHI3L1, Chitinase-3-like protein 1; S100A9, S100 Calcium Binding Protein A9; HMGCS2, 3-Hydroxy-3-Methylglutaryl-CoA Synthase 2; DAI, disease activity index; CMDI, colonic mucosal damage index; TCA, tricarboxylic acid.
Data Sharing Statement
Data and materials of animal experiments can be obtained from the corresponding author upon reasonable request. The datasets that support this study are accessible via the GEO database at https://www.ncbi.nlm.nih.gov/geo/.
Ethics Statement
The animal study was reviewed and approved by the First Affiliated Hospital of Guangxi Medical University Ethical Review Committee (Approval Number: 2025-E0308). All animal experiments were conducted and analyzed in accordance with the ARRIVE guidelines and the Guidelines for Ethical Review of Laboratory Animal Welfare (GB/T 35892-2018) issued by China. In addition, we conducted these analyses using the GeneCards and GEO databases, which are publicly accessible and whose contributors have provided ethical consent for research use. These resources allow investigators to freely obtain data and publish findings. In accordance with Article 32, Items 1 and 2 of the Measures for Ethical Review of Life Science and Medical Research Involving Human Subjects promulgated in China on February 18, 2023 (stipulating that ethical review is exempt for studies that meet one of the following conditions: (1) research that only uses publicly available scientific results, data, or materials; or (2) research that only uses legally obtained information or biological samples that do not involve personal privacy), this study qualifies for ethical exemption.
Acknowledgments
The authors extend their gratitude to Shanghai Bioprofile Technology Co. Ltd. for generously providing the pan-lactylated lysine polyclonal antibody free of charge.
Author Contributions
All authors made a significant contribution to the work reported, whether that is in the conception, study design, execution, acquisition of data, analysis and interpretation, or in all these areas; took part in drafting, revising or critically reviewing the article; gave final approval of the version to be published; have agreed on the journal to which the article has been submitted; and agree to be accountable for all aspects of the work.
Funding
This study was funded by the National Natural Science Foundation of China (No.82460108), the National Natural Science Foundation of China (No.81860104), Natural Science Foundation of Guangxi Zhuang Autonomous Region (No.2023GXNSFDA026024), Development and Application of Medical and Health Appropriate Technology Project in Guangxi Zhuang Autonomous Region(No.S2018049), Self-financing Project of Health Commission of Guangxi Zhuang Autonomous Region (No.Z20200398), Innovation Project of Guangxi Graduate Education(No.YCBZ2022079), Self-financing Project of Health Commission of Guangxi Zhuang Autonomous Region(No.Z-A20230474), Youth Science Foundation of Guangxi medical University (No.GXMUYSF202316, GXMUYSF202351).
Disclosure
The authors declare that they have no competing interests.
References
1. Le Berre C, Honap S, Peyrin-Biroulet L. Ulcerative colitis. Lancet. 2023;402(10401):571–584. doi:10.1016/s0140-6736(23)00966-2
2. Dolinger M, Torres J, Vermeire S. Crohn’s disease. Lancet. 2024;403(10432):1177–1191. doi:10.1016/s0140-6736(23)02586-2
3. Calvez V, Puca P, Di Vincenzo F, et al. Novel insights into the pathogenesis of inflammatory bowel diseases. Biomedicines. 2025;13(2):305. doi:10.3390/biomedicines13020305
4. Jairath V, Narula N, Ungaro RC, Romo Bautista I, Adsul S. Novel outcomes in inflammatory bowel disease. J Crohn’s Colitis. 2025;19(4):jjaf040. doi:10.1093/ecco-jcc/jjaf040
5. Knowles SR, Keefer L, Wilding H, Hewitt C, Graff LA, Mikocka-Walus A. Quality of life in inflammatory bowel disease: a systematic review and meta-analyses-part II. Inflamm Bowel Dis. 2018;24(5):966–976. doi:10.1093/ibd/izy015
6. Cai Z, Wang S, Li J. Treatment of inflammatory bowel disease: a comprehensive review. Front Med. 2021;8:765474. doi:10.3389/fmed.2021.765474
7. Ballesta-López O, Gil-Candel M, Centelles-Oria M, et al. Pharmacogenetics in response to biological agents in inflammatory bowel disease: a systematic review. Int J Mol Sci. 2025;26(4):1760. doi:10.3390/ijms26041760
8. Kumar M, Murugesan S, Ibrahim N, Elawad M, Al Khodor S. Predictive biomarkers for anti-TNF alpha therapy in IBD patients. J Transl Med. 2024;22(1):284. doi:10.1186/s12967-024-05058-1
9. Vaisman-Mentesh A, Rosenstein S, Yavzori M, et al. Molecular landscape of anti-drug antibodies reveals the mechanism of the immune response following treatment with TNFα antagonists. Front Immunol. 2019;10:2921. doi:10.3389/fimmu.2019.02921
10. Zhang D, Tang Z, Huang H, et al. Metabolic regulation of gene expression by histone lactylation. Nature. 2019;574(7779):575–580. doi:10.1038/s41586-019-1678-1
11. Lv M, Huang Y, Chen Y, Ding K. Lactylation modification in cancer: mechanisms, functions, and therapeutic strategies. Exp Hematol Oncol. 2025;14(1):32. doi:10.1186/s40164-025-00622-x
12. Zhou J, Ma X, Liu X, et al. The impact of histone lactylation on the tumor microenvironment and metabolic pathways and its potential in cancer therapy. Genes Genom. 2024;46(9):991–1011. doi:10.1007/s13258-024-01554-2
13. Hu Y, He Z, Li Z, et al. Lactylation: the novel histone modification influence on gene expression, protein function, and disease. Clin Epigenetics. 2024;16(1):72. doi:10.1186/s13148-024-01682-2
14. Irizarry-Caro RA, McDaniel MM, Overcast GR, Jain VG, Troutman TD, Pasare C. TLR signaling adapter BCAP regulates inflammatory to reparatory macrophage transition by promoting histone lactylation. Proc Natl Acad Sci USA. 2020;117(48):30628–30638. doi:10.1073/pnas.2009778117
15. Moreno-Yruela C, Zhang D, Wei W, et al. Class I histone deacetylases (HDAC1-3) are histone lysine delactylases. Sci Adv. 2022;8(3):eabi6696. doi:10.1126/sciadv.abi6696
16. Cheng Z, Huang H, Li M, Liang X, Tan Y, Chen Y. Lactylation-related gene signature effectively predicts prognosis and treatment responsiveness in hepatocellular carcinoma. Pharmaceuticals. 2023;16(5):644. doi:10.3390/ph16050644
17. Gao M, Wang M, Zhou S, et al. Machine learning-based prognostic model of lactylation-related genes for predicting prognosis and immune infiltration in patients with lung adenocarcinoma. Cancer Cell Int. 2024;24(1):400. doi:10.1186/s12935-024-03592-y
18. Yang Y, Sun X, Liu B, et al. Identifying Lactylation-related biomarkers and therapeutic drugs in ulcerative colitis: insights from machine learning and molecular docking. BMC Pharmacol Toxicol. 2025;26(1):103. doi:10.1186/s40360-025-00939-7
19. Wu J, Lv Y, Hao P, et al. Immunological profile of lactylation-related genes in Crohn’s disease: a comprehensive analysis based on bulk and single-cell RNA sequencing data. J Transl Med. 2024;22(1):300. doi:10.1186/s12967-024-05092-z
20. Luo M, Zhao F, Cheng H, Su M, Wang Y. Macrophage polarization: an important role in inflammatory diseases. Front Immunol. 2024;15:1352946. doi:10.3389/fimmu.2024.1352946
21. Zhang K, Guo J, Yan W, Xu L. Macrophage polarization in inflammatory bowel disease. Cell Commun Signal. 2023;21(1):367. doi:10.1186/s12964-023-01386-9
22. Xu B, Liu Y, Li N, Geng Q. Lactate and lactylation in macrophage metabolic reprogramming: current progress and outstanding issues. Front Immunol. 2024;15:1395786. doi:10.3389/fimmu.2024.1395786
23. Yang JH, Li JH, Shao P, Zhou H, Chen YQ, Qu LH. starBase: a database for exploring microRNA-mRNA interaction maps from argonaute CLIP-seq and degradome-seq data. Nucleic Acids Res. 2011;39(Database issue):D202–D209. doi:10.1093/nar/gkq1056
24. Liang M, Zhang C, Yang Y, Cui Q, Zhang J, Cui C. TransmiR v3.0: an updated transcription factor-microRNA regulation database. Nucleic Acids Res. 2025;53(D1):D318–D323. doi:10.1093/nar/gkae1081
25. Zhou G, Soufan O, Ewald J, Hancock REW, Basu N, Xia J. NetworkAnalyst 3.0: a visual analytics platform for comprehensive gene expression profiling and meta-analysis. Nucleic Acids Res. 2019;47(W1):W234–W241. doi:10.1093/nar/gkz240
26. Daina A, Michielin O, Zoete V. SwissTargetPrediction: updated data and new features for efficient prediction of protein targets of small molecules. Nucleic Acids Res. 2019;47(W1):W357–W364. doi:10.1093/nar/gkz382
27. Gallo K, Goede A, Preissner R, Gohlke BO. SuperPred 3.0: drug classification and target prediction-a machine learning approach. Nucleic Acids Res. 2022;50(W1):W726–W731. doi:10.1093/nar/gkac297
28. Keiser MJ, Roth BL, Armbruster BN, Ernsberger P, Irwin JJ, Shoichet BK. Relating protein pharmacology by ligand chemistry. Nat Biotechnol. 2007;25(2):197–206. doi:10.1038/nbt1284
29. Chen Y, Mai Q, Chen Z, et al. Dietary palmitoleic acid reprograms gut microbiota and improves biological therapy against colitis. Gut Microbes. 2023;15(1):2211501. doi:10.1080/19490976.2023.2211501
30. Yu Y, Yang W, Bilotta AJ, Zhao X, Cong Y, Li Y. L-lactate promotes intestinal epithelial cell migration to inhibit colitis. FASEB J. 2021;35(4):e21554. doi:10.1096/fj.202100095R
31. Perler BK, Ungaro R, Baird G, et al. Presenting symptoms in inflammatory bowel disease: descriptive analysis of a community-based inception cohort. BMC Gastroenterol. 2019;19(1):47. doi:10.1186/s12876-019-0963-7
32. Gold SL, Manning L, Kohler D, Ungaro R, Sands B, Raman M. Micronutrients and their role in inflammatory bowel disease: function, assessment, supplementation, and impact on clinical outcomes including muscle health. Inflamm Bowel Dis. 2023;29(3):487–501. doi:10.1093/ibd/izac223
33. Jang DI, Lee AH, Shin HY, et al. The role of Tumor Necrosis Factor Alpha (TNF-α) in autoimmune disease and current TNF-α Inhibitors in therapeutics. Int J Mol Sci. 2021;22(5):2719. doi:10.3390/ijms22052719
34. Schultheiss JPD, Mahmoud R, Louwers JM, et al. Loss of response to anti-TNFα agents depends on treatment duration in patients with inflammatory bowel disease. Aliment Pharmacol Ther. 2021;54(10):1298–1308. doi:10.1111/apt.16605
35. Wysocki T, Paradowska-Gorycka A. Pharmacogenomics of anti-TNF treatment response marks a new era of tailored rheumatoid arthritis therapy. Int J Mol Sci. 2022;23(4):2366. doi:10.3390/ijms23042366
36. Sharma B, Agriantonis G, Twelker K, et al. Gut microbiota serves as a crucial independent biomarker in Inflammatory Bowel Disease (IBD). Int J Mol Sci. 2025;26(6):2503. doi:10.3390/ijms26062503
37. Palmela C, Chevarin C, Xu Z, et al. Adherent-invasive Escherichia coli in inflammatory bowel disease. Gut. 2018;67(3):574–587. doi:10.1136/gutjnl-2017-314903
38. Zhou Y, Xu ZZ, He Y, et al. Gut microbiota offers universal biomarkers across ethnicity in inflammatory bowel disease diagnosis and infliximab response prediction. mSystems. 2018;3(1):e00188–17. doi:10.1128/mSystems.00188-17
39. Rastogi S, Singh A. Gut microbiome and human health: exploring how the probiotic genus Lactobacillus modulate immune responses. Front Pharmacol. 2022;13:1042189. doi:10.3389/fphar.2022.1042189
40. Louis P, Duncan SH, Sheridan PO, Walker AW, Flint HJ. Microbial lactate utilisation and the stability of the gut microbiome. Gut microbiome. 2022;3:e3. doi:10.1017/gmb.2022.3
41. Che X, Zhang Y, Chen X, et al. The lactylation-macrophage interplay: implications for gastrointestinal disease therapeutics. Front Immunol. 2025;16:1608115. doi:10.3389/fimmu.2025.1608115
42. Hou F, Bian X, Jing D, Gao H, Zhu F. Hypoxia, hypoxia-inducible factors and inflammatory bowel diseases. Gastroenterol Rep. 2024;12:goae030. doi:10.1093/gastro/goae030
43. Lund J, Ouwens DM, Wettergreen M, Bakke SS, Thoresen GH, Aas V. Increased glycolysis and higher lactate production in hyperglycemic myotubes. Cells. 2019;8(9):1101. doi:10.3390/cells8091101
44. Fang Y, Li Z, Yang L, et al. Emerging roles of lactate in acute and chronic inflammation. Cell Commun signal. 2024;22(1):276. doi:10.1186/s12964-024-01624-8
45. Liu H, Pan M, Liu M, et al. Lactate: a rising star in tumors and inflammation. Front Immunol. 2024;15:1496390. doi:10.3389/fimmu.2024.1496390
46. Certo M, Tsai CH, Pucino V, Ho PC, Mauro C. Lactate modulation of immune responses in inflammatory versus tumour microenvironments. Nat Rev Immunol. 2021;21(3):151–161. doi:10.1038/s41577-020-0406-2
47. Zhang J, Wu D, Zeng F, et al. Lactate metabolic reprogramming and histone lactylation modification in sepsis. Int J Biol Sci. 2025;21(11):5034–5055. doi:10.7150/ijbs.116088
48. Wang J, Yang P, Yu T, et al. Lactylation of PKM2 suppresses inflammatory metabolic adaptation in pro-inflammatory macrophages. Int J Biol Sci. 2022;18(16):6210–6225. doi:10.7150/ijbs.75434
49. Bastida G, Mínguez A, Nos P, Moret-Tatay I. Immunoepigenetic regulation of inflammatory bowel disease: current insights into novel epigenetic modulations of the systemic immune response. Genes. 2023;14(3):554. doi:10.3390/genes14030554
50. Wang W, Wang H, Wang Q, Yu X, Ouyang L. Lactate-induced protein lactylation in cancer: functions, biomarkers and immunotherapy strategies. Front Immunol. 2024;15:1513047. doi:10.3389/fimmu.2024.1513047
51. Zhou HC, Yu WW, Yan XY, et al. Lactate-driven macrophage polarization in the inflammatory microenvironment alleviates intestinal inflammation. Front Immunol. 2022;13:1013686. doi:10.3389/fimmu.2022.1013686
52. Shi W, Cassmann TJ, Bhagwate AV, Hitosugi T, Ip WKE. Lactic acid induces transcriptional repression of macrophage inflammatory response via histone acetylation. Cell Rep. 2024;43(2):113746. doi:10.1016/j.celrep.2024.113746
53. Privitera G, Pugliese D, Rapaccini GL, Gasbarrini A, Armuzzi A, Guidi L. Predictors and early markers of response to biological therapies in inflammatory bowel diseases. J Clin Med. 2021;10(4):853. doi:10.3390/jcm10040853
54. Chen L, Zhang C, Niu R, Mao R, Qiu Y, Feng R. P915 multi-omics biomarkers for the prediction of response to biologics in patients with inflammatory bowel disease. J Crohn’s Colitis. 2024;18(Supplement_1):i1660–i1661. doi:10.1093/ecco-jcc/jjad212.1045
55. Gulyaeva LF, Kushlinskiy NE. Regulatory mechanisms of microRNA expression. J Transl Med. 2016;14(1):143. doi:10.1186/s12967-016-0893-x
56. Catalanotto C, Cogoni C, Zardo G. MicroRNA in control of gene expression: an overview of nuclear functions. Int J Mol Sci. 2016;17(10):1712. doi:10.3390/ijms17101712
57. Certo M, Llibre A, Lee W, Mauro C. Understanding lactate sensing and signalling. Trends Endocrinol Metab. 2022;33(10):722–735. doi:10.1016/j.tem.2022.07.004
 © 2025 The Author(s). This work is published and licensed by Dove Medical Press Limited. The
full terms of this license are available at https://www.dovepress.com/terms
and incorporate the Creative Commons Attribution
- Non Commercial (unported, 4.0) License.
By accessing the work you hereby accept the Terms. Non-commercial uses of the work are permitted
without any further permission from Dove Medical Press Limited, provided the work is properly
attributed. For permission for commercial use of this work, please see paragraphs 4.2 and 5 of our Terms.
© 2025 The Author(s). This work is published and licensed by Dove Medical Press Limited. The
full terms of this license are available at https://www.dovepress.com/terms
and incorporate the Creative Commons Attribution
- Non Commercial (unported, 4.0) License.
By accessing the work you hereby accept the Terms. Non-commercial uses of the work are permitted
without any further permission from Dove Medical Press Limited, provided the work is properly
attributed. For permission for commercial use of this work, please see paragraphs 4.2 and 5 of our Terms.