
Back to Journals » International Journal of General Medicine » Volume 18
Exploring the Potential Regulatory Mechanisms of Mitophagy in Ischemic Cardiomyopathy
Authors Li Z, Kong J, Xi S, Jin Z, Yang F, Zhu Z, Liu L
Received 25 January 2025
Accepted for publication 28 May 2025
Published 5 June 2025 Volume 2025:18 Pages 2881—2899
DOI https://doi.org/10.2147/IJGM.S519388
Checked for plagiarism Yes
Review by Single anonymous peer review
Peer reviewer comments 2
Editor who approved publication: Prof. Dr. Yuriy Sirenko
Zhaobin Li,* Jiajie Kong,* Shuqiang Xi, Zeyue Jin, Fan Yang, Zhe Zhu, Lei Liu
Department of Cardiac Surgery, Hebei Medical University Third Hospital, Shijiazhuang, Hebei, People’s Republic of China
*These authors contributed equally to this work
Correspondence: Lei Liu, Department of Cardiac Surgery, Hebei Medical University Third Hospital, Shijiazhuang, Hebei, People’s Republic of China, Email [email protected]
Purpose: Ischemic cardiomyopathy (ICM) was a clinical syndrome. Long - term myocardial blood supply insufficiency, caused by coronary atherosclerotic plaque, led to myocardial nutritional disorders and atrophy. After large - scale myocardial infarction, fibrous tissue hyperplasia impaired cardiac systolic and/or diastolic functions, causing heart failure and arrhythmia. Study shows that dysregulated mitophagy can lead to cardiomyocyte death and cardiomyopathy. However, it is still uncertain how mitophagy related genes (MRGs) may affect the diagnosis of ICM.
Patients and Methods: Data were obtained from public databases. Subsequently, mitochondria autophagy score-related genes (MSRGs) were obtained through Weighted Gene Co-expression Network Analysis (WGCNA). Then, an intersection was taken between MSRGs and the differentially expressed genes (DEGs) obtained from the differential expression analysis to obtain DE-MSRGs. Then, biomarkers were identified through machine learning algorithms and Receiver Operating Characteristic curve (ROC) analysis. Next, analyses of immune infiltration, molecular regulatory network, and drug prediction were carried out. Finally, Reverse Transcription Quantitative Polymerase Chain Reaction (RT-qPCR) was performed on the biomarkers. It provides a certain theoretical basis for the research on the mechanism of the occurrence and development of ICM.
Results: In total, 99 DE-MSRGs between ICM and control groups were gained. The four biomarkers (PPDPF, DPEP2, LTBP1, SOCS2) were acquired, and all biomarkers had good diagnostic efficacy for ICM. The content of 3 immune cells between ICM and control groups was significantly different, namely T cells, CD8+ T cells, and neutrophil, and all biomarkers were considerably positively correlated with T cells. The ceRNA network contained 4 mRNAs, 14 miRNAs, and 12 lncRNAs, and TF-mRNA network contained 32 nodes and 38 edges. Finally, 45 drugs targeting the biomarkers were predicted, such as Salmeterol, Histamine, Rotavirus vaccine, etc. Importantly, this all 4 biomarkers were higher in ICM samples in RT-qPCR analysis.
Conclusion: Our findings provided four mitophagy related biomarkers (PPDPF, DPEP2, LTBP1, and SOCS2) for diagnosis of ICM, providing a scientific reference for further studies of ICM.
Keywords: ischemic cardiomyopathy, mitophagy, LASSO, ROC, ceRNA
Introduction
Ischemic cardiomyopathy (ICM) is a leading cause of reduced ejection fraction in the heart and ranks as one of the most common causes of death globally.1,2 ICM is a pathological condition induced by diminished blood circulation and cardiac supply, reduced myocardial oxygenation, and disrupted energy metabolism in cardiac cells.3 Characterized by diffuse left ventricular systolic dysfunction, it leads to myocardial abnormalities, accompanied by ischemia, degeneration, necrosis, fibrosis, and scar formation, ultimately resulting in poor prognosis.4 Cardiomyocytes, being terminally differentiated cells incapable of regeneration, are replaced by scar tissue upon death, thereby impairing cardiac structure and function, and eventually progressing to heart failure.4 The detailed mechanisms involved in the genesis and development of ICM remain largely elusive.5 Therefore, exploring novel and valuable biomarkers for the early diagnosis of ischemic cardiomyopathy is of key importance.
Mitochondria, as the central organelles for cellular energy metabolism, biosynthesis, and signal transduction, play a key role in cellular stress adaptation.6 Notably, mitochondrial dysfunction is associated with various systemic diseases: severe sepsis can disrupt mitochondrial structure (eg, incomplete mitophagy, abnormal fission), leading to ATP depletion and serving as a core pathogenic factor in sepsis-induced cardiomyopathy (SICM).7 Diseases such as hyperthyroidism, which dramatically increase metabolic demand, force mitochondria to accelerate respiration to maintain ATP production,8 resulting in excessive carbohydrate and lipid breakdown that further exacerbates myocardial metabolic disturbance.9 ATP generated via mitochondrial oxidative phosphorylation is the primary energy source for cardiac metabolism.10 However, mitochondrial dysfunction in cardiomyocytes can intensify oxidative damage, not only accelerating lethal cardiac injury11 but also being closely linked to arrhythmias, myocardial fibrosis, and acute coronary syndromes.12 Mitophagy, as a selective quality-control mechanism for removing damaged mitochondria, is triggered by oxidative stress or changes in energy demand and is vital for maintaining cardiomyocyte homeostasis.13,14
The role of mitophagy in the ICM remains unclear. We hypothesize that mitophagy-related genes may be involved in the pathological progression of ICM and could serve as novel molecular markers for its early diagnosis. Therefore, this study aimed to identify and validate mitophagy-related biomarkers associated with ICM through bioinformatics approaches and to explore the intricate relationship between mitophagy and ICM. Our findings contribute to a deeper understanding of the complex molecular mechanisms underlying ICM and provide a solid foundation for the development of clinical diagnostic and therapeutic strategies.
Materials and Methods
Data Extraction
Ischemic cardiomyopathy (ICM) was a clinical syndrome. Long - term myocardial blood supply insufficiency, caused by coronary atherosclerotic plaque, led to myocardial nutritional disorders and atrophy. After large - scale myocardial infarction, fibrous tissue hyperplasia impaired cardiac systolic and/or diastolic functions, causing heart failure and arrhythmia. ICM-related datasets (GSE116250 and GSE5406) were acquired from the Gene Expression Omnibus (GEO) database (https://www.ncbi.nlm.nih.gov/geo/). This study focuses on ICM, and includes patients who have been clinically diagnosed with ICM for analysis. In the GSE116250 dataset, ICM was determined based on whether there was a history of myocardial infarction in the previous medical history, and specifically, myocardial infarction was defined as ICM. The training set GSE116250 contained 13 ICM left ventricles samples and 14 controls,15 and 37 patients with dilated cardiomyopathy were excluded. In the GSE5406 dataset, all heart failure patients had New York Heart Association class 3 to 4 symptoms and left ventricular systolic dysfunction, with mean ± SD ejection fraction of 14 ± 8%, defined as having ICM.14 GSE5406 included 108 ischaemic cardiomyopathy samples with systolic heart failure due to ischemic cardiomyopathy and 16 controls from normally functioning myocardium from unused donor heart and served as a validation set,16 and 41 patients with idiopathic cardiomyopathy were excluded. The GSE116250 and GSE5406 datasets were chosen to investigate the potential regulatory mechanisms of mitochondrial autophagy in ischaemic cardiomyopathy based on the considerations that these datasets cover a wider patient population, provide more detailed clinical information, have a high level of data quality and reliability, and have a high degree of fit with the study aims and hypotheses. Selection criteria and steps for datasets: firstly, relevant datasets were screened according to the type of disease under study, ischaemic cardiomyopathy. Then, the sample sizes of the datasets were further evaluated, and preference was given to those datasets with sufficiently large sample sizes to support statistical analyses and testing of hypotheses. Finally, after comprehensively considering the rationality of experimental design, data availability, and research needs, GSE116250 and GSE5406 were selected as the final research subjects. Mitophagy is a type of selective autophagy that removes mitochondria with abnormal functions in cells. In related studies.17 Genes related to mitophagy refer to those genes that play a crucial role in the process of mitochondrial autophagy in cells. Additionally, search with “mitophagy” as the keyword in the Pathway Unification database (https://pathcards.genecards.org/), and 29 mitophagy related genes (MRGs) were obtained (Supplementary Table S1). A flowchart of the data analysis pipeline in this study was shown in Supplementary Figure S1.
Creation of Weighted Gene Co-Expression Network
Using the ssGSEA algorithm of the “GSVA” R package (version 1.38.2),18 the expression data of 29 MRGs were firstly extracted, and the enrichment scores of MRGs for each sample in the GSE116250 dataset were calculated. Subsequently, weighted gene co-expression network analysis was performed with the help of the “WGCNA” R package (version 1.70–3),19 and the enrichment scores calculated above were used as sample features to construct and identify gene modules that were significantly co-expressed with MRGs. The samples were clustered to remove outliers. To ensure that gene interactions conform to the scale-free distribution to the maximum extent possible, we then performed soft threshold (β) determination. Topology selection for scale-free networks is more critical and has more stringent selection criteria compared to connectivity selection. Thereafter, the similarity among genes was calculated according to the adjacency, and the gene dendrogram including different modules was built using the degree of dissimilarity. Subsequently, the minimum number of genes per gene module was set to 100, and modules were merged using a correlation threshold of 0.2 to finalise the number of modules. Among these modules, we selected the module with the strongest correlation with MRGs enrichment scores (Cor = 0.44, P < 0.05) as the key module and obtained the final key module genes by plotting a heat map of the correlation between modules and traits.
Screening of Differentially Expressed Genes (DEGs) between ICM and Control Group
In order to identify genes with significant differences in expression between ICM and control groups and to further reveal the role of these genes in specific biological processes. The differentially expressed genes (DEGs) between ICM and control groups in GSE116250 were screened using “limma” R package (version 3.46.0) with |log2FC| > 1 and adj P < 0.05.20 The Benjamini–Hochberg (BH) correction method was used to calculate the adjusted P-value. In addition to traditional microarray data analysis, limma has now been widely extended to RNA sequencing data analysis, where it excels in handling small samples and high-dimensional data, as well as controlling false positive rates. Then, we took the intersection between DEGs and MSRGs to gain differentially expressed MSRGs (DE-MSRGs) through ggVennDiagram (version 1.2.2). Subsequently, Gene Ontology (GO) and Kyoto Encyclopedia of Genes and Genomes (KEGG) were confirmed using the “clusterProfiler” R package (version 4.4.4) (P < 0.05)21 and the “org.Hs.eg.db” R package (version 3.12.0) (P < 0.05) for up- and down-regulated DE-MSRGs.22 Besides, STRING database (https://cn.string-db.org/) was adopt to create the protein–protein interaction (PPI) network for these genes with confidence = 0.15.
Screening of the Biomarkers
The Least Absolute Shrinkage and Selection Operator (LASSO) (via “glmnet” R package (version 4.1–1)) and Support Vector Machine-Recursive Feature Elimination (SVM-RFE) were utilized to choose the characteristic genes, separately.23 After that, the intersection of two machine learning-obtained characteristic genes was established to gain key characteristic genes, which were defined as biomarkers. Afterward, the diagnosis value of biomarkers for ICM was assessed and validated in GSE116250 and GSE5406 through Receiver Operating Characteristic (ROC) curves via “pROC” R package (version 1.17.0.1).24 In addition, for the GSE5406 dataset, “PRROC” R package25 (version 1.3.1) was employed to plot precision-recall (PRC) curves to further assess the performance of biomarkers in the diagnosis of ICM. The expression situation of the biomarkers between ICM and control groups were analyzed in GSE116250 and GSE5406, respectively.
Additionally, based on the biomarkers, the nomogram was built to predict the risk rate of ICM via “regplot” R package (version 1.1) and “rms” R package (version 4.1–1), and corresponding calibration curve was drawn to verify the accuracy of nomogram.
Immune Analysis
In this study, we first calculated the content of 8 immune cells in all samples in GSE116250 using mcp counter algorithm of “immunedeconv” R package (version 2.0.4).26 Then, the differences of content of immune cells between ICM and control groups were compared via Wilcoxon Test (P < 0.05). In order to understand the complex relationships and networks of interactions between immune cells, the relevant analysis of differential immune cells with each other was constructed (Cor > 0.3, P < 0.05). Also, Spearman correlation analysis was performed for biomarkers and immune cells (Cor > 0.3, P < 0.05).
Construction of Regulatory Networks
To better explore the mechanisms involved in the biomarkers in ICM, we created the lncRNA-miRNA-mRNA network and transcription factor (TF)-mRNA network. The miRNAs regulating the biomarkers were predicted via miRTarBase database (https://mirtarbase.cuhk.edu.cn/), miRDB database (http://www.mirdb.org), and TargetScan database (https://www.targetscan.org), and the predicted miRNAs of the three databases were intersected to obtain the common miRNAs. Then, by accessing the StarBase database (http://starbase.sysu.edu.cn) and selecting the “miRNA-lncRNA” option on the webpage, we selected the human races and the predicted miRNAs one by one. Based on the screening criteria, the predicted results were downloaded separately to identify lncRNAs with regulatory interactions with common miRNAs (degraExpNum ≥ 1 and clipExpNum ≥ 1). Afterward, the TFs targeting biomarkers were predicted by NetworkAnalyst database (https://www.networkanalyst.ca/). In the end, the Cytoscape software (version 3.8.2) was utilized to visualize the ceRNA network and TF-mRNA network.27
Drug Prediction of the Biomarkers
Each biomarker was applied as a key word to search drugs interacting with biomarkers in the DrugBank (https://go.drugbank.com/). The Cytoscape software (version 3.8.2) was used to visualize the biomarker-drug network.27
Reverse Transcription Quantitative Polymerase Chain Reaction (RT-qPCR)
A total of 10 Blood samples (5 normal and 5 ICM samples) were obtained from the clinic in the Hebei Medical University Third Hospital. Among the five patients with ICM, four were male and one was female. The mean body mass index (BMI) was 26.80 ± 3.64 kg/m². In the control group consisting of five patients, all were male. The mean body mass index (BMI) was 23.0 ± 2.18 kg/m². All participants were given informed consent. The study had the approval of the Hebei Medical University Third Hospital ethics committee (approval number: W2024-061-1). The Peripheral Mononuclear Cells (PBMC) separation liquid with the same volume as that of the blood was added into a 15 mL centrifuge tube (when the volume of the blood was less than 3 mL, 3 mL of the separation liquid was added). The mixed whole blood sample was slowly added. After centrifugation at 2000g for 20 minutes, the liquid was separated into four layers, and the PBMCs were located in the second-layer, which was a ring-shaped milky white layer. The PBMC layer was carefully aspirated into a new centrifuge tube, and PBS was added to make the volume up to 15 mL. After the cells were resuspended, the PBMC sample was obtained. Total RNA was extracted from 10 samples using the TRIzol reagent (Ambion, USA) following the manufacturer’s protocol. Briefly, cells were lysed and resuspended in centrifuge tubes containing PBMC, to which 1 mL of TRIzol was added. After a 10-minute incubation, 300 µL of chloroform was added, and the mixture was centrifuged at 12,000g, 4°C for 15 minutes to separate the RNA in the supernatant. Subsequently, an equal volume of ice-cold isopropanol was added to the RNA-containing supernatant, followed by a 10-minute incubation and centrifugation at 12,000g, 4°C for 10 minutes to precipitate the RNA. The RNA pellet was washed with 1 mL of 75% ethanol, incubated for 2 minutes, and then centrifuged at 7500g, 4°C for 5 minutes. After air-drying for 20 minutes or blow-drying in an ultra-clean bench to remove residual ethanol and water, the RNA pellet became transparent. Finally, 20–50 µL of RNase-free water was added to dissolve the RNA completely, followed by a 15-minute incubation.
Next, the concentration of RNA was determined using the NanoPhotometer N50. Subsequently, cDNA was synthesized by reverse transcription using the SureScript First-strand cDNA synthesis kit, and the reverse transcription reaction was conducted using the S1000TM Thermal Cycler (Bio-Rad, USA). Quantitative PCR (qPCR) assays were performed using the CFX Connect Real-time Quantitative Fluorescence PCR Instrument (Bio-Rad, USA). The fluorescence probe used was 2xUniversal Blue SYBR Green qPCR Master Mix (Servicebio, Wuhan, China). The cycling conditions were as follows: pre-denaturation at 95°C for 1 minute, followed by 40 cycles of denaturation at 95°C for 20 seconds, annealing at 55°C for 20 seconds, and extension at 72°C for 30 seconds. Glyceraldehyde-3-Phosphate Dehydrogenase (GAPDH) was employed as the internal reference gene. The relative quantification of mRNA levels was calculated using the 2^-ΔΔCT method. Primer sequences can be found in Table 1.
 |
Table 1 The Sequences of All Primers in RT-qPCR |
Statistical Analysis
The R software (https://www.r-project.org/) was utilized to conduct statistical analysis. Differences analysis was executed via the Wilcoxon test (P < 0.05).
Results
Identification of 99 DE-MSRGs
The sample clustering analysis showed that there were no outlier samples in GSE116250 (Figure 1A). When the β was 18, the mean connectivity converges to 0 (Figure 1B). In total, 9 modules with a unique color were characterized, and the MEturquoise module was most relevant to MRGs enrichment scores (Figure 1C, Supplementary Figure S2). Then, the correlation between genes in MEturquoise module and MRGs enrichment scores was demonstrated via scatter chart (Supplementary Figure S3). There were 2441 MSRGs gained for subsequent analysis. Between ICM and control groups, a total of 529 DEGs were selected, containing 412 up-regulated genes and 117 down-regulated genes (Figure 2A). The heatmap showed the expression of the top 10 up- and down-regulated genes, sorted by default P-adjust (Figure 2B). Moreover, 99 DE-MSRGs were derived through intersecting MSRGs and DEGs (Figure 2C). The PPI network of these genes was created, including 94 nodes and 227 edges (Figure 2D). ACTA1 interacted with 25 proteins, such as TRIP6, PPP1R1A, IRX6, and so on. In addition to ACTA1, proteins such as TGFB2, AQP4, APOB, ACHE, and FHL1 also showed stronger interactions with other proteins.
 |
Figure 1 Weighted Gene Co-expression Network Analysis (WGCNA). (A) Sample clustering. The branches represent the samples and the vertical coordinates represent the height of the hierarchical clustering. (B) Soft threshold screening. The horizontal axis represents the value of the weight parameter power, the vertical axis of the left panel represents signed R2, and the vertical axis of the right panel represents the mean value of the adjacency function. (C) Module clustering tree. The top half shows a hierarchical clustering dendrogram of genes, while the bottom half presents the corresponding gene modules, where genes that are close to each other in the dendrogram (clustered under the same branch) are classified into the same module. |
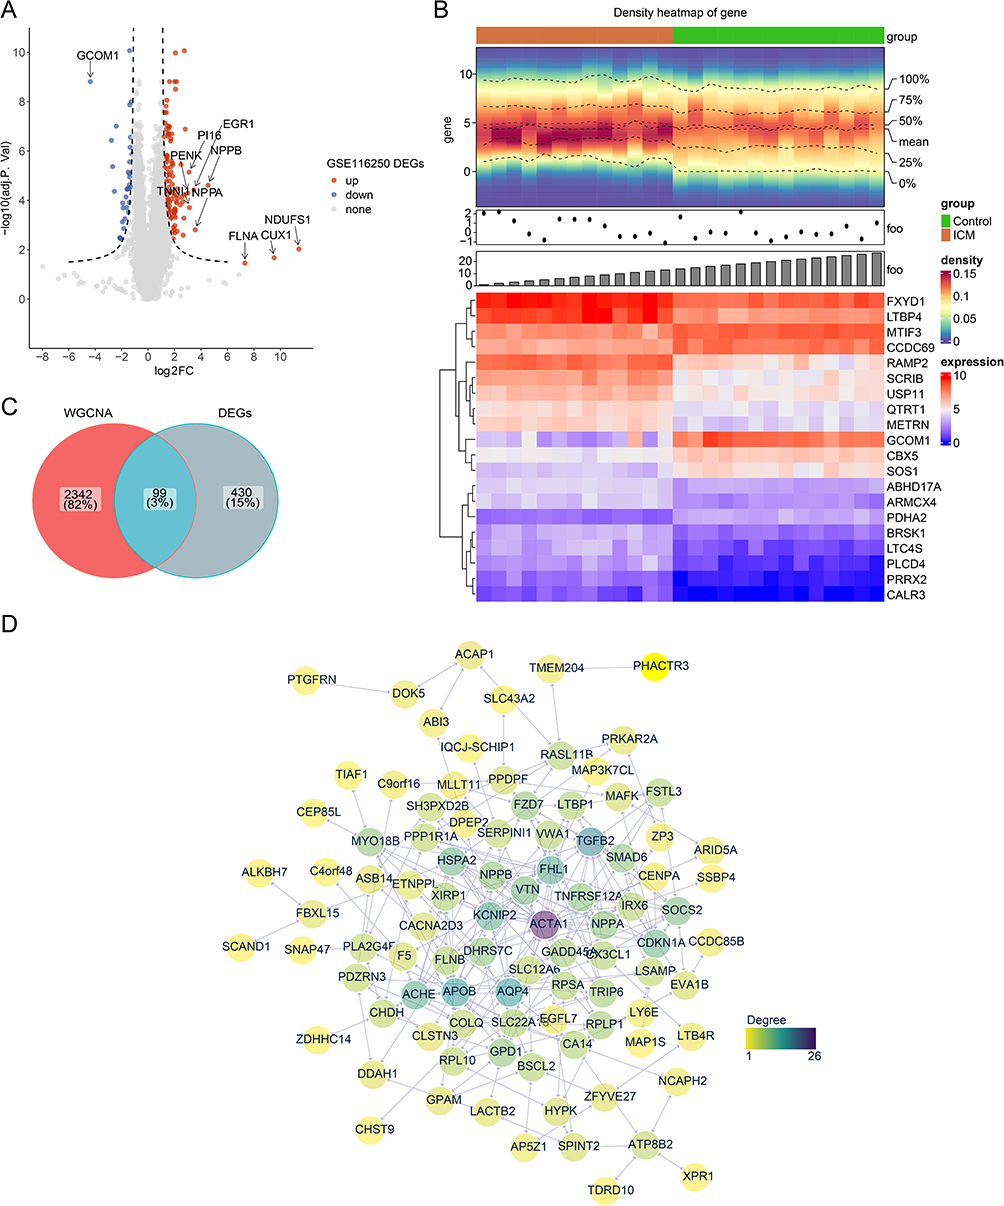 |
Figure 2 Differential expression and protein–protein interaction (PPI) network analyses for differentially expressed mitophagy score related genes (DE-MSRGs). (A) Volcano plot and (B) Heatmap of 529 DEGs between the ischemic cardiomyopathy (ICM) and control groups (adj. p < 0.05 and |log2FC| > 1). The red colour in the volcano graph indicates an upward tone and the blue colour a downward tone. Red in the heat map represents high expression and purple represents low expression. (C) The intersection of differentially expressed genes (DEGs) and Weighted Gene Co-expression Network Analysis (WGCNA) to obtain DE-MSRGs. (D) PPI analysis for the DE-MSRGs. Yellow to purple means increasing degree. |
GO and KEGG Pathway Enrichment Analysis of DE-MSRGs
The enrichment analysis demonstrated that there were 269 GO items significantly enriched, including 219 GO biological process (BP) items, 24 GO cellular components (CC) items, and 26 GO molecular functions (MF) items. Among these, the up-regulated DE-MSRGs were involved in the functions such as “collagen-containing extracellular matrix”, “regulation of cellular response to growth factor stimulus”, “cell grow”, “regulation of cell grow”, “cytokine receptor binding”, “extracellular matrix structural constituent” and other items (Figure 3A). While the down-regulated DE-MSRGs were mainly enriched for functions such as “cell growth”, “negative regulation of growth”, “regulation of cell growth”, “channel activity”, “chylomicron” and etc (Figure 3B). In addition, the up-regulated DE-MSRGs enriched KEGG pathways mainly in Hepatocellular carcinoma, Gastric cancer, Pancreatic cancer, Chronic myeloid leukemia, Basal cell carcinoma and others (Figure 3C). While KEGG pathways such as Glycerophospholipid metabolism, Adrenergic signaling in cardiomyocytes, Nitrogen metabolism, alpha - Linolenic acid metabolism and Oxytocin signaling pathway were mainly associated with down-regulated DE-MSRGs (Figure 3D). The Go and KEGG items were separately reported in Supplementary Tables S2–S4.
 |
Figure 3 Function enrichment analysis for DE-MSRGs. (A) Gene Ontology (GO) enrichment analysis of up-regulated differentially expressed mitophagy score related genes (DE-MSRGs). (B) GO enrichment analysis of down-regulated differentially expressed mitophagy score related genes (DE-MSRGs). (C) Kyoto Encyclopedia of Genes and Genomes (KEGG) enrichment analysis of up-regulated DE-MSRGs. (D) KEGG enrichment analysis of down-regulated DE-MSRGs. |
Four Biomarkers Had Diagnosis Values for ICM
After the LASSO algorithm, there were 10 characteristic genes obtained (Supplementary Figure S4A). Secondly, when the number of genes was varied from 1 to 99, the error rate for predicting the best point for disease and normal samples was 0.019 and the accuracy was 0.981, and the SVM algorithm corresponded to 34 feature genes. (Supplementary Figure S4B and C). The 4 biomarkers were identified by overlapping the above genes from 2 algorithms (Figure 4A). The area under curve (AUC) values were 0.995 (SOCS2), 0.857 (DPEP2), 0.973 (LTBP1) and 1 (PPDPF) in GSE116250 (Figure 4B). In GSE5406, the AUC values were 0.913 (LTBP1), 0.704 (PPDPF), 0.666 (SOCS2) and 0.747 (DPEP2) (Figure 4C). The PRC plot showed that the AUC values were 0.934 (SOCS2), 0.944 (DPEP2), 0.987 (LTBP1) and 0.933 (PPDPF) in GSE5406 (Figure 4D). Moreover, in both GSE16250 and GSE5406, the expression of all biomarkers between ICM and control groups was significantly different, and was higher in ICM group (Figure 4E and F). Additionally, the nomogram including the biomarkers was established (Supplementary Figure S5A). The calibration curve showed that the actual risk of ICM was close to the predicted risk, indicating that the nomogram had a high prediction accuracy for ICM (Supplementary Figure S5B). In conclusion, these results demonstrated that four biomarkers had diagnosis values for ICM.
 |
Figure 4 Screening and validation of the biomarkers. (A) Acquisition of biomarkers. (B) The ROC curves of the key genes in GSE116250. (C) The ROC curves for the biomarkers of the GSE5406. (D) The plot precision-recall (PRC) curves for the biomarkers of the GSE5406. (E) The expression of biomarkers in GSE116250. (F) The expression of biomarkers in GSE5406. *: p < 0.05, **: p < 0.01, ***: p < 0.001, ****: p < 0.0001. |
The Correlations Between T Cells and All Biomarkers Were Significant
Among the eight immune cells, the macrophages were the most abundant, while the natural killer (NK) cells were the least abundant (Figure 5A). Differential analysis suggested that the content of T cells, CD8+ T cells, and neutrophil between ICM and control groups was considerably different, and was higher in ICM group (Figure 5B). Moreover, these three immune cells were significantly positively correlated with each other (Figure 5C). Besides, PPDPF, DPEP2 and SOCS2 all showed the strongest association (Cor > 0.4, P < 0.05) with T cells, while LTBP1 showed the strongest correlation (Cor > 0.4, P < 0.05) with Neutrophil (Figure 5D).
 |
Figure 5 Immune-related analysis. (A) Boxplot of immune cell content. (B) Boxplot of immune cell content in ICM and control samples. Each point represents the content of different cells in different samples. *: p < 0.05, **: p < 0.01, ****: p < 0.0001. (C) Scatter plot of the correlation between differential immune cells. (D) A lollipop plot of the correlation between biomarkers and differential immune cells. The larger the circle, the stronger the correlation; the darker the colour, the larger the p-value. |
Establishment of ceRNA Network and TF-mRNA Network
Through a series of predictions, we gained a total of 14 miRNAs and 12 lncRNAs for constructing the ceRNA network. Afterward, the ceRNA network was created, containing 4 mRNAs, 14 miRNAs, 12 lncRNAs, and 46 lncRNA-miRNA-mRNA pairs (Figure 6A). The regulatory relationships included LINC01001-′hsa-miR-128-3p′-LTBP1, LINC01006-′hsa-miR-148a-3p′-DPEP2, EBLN3P-′hsa-miR-202-5p′-SOCS2, MALAT1-′hsa-miR-515-5p′-PPDPF, etc. The TF-mRNA network contained 32 nodes (4 mRNAs and 28 TFs) and 38 edges (Figure 6B). EGR1 might regulate SOCS2, DPEP2, and PPDPF. For SOCS2 and PPDPF, there were three common TFs, namely CCND1, KLF4, and POU5F1. A total of two common TFs (RUNX1 and BMI1) were predicted for SOCS2 and DPEP2. Besides, STAT3 and TP63 could regulated SOCS2 and LTBP1.
 |
Figure 6 Regulation network analysis. (A) The lncRNA-miRNA-mRNA regulatory network of the biomarkers. Blue represents mRNAs, red represents miRNAs, and green represents IncRNAs. (B) The TF-mRNA network of the biomarkers. Blue represents genes and yellow represents transcription factors. |
Construction of Drug-Biomarker Network and Expression Validation of Key Genes
We constructed a biomarker-drug interaction network by the DrugBank, including 4 mRNAs, 45 drugs, and 77 edges (Figure 7). We found that all drugs associated with SOCS2 were associated with DPEP2. The Clocortolone, Rosuvastatin, Salmeterol, Histamine, Rotavirus vaccine, and Clemastine were also related to LTBP1. Moreover, the RT-qPCR showed the expression of PPDPF (P = 0.0401), DPEP2 (P = 0.0163), LTBP1 (P = 0.04165), and SOCS2 (P = 0.0121) were significantly higher in ICM samples (Figure 8).
 |
Figure 7 The Drug-gene regulatory network of the biomarkers. The blue colour represents different genes and the purple colour represents different drugs. |
 |
Figure 8 Expression levels of key genes’ mRNA between the control group and ICM group. (A) PPDPF. (B) DPEP2. (C) LTBP1. (D) SOCS2. *: p < 0.05. |
Discussion
Ischemic cardiomyopathy (ICM) is one of the most common forms of heart disease.3 Integrative bioinformatics analyses identified four mitophagy-related biomarkers in ICM—PPDPF, DPEP2, LTBP1, and SOCS2—that are significantly upregulated in ICM compared with control samples. Both transcriptomic and clinical validation cohorts demonstrated marked differential expression of these genes. Immune cell profiling revealed significant differences in total T cells, CD8⁺ T cells, and neutrophils between ICM and control groups, and all four biomarkers exhibited strong positive correlations with T-cell infiltration. In addition, in silico drug–gene interaction analysis predicted 45 potential therapeutic compounds targeting these biomarkers, including histamine. Mitophagy, a well - recognized cellular process, selectively eliminates damaged mitochondria. It is crucial for maintaining intracellular hold cellular integrity.28 Research indicates that mitochondrial regulation and mitophagy are key in the pathogenesis of ICM.29 Thus, exploring the link between mitophagy and ICM mechanisms is essential for developing ICM treatments.
Pancreatic progenitor cell differentiation and proliferation factor (PPDPF) was first reported in a study involving zebrafish exocrine progenitor cells and developing pancreatic differentiation.30 PPDPF has been indicated as a key regulator of SOS Ras/Rac guanine nucleotide exchange factor 1 (SOS1),31 closely associated with Noonan syndrome and dilated cardiomyopathy.32–34 In the Sos1EK/EK mouse model, phenotypes such as epicardial fibrosis and adipocyte infiltration are observed, with SOS1 exhibiting RasGEF and RacGEF activities in cultured cells.33 Renin-angiotensin system (Ras) is known to have definitive impacts on cardiac hypertrophy,35 suggesting a potential link between PPDPF and ICM.
Dipeptidase-2 (DPEP2) identified as a membrane-bound dipeptidase hydrolyzing leukotriene D4 (LTD4) to leukotriene E4 (LTE4), is associated with inflammatory diseases and may participate in macrophage inflammatory responses.36,37 Studies have shown that DPEP2 is a crucial regulator of macrophages.38 Macrophages play roles in forming foam cells and atherosclerotic plaques in coronary artery disease and myocardial repair post-acute myocardial infarction.39,40 In our research, we validated DPEP2 as a risk factor for ICM through comprehensive expression analyses of GSE116250 and GSE5406 datasets. This strengthens the hypothesis of DPEP2’s involvement and enhances its significance in ICM pathogenesis, offering insights into the disease mechanisms.
Regarding latent transforming growth factor beta binding protein 1 (LTBP1), post-coronary artery injury studies show increased protein hydrolysis levels.41 LTBP1 indirectly influences coronary artery injury responses41–43 and co-localizes with fibrillin-1 in various tissues, though its specific role in cardiac vasculature remains uncertain41,44,45 LTBP-1 might be involved in transforming growth factor β 1 (TGF-β1) activation,46,47 a major determinant in arterial injury responses, closely linked with coronary artery damage. Thus, LTBP1 emerges as a potential target in ICM research.
Differential expression of mRNA from the suppressor of cytokine signaling (SOCS) family members is observed across various tissues.48 The mRNA levels of SOCS1 and SOCS3 are particularly pronounced in the thymus, spleen, and lungs, indicating a significant role in these organs.49 In contrast, SOCS2 mRNA is predominantly expressed in the adult heart, skeletal muscle, pancreas, and liver, suggesting unique tissue-specific functions and regulatory mechanisms within these environments.49 Suppressor of cytokine signaling (SOCS) protein has been established as negative regulators of cytokine receptor signaling through the Janus kinase (JAK)/signal transducer and activator of transcription (STAT) pathway,48 which plays a broad role in cardiovascular diseases.50 However, the functions of SOCS in the cardiovascular system remain poorly understood. Studies on Chagas Disease indicate that mice with SOCS2 deficiency are more prone to cardiac dysfunctions post Trypanosoma cruzi infection.51 SOCS2 inhibits cytokine receptor phosphorylation mediated by JAK, preventing STAT signal activation, providing negative feedback to JAK/STAT signaling activated by the IL-6 cytokine family.52 IL-6 is widely associated with cardiac pathologies and is considered to be linked to cardiac dysfunction.53 Li Z et al reported that inhibition of lncRNA-XIST targeting miR-133a suppresses autophagy, regulating SOCS2 to improve myocardial I/R injury.54 Studies suggest SOCS2 might exacerbate type 2 diabetes myocardial ischemia/reperfusion injury (MIRI) by inhibiting insulin-like growth factors 1 (IGF-1) expression through the JAK-STAT pathway,55 indicating a significant link between SOCS2 and ICM worthy of in-depth research.
Immune infiltration analysis revealed that, the correlations between T cells and all four biomarkers were significant. Among all immune cells, T cells have the closest relationship with ICM. It has been noted that the failing heart creates a favorable chemokine environment for T-cell recruitment and expansion.56 Research has confirmed that T cells play a beneficial role in early cardiac remodeling post-myocardial infarction.57 The inflammatory processes induced by T cell immune responses can impair cardiac function by enhancing the inflammatory capabilities of other cells.58 T cells present an attractive therapeutic target. However, identifying which T cell subgroups play key roles in ICM requires further investigation. Notably, this study identified the potential regulatory roles of CD8+ T cells and neutrophils in the pathogenesis and progression of ICM, consistent with the findings of Yinhua Luo and Qiao Jin et al.59,60 This groundbreaking discovery sheds light on the previously unexplored dimensions of cellular dynamics within ICM, heralding a novel perspective in the understanding of its complex pathophysiology.
In the biomarker-drug interaction network constructed in our study, there were associations between DPEP2, LTBP1, SOCS2, and various agents including Diosmin and Histamine. Among them, Diosmin, a flavonoid found in citrus fruits,61 exerts its anti-inflammatory properties primarily through Nuclear Factor kappa B (NF-κB) mediation. Additionally, we identified DPEP2 as a crucial regulator of NF-κB.62,63 Diosmin demonstrated its safety and efficacy in mitigating radiation-induced cardiac toxicity in patients undergoing nuclear medicine procedures.64 Furthermore, Diosmin improved cardiac function and inhibited oxidative stress in rats subjected to myocardial ischemia-reperfusion, thereby protecting the heart.65 Notably, diosmin exhibited a preventive effect on isoproterenol-induced myocardial infarction in rats by attenuating mitochondrial oxidative stress.66 Therefore, a comprehensive investigation into the therapeutic role of diosmin in ischemic cardiomyopathy (ICM) is warranted.
We have identified several drugs with potential therapeutic effects in ischemic cardiomyopathy (ICM). Latent transforming growth factor β-binding protein 1 (LTBP1) is a secreted protein and extracellular matrix (ECM) protein that targets latent transforming growth factor beta (TGFβ) to the ECM and releases its active form upon enzymatic cleavage.67 However, there is currently insufficient research and evidence linking LTBP1 with these drugs, and their synergistic effects in ICM treatment remain unclear. It is hypothesized that these drugs may influence cell signaling pathways through LTBP1, thereby exerting therapeutic effects on ICM. Further research and clinical trials are needed to confirm the specific roles of these drugs in the treatment of ICM.
Local activation of cardiac mast cells may promote the pathophysiology of ischemic heart diseases by releasing vasoactive mediators.68 Studies suggest that blocking histamine H2 receptors improves anaerobic myocardial metabolism, thereby alleviating ischemia-reperfusion injury, while activation of H2 receptors exacerbates it.69,70 Hence, Histamine may not be a potential therapeutic agent for ICM. Hence, while histamine may not be a potential therapeutic agent for ICM, histamine receptor blockers hold promise as potential drugs for treating ICM.
Through comprehensive integration of ischemic cardiomyopathy (ICM) transcriptomic datasets from the Gene Expression Omnibus (GEO), we have delineated four pivotal mitophagy-associated biomarkers—PPDPF, DPEP2, LTBP1, and SOCS2—thereby shedding light on the underlying molecular mechanisms and uncovering prospective clinical applications for ICM. Nonetheless, several limitations warrant consideration: first, the associative nature of transcriptome-based analyses precludes definitive inference of causality between these biomarkers and ICM pathogenesis; second, heterogeneity across technical platforms may engender analytical biases; third, potential confounders, including epigenetic modifications, have not been exhaustively accounted for; and finally, the absence of experimental validation limits the translational robustness of our findings. To address these gaps, forthcoming studies will implement Mendelian randomization frameworks to infer causal relationships, integrate genome-wide epigenetic assays (eg, methylome sequencing) to unravel regulatory landscapes, and conduct functional interrogation via CRISPR-Cas9-mediated gene editing. Furthermore, we will harmonize analytical pipelines by employing uniform platforms such as single-cell RNA sequencing and leverage multi-omics and clinical cohorts to corroborate and extend the translational relevance of these biomarkers.
Conclusion
In this study, four mitophagy related biomarkers were found: PPDPF, DPEP2, LTBP1, and SOCS2. In addition, based on 4 biomarkers, further analyses of immune infiltration, regulation networks, and drug predicted were separately performed. The results of these analyses all demonstrated the potential predictive utility of the 4 biomarkers of ICM patients. However, our current analysis relies predominantly on bioinformatics approaches; extensive validation of these biomarkers’ clinical relevance in ICM remains necessary to establish their utility as prognostic indicators and therapeutic targets for patient diagnosis and treatment.
Abbreviations
ICM, ischemic cardiomyopathy; ROS, reactive oxygen species; Pgam5, phosphoglycerate mutase family member 5; Phb2, and prohibitin 2; VMC, viral myocarditis; Sema3A, semaphorin 3A; ATP, adenosine triphosphate; SICM, sepsis-induced cardiomyopathy; T3, triiodothyronine; T4, thyroxine; WGCNA, weighted gene co-expression network analysis; MRGs, mitophagy-related genes; ceRNA, competing endogenous RNA; TF, transcription factor; GEO, Gene Expression Omnibus; MRGs, mitophagy related genes; DEGs, differentially expressed genes; BH, Benjamini-Hochberg; DE-MSRGs, differentially expressed MSRGs; GO, gene ontology; KEGG, Kyoto Encyclopedia of Genes and Genomes; LASSO, least absolute shrinkage and selection Operator; SVM-RFE, support vector machine-recursive feature elimination; ROC, receiver operating characteristic; PRC, plot precision-recall; RT-qPCR, reverse transcription quantitative polymerase chain reaction; PBMC, peripheral blood mononuclear cells; qPCR, quantitative PCR; BP, biological process; CC, cellular components; MF, molecular functions; AUC, area under curve; ICM, Ischemic cardiomyopathy; Ras, renin-angiotensin system; DPEP2, dipeptidase-2; LTD4, leukotriene D4;, LTE4, leukotriene E4; LTBP1, binding protein 1; TGF-β1, transforming growth factor; SOCS, suppressor of cytokine signaling; JAK, janus kinase; STAT, signal transducer and activator of transcription; MIRI, myocardial ischemia/reperfusion injury; IGF-1, inhibiting insulin-like growth factors 1; EGR1, early growth response gene 1; ATF3, activating transcription factor 3; MIRI, myocardial ischemia/reperfusion injury; NPPB, natriuretic peptide precursor B; NPPA, natriuretic peptide precursor A; ROR2, receptor tyrosine kinase-like orphan receptor 2; RVF, right ventricular failure; NDUFS1, NAD Hoxidoreductase 75-kDa Fe-S protein 1; T cells, Tregs; G6PDH, glucose-6-phosphate dehydrogenase; GSK-3β, glycogen synthase kinase 3β; MPTP, mitochondrial permeability transition pore; β2AR, beta-2 adrenergic receptor; IRI, ischemia-reperfusion injury; WT, in wild-type; IS, infarct size; LTBP1, latent transforming growth factor β-binding protein 1; ECM, extracellular matrix; TGFβ, targets latent transforming growth factor beta.
Data Sharing Statement
The data that support the findings of this study are openly available in [the Gene Expression Omnibus (GEO) database] at [https://www.ncbi.nlm.nih.gov/geo/], reference number [GSE116250 and GSE5406].
Ethics Approval and Informed Consent
I hereby certify that the research titled “Exploring the Potential Regulatory Mechanisms of Mitophagy in Ischemic Cardiomyopathy” was carried out in strict accordance with the principles of the Declaration of Helsinki and has obtained approval from the relevant ethics committee or institutional review board (IRB). The approval number and date of approval are as follows: [Approval Number:2024-061-1] and [Date of Approval:2024-10-29].
Design, data collection and analysis, decision to publish, or preparation of the manuscript.
Author Contributions
Conceptualization, Lei Liu. and Zhao Bin Li.; methodology, Jiajie Kong.; software, Zhao Bin Li.; validation, Fan Yang.; formal analysis, Zeyue Jin.; investigation, Zhe Zhu.; resources, Zhao Bin Li. and Jiajie Kong; data curation, Zhe Zhu; writing—original draft preparation, Zhao Bin Li. and Jiajie Kong.; writing—review and editing, Zhao Bin Li. and Jiajie Kong.; supervision, Lei Liu.; project administration, Lei Liu. All authors made a significant contribution to the work reported, whether that is in the conception, study design, execution, acquisition of data, analysis and interpretation, or in all these areas; took part in drafting, revising or critically reviewing the article; gave final approval of the version to be published; have agreed on the journal to which the article has been submitted; and agree to be accountable for all aspects of the work.
Funding
This study was supported by the Medical Science Research Project of Hebei [20241217].
Disclosure
The authors report no conflicts of interest in this work.
References
1. Panza JA, Chrzanowski L, Bonow RO. Myocardial viability assessment before surgical revascularization in ischemic cardiomyopathy: JACC review topic of the week. J Am Coll Cardiol. 2021;78(10):1068–1077. doi:10.1016/j.jacc.2021.07.004
2. Liga R, Colli A, Taggart DP, Boden WE, De Caterina R. Myocardial revascularization in patients with ischemic cardiomyopathy: for whom and how. J Am Heart Assoc. 2023;12(6):e026943. doi:10.1161/jaha.122.026943
3. Wu J, Cai H, Lei Z, et al. Expression pattern and diagnostic value of ferroptosis-related genes in acute myocardial infarction. Front Cardiovasc Med. 2022;9:993592. doi:10.3389/fcvm.2022.993592
4. Zhao E, Xie H, Zhang Y. Predicting diagnostic gene biomarkers associated with immune infiltration in patients with acute myocardial infarction. Front Cardiovasc Med. 2020;7:586871. doi:10.3389/fcvm.2020.586871
5. Wu Y, Jiang T, Hua J, et al. Integrated bioinformatics-based analysis of hub genes and the mechanism of immune infiltration associated with acute myocardial infarction. Front Cardiovasc Med. 2022;9:831605. doi:10.3389/fcvm.2022.831605
6. Wang J, Zhou H. Mitochondrial quality control mechanisms as molecular targets in cardiac ischemia-reperfusion injury. Acta Pharm Sin B. 2020;10(10):1866–1879. doi:10.1016/j.apsb.2020.03.004
7. Kuroshima T, Kawaguchi S, Okada M. Current perspectives of mitochondria in sepsis-induced cardiomyopathy. Int J Mol Sci. 2024;25(9):4710. doi:10.3390/ijms25094710
8. Pietrobon D, Azzone GF, Walz D. Effect of funiculosin and antimycin A on the redox-driven H+-pumps in mitochondria: on the nature of “leaks’. Eur J Biochem. 1981;117(2):389–394. doi:10.1111/j.1432-1033.1981.tb06350.x
9. Johnson JL, Felicetta JV. Hyperthyroidism: a comprehensive review. J Am Acad Nurse Pract. 1992;4(1):8–14. doi:10.1111/j.1745-7599.1992.tb01105.x
10. Ale L, Gentleman R, Sonmez TF, Sarkar D, Endres C. nhanesA: achieving transparency and reproducibility in NHANES research. Database. 2024;2024. doi:10.1093/database/baae028
11. Paradies G, Paradies V, Ruggiero FM, Petrosillo G. Mitochondrial bioenergetics and cardiolipin alterations in myocardial ischemia-reperfusion injury: implications for pharmacological cardioprotection. Am J Physiol Heart Circ Physiol. 2018;315(5):H1341–h1352. doi:10.1152/ajpheart.00028.2018
12. Dai D, Liu L, Guo Y, Shui Y, Wei Q. A comprehensive analysis of the effects of key mitophagy genes on the progression and prognosis of lung adenocarcinoma. Cancers. 2022;15(1):57. doi:10.3390/cancers15010057
13. Zhu H, Tan Y, Du W, et al. Phosphoglycerate mutase 5 exacerbates cardiac ischemia-reperfusion injury through disrupting mitochondrial quality control. Redox Biol. 2021;38:101777. doi:10.1016/j.redox.2020.101777
14. Yu W, Sun S, Xu H, Li C, Ren J, Zhang Y. TBC1D15/RAB7-regulated mitochondria-lysosome interaction confers cardioprotection against acute myocardial infarction-induced cardiac injury. Theranostics. 2020;10(24):11244–11263. doi:10.7150/thno.46883
15. Sweet ME, Cocciolo A, Slavov D, et al. Transcriptome analysis of human heart failure reveals dysregulated cell adhesion in dilated cardiomyopathy and activated immune pathways in ischemic heart failure. BMC Genomics. 2018;19(1):812. doi:10.1186/s12864-018-5213-9
16. Hannenhalli S, Putt ME, Gilmore JM, et al. Transcriptional genomics associates FOX transcription factors with human heart failure. Circulation. 2006;114(12):1269–1276. doi:10.1161/circulationaha.106.632430
17. Yang Z, Sun L, Wang H. Identification of mitophagy-related genes with potential clinical utility in myocardial infarction at transcriptional level. Front Cardiovasc Med. 2023;10:1166324. doi:10.3389/fcvm.2023.1166324
18. Hänzelmann S, Castelo R, Guinney J. GSVA: gene set variation analysis for microarray and RNA-seq data. BMC Bioinf. 2013;14:7. doi:10.1186/1471-2105-14-7
19. Langfelder P, Horvath S. WGCNA: an R package for weighted correlation network analysis. BMC Bioinf. 2008;9:559. doi:10.1186/1471-2105-9-559
20. Ritchie ME, Phipson B, Wu D, et al. limma powers differential expression analyses for RNA-sequencing and microarray studies. Nucleic Acids Res. 2015;43(7):e47. doi:10.1093/nar/gkv007
21. Wu T, Hu E, Xu S, et al. clusterProfiler 4.0: a universal enrichment tool for interpreting omics data. Innovation. 2021;2(3):100141. doi:10.1016/j.xinn.2021.100141
22. Liu T, Yu S, Hu T, et al. Comprehensive analyses of genome-wide methylation and RNA epigenetics identify prognostic biomarkers, regulating the tumor immune microenvironment in lung adenocarcinoma. Pathol Res Pract. 2023;248:154621. doi:10.1016/j.prp.2023.154621
23. Friedman J, Hastie T, Tibshirani R. Regularization paths for generalized linear models via coordinate descent. J Stat Softw. 2010;33(1):1–22. doi:10.18637/jss.v033.i01
24. Robin X, Turck N, Hainard A, et al. pROC: an open-source package for R and S+ to analyze and compare ROC curves. BMC Bioinf. 2011;12:77. doi:10.1186/1471-2105-12-77
25. Grau J, Grosse I, Keilwagen J. PRROC: computing and visualizing precision-recall and receiver operating characteristic curves in R. Bioinformatics. 2015;31(15):2595–2597. doi:10.1093/bioinformatics/btv153
26. Sturm G, Finotello F, List M. Immunedeconv: an R package for unified access to computational methods for estimating immune cell fractions from bulk RNA-sequencing data. Methods Mol Biol. 2020;2120:223–232. doi:10.1007/978-1-0716-0327-7_16
27. Shannon P, Markiel A, Ozier O, et al. Cytoscape: a software environment for integrated models of biomolecular interaction networks. Genome Res. 2003;13(11):2498–2504. doi:10.1101/gr.1239303
28. Zhuo Z, Lin H, Liang J, et al. Mitophagy-related gene signature for prediction prognosis, immune scenery, mutation, and chemotherapy response in pancreatic cancer. Front Cell Dev Biol. 2021;9:802528. doi:10.3389/fcell.2021.802528
29. Yang YY, Gao ZX, Mao ZH, Liu DW, Liu ZS, Wu P. Identification of ULK1 as a novel mitophagy-related gene in diabetic nephropathy. Front Endocrinol. 2022;13:1079465. doi:10.3389/fendo.2022.1079465
30. Jiang Z, Song J, Qi F, et al. Exdpf is a key regulator of exocrine pancreas development controlled by retinoic acid and ptf1a in zebrafish. PLoS Biol. 2008;6(11):e293. doi:10.1371/journal.pbio.0060293
31. Ni QZ, Zhu B, Ji Y, et al. PPDPF promotes the development of mutant KRAS-driven pancreatic ductal adenocarcinoma by regulating the GEF activity of SOS1. Adv Sci. 2023;10(2):e2202448. doi:10.1002/advs.202202448
32. Roberts AE, Araki T, Swanson KD, et al. Germline gain-of-function mutations in SOS1 cause Noonan syndrome. Nat Genet. 2007;39(1):70–74. doi:10.1038/ng1926
33. Chen PC, Wakimoto H, Conner D, et al. Activation of multiple signaling pathways causes developmental defects in mice with a Noonan syndrome–associated Sos1 mutation. J Clin Invest. 2010;120(12):4353–4365. doi:10.1172/jci43910
34. Cowan JR, Salyer L, Wright NT, et al. SOS1 gain-of-function variants in dilated cardiomyopathy. Circ Genom Precis Med. 2020;13(4):e002892. doi:10.1161/circgen.119.002892
35. Gregg D, Rauscher FM, Goldschmidt-Clermont PJ. Rac regulates cardiovascular superoxide through diverse molecular interactions: more than a binary GTP switch. Am J Physiol Cell Physiol. 2003;285(4):C723–34. doi:10.1152/ajpcell.00230.2003
36. Steinke JW, Negri J, Payne SC, Borish L. Biological effects of leukotriene E4 on eosinophils. Prostaglandins Leukot Essent Fatty Acids. 2014;91(3):105–110. doi:10.1016/j.plefa.2014.02.006
37. Bankova LG, Lai J, Yoshimoto E, et al. Leukotriene E4 elicits respiratory epithelial cell mucin release through the G-protein-coupled receptor, GPR99. Proc Natl Acad Sci U S A. 2016;113(22):6242–6247. doi:10.1073/pnas.1605957113
38. Oliveira LJ, McClellan S, Hansen PJ. Differentiation of the endometrial macrophage during pregnancy in the cow. PLoS One. 2010;5(10):e13213. doi:10.1371/journal.pone.0013213
39. van Amerongen MJ, Harmsen MC, van Rooijen N, Petersen AH, van Luyn MJ. Macrophage depletion impairs wound healing and increases left ventricular remodeling after myocardial injury in mice. Am J Pathol. 2007;170(3):818–829. doi:10.2353/ajpath.2007.060547
40. DeBerge M, Yeap XY, Dehn S, et al. MerTK cleavage on resident cardiac macrophages compromises repair after myocardial ischemia reperfusion injury. Circ Res. 2017;121(8):930–940. doi:10.1161/circresaha.117.311327
41. Sinha S, Heagerty AM, Shuttleworth CA, Kielty CM. Expression of latent TGF-beta binding proteins and association with TGF-beta 1 and fibrillin-1 following arterial injury. Cardiovasc Res. 2002;53(4):971–983. doi:10.1016/s0008-6363(01)00512-0
42. Nikol S, Isner JM, Pickering JG, Kearney M, Leclerc G, Weir L. Expression of transforming growth factor-beta 1 is increased in human vascular restenosis lesions. J Clin Invest. 1992;90(4):1582–1592. doi:10.1172/jci116027
43. Wolf YG, Rasmussen LM, Ruoslahti E. Antibodies against transforming growth factor-beta 1 suppress intimal hyperplasia in a rat model. J Clin Invest. 1994;93(3):1172–1178. doi:10.1172/jci117070
44. Raghunath M, Unsöld C, Kubitscheck U, Bruckner-Tuderman L, Peters R, Meuli M. The cutaneous microfibrillar apparatus contains latent transforming growth factor-beta binding protein-1 (LTBP-1) and is a repository for latent TGF-beta1. J Invest Dermatol. 1998;111(4):559–564. doi:10.1046/j.1523-1747.1998.00339.x
45. Dallas SL, Keene DR, Bruder SP, et al. Role of the latent transforming growth factor beta binding protein 1 in fibrillin-containing microfibrils in bone cells in vitro and in vivo. J Bone Miner Res. 2000;15(1):68–81. doi:10.1359/jbmr.2000.15.1.68
46. Kojima S, Nara K, Rifkin DB. Requirement for transglutaminase in the activation of latent transforming growth factor-beta in bovine endothelial cells. J Cell Biol. 1993;121(2):439–448. doi:10.1083/jcb.121.2.439
47. Flaumenhaft R, Abe M, Sato Y, et al. Role of the latent TGF-beta binding protein in the activation of latent TGF-beta by co-cultures of endothelial and smooth muscle cells. J Cell Biol. 1993;120(4):995–1002. doi:10.1083/jcb.120.4.995
48. Dey BR, Spence SL, Nissley P, Furlanetto RW. Interaction of human suppressor of cytokine signaling (SOCS)-2 with the insulin-like growth factor-I receptor. J Biol Chem. 1998;273(37):24095–24101. doi:10.1074/jbc.273.37.24095
49. Starr R, Willson TA, Viney EM, et al. A family of cytokine-inducible inhibitors of signalling. Nature. 1997;387(6636):917–921. doi:10.1038/43206
50. Liu J, Chen L, Zheng X, Guo C. Identification of immune-related genes in acute myocardial infarction based on integrated bioinformatical methods and experimental verification. PeerJ. 2023;11:e15058. doi:10.7717/peerj.15058
51. Esper L, Roman-Campos D, Lara A, et al. Role of SOCS2 in modulating heart damage and function in a murine model of acute Chagas disease. Am J Pathol. 2012;181(1):130–140. doi:10.1016/j.ajpath.2012.03.042
52. O’Shea JJ, Gadina M, Schreiber RD. Cytokine signaling in 2002: new surprises in the Jak/Stat pathway. Cell. 2002;109:S121–31. doi:10.1016/s0092-8674(02)00701-8
53. Yang S, Hu S, Hsieh YC, et al. Mechanism of IL-6-mediated cardiac dysfunction following trauma-hemorrhage. J Mol Cell Cardiol. 2006;40(4):570–579. doi:10.1016/j.yjmcc.2006.01.008
54. Li Z, Zhang Y, Ding N, et al. Inhibition of lncRNA XIST improves myocardial I/R injury by targeting miR-133a through inhibition of autophagy and regulation of SOCS2. Mol Ther Nucleic Acids. 2019;18:764–773. doi:10.1016/j.omtn.2019.10.004
55. Sheng M, Huang Z, Pan L, et al. SOCS2 exacerbates myocardial injury induced by ischemia/reperfusion in diabetic mice and H9c2 cells through inhibiting the JAK-STAT-IGF-1 pathway. Life Sci. 2017;188:101–109. doi:10.1016/j.lfs.2017.08.036
56. Bansal SS, Ismahil MA, Goel M, et al. Dysfunctional and proinflammatory regulatory T-lymphocytes are essential for adverse cardiac remodeling in ischemic cardiomyopathy. Circulation. 2019;139(2):206–221. doi:10.1161/circulationaha.118.036065
57. Saxena A, Dobaczewski M, Rai V, et al. Regulatory T cells are recruited in the infarcted mouse myocardium and may modulate fibroblast phenotype and function. Am J Physiol Heart Circ Physiol. 2014;307(8):H1233–42. doi:10.1152/ajpheart.00328.2014
58. Blanton RM, Carrillo-Salinas FJ, Alcaide P. T-cell recruitment to the heart: friendly guests or unwelcome visitors? Am J Physiol Heart Circ Physiol. 2019;317(1):H124–h140. doi:10.1152/ajpheart.00028.2019
59. Jin Q, Gong Q, Le X, He J, Zhuang L. Bioinformatics and experimental analyses reveal immune-related LncRNA-mRNA pair AC011483.1-CCR7 as a biomarker and therapeutic target for ischemic cardiomyopathy. Int J Mol Sci. 2022;23(19):11994. doi:10.3390/ijms231911994
60. Luo Y, He X, Hu L, et al. The relationship between plasma selenium, antioxidant status, inflammatory responses and ischemic cardiomyopathy: a case-control study based on matched propensity scores. J Inflamm Res. 2022;15:5757–5765. doi:10.2147/JIR.S383476
61. Silambarasan T, Raja B. Diosmin, a bioflavonoid reverses alterations in blood pressure, nitric oxide, lipid peroxides and antioxidant status in DOCA-salt induced hypertensive rats. Eur J Pharmacol. 2012;679(1–3):81–89. doi:10.1016/j.ejphar.2011.12.040
62. Palomer X, Román-Azcona MS, Pizarro-Delgado J, et al. SIRT3-mediated inhibition of FOS through histone H3 deacetylation prevents cardiac fibrosis and inflammation. Signal Transduct Target Ther. 2020;5(1):14. doi:10.1038/s41392-020-0114-1
63. Yang X, Yue Y, Xiong S. Dpep2 emerging as a modulator of macrophage inflammation confers protection against CVB3-induced viral myocarditis. Front Cell Infect Microbiol. 2019;9:57. doi:10.3389/fcimb.2019.00057
64. Koosha F, Sheikhzadeh P. Investigating radioprotective effect of hesperidin/diosmin compound against (99m)Tc-MIBI-induced cardiotoxicity: animal study. Cardiovasc Toxicol. 2022;22(7):646–654. doi:10.1007/s12012-022-09744-8
65. Senthamizhselvan O, Manivannan J, Silambarasan T, Raja B. Diosmin pretreatment improves cardiac function and suppresses oxidative stress in rat heart after ischemia/reperfusion. Eur J Pharmacol. 2014;736:131–137. doi:10.1016/j.ejphar.2014.04.026
66. Sharmila Queenthy S, Stanely Mainzen Prince P, John B. Diosmin prevents isoproterenol-induced heart mitochondrial oxidative stress in rats. Cardiovasc Toxicol. 2018;18(2):120–130. doi:10.1007/s12012-017-9422-2
67. Wenk D, Khan S, Ignatchenko V, May T, Bernardini MQ, Kislinger T. Targeted mass spectrometry of longitudinal patient sera reveals LTBP1 as a potential surveillance biomarker for high-grade serous ovarian carcinoma. J Proteome Res. 2024;23(2):749–759. doi:10.1021/acs.jproteome.3c00629
68. Patella V, Marinò I, Arbustini E, et al. Stem cell factor in mast cells and increased mast cell density in idiopathic and ischemic cardiomyopathy. Circulation. 1998;97(10):971–978. doi:10.1161/01.cir.97.10.971
69. Asanuma H, Minamino T, Ogai A, et al. Blockade of histamine H2 receptors protects the heart against ischemia and reperfusion injury in dogs. J Mol Cell Cardiol. 2006;40(5):666–674. doi:10.1016/j.yjmcc.2006.02.001
70. Luo T, Chen B, Zhao Z, et al. Histamine H2 receptor activation exacerbates myocardial ischemia/reperfusion injury by disturbing mitochondrial and endothelial function. Basic Res Cardiol. 2013;108(3):342. doi:10.1007/s00395-013-0342-4
 © 2025 The Author(s). This work is published and licensed by Dove Medical Press Limited. The
full terms of this license are available at https://www.dovepress.com/terms
and incorporate the Creative Commons Attribution
- Non Commercial (unported, 4.0) License.
By accessing the work you hereby accept the Terms. Non-commercial uses of the work are permitted
without any further permission from Dove Medical Press Limited, provided the work is properly
attributed. For permission for commercial use of this work, please see paragraphs 4.2 and 5 of our Terms.
© 2025 The Author(s). This work is published and licensed by Dove Medical Press Limited. The
full terms of this license are available at https://www.dovepress.com/terms
and incorporate the Creative Commons Attribution
- Non Commercial (unported, 4.0) License.
By accessing the work you hereby accept the Terms. Non-commercial uses of the work are permitted
without any further permission from Dove Medical Press Limited, provided the work is properly
attributed. For permission for commercial use of this work, please see paragraphs 4.2 and 5 of our Terms.
Recommended articles

Association of 24 Conventional and Unconventional Anthropometric Indicators with Pre-Hypertension or Hypertension: A Population-Based Cross-Sectional Study in Chinese Population
Han Y, Chang H, Huang J, Pan M, Gong J, Huang B, Xie L, Peng XE, Hong H
Vascular Health and Risk Management 2025, 21:859-877
Published Date: 21 October 2025