Back to Journals » Risk Management and Healthcare Policy » Volume 14
Exploring the Pattern of Early COVID-19 Transmission Caused by Population Migration Based on 14 Cities in Hubei Province, China
Authors Luo L, Wen W, Wang CY, Zhou M, Ni J, Jiang J, Chen J, Wang MW ![]() , Feng Z
, Feng Z ![]() , Cheng YR
, Cheng YR
Received 6 August 2021
Accepted for publication 18 September 2021
Published 25 October 2021 Volume 2021:14 Pages 4393—4399
DOI https://doi.org/10.2147/RMHP.S333018
Checked for plagiarism Yes
Review by Single anonymous peer review
Peer reviewer comments 2
Editor who approved publication: Dr Jongwha Chang
Lin Luo,1– 3 Wen Wen,4 Chun-yi Wang,4 Mengyun Zhou,5 Jie Ni,6 Jingjie Jiang,4 Juan Chen,4 Ming-wei Wang,4 Zhanhui Feng,6 Yong-Ran Cheng7
1Hangzhou Ruolin Hospital Management Co. Ltd, Hangzhou, 310007, People’s Republic of China; 2Hangzhou Kaihong Technology Co., Ltd, Hangzhou, 310059, People’s Republic of China; 3Jiangxi Key Laboratory of Natural Products and Functional Food, College of Food Science and Engineering, Jiangxi Agricultural University, Nanchang, 330045, People’s Republic of China; 4Hangzhou Institute of Cardiovascular Diseases, Hangzhou Medical Key Discipline, Affiliated Hospital of Hangzhou Normal University, Hangzhou, 310015, People’s Republic of China; 5Department of Molecular & Cellular Physiology, Shinshu University School of Medicine, Nagano, 3900803, Japan; 6Internal Medicine-Neurology, Affiliated Hospital of Guizhou Medical University, Guiyang, People’s Republic of China; 7School of Public Health, Hangzhou Medical College, Hangzhou, 311300, People’s Republic of China
Correspondence: Yong-Ran Cheng; Zhanhui Feng Email [email protected]; [email protected]
Background and Aim: Relevant studies show that population migration has a great impact on the early spread of infectious diseases. Therefore, it is important to explore whether there is an explicit relationship between population migration and the number of confirmed cases for the control of the COVID-19 epidemic. This paper mainly explores the impact of population migration on early COVID-19 transmission, and establishes a predictive nonlinear mathematical model to predict the number of early cases.
Methods: Data of confirmed cases were sourced from the official website of the Municipal Health Committee, and the proportions of migration from Wuhan to other cities were sourced from the Baidu data platform. The data of confirmed cases and the migration proportions of 14 cities in Hubei Province were collected, the COVID-19 cases study period was determined as 10 days based on the third quartile of the interval of the incubation period, and a non-linear mathematical model was constructed to clarify the relationship between the migration proportion and the number of confirmed COVID-19 cases. Finally, eight typical regions were selected to verify the accuracy of the model.
Results: The daily population migration rates and the growth curves of the number of confirmed cases in the 14 cities were basically consistent, and Pearson’s correlation coefficient was 0.91. The specific mathematical expression of 14 regions is . In each of the fourteen cities, The nonlinear exponential model structure is as follows:. It was found that the R2 values of the fitted mathematical model were greater than 0.8 in all studied regions, excluding Suizhou (p < 0.05). The established mathematical model was used to fit eight regions in China, and the correlations between the predicted and actual numbers of confirmed cases were greater than 0.9, excluding that of Hebei Province (0.82).
Conclusion: The study found that population migration has a positive and significant impact on the spread of COVID-19. Modeling COVID-19 risk may be a useful strategy for directing public health surveillance and interventions. Restricting the migration of the population is of great significance to the joint prevention and control of the pandemic worldwide.
Keywords: COVID-19, SARS-CoV-2, spreads, travel, non-linear exponential
Introduction
At the end of 2019, a mysterious pneumonia outbreak occurred in Wuhan, Hubei Province, China, which began to attract the attention of countries around the world and has since been designated by the WHO as COVID-19.1,2 The disease is now present in more than 200 countries, with more than 133 million confirmed cases and 2.8 million confirmed deaths worldwide. It has aroused the world’s acute attention and vigilance, and determining how to take effective measures to control the spread of the virus has become a challenge.3
The epicenter of the outbreak was Wuhan, the capital of Hubei Province and the capital of China’s developed cities, in China. The outbreak coincided with China’s traditional Lunar New Year holiday, which is a time of frequent population movement that saw 2.97 billion trips in 2019.4 As Wuhan is a major transportation hub in China, about five million people were expected to have left the city during the Spring Festival travel rush before January 24, 2020.5 Currently, travel and population migration are driving the spread of COVID-19 in China and elsewhere, and the human-to-human transmission of the virus has been confirmed.6 Population migration has given wings to COVID-19, and some research suggests that the increase in COVID-19 at early stage is related to the increasing train and air travel in Wuhan, China.7
If the spread of the virus is to be controlled, it must be controlled from the source. As the duration of the epidemic overlapped with the Spring Festival transport wave, mass migration is likely to be a strong determinant of the characteristics of the epidemic. Therefore, effective migration control is an important method by which to limit the transmission of infection from person to person. However, migration as an important risk factor has not been fully studied. At present, only a few studies have confirmed a strong correlation between the number of confirmed cases and the number of migrants,5,8–10 but there lacks further study on the early transmission pattern based on the factors of population migration. Hence, a specific mathematical model is urgently needed to verify the relationship between the number of confirmed cases and the number of migrants which may be used to predict the transmission pattern of infectious disease at early stage.
In this study, which is based on 14 cities in Hubei Province, the correlation between the number of migrants and the number of confirmed cases is explored. A mathematical model is constructed to clarify the impact of population migration on the early transmission pattern of COVID-19, and the reliability of the model is verified in eight regions. Via the establishment of this model, the population migration ratio before the outbreak can be clearly used to predict the early trend of the outbreak, and relevant measures can be taken as early as possible to control the source of early virus transmission and prevent the spread of the virus.
Methods
Collection of Case Data
Because the number of early cases of the outbreak occurred in fourteen cities (Huanggang, Jingmen, Jingzhou, Shiyan, Yichang, Xiantao, Xiaogao, Tianmen, Ezhou, Enshi, Suizhou, Xianning, Xiangyang, and Huangshi) in Hubei Province were included for the investigation of the population migration from Wuhan (Supplementary Figure 1), and these 14 cities were used to construct the model. Moreover, eight typical regions in China, namely Anhui, Beijing, Guangdong, Jiangsu, Shanghai, Hebei, Zhejiang, and Sichuan, were used to construct validation model datasets. Data on confirmed COVID-19 cases were obtained from the official website of the Municipal Health Committee in these cities. The proportions of migration from Wuhan to other cities were sourced from Baidu Map Smarteye, which releases a map of population migration around the Spring Festival every year (http://qianxi.baidu.com/).
Inclusion Period Selection
According to the incubation period of COVID-19 is 2–14 days.11 Considering that some people experienced shorter incubation periods, the study period was determined as 10 days based on the third quartile of the interval of the incubation period. The confirmed cases were collected from the 10 days after the first patient was confirmed. The proportions of population migration were collected from the 10 days before the day when the first patient was confirmed (Supplementary Figure 2).
Nonlinear Model Fitting
The epidemic infection curve follows a non-linear growth trend in crowds.12–15 A non-linear mathematical model was therefore constructed to explore the relationship between the proportion of immigrants and the number of confirmed cases. Consider the nonlinear model  , where
  is nonlinear in
 , y represents the number of confirmed cases per day, and x represents the proportion of population migration per day. If
  is to be estimated given an observation
  , then the point estimate
  is given by solving
  . The solution will be unique as long as
 is monotonic in the region of interest.16 The stats program computing package in R software was used to compute
  by calling the functions “predict” and “uniroot” to numerically solve
  for
for  . The basic trendline calculation function was used to fit the non-linear relationship with a confidence interval (CI).17
Statistical Analysis
Pearson’s correlation coefficient was used to measure the correlation between the proportion of migrants and the number of confirmed cases. The criteria for selecting the optimal model are based on the p-value,  value, and CI; a good model fit is characterized by p < 0.05 (indicating the p-value of each regression model),
  > 0.75 (indicating the R-squared value of the model), and most samples falling within the 95% CI to ensure that all estimated model parameter values are significant. The p value is < 0.05 and
  is>0.75, indicating that the model has good fitting. The best-fitting model parameters were chosen, and the model was implemented for the eight regions in China to verify its accuracy, which was measured by calculating the correlation coefficient between the predicted and actual numbers of confirmed cases. It was investigated whether the trends of the variation between the estimated and actual numbers of confirmed cases were consistent within 10 days. All the analyses conducted in this study were carried out by R statistical software (version 3.6.1).
Results
The outbreak of COVID-19 in China began in Wuhan, and nearly all early cases in China were derived from this city. As of February 3, 2020, a total of 21,957 confirmed cases of COVID-19 due to 2019-nCoV infection had been reported in 14 regions of Hubei Province (Wuhan is not included). From January 20 to February 3, the number of confirmed cases increased rapidly in 14 regions of Hubei Province (Supplementary Figure 3). Within a 10-day period, the population of Wuhan that traveled to the 14 cities in Hubei Province accounted for 68% of the total travel population of Wuhan, and the number of confirmed cases in these 14 cities accounted for 54.4% of the total cases in China (Figure 1A). The proportion of people traveled from Wuhan, as compared with that from other cities, ranked first in ten cities. Only a small proportion of people traveled to Enshi from Wuhan (Figure 1B). It was found that the greater the proportion of people traveled to a city from Wuhan, the more cases were confirmed in that city (Figure 2).
 |
Figure 1 Numbers of confirmed cases and proportions of migration from Wuhan. (A) The proportions of the total numbers of confirmed cases in fourteen cities in China and the population migration from Wuhan. (B) In the 10 days before the first confirmed case was reported in each of the fourteen cities, the proportion of people who migrated from Wuhan every day was ranked as compared to that of other regions, whether 1 means highest. |
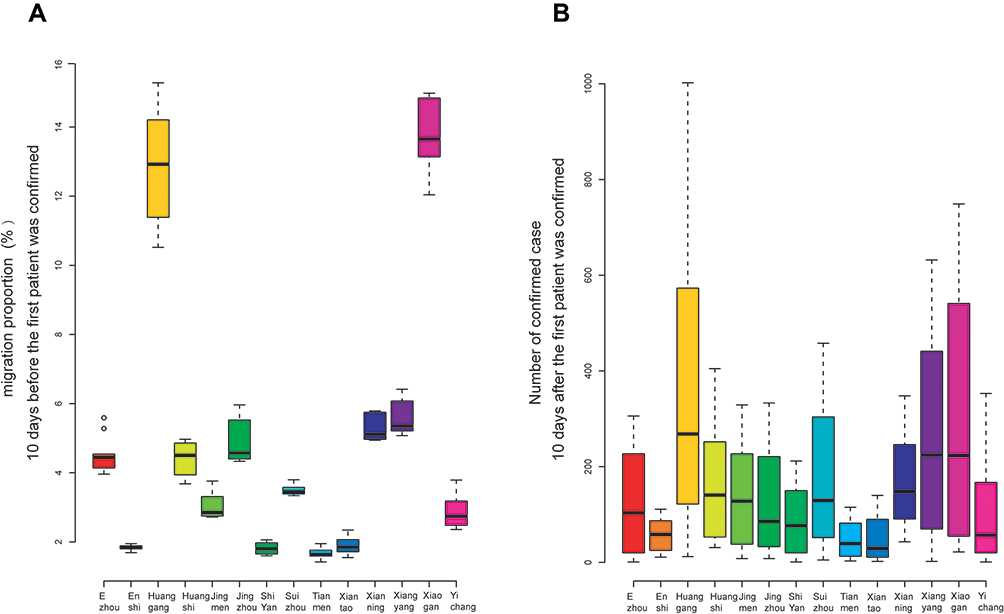 |
Figure 2 Distributions of immigration proportions and numbers of confirmed cases. (A) Distribution of the proportion of population migration in each region from the 10 days before the day of the first confirmed case. (B) Distribution of confirmed cases in each region from the 10 days after the day of the first confirmed case. |
In the 10-day cycle, the proportions of the total migration and the total numbers of confirmed cases in the investigated 14 cities showed increasing trends, and Pearson’s correlation coefficient was found to be 0.91 (Figure 3). The Pearson’s correlation coefficient between the proportion of migrant population and the number of confirmed cases for fourteen typical cities ranged from 0.79 to 0.95, and ten of them is greater than 0.9. The daily population migration rates and the growth curves of the number of confirmed cases were basically consistent among the 14 cities (Supplementary Figure 4).
 |
Figure 3 Pearson’s correlation coefficient between the proportion of population migration from Wuhan and the total number of confirmed cases in fourteen cities. |
The relationship between the proportion of the total number of immigrants from Wuhan to 14 cities and the total number of confirmed cases in these cities was then analyzed. It was found that the functional relationship between them is , for which R2=0.98, P < 0.0001 (Figure 4). In each of the fourteen cities, it was found that the R2 values of the optimal fitted mathematical model were greater than 0.8 in all the considered regions, excluding Suizhou (R2 = 0.78). Of these, 9 regions had an R2 value greater than 0.9. All p-values were found to be less than 0.05. The 95% confidence interval contains most sample values. It is evident that the optimal model of the relationship between the proportion of immigrants and the number of confirmed cases is consistent with the general formula of nonlinear exponential mathematics:
 , where y represents the number of confirmed cases per day, x represents the proportion of population migration per day, and a, b, and c are constants (Supplementary Figure 5).
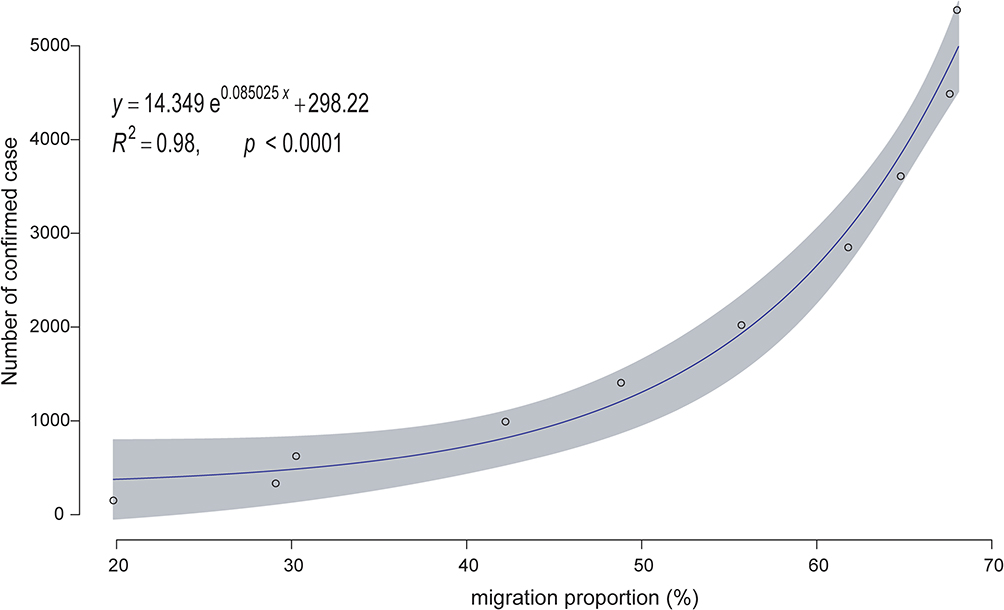 |
Figure 4 The mathematical relationship between the proportion of population migration from Wuhan and the total number of confirmed cases in fourteen cities. |
Furthermore, the accuracy of the established mathematical model was validated using data from eight regions in China. It was found that the correlations between the predicted and actual numbers of confirmed cases were very strong. Only Hebei Province had a correlation coefficient of 0.82, while the correlation coefficients for the other seven regions were all greater than 0.9 (Table 1).
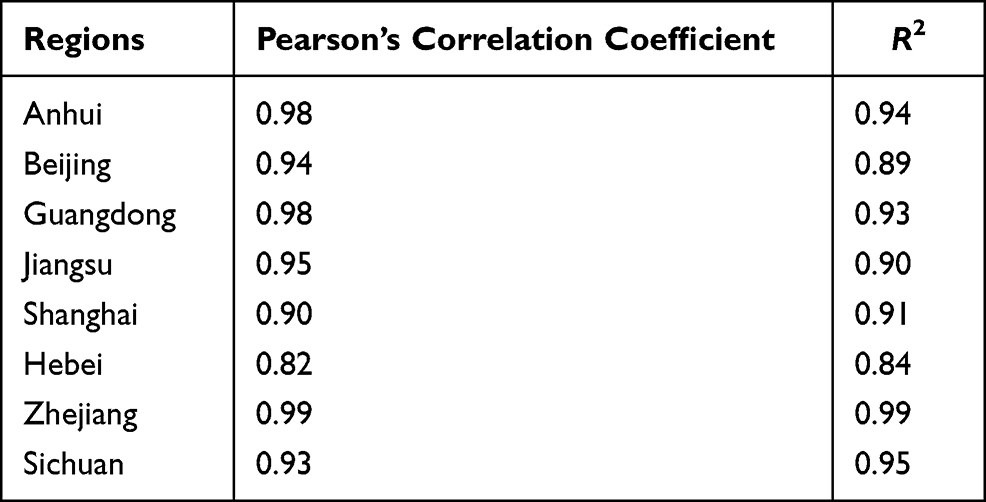 |
Table 1 R-Square for Each Model and the Correlation Coefficients for the Predicted Eight Regions |
Discussion
In the present study, it was found that, among the fourteen cities, the greater the proportion of people that traveled from Wuhan to a city, the more cases were confirmed in that city. The daily population migration rate and the growth curve of the number of confirmed cases were found to be basically consistent. By fitting the proportions of population migration in the 14 regions and the numbers of early confirmed cases, the general formula of a unified mathematical model was determined. These results may have important implications for guiding key public health strategies, such as surveillance and control.
The novel coronavirus infection mainly involves the respiratory system and spreads through the respiratory tract. Although the novel coronavirus has been detected in the feces of virus-infected patients,18 whether the virus can be transmitted through the digestive tract remains controversial. As a disease primarily transmitted by the respiratory tract, population mobility is an important factor that affects the spread of the disease, usually during the early stage of transmission.19
Five million people have immigrated from Wuhan to all parts of the country. It is unknown how many of them are virus carriers, nor can all these people be traced and diagnosed. The evidence of previous cases shows that asymptomatic patients in the incubation period are also infectious, and tracking virus carriers is thus a more difficult challenge. Therefore, isolation at home and less contact with others are the most effective measures for the prevention of infection and transmission. In response to the spread of COVID-19, the Hubei provincial government implemented city closure management in Wuhan on January 26. At present, the Chinese government has postponed the start of school for all schools, and has implemented restrictions on population mobility in the affected areas. By canceling large-scale gatherings and arranging for residents to work at home, the population’s contact rate has been greatly reduced, which has substantially decreased the speed of COVID-19 transmission.
The present study investigated the impact of the proportion of population migration on the spread of COVID-19. The resulting model can provide a scientific basis for dealing with similar infectious diseases in the future, and can be used to quickly predict the number of patients and provide epidemiological evidence for the early detection of human-to-human transmission. This is also the first time that this method has been used to construct a model to explore the specific impact of population migration on the spread of diseases; this novel modeling method thus provides a new research tool for the investigation of the spread of infectious diseases. The nonlinear exponential model can quickly reveal the development trend of infectious diseases in a certain region. Because the accumulation of clinical data is not required, once it is known that there are transmission cases in a certain area and the source of transmission is established, the development trend of a disease can be calculated according to the proportion of population migration and the number of early cases. Most previous studies estimated the basic regeneration index R0 via long-term case numbers and clinical information. However, for different periods and models, the estimated R0 values were also different.20–24
The present study utilized data on the population migration of a single large country at the provincial level to construct a simple model that can be easily applied to other regions or infectious diseases. Moreover, based on the population data from Baidu, the time and place of population migration can be understood in detail so as to accurately calculate the correlation between population migration and the spread of infectious diseases. Nevertheless, there remain some limitations of the data used in this analysis. In this study, only out-migration from the Wuhan region was considered to affect the spread of the virus. However, there may be some regions in which the source of the virus was not only from Wuhan; for example, some carriers were not infected in Wuhan, such as those who transferred to Enshi in Yichang. Transmission is certainly not only influenced by migration, but also by other factors, early measures, government intervention, etc. Because only the single factor of population migration was considered in this paper, there will be corresponding errors. Additionally, only 14 regions in Hubei Province were used to explore the relationship between migration and confirmed cases to achieve the consistency of the results (Hubei Province has been the most influenced by COVID-19). Therefore, the findings in our present study need to be verified in other regions in future studies.
Conclusion
Population migration determines the speed and scope of early virus transmission. The establishment of a mathematical model of the impact of population migration on the risk of COVID-19 transmission can make use of the population migration rate before the outbreak to predict the early trend of the epidemic. Moreover, relevant measures can be taken as promptly as possible to control the source of early virus transmission and prevent the spread of the virus. This model can provide important decision-making information for the early prevention and control of similar emergencies in the future.
Ethics Approval and Consent to Participate
All data were supplied and analyzed in an anonymous format, without access to personal identifying information.
Consent for Publication
Not applicable. All data were supplied and analysed in an anonymous format, without access to personal identifying information.
Author Contributions
All authors made substantial contributions to conception and design, acquisition of data, or analysis and interpretation of data; took part in drafting the article or critically revising it for important intellectual content; agreed to submit to the current journal; gave final approval for the version to be published; and agreed to be accountable for all aspects of the work.
Funding
The presented study was supported by Medical and Technology Project of Zhejiang Province (No.2021HY127).
Disclosure
The authors report no conflicts of interest for this work and declare that there are no conflicts of interest regarding the publication of this paper.
References
1. Hui DS, Azhar EI, Madani TA, et al. The continuing 2019-nCoV epidemic threat of novel coronaviruses to global health - The latest 2019 novel coronavirus outbreak in Wuhan, China. Int J Infect Dis. 2020;91:264–266. doi:10.1016/j.ijid.2020.01.009
2. Biscayart C, Angeleri P, Lloveras S, Chaves TDSS, Schlagenhauf P, Rodríguez-Morales AJ. The next big threat to global health? 2019 novel coronavirus (2019-nCoV): what advice can we give to travellers? - Interim recommendations January 2020, from the Latin-American society for Travel Medicine (SLAMVI). Travel Med Infect Dis. 2020;33:101567. doi:10.1016/j.tmaid.2020.101567
3. Wiersinga WJ, Rhodes A, Cheng AC, Peacock SJ, Prescott HC. Pathophysiology, transmission, diagnosis, and treatment of coronavirus disease 2019 (COVID-19): a review. JAMA. 2020;324(8):782–793. doi:10.1001/jama.2020.12839
4. Fan C, Cai T, Gai Z, Wu Y. The relationship between the migrant population’s migration network and the risk of COVID-19 transmission in China-empirical analysis and prediction in prefecture-level cities. Int J Environ Res Public Health. 2020;17(8):2630. doi:10.3390/ijerph17082630
5. Zhong P, Guo S, Chen T. Correlation between travellers departing from Wuhan before the Spring Festival and subsequent spread of COVID-19 to all provinces in China. J Travel Med. 2020;27(3):taaa036. doi:10.1093/jtm/taaa036
6. Riou J, Althaus CL. Pattern of early human-to-human transmission of Wuhan 2019 novel coronavirus (2019-nCoV), December 2019 to January 2020. Euro Surveill. 2020;25(4):2000058. doi:10.2807/1560-7917.ES.2020.25.4.2000058
7. Zhao S, Zhuang Z, Ran J, et al. The association between domestic train transportation and novel coronavirus (2019-nCoV) outbreak in China from 2019 to 2020: a data-driven correlational report. Travel Med Infect Dis. 2020;33:101568. doi:10.1016/j.tmaid.2020.101568
8. Chen J, Feng ZH, Ye L, et al. Travel rush during Chinese Spring Festival and the 2019-nCoV. Travel Med Infect Dis. 2020;37:101686. doi:10.1016/j.tmaid.2020.101686
9. Liu K, Ai S, Song S, et al. Population movement, city closure in Wuhan, and geographical expansion of the COVID-19 infection in China in January 2020. Clin Infect Dis. 2020;71(16):2045–2051. doi:10.1093/cid/ciaa422
10. Jia JS, Lu X, Yuan Y, Xu G, Jia J, Christakis NA. Population flow drives spatio-temporal distribution of COVID-19 in China. Nature. 2020;582(7812):389–394. doi:10.1038/s41586-020-2284-y
11. Li Q, Guan X, Wu P, et al. Early transmission dynamics in Wuhan, China, of novel coronavirus-infected pneumonia. N Engl J Med. 2020;382(13):1199–1207. doi:10.1056/NEJMoa2001316
12. Simonov M, Ugwuowo U, Moreira E, et al. A simple real-time model for predicting acute kidney injury in hospitalized patients in the US: a descriptive modeling study. PLoS Med. 2019;16(7):e1002861. doi:10.1371/journal.pmed.1002861
13. Hsieh YH. Temporal patterns and geographic heterogeneity of Zika virus (ZIKV) outbreaks in French Polynesia and Central America. PeerJ. 2017;5:e3015. doi:10.7717/peerj.3015
14. Sebrango-Rodríguez CR, Martínez-Bello DA, Sánchez-Valdés L, et al. Real-time parameter estimation of Zika outbreaks using model averaging. Epidemiol Infect. 2017;145(11):2313–2323. doi:10.1017/S0950268817001078
15. Zhou G, Yan G. Severe acute respiratory syndrome epidemic in Asia. Emerg Infect Dis. 2003;9(12):1608–1610. doi:10.3201/eid0912.030382
16. Bates DM, Watts DG. Nonlinear regression analysis and its applications. Wiley; 2007.
17. Greenwell BM, Schubert Kabban CM. investr: an R package for inverse estimation. R J. 2004;6(1):90–100. doi:10.32614/RJ-2014-009
18. Holshue ML, DeBolt C, Lindquist S, et al.; Washington State 2019-nCoV Case Investigation Team. First case of 2019 novel coronavirus in the United States. N Engl J Med. 2020;382(10):929–936. doi:10.1056/NEJMoa2001191
19. Alirol E, Getaz L, Stoll B, Chappuis F, Loutan L. Urbanisation and infectious diseases in a globalised world. Lancet Infect Dis. 2011;11(2):131–141. doi:10.1016/S1473-3099(10)70223-1
20. Wu JT, Leung K, Leung GM. Nowcasting and forecasting the potential domestic and international spread of the 2019-nCoV outbreak originating in Wuhan, China: a modelling study. Lancet. 2020;395(10225):689–697. doi:10.1016/S0140-6736(20)30260-9
21. Khajji B, Kada D, Balatif O, Rachik M. A multi-region discrete time mathematical modeling of the dynamics of Covid-19 virus propagation using optimal control. J Appl Math Comput. 2020;8:1–27. doi:10.1007/s12190-020-01354-3
22. Mamode Khan N, Soobhug AD, Heenaye-Mamode Khan M. Studying the trend of the novel coronavirus series in Mauritius and its implications. PLoS One. 2020;15(7):e0235730. doi:10.1371/journal.pone.0235730
23. Tang B, Wang X, Li Q, et al. Estimation of the transmission risk of the 2019-nCoV and its implication for public health interventions. J Clin Med. 2020;9(2):462. doi:10.3390/jcm9020462
24. Zhong NS, Zheng BJ, Li YM, et al. Epidemiology and cause of severe acute respiratory syndrome (SARS) in Guangdong, People’s Republic of China, in February, 2003. Lancet. 2003;362(9393):1353–1358. doi:10.1016/s0140-6736(03)14630-2
 © 2021 The Author(s). This work is published and licensed by Dove Medical Press Limited. The
full terms of this license are available at https://www.dovepress.com/terms
and incorporate the Creative Commons Attribution
- Non Commercial (unported, 3.0) License.
By accessing the work you hereby accept the Terms. Non-commercial uses of the work are permitted
without any further permission from Dove Medical Press Limited, provided the work is properly
attributed. For permission for commercial use of this work, please see paragraphs 4.2 and 5 of our Terms.
© 2021 The Author(s). This work is published and licensed by Dove Medical Press Limited. The
full terms of this license are available at https://www.dovepress.com/terms
and incorporate the Creative Commons Attribution
- Non Commercial (unported, 3.0) License.
By accessing the work you hereby accept the Terms. Non-commercial uses of the work are permitted
without any further permission from Dove Medical Press Limited, provided the work is properly
attributed. For permission for commercial use of this work, please see paragraphs 4.2 and 5 of our Terms.