Back to Journals » Patient Preference and Adherence » Volume 16
Exploring the Agreement Between Self-Reported Medication Adherence and Pharmacy Refill-Based Measures in Patients with Kidney Disease
Authors Murali KM ![]() , Mullan J
, Mullan J ![]() , Roodenrys S
, Roodenrys S ![]() , Cheikh Hassan HI, Lonergan MA
, Cheikh Hassan HI, Lonergan MA
Received 3 September 2022
Accepted for publication 13 December 2022
Published 30 December 2022 Volume 2022:16 Pages 3465—3477
DOI https://doi.org/10.2147/PPA.S388060
Checked for plagiarism Yes
Review by Single anonymous peer review
Peer reviewer comments 2
Editor who approved publication: Dr Johnny Chen
Karumathil M Murali,1,2 Judy Mullan,2 Steven Roodenrys,3 Hicham I Cheikh Hassan,1,2 Maureen A Lonergan1
1Department of Nephrology, Wollongong Hospital, Wollongong, NSW, Australia; 2School of Medicine, University of Wollongong, Wollongong, NSW, Australia; 3School of Psychology, University of Wollongong, Wollongong, NSW, Australia
Correspondence: Karumathil M Murali, Department of Nephrology, Wollongong Hospital, Wollongong, NSW, 2500, Australia, Tel +61 2 42952800, Fax +61 2 4295 2916, Email [email protected]
Aim: To assess the quantitative and categorical agreement between two methods of measuring medication adherence: pharmacy refill-based medication possession rates and self-reported medication adherence scale.
Background: Categorisation of adherence metrics using empirical cut-off scores can lead to misclassification, which can be overcome by expressing adherence as a continuous variable. Pharmacy refill-based adherence can be reported as actual rates, but the validity of expressing self-reported medication adherence scores as a continuous variable to reflect adherence is unknown and its quantitative agreement with refill-based adherence rates untested.
Methods: Patients with kidney disease, including dialysis patients, from Illawarra Shoalhaven region of New South Wales, Australia were recruited between January 2015 and June 2016 to this cross-sectional study. Medication adherence was assessed using the self-reported Morisky Medication Adherence Scale (MMAS) and two pharmacy refill-based measures, Medication Possession Ratio (MPR) and Proportion of Days Covered (PDC) for antihypertensives and cardiometabolic drugs. Categorical and quantitative agreement between self-reported adherence and pharmacy refill-based adherence were assessed using tests of trend, analysis of covariance (ANCOVA), Cohen’s kappa and Bland-Altman analysis.
Results: We recruited 113 patients. There was a significant declining trend of MPR (p < 0.001) and PDC (< 0.001 for antihypertensives, p = 0.004 for cardiometabolic) scores among categories with worsening MMAS adherence. Adjusted ANCOVA showed significant association between self-report and pharmacy refill-based adherence (p < 0.001). Weighted Cohen’s kappa statistics showed fair agreement between the self-report and pharmacy refill-based categories. Bland-Altman’s analysis showed less than 5% of cases were outside the limits of agreement (− 0.36 to 0.27) and the bias for MMAS was negative (− 0.05 to − 0.09), indicating MMAS did not overestimate adherence.
Conclusion: There is modest agreement between pharmacy refill-based measures and self-report MMAS measures when assessed categorically or quantitatively. Assessing adherence as a continuous variable should be considered to overcome the challenges associated with categorization of adherence based on arbitrary thresholds.
Keywords: medication adherence, patient compliance, self report, medication possession rate, proportion of days covered, kidney failure, chronic kidney disease
Introduction
Poor adherence to medications is observed in up to 50% of patients with chronic diseases1 and is associated with a higher risk of morbidity and mortality.2 Patients with kidney disease, especially those with kidney failure (KF) on dialysis, have an unusually high pill burden,3 which could make them vulnerable to poor medication adherence. Kidney disease is also associated with a high prevalence of psychosocial issues such as anxiety and depression as well as lower health literacy which can promote nonadherence.4–6 The adoption of strategies to improve adherence would therefore be highly beneficial among this patient population, and an accurate diagnosis of medication nonadherence is the first step in this approach.2
The detection of nonadherence is, however, not easy due to the absence of a reliable method that consistently identifies and quantifies adherence.2,7 The prevalence of nonadherence can vary based on the method used to measure adherence, as exemplified by an Australian study of patients with pre-dialysis chronic kidney disease, which reported nonadherence rates of 43% and 60% among patients in the same cohort, using two different self-report tools.8 Medication refill data, curated from pharmacy insurance claims, have been increasingly used to measure adherence with the advent of computerized pharmacy refill records.9 The premise behind their use is the assumption that medication refills, which equate to medication possession, correspond to medication-taking behaviours.10 Constructs of medication possession based on pharmacy refill data, such as “medication possession ratio” (MPR), estimate medication availability by computing the ratio of the prescribed days’ supply filled by the patient to the total prescribed days in a refill interval, during the study period.11 These medication refill measures are continuous metrics with higher values, closer to 1.0 (100%), indicating better adherence. However, patients are frequently categorised as “adherent” or “nonadherent” based on arbitrary thresholds using different cut-off scores of refill measures.12 For instance, studies have frequently used a cut-off score of 0.8 (80%), assigning patients to “inadequate” (<0.8) or “adequate” adherence (≥0.8) categories.11,13 Based on this paradigm, patients with a medication refill rate of 0.2 (20%) or 0.79 (79%) would be classified to the same category of “inadequate adherence”, while the latter patient is much closer to being “adherent” than the former. Furthermore, a cutoff threshold of 0.8 may not also be appropriate for all clinical settings; for instance, 80% adherence is insufficient for a kidney transplant recipient. To avoid the potential issues with categorization of adherence using arbitrary thresholds, it has been suggested to measure adherence as a continuous variable.7
Medication adherence is more frequently measured using self-reported, subjective adherence instruments such as the Morisky medication adherence scale (MMAS) and the Hill-Bone scale.14 The MMAS aggregates the scores drawn from responses to standardized questions and classifies patients into categories of high, medium and low adherence, using cut-off aggregate scores.15 The MMAS categories have been shown to correspond to clinical indicators of medication non-adherence, such as inadequate blood pressure control.15,16 It has also been validated against objective adherence markers like the pharmacy refill rates, based on concordance between MMAS adherence categories and pharmacy refill adherence categories, and rates of non-persistent refills.13
Similar to the medication refill measures, eg, MPR, as highlighted above, it is possible that a lower MMAS score such as 1.5 may represent much poorer adherence than a higher score such as 5.75, even though both patients would be categorized to “inadequate adherence” using the recommended cut-off score (<6.0). Whether the MMAS score can be expressed as a continuous variable to reflect medication adherence just like the MPR scores has not been examined. In this context, we sought to explore the quantitative limits of agreement between aggregate scores of the MMAS adherence instrument and pharmacy refill rates as continuous variables, in a cohort of patients with chronic kidney disease, including patients with KF on dialysis. In the same cohort, we also assessed the agreement between categories of lower adherence for the two measures, which has been reported in the literature, for non-renal patient groups.
Materials and Methods
This cross-sectional study was conducted among patients attending the renal outpatient clinics for the treatment of chronic kidney disease (CKD) and those with KF who were undergoing dialysis in the Illawarra Shoalhaven Local Health District in New South Wales, Australia. The study aimed to examine the level of quantitative agreement between two measures of medication adherence and was part of a broader project, which explored the relationship between medication adherence and its potential contributing factors in the above cohort. Patients who were 18 years or older and had kidney disease were able to take part in the study. Patients were excluded if they had undergone kidney transplantation or were being actively worked up for a living donor transplant, had been diagnosed with dementia or intellectual impairment, had an anticipated life expectancy of fewer than 12 months, or were on a renal palliative care pathway. The test instruments were administered in English by research assistants, and patients who did not speak and read English were also excluded from the study.
This study was approved by the Illawarra Shoalhaven Local Health District/University of Wollongong Human Research Ethics Committee (HE14/398–HREC/14/WGONG/90) and complies with the Declaration of Helsinki. Participants in this study signed a consent form for the main study, as well as a separate consent form, approved by Services Australia, which authorized the use of pharmacy refill information from the Medicare Pharmaceutical Benefits Scheme (PBS) claims data, subject to patients specifically consenting for the release of such data. The Services Australia approval was obtained after a detailed review of the study protocol (vide reference number MI-7232).
Data Collection
Demographic and Clinical Data
Demographic data (age, gender, race, educational level and income), smoking status and clinical data (cause of renal disease and comorbidities) were collected using a combination of patient interviews and chart reviews.
Measures of Medication Adherence
Self-reported medication adherence was assessed using the 8-item Morisky medication adherence scale (MMAS).15 Based on their aggregate MMAS scores, participants were categorized as highly adherent (score = 8), moderately adherent (score = 6 to <8) or poorly adherent (score <6).15 For assessing quantitative agreement, we generated an MMAS score fraction by dividing the aggregate MMAS score of a given patient by 8, which is the maximum possible MMAS score. For instance, a raw MMAS score of 8 for a patient equated to an MMAS score fraction of 1.0 (8/8), while an aggregate MMAS score of 6 equated to a score fraction of 0.75 (6/8).
Two pharmacy refill-based measures, namely “medication possession ratio” (MPR) and “proportion of days covered” (PDC), were derived from the PBS medication refill data using the standard approach. MPR was computed as the total days of supply of the dispensed medication (supply days) divided by the total number of days in the study period (study days).11,17 PDC was computed as the total number of days on which the patient had the medication available, or the days covered (covered days) divided by the number of days in the study period (study days).17,18 MPR is insensitive to delayed script refills,19 while PDC takes into account delayed refills, since medication will not be available till refill.18 PDC also truncates any oversupply by capping adherence at 1.0 (100%), while MPR can go beyond 1.0, by allowing oversupply.11
We analysed MPR and PDC for two groups of drugs, namely antihypertensive medications and other cardiometabolic drugs (including statins). In this study, we included cardiovascular drugs other than antihypertensives, such as, clopidogrel, amiodarone, isosorbide mononitrate, nicorandil and lipid lowering drugs such as statins, ezetimibe and fibrates as cardiometabolic drugs. Anti-platelet agents like clopidogrel were included among cardiometabolic drugs due to the standard practice of fixed-dose therapy, but oral anticoagulants were excluded since the majority of the patients on this class were on warfarin, which routinely has variable dosing and not suitable for medication dispensing data to assess adherence. In addition, aspirin was not included among the cardiometabolic drugs in the analysis because it is available without prescription and may not be captured by refill measures. When patients were on multiple ‘antihypertensive medications’ or “other cardiometabolic medications”, the average of their MPR and PDC was taken as the final MPR and PDC for the respective group. We did not examine the adherence to phosphate-binding agents because: that would be applicable only for KF patients; their prescribed dose could change frequently based on monthly blood test results and therefore make the estimation of the denominator of “study days” (see below) less reliable. It is important to recognize that patients are far less adherent to phosphate binders compared to antihypertensive drugs.20
For the purposes of the study, PBS claims data obtained for each patient included the description of the medication, date of prescription, PBS item code, date of medication supply, patient category, such as general, concessional, and form category, such as original, repeat script. The PBS claims data were obtained for the period spanning from the patients’ enrolment to the main study to the conclusion of the study. Since the quantity of a medication dispensed at one refill is generally fixed, based on the standard pack size, and the prescribed dose of the medication can vary between patients, the “study days” for which the refilled medication supply is available can vary between patients. The “study days”, which varies with the prescribed dose, is the denominator for computing both MPR and PDC. The information on the prescribed dose corresponding to the refill period was obtained from the patient’s medical records to calculate “study days” and was used to compute MPR and PDC.
Medications studied in this research could be refilled only with a valid prescription from a registered medical practitioner in the Australian healthcare system. Since all patients are covered by the mandatory public health insurance scheme, known as Medicare21 and all outpatient medications are dispensed under the Pharmaceutical Benefits Scheme (PBS) of Medicare, it was assumed that the data regarding medication refills were comprehensive.
Refill data were included in the analysis only when three or more scripts covering a continuous period of three or more months were identified during the study period for each patient, since MPR and PDC have improved precision when calculated over at least three dispensings.11 For patients who had refill-data covering an extended period of time, only the first 12–18 months of continuous therapy of each drug, which could be matched with the prescription information from medical records, was included in the calculation of MPR and PDC. If the same drug was prescribed at a different dose or the drug was switched with another agent from the same class, it was not counted again. However, if a different class of drug was used during the study period that was included as a different medication for the analysis if it satisfied the above criteria.
Statistical Methods
We described continuous variables using means and standard deviations and discrete variables using proportions. We compared continuous variables between CKD and KF groups using the Wilcoxon rank-sum test and categorical variables using the chi-square test. MPR and PDC were calculated for each dispensed medication of interest with the “medadherence package” for Stata17 using the dispensing dates, supply days and study days information from the refill and prescription data.
Association and Agreement Between MMAS and MPR / PDC Adherence Measures
Different methods were used to assess the association and concordance/agreement between measures of medication possession and self-reported measures. We examined the scores of MPR and PDC among high, medium and low adherence categories based on self-reported MMAS scores. We evaluated the trend of MPR/PDC scores across the MMAS categories using non-parametric tests of trend. We also undertook the analysis of covariance (ANCOVA) to explore the independent association between refill adherence rates and MMAS categories, after adjusting for age, patient group, whether CKD or KF on dialysis, educational status and annual income, due to their potential confounding effect on medication adherence. Conversely, we also looked at the MMAS aggregate scores in patients with adequate and inadequate adherence categories based on cut-off scores (<0.8 vs ≥0.8) of MPR and PDC for antihypertensive medications and other cardiometabolic medications. We examined the independent association between MMAS aggregate scores and MPR/PDC categories adjusting for age, patient group, educational status and annual income.
Since MMAS as well as MPR and PDC measure the same entity of medication adherence, we considered weighted Cohen’s kappa to be the most appropriate method to assess the agreement between categories of suboptimal adherence based on the two instruments. We examined the agreement of low versus medium and high adherence MMAS categories with pharmacy refill-based adherence categories of <0.8 versus ≥0.8 scores for MPR and PDC for antihypertensives and other cardiometabolic drugs.
Bland-Altman plots were used to evaluate the agreement between MMAS score fractions and MPR & PDC separately for antihypertensive drugs and other cardiometabolic drugs. In these analyses, we examined how many measurements were outside the limits of agreement, the mean bias and the limits of agreement for each analysis. Missing data were handled by list-wise deletion. Statistical significance was set at a two-tailed p-value of <0.05 for all comparisons. The statistical analyses were undertaken using Stata 16.0.
Results
Study Population
Of the 321 eligible participants (148 KF and 173 CKD patients) invited to participate in the study, 220 patients, 107 with KF undergoing dialysis and 113 with CKD not receiving dialysis, were recruited for the main study, after 66 (20.6%) patients declined to participate and 35 patients either withdrew consent or had an exclusion criterion identified before any study procedure was done. Out of this main study sample, 122 patients provided informed consent to release their PBS claims data. However, pharmacy refill data was obtained for only 116 patients since Services Australia consent forms were incomplete for six participants. Furthermore, three patients were not receiving antihypertensive or other cardiometabolic medications, resulting in a final refill cohort of 113 study participants (53 KF requiring dialysis and 60 early-stage CKD). The baseline characteristics are given in Table 1.
 |
Table 1 Baseline Characteristics of the Study Sample Comparing Non-Dialysis CKD Patients and KF Patients |
Table 2 provides the measures of self-reported and refill data derived medication adherence markers in the overall sample and the KF, CKD groups. MMAS scores were significantly lower in KF patients (p = 0.026) compared to CKD patients. The proportion of patients with low adherence (MMAS score <6.0) was greater in KF (37.7%) compared to CKD (25%); however, this difference was not statistically significant. Measures of antihypertensive medication adherence, assessed by MPR and PDC scores, as well as categories of low adherence (<0.8), were worse in KF patients compared to CKD patients (Table 2). Medication possession measures of other cardiometabolic medications, assessed by MPR and PDC scores, as well as categories of low adherence (<0.8), were worse but not significantly different between KF patients and CKD patients.
 |
Table 2 Results of Measures of Self-Reported and Pharmacy Refill-Based Medication Adherence for the Overall Sample and CKD, KF Sub-Groups |
The MPR and PDC scores for antihypertensive medications and other cardiometabolic medications for different MMAS adherence categories are shown in Table 3. There was a consistent and statistically significant drop in MPR and PDC for both classes of medications with worsening self-reported adherence. The non-parametric test for trend showed a significant declining trend in MPR and PDC scores for both antihypertensive and cardiometabolic medications among MMAS adherence categories. ANCOVA investigating the association between refill adherence scores and MMAS categories, adjusted for age, educational status, income status and patient group (KF on dialysis vs CKD), was also significant for all analyses (Table 3). Vice versa, the MMAS scores were significantly lower in the MPR and PDC low adherence category (score <0.8) for both antihypertensives and other cardiometabolic medications. ANCOVA investigating the independent association between MMAS scores and MPR as well as PDC categories, adjusted for age, educational status, income status and patient group, also showed significant association (Table 4).
 |
Table 3 The Trend of Pharmacy Refill-Based Markers of Medication Adherence Among MMAS Categories of Self-Reported Adherence |
 |
Table 4 MMAS Scores in Patients with High vs Low Adherence Category Based on MPR and PDC for Antihypertensives and Other Cardiometabolic Medications |
Cohen’s kappa statistics for agreement between categories of low adherence based on MMAS scores and measures derived from refill data are given in Table 5. There was fair agreement between the categories of the two methods of measuring adherence which was statistically significant.
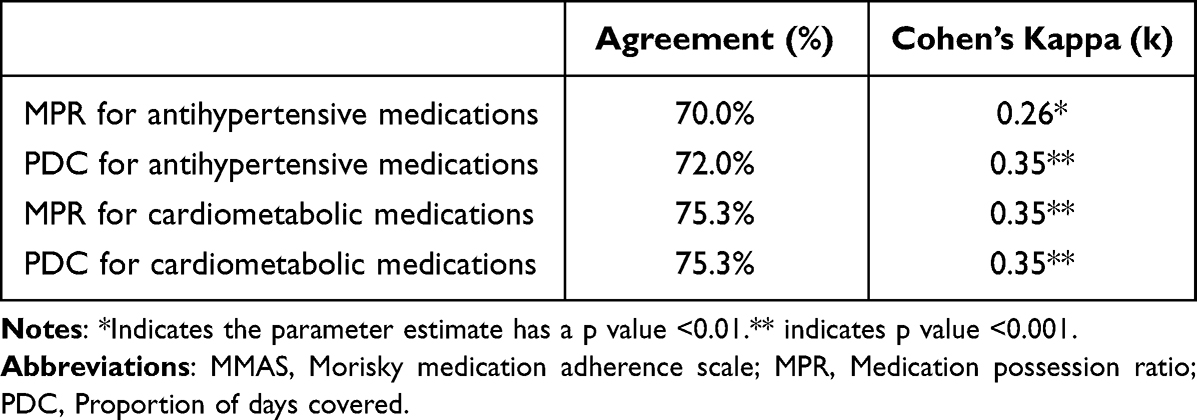 |
Table 5 Cohen’s Kappa Exploring Agreement Between Low Adherence MMAS Category (MMAS Score <0.6) and Low Adherence Based on Pharmacy Refill-Based Measures for MPR & PDC (<0.8) |
The results of our examination of the agreement between MMAS score fractions and MPR and PDC scores using the Bland-Altman plots are given in Figures 1–4. Less than 5% cases for MPR and PDC for both antihypertensive and other cardiometabolic medications were outside the limits of agreement. The mean bias ranged from −0.05 to −0.09, suggesting some concordance, but the limits of agreement were much broader, indicating such concordance is not strong. The mean bias and the limits of agreement between MMAS score fractions and measures of refill adherence measures are given in Table 6.
 |
Table 6 Bias and Limits of Agreement for the Parameter Estimate as per Bland Altman Plots Evaluating Agreement Between MMAS Score and Pharmacy Refill-Based Measures |
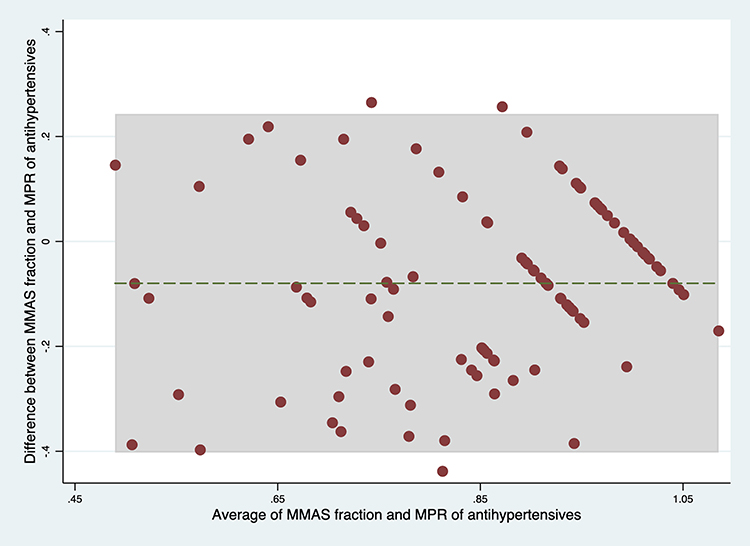 |
Figure 1 Bland Altman plots exploring agreement between MMAS and MPR of antihypertensives. |
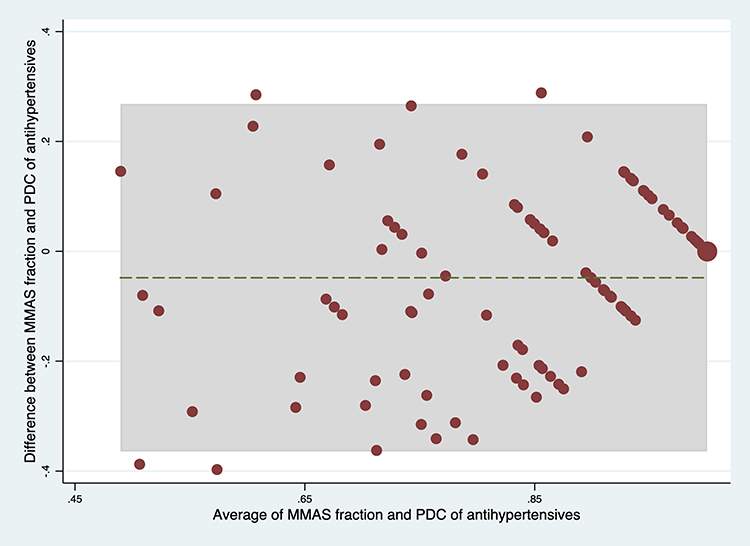 |
Figure 2 Bland Altman plots exploring agreement between MMAS and PDC of antihypertensives. |
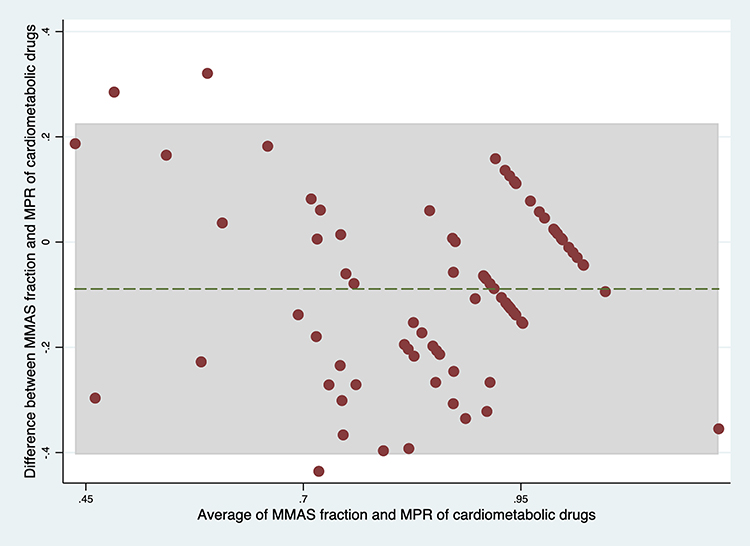 |
Figure 3 Bland Altman plots exploring agreement between MMAS and MPR of cardiometabolic medications. |
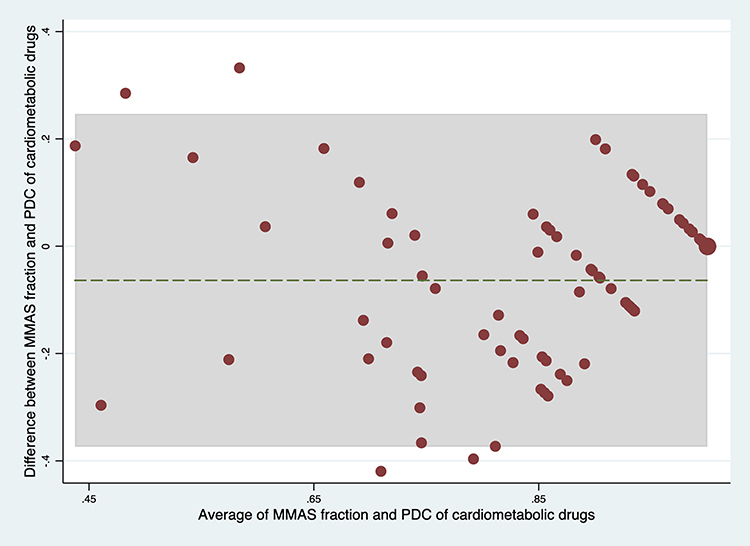 |
Figure 4 Bland Altman plots exploring agreement between MMAS and PDC of cardiometabolic medications. |
Discussion
The key findings from our study demonstrate a modest agreement between measures of adherence assessed by the self-reported MMAS scale and the pharmacy refill data, based on categorical analysis, as well as quantitative analysis of the limits of agreement using the Bland–Altman method. We also noted that the bias for the limits of agreement between MMAS and MPR or PDC was negative indicating that the self-reported scale did not overestimate or inflate adherence.22 The agreement between lower adherence categories of MMAS and pharmacy refill measures is consistent with existing literature.13,23 However, our finding of a modest agreement between aggregate scores of MMAS expressed as a fraction and refill adherence measures, analysed as continuous variables, has not been previously reported in the literature. The discussion below focuses on the rationale for using adherence as a continuous measure and comparing the two instruments quantitatively.
Medication non-adherence is an important consideration in the management of chronic diseases.1 However, there is far less certainty regarding the best method of measuring medication nonadherence or estimating its severity. Long-term medication taking is a highly complex behaviour with three phases, namely initiation, implementation, and persistence, and poor medication adherence can impact any of these phases. However, specific adherence measures may be sensitive to one phase of adherence, but may not detect poor adherence in a different phase with the same reliability.24 For instance, electronic medication monitoring, which is perceived to be the most accurate method of tracking medication adherence, is not sensitive to non-adherence manifesting as non-initiation.24 Different metrics derived from pharmacy refill data have been used to assess adherence objectively, such as MPR or PDC, categories of adherence based on treatment gaps, and time between prescription refills.10,11 In our study, we have used MPR and PDC, which are the most widely used objective refill measures, and the latter has also been approved by Centres for Medicaid and Medicare Services (CMS) as an adherence measure to be used in its star rating program.25
Even though MPR and PDC are continuous variables, researchers often dichotomize patients based on the adherence rates using arbitrary cut-off scores into adherent and non-adherent categories. The commonly used cut-off score of 0.8 (80%) and above used to define adherence13,18 may be reasonable for many chronic diseases, striking a balance between the benefits of long-term therapy and the burden of uninterrupted medication taking. However, an adherence level of 0.8 (80%) may not be sufficient for immunosuppressive therapy in transplant recipients. Such arbitrary categorization of adherence may therefore not be relevant in all clinical settings. Categorization based on arbitrary cut-off scores also poses the risk of inadvertently compressing or amplifying the differences in medication adherence between patients. For example, if we consider two patients, one with a PDC of 0.75 and another with 0.25, the difference between them is compressed by placing them in the same category due to the 0.8 cut-off criteria, while the difference between a patient who has a PDC value of 0.75 and 0.85 is amplified by placing them in the different categories using the same criteria. On the other hand, using MPR or PDC as a continuous variable retains the quantitative information and provides the most unbiased estimate that is available even though analysing adherence as a continuous variable may require novel approaches.
Even though subjective measures of adherence like self-reported questionnaires may be perceived as less robust, they are far more practical and suitable for routine outpatient use as a measure of adherence in most research settings. It is noteworthy that lower adherence based on self-report tools such as MMAS has been associated with adverse health outcomes such as higher mortality and hospitalization as well as greater treatment costs per quality adjusted life-years.26–28 Measurement of medication adherence is currently not used in routine clinical practice, but instruments like MMAS are easily useable in diverse clinical settings. Traditionally, self-reported questionnaires, including MMAS, have reported the results as categories based on cut-off scores of aggregate scores derived from the responses to standardized questions. However, whether a much lower aggregate score within the same category indicates a worse degree of nonadherence is unknown. We have noted that MMAS scores were lower in the lower adherence category based on a cut-off score of <0.8 for both MPR and PDC for antihypertensives and other cardiometabolic medications. To check whether the aggregate MMAS scores agree with the MPR or PDC scores, we tried to explore the agreement between refill adherence measures and the MMAS fractions as a continuous variable. It is widely perceived that self-reported measures tend to overestimate adherence, but we noted in the Bland-Altman analysis that the bias between MMAS fractions and MPR and PDC was negative, indicating the MMAS fraction scores were lower than MPR and PDC measurements. However, the limits of agreement were wide, indicating the concordance was not strong. Therefore, the current results should be interpreted with caution while future studies using a similar approach in diverse healthcare settings would be informative.
Our assessment of agreement between categories of low adherence based on MMAS and refill measures yielded results that are consistent with existing literature. Many studies have used the correlation between categories to report the agreement. However, since both tests are measuring the same attribute of medication adherence, Cohen’s kappa is the most appropriate test for assessing agreement between categories and Bland-Altman’s method is the most appropriate approach for examining the agreement between continuous variables, rather than correlation or regression.29,30 We have used these recommended methods in our analyses.
Our study has strengths and limitations. This is the first study exploring agreement between refill measures and self-reported MMAS adherence scale as a continuous variable, and we have noted that there is modest agreement even with this comparison. An important issue in the calculation of MPR and PDC is the ability to accurately determine the denominator, which is the number of “study days” for which medication supply is available with a single refill. This is determined by the prescribed dose and the standard dispensing pack size. In some studies that involve refill data, this information is not readily available, which could introduce errors in the estimation of MPR and PDC, if a standard dosing regimen is assumed.11 In our relatively small cohort, we had access to corresponding prescription information, which ensured the accuracy of the MPR and PDC results.
We have compared two commonly used methods of measuring adherence which have been widely used in published literature in this field. Nevertheless, it could be argued that MMAS is not a true continuous variable since this is computed by aggregating the scores from the responses to a number of rating questions, and therefore not suitable for parametric analysis. However, such analyses are common in the field of psychology and it has been argued that while the responses to a rating question like the Likert items may be ordinal, the scales which consist of sums across many such items can be considered interval and parametric statistics can be shown to be robust despite violations of some of the strict statistical assumptions.31 The MPR and PDC are inherently continuous measures and we believe the evaluation of quantitative agreement between them and MMAS score fractions is justified. Nevertheless, it must be acknowledged that a given MMAS score or fraction, used as a continuous variable, may not carry the same weight and reliability as the corresponding MPR or PDC.
Self-reported measures like MMAS are most suitable for evaluating adherence to a single medication, and most patients in our study had a high pill burden. It could also be argued that evaluation of non-adherence is more important in patients who have a heavy pill burden since there is a greater risk of developing non-adherence to at least some of the medications. Administering the MMAS questionnaire for each medication separately will be repetitive and impractical, and it is noteworthy that there was moderate agreement between self-reported measures and refill measures using various methods of evaluation, which may indicate that this approach is valid even for patients on multiple medications. We have not assessed the adherence to phosphate binders which impose a significant medication burden, especially for patients with kidney failure on dialysis.3 Since nonadherence to phosphate binders is common,20 the agreement observed with antihypertensives and cardiometabolic medications may not have persisted with phosphate binders, which is a limitation of our study. However, the frequent dose changes of phosphate binders that commonly occur in clinical practice would have made the estimation of MPR and PDC less reliable and the assessment of agreement potentially inaccurate.
It should also be acknowledged that our sample size was relatively modest, drawn from a single local health district and included a heterogenous patient population (ie patients with early stage CKD and those with kidney failure requiring dialysis). These limitations should be considered when interpreting our findings and conclusions.
It is noteworthy that the prevalence of nonadherence reported in our study (31%) was lower than that reported in an Australian study which evaluated adherence in patients with kidney disease (43–60%),8 but closer to the pooled non-adherence rates (32.6%) in a systematic review of pre-dialysis chronic kidney disease patients.32 The variations in the nonadherence rates between studies may be due to variations in the instruments used to measure adherence. It is also possible that a greater proportion of nonadherent patients may have declined to participate in our study which could have skewed our results. This suggestion is based on the evidence that patients with unfavourable behaviours and profiles are often overrepresented among the non-participants in clinical research leading to selection bias.33
The key message from our study is the feasibility of using a self-reported adherence tool like MMAS in evaluating adherence as a continuous variable, rather than as defined categories, especially since non-adherence is not an all-or-none behaviour, and the intensity of sub-optimal adherence can vary between individuals and within the same subject between different time periods.4 More research is needed in this area to draw more confident conclusions.
Acknowledgments
The Morisky Medication Adherence Scale (MMAS) is copyrighted by Prof. Donald E Morisky. We acknowledge Prof. Morisky for providing permission to use the instrument. The following statement and specified citations which are included are required as part of the License contract. The MMAS-8 Scale, content, name, and trademarks are protected by US copyright and trademark laws. Permission for use of the scale and its coding is required. A license agreement is available from MMAR, LLC., www.moriskyscale.com.
Disclosure
The authors report no conflicts of interest in this work.
References
1. Sabate E. Adherence to long-term therapies: evidence for action. In: Report of WHO Adherence to Long-Term Therapies Project. Geneva, Switzerland: World Health Organization; 2003.
2. Osterberg LG, Blaschke T. Adherence to medication. N Engl J Med. 2005;353:487–497. doi:10.1056/NEJMra050100
3. Chiu YW, Teitelbaum I, Misra M, de Leon EM, Adzize T, Mehrotra R. Pill burden, adherence, hyperphosphatemia, and quality of life in maintenance dialysis patients. Clin J Am Soc Nephrol. 2009;4:1089–1096. doi:10.2215/CJN.00290109
4. Huang CW, Wee PH, Low LL, et al. Prevalence and risk factors for elevated anxiety symptoms and anxiety disorders in chronic kidney disease: a systematic review and meta-analysis. Gen Hosp Psychiatry. 2021;69:27–40. doi:10.1016/j.genhosppsych.2020.12.003
5. Palmer S, Vecchio M, Craig JC, et al. Prevalence of depression in chronic kidney disease: systematic review and meta-analysis of observational studies. Kidney Int. 2013;84:179–191. doi:10.1038/ki.2013.77
6. Elisabeth Stømer U, Klopstad Wahl A, Gunnar Gøransson L, Hjorthaug Urstad K. health literacy in kidney disease: associations with quality of life and adherence. J Ren Care. 2020;46:85–94. doi:10.1111/jorc.12314
7. Murali KM, Lonergan M. Breaking the adherence barriers: strategies to improve treatment adherence in dialysis patients. Semin Dial. 2020;33:475–485. doi:10.1111/sdi.12925
8. Tesfaye WH, McKercher C, Peterson GM, et al. Medication adherence, burden and health-related quality of life in adults with predialysis chronic kidney disease: a prospective cohort study. Int J Environ Res Public Health. 2020;17:06. doi:10.3390/ijerph17010371
9. Farmer KC. Methods for measuring and monitoring medication regimen adherence in clinical trials and clinical practice. Clin Ther. 1999;21:1074–90; discussion 3. doi:10.1016/S0149-2918(99)80026-5
10. Lam WY, Fresco P. Medication adherence measures: an overview. Biomed Res Int. 2015;2015:217047. doi:10.1155/2015/217047
11. Raebel MA, Schmittdiel J, Karter AJ, Konieczny JL, Steiner JF. Standardizing terminology and definitions of medication adherence and persistence in research employing electronic databases. Med Care. 2013;51:S11–21. doi:10.1097/MLR.0b013e31829b1d2a
12. Morrison A, Stauffer ME, Kaufman AS. Defining medication adherence in individual patients. Patient Prefer Adherence. 2015;9:893–897. doi:10.2147/PPA.S86249
13. Krousel-Wood M, Islam T, Webber LS, Re RN, Morisky DE, Muntner P. New medication adherence scale versus pharmacy fill rates in seniors with hypertension. Am J Manag Care. 2009;15:59–66.
14. Kim CJ, Schlenk EA, Ahn JA, Kim M, Park E, Park J. Evaluation of the measurement properties of self-reported medication adherence instruments among people at risk for metabolic syndrome: a systematic review. Diabetes Educ. 2016;42:618–634. doi:10.1177/0145721716655400
15. Morisky DE, Ang A, Krousel-Wood M, Ward HJ. Predictive validity of a medication adherence measure in an outpatient setting. J Clin Hypertens. 2008;10:348–354. doi:10.1111/j.1751-7176.2008.07572.x
16. Muntner P, Levitan EB, Joyce C, et al. Association between antihypertensive medication adherence and visit-to-visit variability of blood pressure. J Clin Hypertens. 2013;15:112–117. doi:10.1111/jch.12037
17. Linden A. Assessing medication adherence using Stata. Stata J. 2019;19:820–831. doi:10.1177/1536867X19893625
18. Benner JS, Glynn RJ, Mogun H, Neumann PJ, Weinstein MC, Avorn J. Long-term persistence in use of statin therapy in elderly patients. JAMA. 2002;288:455–461. doi:10.1001/jama.288.4.455
19. Steiner JF, Prochazka AV. The assessment of refill compliance using pharmacy records: methods, validity, and applications. J Clin Epidemiol. 1997;50:105–116. doi:10.1016/S0895-4356(96)00268-5
20. Curtin RB, Svarstad BL, Andress D, Keller T, Sacksteder P. Differences in older versus younger hemodialysis patients’ noncompliance with oral medications. Geriatric Nephrology and Urology. 1997;7(1):35–44. doi:10.1023/A:1008267104024
21. Dixit SK, Sambasivan M. A review of the Australian healthcare system: a policy perspective. SAGE Open Med. 2018;6:2050312118769211. doi:10.1177/2050312118769211
22. Morisky DE, DiMatteo MR. Improving the measurement of self-reported medication nonadherence: response to authors. J Clin Epidemiol. 2011;64:255–7; discussion 8–63. doi:10.1016/j.jclinepi.2010.09.002
23. Stirratt MJ, Dunbar-Jacob J, Crane HM, et al. Self-report measures of medication adherence behavior: recommendations on optimal use. Transl Behav Med. 2015;5:470–482. doi:10.1007/s13142-015-0315-2
24. Kronish IM, Thorpe CT, Voils CI. Measuring the multiple domains of medication nonadherence: findings from a Delphi survey of adherence experts. Transl Behav Med. 2021;11:104–113. doi:10.1093/tbm/ibz133
25. Farley JF, Kumar A, Urick BY. Measuring adherence: a proof of concept study for multiple medications for chronic conditions in alternative payment models. Pharmacy. 2019;7. doi:10.3390/pharmacy7030081
26. Berlowitz DR, Foy CG, Kazis LE, et al. Effect of intensive blood-pressure treatment on patient-reported outcomes. N Engl J Med. 2017;377:733–744. doi:10.1056/NEJMoa1611179
27. Ho PM, Rumsfeld JS, Masoudi FA, et al. Effect of medication nonadherence on hospitalization and mortality among patients with diabetes mellitus. Arch Intern Med. 2006;166:1836–1841. doi:10.1001/archinte.166.17.1836
28. Bress AP, Bellows BK, King JB, et al. Cost-effectiveness of intensive versus standard blood-pressure control. N Engl J Med. 2017;377:745–755. doi:10.1056/NEJMsa1616035
29. Ranganathan P, Pramesh CS, Aggarwal R. Common pitfalls in statistical analysis: measures of agreement. Perspect Clin Res. 2017;8:187–191. doi:10.4103/picr.PICR_123_17
30. Giavarina D. Understanding bland Altman analysis. Biochem Med. 2015;25:141–151. doi:10.11613/BM.2015.015
31. Norman G. Likert scales, levels of measurement and the “laws” of statistics. Adv Health Sci Educ Theory Pract. 2010;15:625–632. doi:10.1007/s10459-010-9222-y
32. Seng JJB, Tan JY, Yeam CT, Htay H, Foo WYM. Factors affecting medication adherence among pre-dialysis chronic kidney disease patients: a systematic review and meta-analysis of literature. Int Urol Nephrol. 2020;52:903–916. doi:10.1007/s11255-020-02452-8
33. Enzenbach C, Wicklein B, Wirkner K, Loeffler M. Evaluating selection bias in a population-based cohort study with low baseline participation: the LIFE-Adult-Study. BMC Med Res Methodol. 2019;19:135. doi:10.1186/s12874-019-0779-8
 © 2022 The Author(s). This work is published and licensed by Dove Medical Press Limited. The
full terms of this license are available at https://www.dovepress.com/terms
and incorporate the Creative Commons Attribution
- Non Commercial (unported, 3.0) License.
By accessing the work you hereby accept the Terms. Non-commercial uses of the work are permitted
without any further permission from Dove Medical Press Limited, provided the work is properly
attributed. For permission for commercial use of this work, please see paragraphs 4.2 and 5 of our Terms.
© 2022 The Author(s). This work is published and licensed by Dove Medical Press Limited. The
full terms of this license are available at https://www.dovepress.com/terms
and incorporate the Creative Commons Attribution
- Non Commercial (unported, 3.0) License.
By accessing the work you hereby accept the Terms. Non-commercial uses of the work are permitted
without any further permission from Dove Medical Press Limited, provided the work is properly
attributed. For permission for commercial use of this work, please see paragraphs 4.2 and 5 of our Terms.
Recommended articles
Determinants of Anemia Among Patients with Chronic Kidney Disease: A Systematic Review of Empirical Evidence
Prapaiwong P, Ruksakulpiwat S, Jariyasakulwong P, Kasetkala P, Puwarawuttipanit W, Pongsuwun K
Journal of Multidisciplinary Healthcare 2025, 18:3765-3780
Published Date: 28 June 2025
A Pilot Study of Virtual Reality in Hemodialysis for Mitigating Pain and Anxiety: User Experiences and Perceptions

Rodríguez de Galvis S, Guerrero Rodríguez E, Audije-Gil J, Hernández SH, Argilés-Huguet M, Botella A, Burgos Villulas M, Casaux-Huertas A, González Sánchez I, Marín López MT, Manso P, Hernán D, Dapena F, Arenas Jiménez MD
Patient Preference and Adherence 2025, 19:2069-2079
Published Date: 17 July 2025