Back to Journals » Infection and Drug Resistance » Volume 13
Exploring Diversity of COVID‑19 Based on Substitution Distance
Received 19 August 2020
Accepted for publication 9 October 2020
Published 29 October 2020 Volume 2020:13 Pages 3887—3894
DOI https://doi.org/10.2147/IDR.S277620
Checked for plagiarism Yes
Review by Single anonymous peer review
Peer reviewer comments 2
Editor who approved publication: Prof. Dr. Héctor Mora-Montes
Yi-Hau Chen,1 Hsiuying Wang2
1Institute of Statistical Science, Academia Sinica, Nankang, Taipei, Taiwan; 2Institute of Statistics, National Chiao Tung University, Hsinchu, Taiwan
Correspondence: Hsiuying Wang
Institute of Statistics, National Chiao Tung University, 1001 University Road, Hsinchu 30010, Taiwan
Tel +886-3-5712121 ext 56813
Email [email protected]
Background: The number of COVID-19 infections worldwide has reached 10 million. COVID‑19 caused by SARS-CoV-2 is more contagious than SARS-CoV-1. There is a dispute about the origin of COVID-19. Study results showed that all SARS-CoV-2 sequences around the world share a common ancestor towards the end of 2019.
Methods: Virus sequences from COVID-19 samples at the early time should be less diversifiable than those from samples at the later time because there might be more mutations when the virus evolutes over time. The diversity of virus nucleotide sequences can be measured by the nucleotide substitution distance. To explore the diversity of SARS-CoV-2, we use different nucleotide substitution models to calculate the distances of SARS-CoV-2 samples from 3 different areas, China, Europe, and the USA. Then, we use these distances to infer the origin of COVID-19.
Results: It is known that COVID-19 originated in Wuhan China and then spread to Europe and the USA. By using different substitution models, the distances of SARS-CoV-2 samples from these areas are significantly different. By ANOVA testing, the p-value is less than 2.2e-16. The analyzed results in most substitution models show that China has the lowest diversity, followed by Europe and lastly by the USA. This outcome coincides with the virus transmission time order that SARS-CoV-2 starts in China, then outbreaks in Europe and finally in the USA.
Conclusion: The magnitude of nucleotide substitution distance of SARS-CoV-2 is closely related to the transmission time order of SARS-CoV-2. This outcome reveals that the nucleotide substitution distance of SARS-CoV-2 may be used to infer the origin of COVID-19.
Keywords: coronavirus, diversity, nucleotide sequences, nucleotide substitution model, SARS-CoV-2
Introduction
The coronavirus disease 2019 (COVID-19) was caused by severe acute respiratory syndrome coronavirus 2 (SARS-CoV-2). This coronavirus outbreak has spread rapidly to more than 183 countries and the number of COVID-19 infections worldwide has reached 10 million. It has caused many deaths, especially in China, the USA, and Europe. The first SARS-CoV-2 was identified in Wuhan in December 2019. Several patients in Wuhan were linked to a seafood market.1 After that, this disease has rapidly spread from Wuhan to other cities in China and other countries. The symptoms of COVID-19 include fever, tiredness, dry cough, aches and pains, nasal congestion, runny nose, sore throat, or diarrhea. Respiratory droplet transmission is the main route of transmission, and it can also be transmitted by aerial droplets.2
A dispute over the origin of the SARS-CoV-2 has been raised. Study results showed that all SARS-CoV-2 sequences around the world sharing a common ancestor towards the end of 2019.3 Nevertheless, it is hard to conclude the SARS-CoV-2 origin. Severe acute respiratory syndrome (SARS) was reported in the early 2000s caused by severe acute respiratory syndrome coronavirus (SARS-CoV or SARS-CoV-1). Another coronavirus causing Middle East respiratory syndrome (MERS) is called MERS-coronavirus (MERS-CoV). SARS-CoV-2 binds the same cell entry receptor—angiotensin-converting enzyme II (ACE2) as SARS-CoV.4,5 But the spike glycoprotein (S) of MERS-CoV targets another cellular receptor, dipeptidyl peptidase 4 (DPP4).6,7
A study compared 6 receptor-binding domain (RBD) amino acids binding to ACE2 receptors and concluded that SARS-CoV-2 may bind human ACE2 with high affinity. This high-affinity binding of the SARS-CoV-2 spike protein to human ACE2 may be the evidence that SARS-CoV-2 is not the product of purposeful manipulation.8 Key residues in the spike protein that make contact with the ACE2 receptor are marked with blue boxes in SARS-CoV-2 and related viruses in Figure 1.8
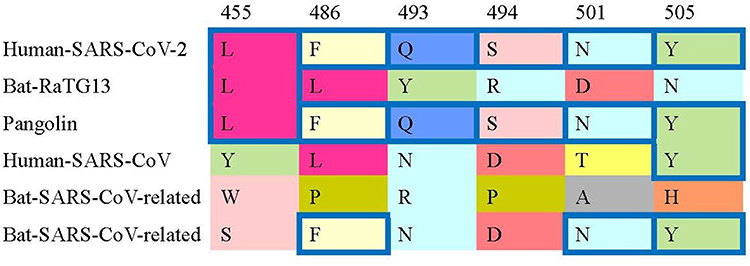 |
Figure 1 Key residues in the spike protein that make contact to the ACE2 receptor are marked with blue boxes in SARS-CoV-2 and related viruses. More details are referred to Andersen, et al (2020).8 |
The diversity of the virus sequences in an area may be used to track back the origin of the virus. In the evolutionary process of the virus, the divergence degree of the descended sequences in an early stage may be smaller than those in a later stage. Therefore, the divergence degrees of sample sequences from different areas may be a key clue that can be used to infer the origin of the virus. A basic process in the evolution of nucleotide sequences is the substitution of one nucleotide for another during evolution. To detect the divergence degree of nucleotide sequences, we can compare the proportion of different sites of two sequences that have descended from a common ancestral sequence. When the proportion of different sites between these two sequences is small, the chance for more than one substitution to have occurred at a site is negligible. However, if the proportion of the different sites is large, the observed number of differences is likely to be smaller than the actual number of substitutions due to multiple hits at the same site. Many nucleotide substitution models have been proposed to correct for multiple hits and the substitution distances are used to measure the divergence degree between two sequences.9–17
The first whole-genome sequence of SARS-CoV-2 was published on January 5, 2020.18 Then large amounts of genomes from different countries had been sequenced and were deposited on the National Center for Biotechnology Information (NCBI) Genbank. In this study, we compare the divergence of SARS-CoV-2 sequences from the three areas, China, the USA, and Europe. We apply several different nucleotide substitution models to calculate the pairwise distances of sequences in each area and then analyze the characteristics of the distances of the three areas. The analyzed results are consistent in most of these substitution models, and the results show China has the lowest diversity, followed by Europe and lastly by the USA. Since the magnitude of the substitution model distance is consistent with the virus transmission time order, we conclude that the substitution model distance method can be used to infer the origin of COVID-19.
Coronavirus
Coronaviruses are members of the family Coronaviridae, with single-stranded RNA genomes ranging from 26 to 32 kilobases in length, the largest known viral RNA genome.19 Coronavirus virions are spherical or pleomorphic enveloped particles containing single-stranded RNA associated with a nucleoprotein within a capsid comprised of matrix protein. Hosts of coronavirus include avian and various mammals, such as bats, camels, and dogs. They dwell in bats and wild birds and then spread to other animals and humans. The virus enters the host cell, and the virus replicates in cells of the ciliated epithelium, causing cell damage and inflammation.
The coronavirus subfamily is divided into four genera, α, β, ɣ, and δ coronaviruses. Human coronavirus infections are caused by α and β coronavirus.20 Avian infectious bronchitis was first described in newborn chicks in 1931. It was reported in 1968 that coronaviruses caused not only avian bronchitis but also murine hepatitis and upper respiratory tract diseases in humans.21 The virus of avian infectious bronchitis is classified as a gammacoronavirus. These viruses are members of a group that should be called the coronaviruses.21 These viruses are highly diverse because they are easy to mutation and recombination. The first coronaviruses that infected humans were called 229E and OC43 with a mild common cold symptom. The coronaviruses did not cause serious human infections until the outbreaks of SARS and then MERS.
Materials and Methods
Data Acquisition
The SARS-Cov-2 nucleotide sequences are sampled, aligned, and downloaded from the NCBI Virus sequence database. The sequences are aligned using the online multiple alignment tool provided by the NCBI Virus website. We also use the visual checking tool provided by the NCBI Virus website to check the quality of sequence alignments. In each of the geographic regions considered (China, the USA, Europe), the inclusion criteria for the sampling of the sequences are: (i) the sequence length >20,000 bp, and (ii) the collection date is before (and including) March 31, 2020. The sequences from China or the USA meeting the inclusion criteria are then randomly sampled to form the analysis samples of 50 sequences for the two regions; the sampling rates are around 72% (for China) and 5% (for the USA). Only 43 sequences from Europe in the NCBI database satisfy the inclusion criteria and all of them are included in our analysis sample for Europe. The reason we consider only sequences whose collection dates are before (including) March 31, 2020, is because after that date, China has few COVID-19 local cases, although there are still plenty of sequences for the other two regions (Europe and USA). Since it may be more meaningful to compare sequences from different regions within the same calendar-time frame, our analysis only includes sequences with collection date before (including) March 31, 2020, so that sufficient numbers of sequences can be obtained in the same calendar-time frame from each of the three regions. The other criterion we set for the sequences under analysis is sequence length: we select sequences >20,000 bp, which is a length we found to result in high-quality alignments of sequences. Although it may be possible to consider only complete sequences (about 30,000 bp), this will lead to a substantial reduction of sequence numbers for the three regions. Focusing on sequences with length>20,000 bp does achieve a good balance between sequence numbers and reliable sequence alignments.
Substitution Models
The simplest and most frequently used nucleotide substitution model may be the Jukes and Cantor one-parameter model.22 From Jukes and Cantor (1969), we have the number of substitutions per site
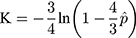
where  is the observed proportion of different nucleotides between the two sequences. An approximated estimator for the sampling variance is

where  is the length of the sequences.
In addition to the Jukes and Cantor one-parameter model, another frequently used model is Kimura two-parameter model.13 Let  and
and  be the observed proportions of transitional and transversional differences between the two sequences, respectively, where
  and
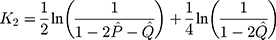
and  are the numbers of transitional and transversional differences between the two sequences. Then the number of nucleotide substitutions per site between the two sequences,
  , is estimated by
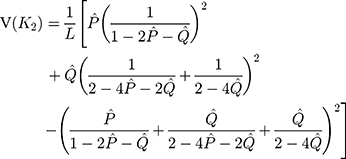
The sampling variance is approximately given by
Besides the most frequently used one-parameter and two-parameter models, there are many other substitution models including the F81 model, F84 model, and TN93 model and others.15–17 Tajima and Nei (1982) proposed a substitution number estimator for the F81 model, Tateno, Takezaki and Nei (1994) proposed a substitution number estimator and a variance estimator for the F84 model, and Tamura and Nei (1993) proposed a substitution number estimator and a variance estimator for the TN93 model.15–17 The substitution number estimator can be used as the distance between two nucleotide sequences. In addition, another distance, called Jaccard distance, has been successfully served as an effective tool for monitoring and tracking the epidemic of pathogenic SARS-CoV-2, and the Jaccard distance of SNP variants was adopted in the phylogenetic analysis of genomes.23
In this study, we use R codes to analyze the data. Different substitution models can be selected to calculate the distance between two sequences. The BiocManager, Biostrings, msa, seqinr, and ape packages are needed to be installed to run the R codes. The code dist.dna is used to calculate the pairwise distance between two sequences. 17 substitution models can be selected in the R code dist.dna to calculate the sequence distances, including raw, N, TS, TV, JC69, K80, F81, K81, F84, BH87, T92, TN93, GG95, logdet, paralin, indel, and indelblock. We include the distance formulas  and
and  for the one-parameter model (JC69) and the two-parameter model (K80) in this paper. The details of the other 15 models are referred to R ape package.24
Methods
The three sequence groups for China, Europe, and the USA include 50 samples, 43 samples, and 50 samples, respectively. The reason that we select this sample size near 50 is that there are only 43 samples for Europe in the NCBI database. To balance the data, we randomly select 50 samples for China and the USA.
The procedure of the analyzed method is as follows.
Step 1. Select a substitution model to calculate the pairwise distance between any two sequences in each group. As a result, there are 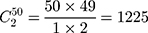 distances for China and the USA groups, and there are
 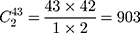 distances for the Europe group.
Step 2. Calculate the mean and standard deviation of the distances for the three groups. Compare the means and standard deviations of these three groups.
Step 3. To test whether the means of the three groups are equal, we apply the analysis of variance (ANOVA) to test it. To test whether the means of any two groups are equal, we use a t-test with pooled standard deviation to test it.
In this study, we use the “dist.dna” function of the “ape” package in R software to calculate the distances among aligned sequences. There are other softwares such as MEGA that can be used to calculate the distances. Although the other software may not provide all of the 17 substitution models discussed in this study, the most frequently used models such as the one-parameter and two-parameter models can be calculated in most related software. We provided R code and the IDs of the COVID-19 sequences for our sequence distance analysis in the Supplementary materials and the publicly accessible website https://reurl.cc/GrA5dd.
Results
We use 17 models to calculate the pairwise sequence distances of China, the USA, and Europe. The means and standard deviations of the three groups are shown in Table 1. The ANOVA shows that the means of the three groups are not equal with a p-value of less than 2.2e-16. Also, we use a t-test with a pooled standard deviation to test the pairwise means of the three groups. The pairwise means of the three groups also are significantly different with a p-value less than 2.2e-16. Among the 17 models, 14 models show a similar result. China has the smallest mean, followed by Europe and lastly by the USA. Only the 3 models “TV”, “logdet”, and “indelblock” have different results. In “TV” model, China has the smallest mean, followed by the USA and lastly by Europe; in “logdet” model, the USA has the smallest mean, followed by China and lastly by Europe; in “indelblock” model, Europe has the smallest mean, followed by China and lastly by the USA. We conclude that China has the smallest mean, followed by Europe and lastly by the USA based on most of the models.
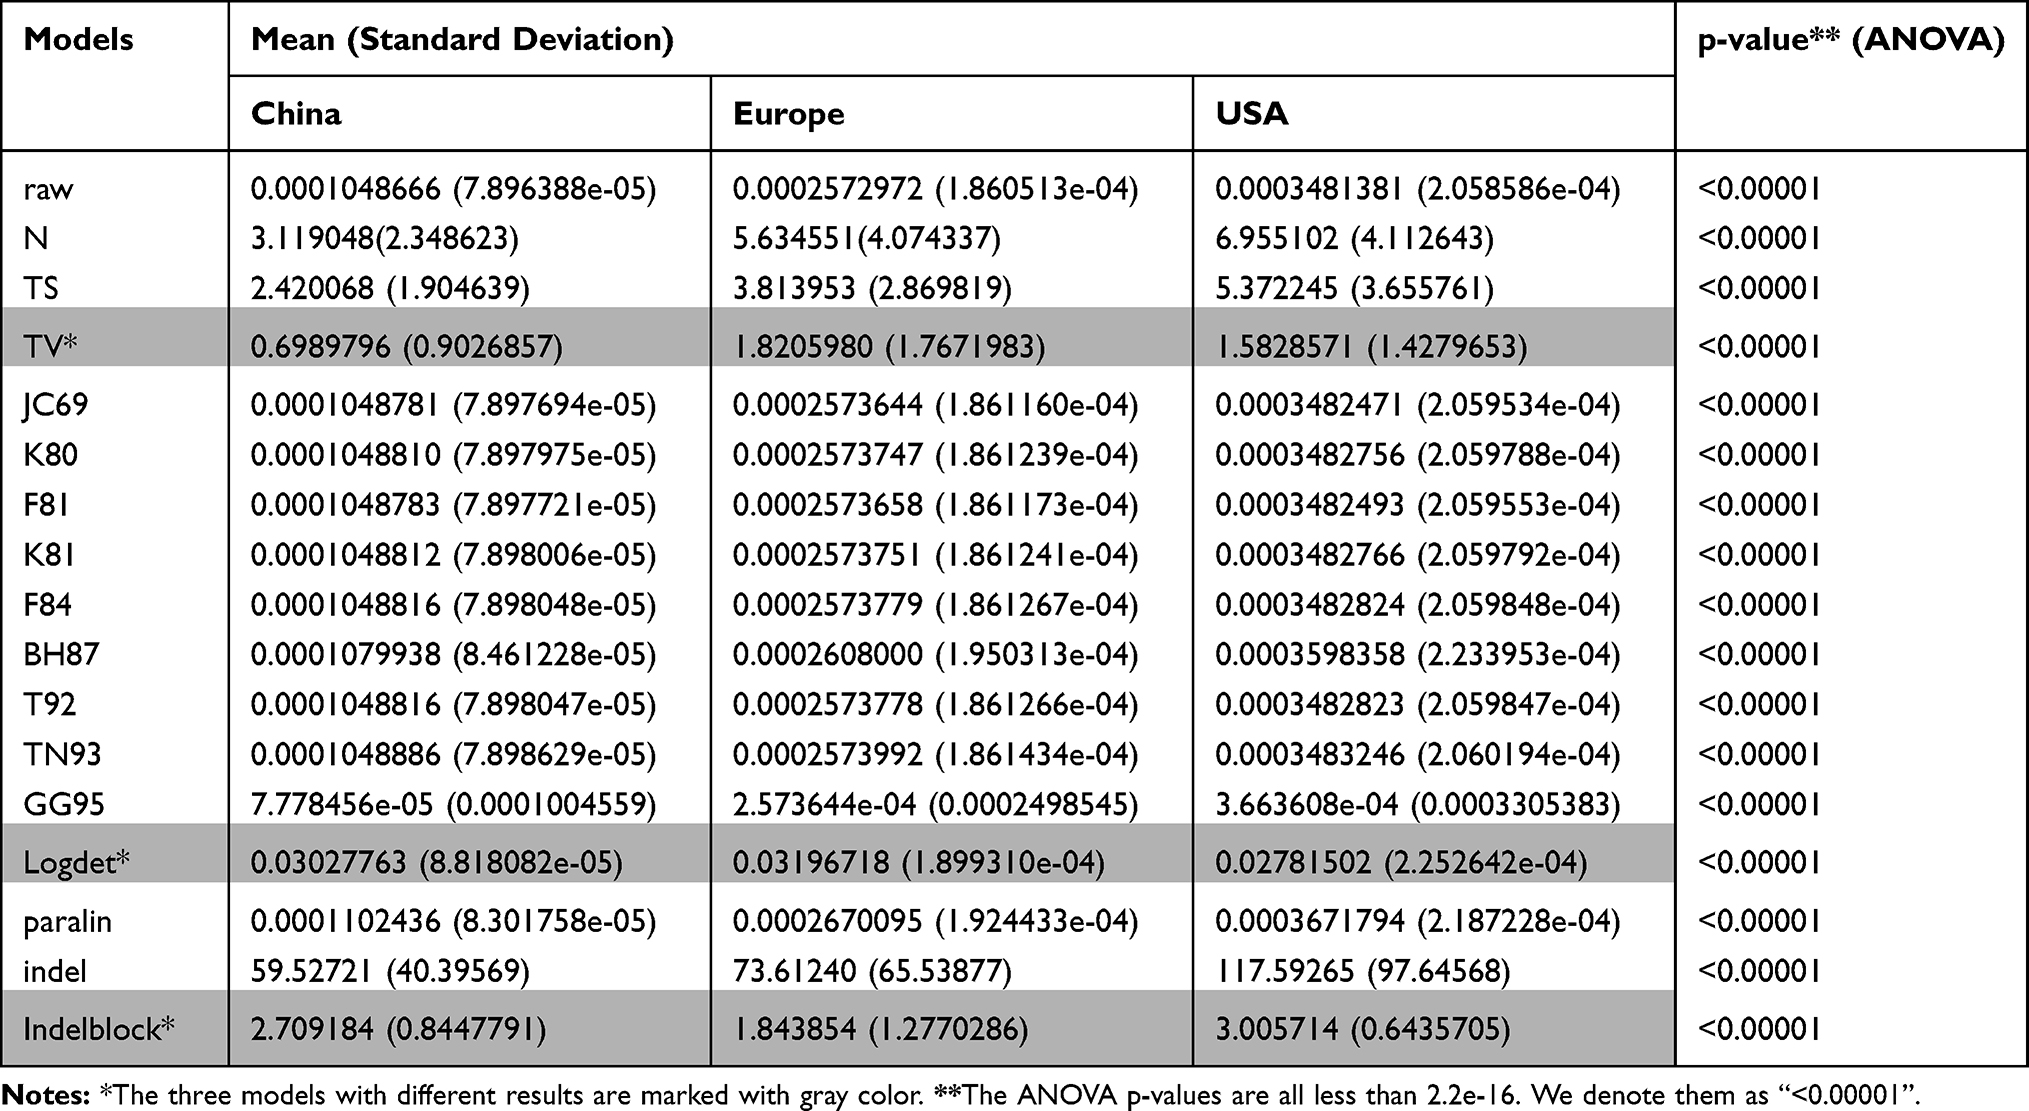 |
Table 1 The Means and Standard Deviations for China, Europe, and the USA |
The distance between two virus sequences can be used to estimate the number of substitutions (or measure the divergence degree) between two sequences. As a result, we use the mean of these distances, but not the variance, to estimate the divergence degree of sequences. In addition, since it is reasonable to assume that the virus sequences in the early stage are less diversifiable than those in the later stage, the sequence group with the smallest mean indicates the early origin of the virus.
The boxplots of the 4 models, “JC69”, “TV”, “logdet”, and “indelblock” are presented in (Figure 2A–D). The performances of the boxplots for the other 13 models are similar to “JC69” model. We present them in a supplementary file (Figures S1-S13). From (Figure 2A), China has the smallest mean, followed by Europe and lastly by the USA. Figure 2B shows that China has the smallest mean, followed by the USA and lastly by Europe. In Figure 2C, the USA has the smallest mean, followed by China and lastly by Europe. Figure 2D shows that Europe has the smallest mean.
 |
Figure 2 (A) The boxplot of “JC69” model, (B) the boxplot of “ TV” model, (C) the boxplot of “logdet” model, (D) the boxplot of “ indelblock” model. |
In this study, we apply 17 approaches to calculate pairwise distances between two sequences. Since these 17 approaches adopt different substitution models, they lead to different distances. Some substitution models infer that China has the smallest mean, and other models infer that the USA or EU has the smallest mean. Although different models lead to different results, 14 among the 17 models infer that China has the smallest mean. Thus, we based on most models to conclude that China sequences have the lowest diversity.
Discussions
SARS was reported in the early 2000s caused by severe acute respiratory syndrome coronavirus (SARS-CoV or SARS-CoV-1). Now COVID-19 caused by SARS-CoV-2 appears to be less severe than SARS but is more infectious than SARS. Generally, SARS-CoV-2 has high transmissibility and its clinical manifestations have more systematic symptoms and more severe radiological abnormalities than SARS.25 The origin of SARS-CoV-1 was believed to have originated from China. The first SARS was reported in November 2002 in the Guangdong province of southern China and has been linked to its wet markets. Bats have been identified as a natural reservoir for SARS-CoV-1.26
Compared to SARS-CoV-1, the origin of SARS-CoV-2 is more disputable. The virus was suspected to be made in a laboratory. However, analysis shows natural evolution evidence was supported by data on SARS-CoV-2’s backbone.8 Nevertheless, the virus is believed to have originated from Wuhan, China. Researchers believed that SARS-CoV-2 was most likely transmitted from bats to humans via an intermediary animal such as the pangolin. Recent research revealed that bats are the most possible host of the SARS-CoV-2 because this virus is 96% identical at the whole-genome level to a bat coronavirus.27 Since China is the country where the coronavirus outbreak began, it is reasonable to suppose that the China SARS-CoV-2 sequence sample should have a different performance compared with other areas. From our analysis, among the 17 substitution models, 14 models show that China samples have the smallest distance mean, followed by Europe and lastly by the USA. This distance mean order is consistent with the virus transmission time order that SARS-CoV-2 starts in China, then outbreaks in Europe, and finally in the USA. This fact reveals that the SARS-CoV-2 sequence has more mutations in the later stage than in the earlier stage. The magnitude of nucleotide substitution distance of SARS-CoV-2 is closely related to the transmission time order of SARS-CoV-2. This outcome reveals that the nucleotide substitution distance of SARS-CoV-2may be used to infer the origin of COVID-19.
Conclusions
The SARS-CoV-2 pandemic is not only a critical public health problem, but it also affects economic development that has led to serious unemployment. The global effect of SARS-CoV-2 has been far more than SARS-CoV-1. Fortunately, the plague has eased in many countries lately. Although many researchers devoted to the SARS-CoV-2 study, so far no effective SARS-CoV-2 vaccines have been developed. One of the reasons is the diversity of SARS-CoV-2 and close to 200 recurrent genetic mutations have been identified in the virus.3 In this study, we propose using substitution distance to infer the origin of COVID-19. Based on the samples from China, Europe, and the USA, our outcome shows that China samples have the smallest distance mean value, followed by Europe and lastly by the USA, which consists with the virus transmission time order that SARS-CoV-2 starts in China, then outbreaks in Europe and finally in the USA. This outcome reveals that the nucleotide substitution distance of SARS-CoV-2 may be used to infer the origin of COVID-19.
Data Sharing Statement
NCBI virus sequence database (https://www.ncbi.nlm.nih.gov/labs/virus/vssi/#/virus?SeqType_s=Nucleotide&VirusLineage_ss=Severe%20acute%20respiratory%20syndrome%20coronavirus%202,%20taxid:2697049).
Acknowledgments
This work was supported by the Ministry of Science and Technology 107-2118-M-009−002-MY2 and 106-2118-M-001-016-MY3, Taiwan.
Author Contributions
All authors made substantial contributions to conception and design, acquisition of data, or analysis and interpretation of data; took part in drafting the article or revising it critically for important intellectual content; agreed on the journal to which the article will be submitted; gave final approval of the version to be published; and agree to be accountable for all aspects of the work.
Disclosure
The authors declare no conflicts of interest for this work.
References
1. Zhu N, Zhang D, Wang W, et al. A Novel Coronavirus from Patients with Pneumonia in China, 2019. N Engl J Med. 2020;382(8):
2. Jin YH, Cai L, Cheng Z-S, et al. A rapid advice guideline for the diagnosis and treatment of 2019 novel coronavirus (2019-nCoV) infected pneumonia (standard version. Military Med Res. 2020;7(1):1. doi:10.1186/s40779-020-0233-6
3. van Dorp L, Acman M, Richard D, et al. Emergence of genomic diversity and recurrent mutations in SARS-CoV-2. J Infect Genetics Evolution. 2020;83:104351. doi:10.1016/j.meegid.2020.104351
4. Zhou P, Yang X-L, Wang X-G, et al. A pneumonia outbreak associated with a new coronavirus of probable bat origin. Nature. 2020;579(7798):
5. Hoffmann M, Kleine-Weber H, Schroeder S, et al. SARS-CoV-2 cell entry depends on ACE2 and TMPRSS2 and is blocked by a clinically proven protease inhibitor. Cell. 2020;181(2):271–280.e8. doi:10.1016/j.cell.2020.02.052
6. Wang N, Shi X, Jiang L, et al. Structure of MERS-CoV spike receptor-binding domain complexed with human receptor DPP4. Cell Res. 2013;23(8):
7. Lu L, Liu Q, Zhu Y, et al. Structure-based discovery of Middle East respiratory syndrome coronavirus fusion inhibitor. Nat Commun. 2014;5:
8. Andersen KG, et al. The proximal origin of SARS-CoV-2. Nat Med. 2020;26(4):
9. Felsenstein J. Evolutionary trees from DNA sequences: a maximum likelihood approach. J Mol Evol. 1981;17(6):
10. Felsenstein J. Distance Methods for Inferring Phylogenies: A Justification. Evolution. 1984;38(1):
11. Hasegawa M, Kishino H, Yano T. Dating of the human-ape splitting by a molecular clock of mitochondrial DNA. J Mol Evol. 1985;22(2):
12. Jukes T, Cantor C. Evolution of protein molecules. In: Munro HN, editor. Mammalian Protein Metabolism. New York: Academic Press; 1969:21–132.
13. Kimura M. A simple method for estimating evolutionary rates of base substitutions through comparative studies of nucleotide sequences. J Mol Evol. 1980;16(2):
14. Nei M, Kumar S. Molecular Evolution and Phylogenetics. Oxford university press; 2000.
15. Tajima F, Nei M. Biases of the estimates of DNA divergence obtained by the restriction enzyme technique. J Mol Evol. 1982;18(2):
16. Tamura K, Nei M. Estimation of the number of nucleotide substitutions in the control region of mitochondrial DNA in humans and chimpanzees. Mol Biol Evol. 1993;10(3):
17. Tateno Y, Takezaki N, Nei M. Relative efficiencies of the maximum-likelihood, neighbor-joining, and maximum-parsimony methods when substitution rate varies with site. Mol Biol Evol. 1994;11(2):
18. Wu F, et al. A new coronavirus associated with human respiratory disease in China. Nature. 2020;579(7798):
19. Su S, Wong G, Shi W, et al. Epidemiology, genetic recombination, and pathogenesis of coronaviruses. Trends Microbiol. 2016;24(6):
20. Li G, Fan Y, Lai Y, et al. Coronavirus infections and immune responses. J Med Virol. 2020;92(4):
21. Virology. Coronaviruses. Nature. 1968;220(5168):650. doi:10.1038/220650b0
22. Jukes TH, Cantor CR. Evolution of Protein Molecules. (Munro HN Ed.) Mammalian Protein Metabolism, III. New York: Academic Press; 1969:21–132.
23. Yin C. Genotyping coronavirus SARS-CoV-2: methods and implications. Genomics. 2020;112(5):
24. Paradis E, Schliep KJB. ape 5.0: an environment for modern phylogenetics and evolutionary analyses in R. J sci biotech. 2019;35(3):526–528.
25. Yuen K-S, Ye ZW, Fung S-Y, et al. SARS-CoV-2 and COVID-19: the most important research questions. Cell Biosci. 2020;10(1):
26. Wang L-F, Shi Z, Zhang S, et al. Review of bats and SARS. Emerg Infect Dis. 2006;12(12):
27. Perlman S. Another Decade, Another Coronavirus. N Eng J Med. 2020;382(8):760–762. doi:10.1056/NEJMe2001126
 © 2020 The Author(s). This work is published and licensed by Dove Medical Press Limited. The
full terms of this license are available at https://www.dovepress.com/terms
and incorporate the Creative Commons Attribution
- Non Commercial (unported, 3.0) License.
By accessing the work you hereby accept the Terms. Non-commercial uses of the work are permitted
without any further permission from Dove Medical Press Limited, provided the work is properly
attributed. For permission for commercial use of this work, please see paragraphs 4.2 and 5 of our Terms.
© 2020 The Author(s). This work is published and licensed by Dove Medical Press Limited. The
full terms of this license are available at https://www.dovepress.com/terms
and incorporate the Creative Commons Attribution
- Non Commercial (unported, 3.0) License.
By accessing the work you hereby accept the Terms. Non-commercial uses of the work are permitted
without any further permission from Dove Medical Press Limited, provided the work is properly
attributed. For permission for commercial use of this work, please see paragraphs 4.2 and 5 of our Terms.