Back to Journals » Journal of Inflammation Research » Volume 19
Exploring Centrosome Amplification-Associated Biomarkers in Osteoarthritis Through Bioinformatics and Experimental Approaches
Authors Nie S, Zhao P, Chen Z, Wu S, Li M ![]() , Lian C, Zhang H
, Lian C, Zhang H
Received 11 November 2025
Accepted for publication 26 January 2026
Published 4 February 2026 Volume 2026:19 576712
DOI https://doi.org/10.2147/JIR.S576712
Checked for plagiarism Yes
Review by Single anonymous peer review
Peer reviewer comments 2
Editor who approved publication: Dr Ujjwol Risal
Shixin Nie,1,* Pei Zhao,1,* Zhi Chen,1 Siyi Wu,2 Mingxuan Li,2 Chengjie Lian,1 Hua Zhang1
1Department of Orthopedics, Sports Injury Division, Fujian Medical University Union Hospital, Fuzhou, Fujian, People’s Republic of China; 2Fujian Medical University, Fuzhou, Fujian, People’s Republic of China
*These authors contributed equally to this work
Correspondence: Hua Zhang; Chengjie Lian, Email [email protected]; [email protected]
Purpose: This study aimed to identify centrosome amplification-related genes (CA-RGs) as potential biomarkers in osteoarthritis (OA).
Methods: Publicly available databases provided the transcriptome datasets for OA, while a well-established list of CA-related genes was obtained from published resources. A comprehensive computational biology strategy was implemented, integrating differential gene expression profiling, weighted gene co-expression network analysis (WGCNA), Mendelian randomization (MR) analysis, and ROC curve evaluation to screen for potential diagnostic markers. Following this, a predictive nomogram was developed, accompanied by gene set enrichment analysis (GSEA) and immune cell infiltration characterization utilizing the identified biomarkers. Additionally, single-cell RNA sequencing (scRNA-seq) datasets were examined to determine critical cell subpopulations and track biomarker expression patterns across different cell types. Ultimately, clinical specimen analysis through RT-qPCR was conducted to experimentally confirm the expression profiles of these biomarkers.
Results: PLK2 and SUN2 were identified as biomarkers. A nomogram model based on them demonstrated high predictive accuracy for OA. GSEA indicated both biomarkers were strongly correlated with lysosomal pathways. Immune infiltration analysis revealed significant differences in 16 immune cell types between OA and control groups. scRNA-seq analysis pinpointed two key cell clusters: preinflammatory chondrocytes (preInfC) and hypertrophic chondrocytes (HTC). Pseudotime trajectory analysis further uncovered dynamic expression patterns: PLK2 showed a sustained increase in HTC, while SUN2 displayed a dip then rise. In preInfC, PLK2 expression fluctuated (increase-decrease-increase), whereas SUN2 rose initially then declined.
Conclusion: This study identified 2 biomarkers associated with CA and explored their underlying mechanisms of action, providing new insights into potential therapeutic strategies for OA.
Keywords: osteoarthritis, centrosome amplification, Mendelian randomization analysis, biomarker, single-cell RNA analysis
Introduction
Osteoarthritis (OA) is a chronic degenerative joint disorder characterized by the classic triad of articular cartilage degeneration, synovial inflammation, and subchondral bone remodeling, plus degeneration of additional joint tissues. Meniscal degeneration induces joint instability and altered load distribution, while infrapatellar fat pad dysfunction regulates intra-articular inflammation and pain.1,2 It primarily manifests as joint pain, stiffness, and dysfunction, and is a leading cause of chronic pain, disability, and socioeconomic burden worldwide.3 By 2020, the global prevalence of osteoarthritis (OA) had reached 595 million cases. In China, amid the accelerating aging population, the number of OA patients is projected to surge to 250 million by 2050.4,5 Worldwide, aging demographics drive rising OA incidence, with weight-bearing joints such as the knee and hip most frequently affected.6 The core pathogenic mechanism of OA lies in the pro-inflammatory shift of cytokine homeostasis. This shift induces excessive secretion of matrix-degrading enzymes and inflammatory mediators, thereby triggering characteristic pathological changes such as cartilage wear, osteophyte formation, and synovitis.7 Chemokines exacerbate disease progression by recruiting inflammatory cells and amplifying pro-inflammatory cascades, creating a vicious cycle.7 Key mediators regulating this pathological process include matrix metalloproteinases (MMPs), interleukins, chemokine ligand (CCL) families, and tumor necrosis factor-alpha (TNF-α).7 Current OA diagnosis relies mainly on clinical symptoms and imaging techniques (eg, X-ray, MRI), but both lack sensitivity to early cartilage microstructural changes, hindering timely early-stage diagnosis. However, while clinical symptoms indicate early functional abnormalities, imaging techniques typically detect structural changes only in the middle to late stages, making early intervention challenging.8 Treatment strategies focus on symptomatic management, including nonsteroidal anti-inflammatory drugs, intra-articular injections, and end-stage joint replacement surgery, none of which can reverse or delay disease progression.9 Moreover, OA displays marked pathological heterogeneity.10 Making the identification of early-stage, disease-specific biomarkers associated with the pathological processes of OA critical for early diagnosis, predicting disease progression, and developing targeted therapies.11,12
The centrosome is a membrane-less organelle in eukaryotic cells, composed of a pair of centrioles and the surrounding pericentriolar material (PCM), serving as the microtubule-organizing center that regulates critical processes such as cell division, polarity, and migration.13 Centrosome amplification (CA) refers to the abnormal increase in centrosome number in a single cell, with mechanisms including centriole overduplication, failed cell division, or de novo centrosome assembly.14 CA disrupts mitotic fidelity, leading to multipolar spindle formation, chromosome missegregation, and genomic instability—key drivers of cellular dysfunction—thereby triggering apoptosis, senescence, or malignant transformation.15 Studies have shown that CA not only serves as a hallmark of cancer but also is associated with inflammatory diseases, metabolic disorders (eg, type 2 diabetes), and viral infections (eg, HPV, herpes simplex virus), suggesting its role in diverse pathological processes.13 While cell cycle dysregulation and genomic instability—common consequences of CA—are associated with chondrocyte senescence and OA progression, no systematic studies have established a causal relationship or mechanistic link between CA itself and the pathogenesis of OA. This knowledge gap motivates the present research.
Computational biology has become a powerful tool for discovering biomarkers in OA, aiding in the dissection of its complex molecular mechanisms and screening potential diagnostic markers and therapeutic targets. For instance, Wang et al aimed to address the lack of early diagnostic markers and therapeutic targets in OA, primarily by employing weighted gene co-expression network analysis (WGCNA) combined with machine learning to screen and validate core OA cartilage genes using three OA cartilage transcriptomic datasets from GEO (GSE1919, GSE32317, GSE5235).16 Existing research has mostly focused on classic pathways such as inflammatory responses, extracellular matrix remodeling, and oxidative stress. Related published studies have also indicated that extracellular matrix molecules in body fluids—such as de-iminated cartilage oligomeric matrix protein, fibrin-3 peptides, follistatin-like protein 1, and complement membrane attack complex components—may serve as potential OA biomarkers.17 However, no study has yet explored the value of CA, a key cellular process involved in cell-cycle dysregulation and tissue degeneration, for biomarker discovery in OA.
To investigate the causal relationship between CA-related genes and OA, this study employed Mendelian randomization (MR) analysis—a method that effectively mitigates confounding factors and reverse causality inherent in traditional observational studies, thereby providing more robust evidence for causal inference.15 Based on transcriptomic data, a series of bioinformatics analyses were used to identify biomarkers that were associated with CA and had a causal relationship with OA. Subsequently, the related molecular mechanisms were also investigated. Single-cell transcriptomic analysis investigated the expression of biomarkers during the process of cell differentiation. The core stages involved in the study are presented in the workflow diagram (Figure 1).
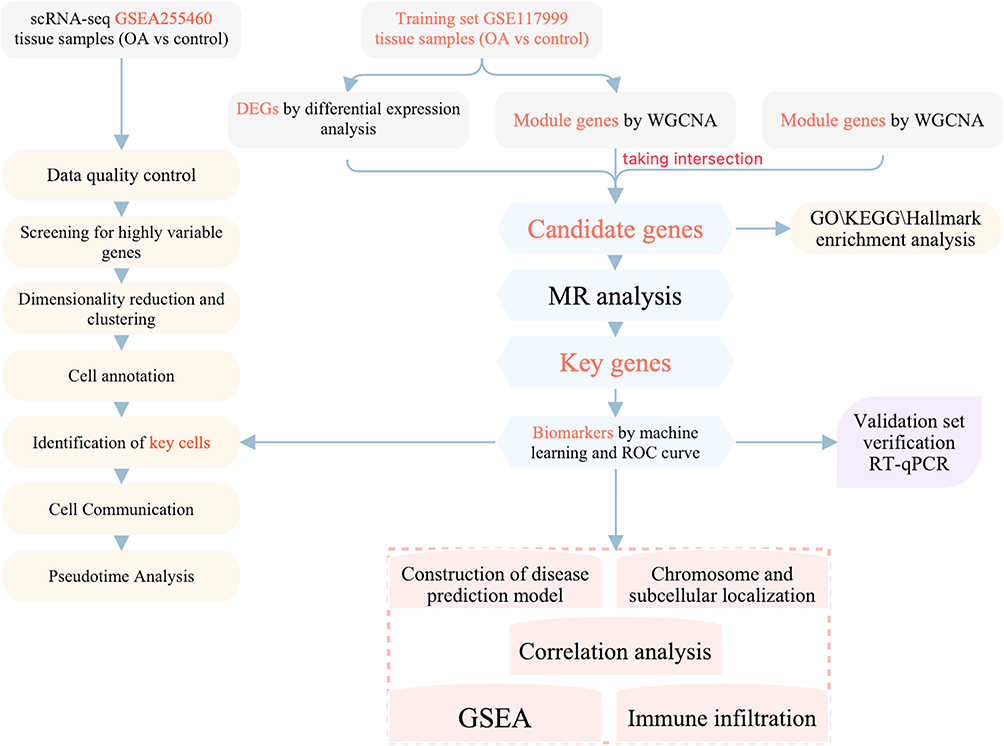 |
Figure 1 The flowchart of this study. |
Materials and Methods
Data Preparation
Articular cartilage was chosen as the target tissue, as it is the pathological core of OA. Relevant transcriptome data were obtained from Gene Expression Omnibus (GEO) (https://www.ncbi.nlm.nih.gov/geo/). GSE55235 (GPL96) was selected as a training set (10 OA and 10 controls, cartilage of knee joint),18 as well as GSE114007 (GPL18573) as a validation set (10 OA and 10 controls, cartilage of knee joint).19 In addition, GSE255460 (GPL24676) was a single cell dataset (8 OA and 3 controls, cartilage of the knee joint).20 Datasets were selected according to inclusion criteria that required cartilage tissue samples, clear grouping of OA and control samples, and standardized sample processing procedures. The 687 centrosome amplification-related genes (CA-RGs) were obtained through literature,21,22 integrating 367 CA-RGs from Denu and Burkard’s work (Table S1) and 417 CA-RGs from Liu et al’s study (Figure S1), with duplicate entries subsequently removed. The full list provided in Table S1.
The Integrative Epidemiology Unit (IEU) Open genome-wide association study (GWAS) database (https://gwas.mrcieu.ac.uk/) was utilized to acquire eQTL data and outcome variable (the outcome was OA). The “ebi-a-GCST005811” dataset included a sample size of 63,556 (12,658 cases and 50,898 controls), a number of single-nucleotide polymorphisms (SNPs) of 15,870,475, and a population of European descent.
Acquisition of Differentially Expressed Genes (DEGs)
DEGs were identified from the GSE55235 dataset by comparing OA samples with control samples through the “limma” package (v 3.54.0),23 applying selection criteria of |log2Fold Change (FC)| > 1 and adjusted p < 0.05. Visualization of DEG distribution was performed using “ggplot2” (v 3.4.1)24 to generate volcano plots. Expression patterns of the top 10 upregulated and downregulated DEGs were illustrated through heatmaps created with the “pheatmap” package (v 1.0.12).25
Weighted Gene Co-Expression Network Analysis (WGCNA)
To identify genes exhibiting strong associations with OA characteristics, WGCNA was conducted using the complete sample collection from the GSE55235 dataset. Firstly, the “GoodSamplesGenes” function was used to check whether there were outliers, and the outliers were eliminated. Then, a soft threshold was selected by R2 > 0.85 and mean connectivity = 0. Secondly, the gene co-expression network was constructed with the minimum number of module genes = 100 and the mergeCutHeight = 0.5. Finally, the module genes with the highest positive correlation to OA traits were chosen (|cor| > 0.3, p < 0.05). Within these modules, hub genes were further refined based on |module membership (MM)| > 0.4 and |gene significance (GS)| > 0.2.
Additionally, “VennDiagram” (v 1.7.3)26 was used to intersect DEGs, key module genes, and CA-RGs to obtain candidate genes.
Enrichment Analysis of Candidate Genes
The “clusterProfiler” (v 4.7.1.003) (p < 0.05)27 was employed to investigate Gene Ontology (GO) and Kyoto Encyclopedia of Genes and Genomes (KEGG) pathways of candidate genes to identify relevant biological pathways. The GO enrichment revealed the leading three functional categories for each component.
MR Analysis
To assess causality between target genes (exposures) and OA (outcome), we performed MR analysis utilizing the TwoSampleMR package (v 0.5.6).28 This study adheres to the Strengthening the Reporting of Observational Studies in Epidemiology - Molecular Epidemiology (STROBE-MR) guidelines to ensure transparency and completeness of reporting.29 Initially, the VariantAnnotation package (v 1.44.0)30 and ieugwasr package (v 0.1.5) (https://github.com/MRCIEU/ieugwasr) were applied to extract exposure data and identify instrumental variables (IVs). Genome-wide significant IVs associated with exposures were retained using p < 5×10⁻⁷. To eliminate linkage disequilibrium (LD), IVs were pruned with parameters r2 = 0.001, distance = 100 kb, and clumping enabled. SNPs with ≥3 IVs were retained for downstream analysis, and F-statistics were computed (threshold: F > 10). Subsequently, effect allele harmonization and effect size alignment were performed using the harmonise_data function from TwoSampleMR (v 0.5.6). MR estimation was executed via the mr function incorporating five methodologies (MR-Egger,31 Weighted median,32 Inverse variance weighted (IVW),33 Simple mode,34 and Weighted mode)35 (p < 0.05). Among them, an odds ratio (OR) > 1 indicates that the gene SNP will increase the risk of OA, or less than 1, indicating that the gene SNP will reduce the risk of OA. Subsequently, the causal relationship was demonstrated by scatter plots, forest plots and funnel plots.
To determine whether the analysis results were reliable, a variety of tests were used for sensitivity analysis, which included heterogeneity test (p > 0.05), horizontal pleiotropy test (p > 0.05), and one-by-one rejection test.
To assess if the causal relationship between exposures and outcomes remained accurate and reliable, the Steiger test was conducted using the “steiger_filtering” function. Finally, the candidate genes with the same up/down trend and effect on OA in MR analysis were selected as the key genes.
Construction of Protein-Protein Interaction (PPI) and GeneMANIA Networks
Key genes were initially inputted into the STRING platform (http://www.string-db.org/) using a confidence cutoff of 0.15 to generate the protein-protein interaction network, with visualization performed through Cytoscape software (v 3.9.1).36 Following this, GeneMANIA (http://www.genemania.org/) was utilized to identify functionally related genes and involved biological pathways.
Receiver Operating Characteristics (ROC) Curves and Expression Level Verification
The pROC package (v 1.18.0)37 was applied to generate ROC curves across all specimens from GSE55235 and GSE114007, retaining markers with Area Under the Curve (AUC) exceeding 0.7. Inter-group expression differences of key genes in both datasets were assessed using the Wilcoxon test through rstatix (v 0.7.2) (https://cran.r-project.org/package=rstatix) (significance threshold < 0.05). Genes demonstrating statistically significant differences and concordant expression patterns were designated as biomarkers.
Construction of Nomogram Model
To evaluate the diagnostic utility of biomarkers in OA, a nomogram incorporating these biomarkers was constructed using the rms package (v 6.5.0).38 Model performance was then validated through calibration curves generated by rms (v 6.5.0) (Hosmer-Lemeshow test, p > 0.05) and decision curve analysis performed with ggDCA (v 1.2)39 to evaluate predictive accuracy.
Chromosomal Localization, Subcellular Localization, and Protein Expression Analysis
In order to explore the location of biomarkers on human chromosomes, “OmicCircos” (v 1.36.0)40 was used. Additionally, the intracellular distribution of biomarkers was analyzed through the mRNALocater database (http://bio-bigdatacn/mRNALocater). Moreover, tissue-specific expression patterns of biomarkers were examined using the HPA database (https://www.proteinatlas.org/).
Gene Set Enrichment Analysis (GSEA) of Biomarkers
To identify cellular pathways involving biomarkers, Gene Set Enrichment Analysis was executed on the GSE55235 dataset. The “c2.cp.kegg.v7.4.symbols.gmt” reference set was obtained from MSigDB (https://www.gsea-msigdb.org/gsea/msigdb). Spearman correlation analysis between each biomarker and all other genes was performed using psych (version 2.1.6).41 Based on correlation coefficients ranked in descending order, GSEA was implemented via clusterProfiler (version 4.7.1.003)27 (p < 0.05, |NES|>1), displaying the leading 10 pathways.
Immune Infiltration Analysis
We utilized the ssGSEA method through “GSVA” (v 1.46.0)42 to quantify the presence of 28 distinct immune cell subsets across all GSE55235 specimens. Subsequently, immune cell populations showing significant variations between OA patients and healthy controls were determined using the Wilcoxon rank-sum approach via “rstatix” (v 0.7.2) with a significance threshold of p < 0.05. The relationship between identified biomarkers and differentially abundant immune cells was assessed through Spearman correlation analysis using “psych” (v 2.1.6) package, applying criteria of |correlation coefficient| > 0.3 and p < 0.05 across the entire GSE55235 cohort.
Single-Cell RNA Sequencing (scRNA-Seq) Analysis
To validate the precision and dependability of OA scRNA-seq cellular information, we performed comprehensive analyses using “Seurat” (v 4.1.0)43 on the GSE255460 dataset. Quality control measures excluded genes detected in fewer than three cells, substandard cells containing less than 200 genes, and cells exhibiting mitochondrial content exceeding 10%. Data normalization was executed through the NormalizeData function with a scaling factor of 10,000. We identified the 3,000 most variable genes using “FindVariableFeatures” and displayed the outcomes via LabelPoints function. Additional normalization was performed using the Scale Data function. Principal component analysis was applied to these highly variable genes, with dimensionality reduction outcomes displayed through Elbowplot visualization. Based on Jackstraw permutation testing, we identified and re-clustered the 20 statistically meaningful principal components (p < 0.05). These 20 PCs underwent UMAP-based analysis to generate comprehensive clustering patterns.
Cell Annotation and Key Cell Screening
The Findallmarker function was used to identify maker genes in each cell cluster, cells were annotated into different cell types based on the marker genes that have been reported in the literature.44–46 The FindAllMarkers function was used to detect DEGs in all cell cluster types (“test.use = wilcox”). And Benjamini-Hochberg method was used to estimate the error discovery rate, threshold log2FC ≥ 1.0, and p < 0.05 as default parameters to obtain DEGs, and the heat map was visualized. Finally, GO analysis of DEGs by “cluster Profiler” (v 4.7.1.003).27
The UAMP map was drawn by “UAMP” to show the distribution of biomarkers in OA samples. Subsequently, “rstatix” (v 0.7.2) was used to compare the distribution proportion differences in cell types between OA and control groups. Finally, the differential cell types with biomarker expression number ≥ 2 and containing the highest biomarker expression were defined as key cell types.
Cell Communication and Quasi-Time Series Analysis of Key Cell Clusters
Initially, we employed “CellChat” (V 1.6.1)47 to investigate intercellular communication networks within the GSE255460 dataset. To elucidate temporal variations in biomarker expression throughout cellular differentiation processes in GSE255460, we conducted pseudotemporal trajectory analysis of crucial cell clusters utilizing “Monocle2” (v 2.22.0).48 Gene expression dynamics during the differentiation of these pivotal cell populations were examined through the DifferentialGeneTest function.
Reverse Transcription-Quantitative Polymerase Chain Reaction (RT-qPCR) Assay
Five matched tissue specimen pairs were collected from our institution, comprising five OA cases and five healthy controls (Table S2). The OA samples (Inclusion criteria: ① Patients diagnosed with severe primary knee osteoarthritis confirmed by clinical and imaging assessments according to the guideline criteria,49 and scheduled to undergo knee arthroplasty; ② Age > 50 years, regardless of gender; ③ Signed informed consent. Exclusion criteria:① Secondary osteoarthritis or other inflammatory joint diseases, such as rheumatoid arthritis, psoriatic arthritis, gouty arthritis;② Major systemic disorders, such as active malignancies, uncontrolled diabetes;③ Recent relevant interventions, including intra-articular injections—corticosteroids, hyaluronic acid, platelet-rich plasma—within 3 months prior to surgery, or systemic use of corticosteroids or other immunosuppressants within the preceding 6 months) were obtained from patients with end-stage osteoarthritis during total knee arthroplasty, cartilage was harvested from the severely damaged regions of femoral or tibial condyles immediately after surgical resection in the operating room. For normal controls, cartilage was collected from macroscopically intact areas of the knee joints of healthy donors through our hospital’s Organ Procurement Organization (OPO—a specialized medical organization dedicated to clinical organ donation and procurement, primarily responsible for the evaluation, retrieval, preservation, and transportation of donated organs. In this study, all normal clinical samples were provided by this organization in accordance with standardized protocols.), with all procedures conducted under appropriate ethical oversight. Immediately after resection, tissues were placed in culture medium on ice, and transported to the laboratory within one hour. In the lab, all samples were stored at −80°C until analysis. All subjects provided written informed consent, and the study received ethical clearance from our hospital’s Research Ethics Committee (approval no: 2025KY616). Total RNA isolation was performed using TRIzol reagent (Ambion, USA), followed by quantification with NanoPhotometer N50. Complementary DNA synthesis was achieved through reverse transcription of mRNA using the SweScript First Strand cDNA synthesis kit (Yeasen, Wuhan, China). RT-qPCR reaction mixtures contained 3 µL cDNA template, 5 µL 2x Universal Blue SYBR Green qPCR Master Mix, and 1 µL each of forward and reverse primers (both at 10 µM concentration). Primer sequence details are provided in Table S3. Thermal cycling parameters included: pre-denaturation at 95°C for 60 seconds, followed by 40 cycles of denaturation (95°C, 20 seconds), annealing (55°C, 20 seconds), and extension (72°C, 30 seconds). Expression data were analyzed via the 2−ΔΔCt methodology with GAPDH as the normalization control. Statistical comparison between OA and control cohorts was performed using Student’s t-test with significance set at P < 0.05.
Statistical Analysis
The analysis results were all conducted in the R software (v 4.2.2). Wilcoxon test and t test compared data from different groups (p-value < 0.05).
Results
Acquisition of Candidate Genes
The 1,573 DEGs (947 up-regulated and 626 down-regulated) were obtained in the OA group (Figure 2A). The expression heatmap of the top 10 up- and down-regulated DEGs is shown in Figure 2B. Besides, in the GSE55235, there were no outliers (Figure 2C). Subsequently, by setting R2 > 0.85, the threshold of β was determined as 8 (Figure 2D). Next, 11 co-expression modules were identified (Figure 2E). Finally, turquoise (3,333 gens, p = 4 × 10−08, cor = 0.91) and yellow modules (1,701 gens, p = 3 × 10⁻¹⁰, cor = −0.95) were optioned as key modules (Figure 2F). Finally, 3,745 key module genes were obtained (Figure 2G). By intersection, aimed to identify genes with dual characteristics: dysregulated in OA and CA-associated in literature, 44 candidate genes were acquired (Figure 2H). These 44 genes are high-confidence candidates involved in both OA pathology and CA processes, serving as the starting point for subsequent MR analysis to screen causal genes and achieve a logical progression from association to causality.
 |
Figure 2 Identification of candidate genes associated with CA in OA. (A) Volcano plot of DEGs between OA and control groups. (B) Heatmap of the top 10 up- and down-regulated DEGs. (C) Sample clustering tree showing no outliers. (D) Scale-free network analysis for WGCNA. (E) Module identification via WGCNA. (F) Module-trait relationships. (G) Scatter plot of GS vs MM. (H) Venn diagram showing the intersection of CA-RGs, DEGs, and key module genes. |
Functional Enrichment Analysis of 44 Candidate Genes
Firstly, GO functions were enriched to 639 biological processes (BP) such as meiotic cell cycle, 63 cell components (CC) such as chromosomal region, and 46 molecular functions (MF) such as tubulin binding (Figure 3A and Table S4). Secondly, KEGG pathways were significantly enriched to 5 related pathways, including cellular senescence, cell cycle, etc (Figure 3B).
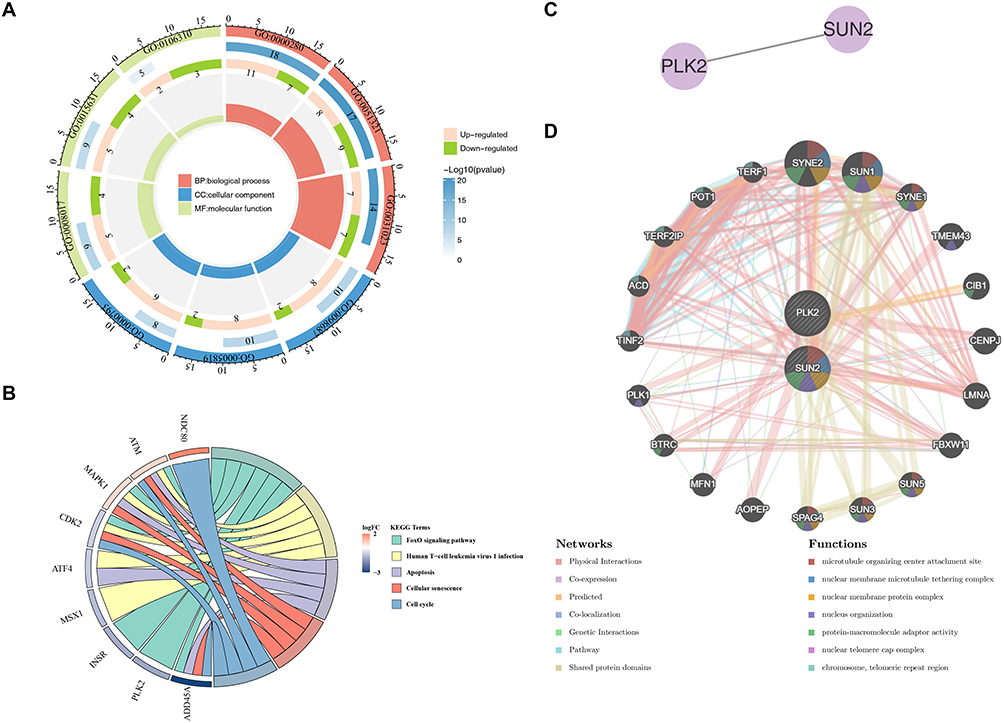 |
Figure 3 Functional enrichment and interaction networks of candidate genes. (A) GO enrichment analysis of 44 candidate genes. (B) KEGG pathway enrichment analysis. (C) PPI network of PLK2 and SUN2. (D) GeneMANIA network showing functional associations of PLK2 and SUN2. |
MR Analysis to Obtain Key Genes
For MR analysis of the 44 candidate genes, we first retrieved their cis-expression quantitative trait loci (cis-eQTLs) as potential instrumental variables (IVs) from the IEU OpenGWAS database. We extracted SNPs genome-wide significantly associated with each gene’s expression (p < 5 × 10⁻⁷), then performed clumping (r2 < 0.001, distance > 1000 kb) to eliminate linkage disequilibrium and ensure SNP independence. Only genes with ≥ 3 independent SNPs post-clumping were retained for robust estimation. We also calculated the F-statistic for each SNP; all selected SNPs had an F-statistic > 10, excluding weak instrument bias. This multi-step filtering yielded 50 qualified SNPs across the candidate genes as final IVs for MR analysis, and their F statistics are shown in Table S5. In the MR analysis, 6 candidate genes were identified to have a causal association with OA (Table 1), namely CCNL1 (OR: 1.073606, 95% CI: 1.037710–1.110743, p = 0.0000425), CEP57 (OR: 0.933386, 95% CI: 0.891839–0.976867, p = 0.003003), PLK2 (OR: 0.810091, 95% CI: 0.674474–0.972974, p = 0.024253), SMC4 (OR: 0.867794, 95% CI: 0.817122–0.921606, p = 0.00000385), SUN2 (OR: 0.952835, 95% CI: 0.924685–0.981841, p = 0.00159), and UVRAG (OR: 1.122753, 95% CI: 1.047284–1.203659, p = 0.001109). Specifically, the SUN2, SMC4, PLK2, and CEP57 exhibited an OR < 1, indicating their protective effect against OA, whereas, CCNL1 and UVRAG showed an OR > 1, indicating they increase OA risk. Consistently, correlation analysis (Figure S1A) and forest plot results (Figure S1B) verified this trend: the four protective genes presented a negative correlation with OA risk and a global effect size < 0, while the two risk genes showed a positive correlation and a global effect size > 0. Finally, the funnel plot showed that the SNPs of each gene were roughly evenly distributed, indicating that Mendel’s second law was followed (Figure S1C).
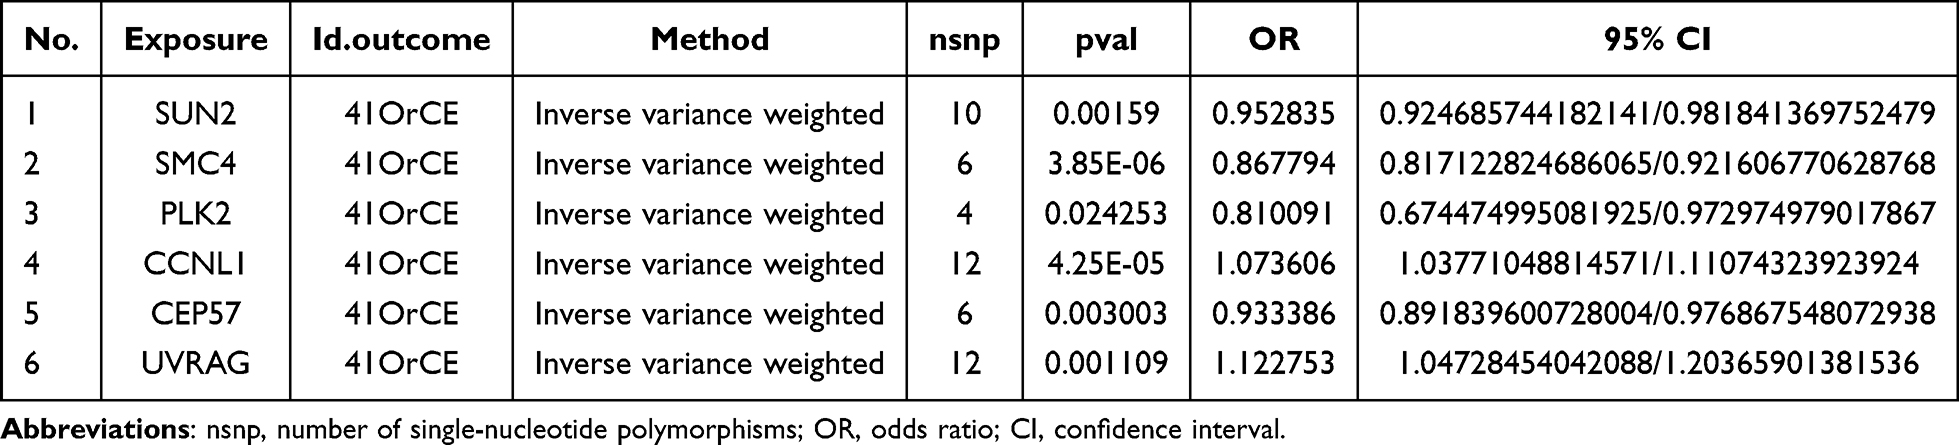 |
Table 1 Results of MR Analysis of Candidate Genes |
Next, the reliability of the MR analysis results was judged by sensitivity analysis. The results showed that no heterogeneity (p-value > 0.05) and no confounding factors (p-value > 0.05) in the 6 candidate genes, which proved the reliability (Tables 2 and 3). In addition, the one-by-one elimination LOO test results showed that each SNP was gradually eliminated, and the influence of the leftover SNP on the outcome variables did not change much, indicating that the MR analysis results were reliable and stable (Figure S1D).
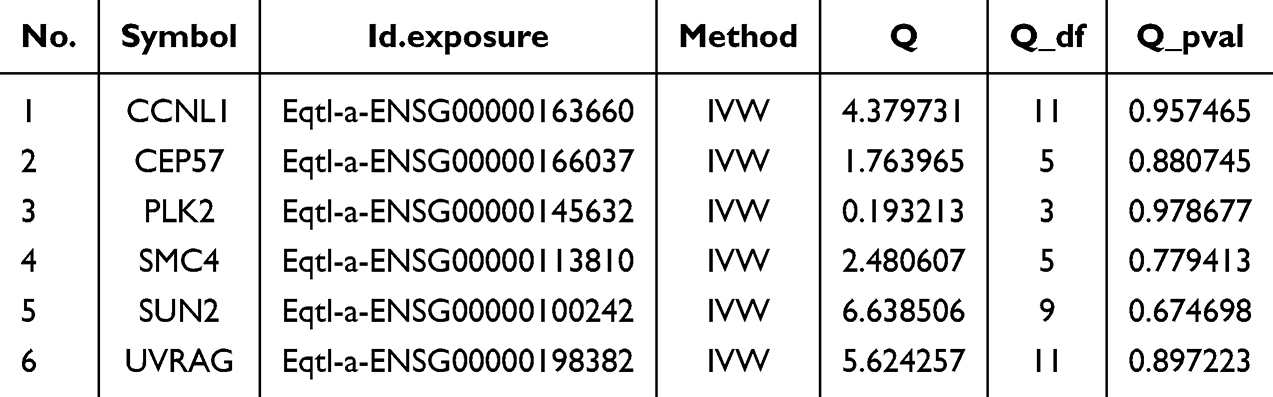 |
Table 2 Heterogeneity Test |
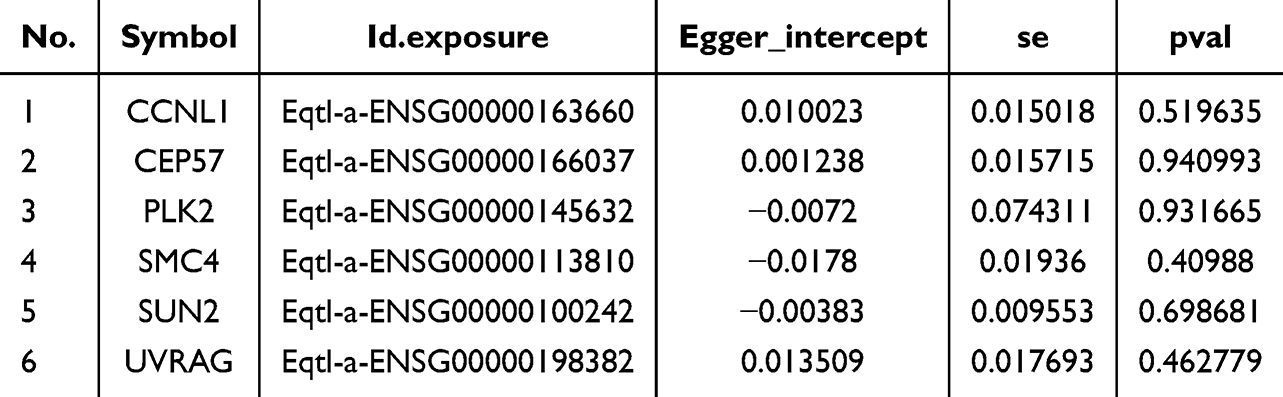 |
Table 3 Horizontal Pleiotropy Test |
The Steiger test showed that the Steiger-direction results of the 6 candidate genes were all TRUE, and the p-value was significant, indicating that the causal connection among the 6 exposure factors and the outcome was correct (Table 4).
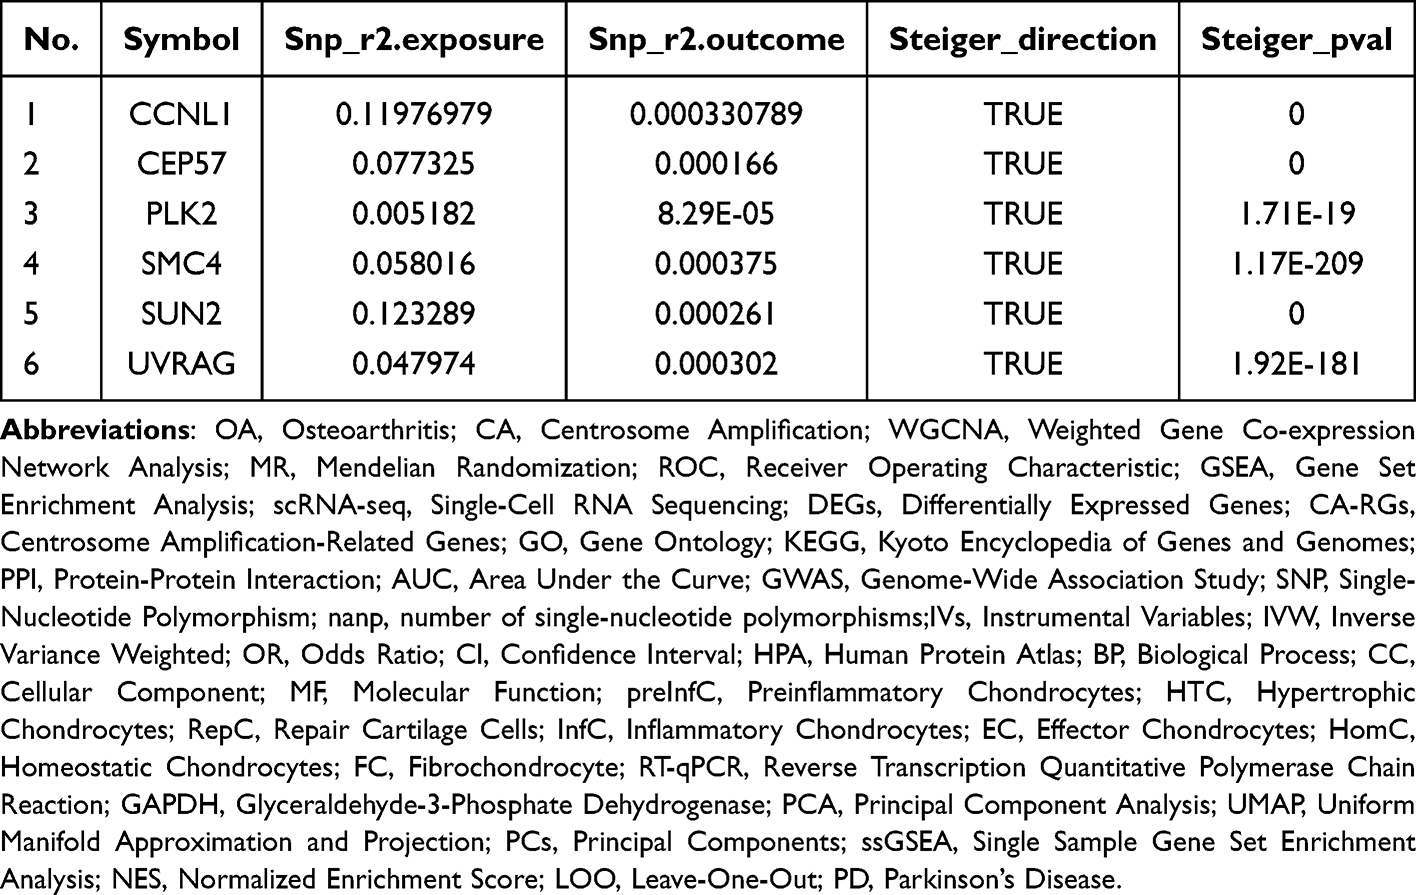 |
Table 4 Steiger Test |
Finally, PLK2 and SUN2 - both of which were down-regulated in OA and identified as protective factors (OR < 1) from our CA-related gene pool - were selected as the key CA-associated candidate genes for further investigation into OA pathogenesis.
Construction of PPI and GeneMANIA Network for Two Key Genes
The PPI network results indicated that there was a protein interaction between PLK2 and SUN2 (Figure 3C). The GeneMANIA network predicted that two key genes and 20 genes related to the function of key genes were mainly enriched in the microtubule-organizing center attachment site, etc. (Figure 3D).
Acquisition of Biomarkers
PLK2 and SUN2 were analyzed by ROC. In training and validation datasets, the AUC values of PLK2 and SUN2 were > 0.7, indicating a good diagnostic performance (Figure 4A). Then, the expression levels of the key genes showed that they were remarkably lower expressed in the OA group in both datasets (Figure 4B). Therefore, PLK2 and SUN2 were used as biomarker.
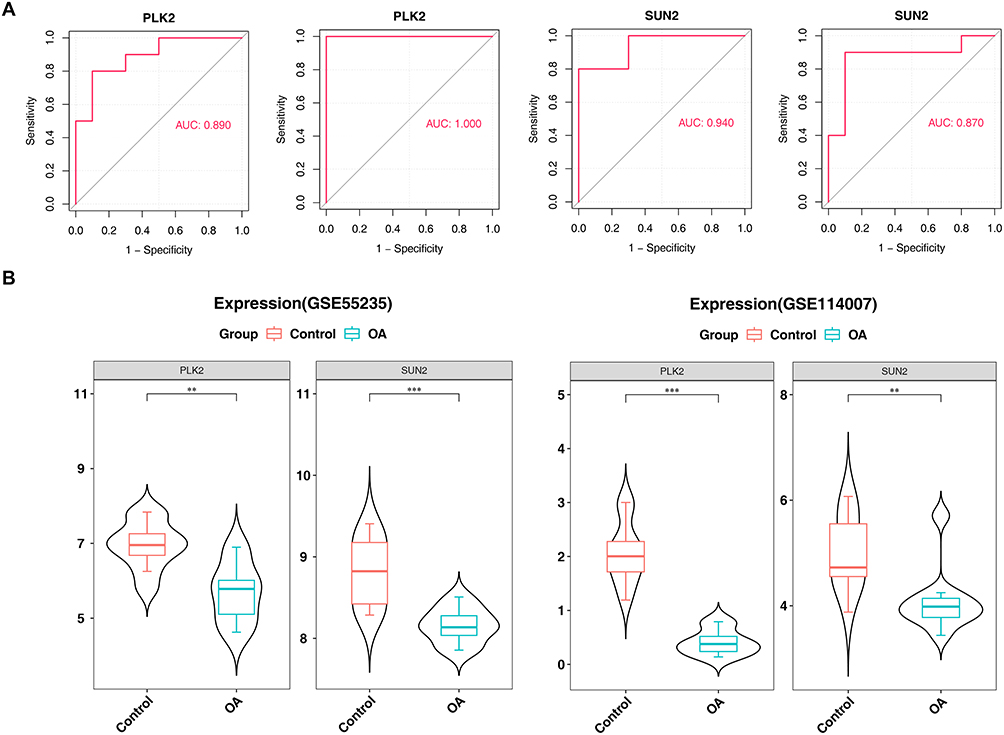 |
Figure 4 ROC Curves and Expression Comparison of PLK2 and SUN2 Between OA and Control Groups. (A) ROC curves of PLK2 and SUN2 in training and validation sets. (B) Expression levels of PLK2 and SUN2 in OA and control groups (Data are shown as mean ± SD. *p < 0.05, **p < 0.01, ***p < 0.001, ****p < 0.0001 vs control group). |
Predictive Value of Two Biomarkers in OA
First, the nomogram constructed based on biomarkers showed that the higher the biomarker score, the higher the prevalence (Figure 5A). Second, the slope of the calibration curve was close to 1 and p = 0.192, showing that the precision of the model prediction was better (Figure 5B). Subsequently, the net benefit of a nomogram was greater than that of a single biomarker (Figure 5C). This indicated that the model had a better measurement result, and overall prediction effect of the nomogram was higher than that of a single variable.
 |
Figure 5 Predictive model and genomic localization of biomarkers. (A) Nomogram for OA prediction based on PLK2 and SUN2. (B) Calibration curve of the nomogram. (C) Decision curve analysis (DCA) of the nomogram. |
Immune Infiltration Analysis of PLK2 and SUN2
Immune infiltration analysis was conducted to investigate the associations between PLK2/SUN2 expression levels and specific immune cell populations in OA cartilage tissues, based on the established link between immune infiltration and OA progression. Initially, Figure 6A illustrated the infiltration patterns of 28 immune cell types within OA and control cohorts. Subsequently, significant variations were observed in 16 immune cell populations between OA and control cohorts, including activated B cell and central memory CD4 T cell (Figure 6B). Finally, correlations between biomarkers and significantly altered immune cell populations were examined (Figure 6C). Analysis revealed that PLK2 demonstrated the strongest negative correlation with central memory CD4 T cell (0.5 < |r| < 0.7, p < 0.001) while exhibiting the most robust positive association with type 2 T helper (Th2) cell (0.5 < r < 0.7, p < 0.001). PLK2 also showed a significant positive correlation with eosinophils (0.5 < r < 0.7, p < 0.05). SUN2 displayed the strongest negative correlation with effector memory CD4 T cell (0.5 < |r| < 0.7, p < 0.001), and the most prominent positive correlation with eosinophil (0.5 < r < 0.7, p < 0.05).
 |
Figure 6 Functional and immune infiltration analysis of biomarkers (A) Stacked bar plot of immune cell infiltration in OA and control groups. (B) Differential immune cell infiltration between groups. (C) Correlation heatmap between biomarkers and differential immune cells. |
Single-Cell RNA-Seq Data Processing: Identification of Highly Variable Genes and Cell Types
To characterize the molecular features of OA cartilage tissues at the single-cell resolution, we first processed the publicly available single-cell RNA sequencing (scRNA-seq) dataset (GSE255460). Through quality control of GSE255460 data and removal of low-quality cells, a total of 43,036 cells and 33,333 genes were obtained (Figure 7A). Subsequently, the GSE255460 dataset was standardized, and the top 3,000 highly variable genes in the core cells were screened out (Figure 7B). PCA was performed on highly variable genes, and top 50 PCs were selected (Figure 7C). In addition, the top 20 PCs were cluster analyzed, and the cells were divided into 15 clusters (Figure 7D).
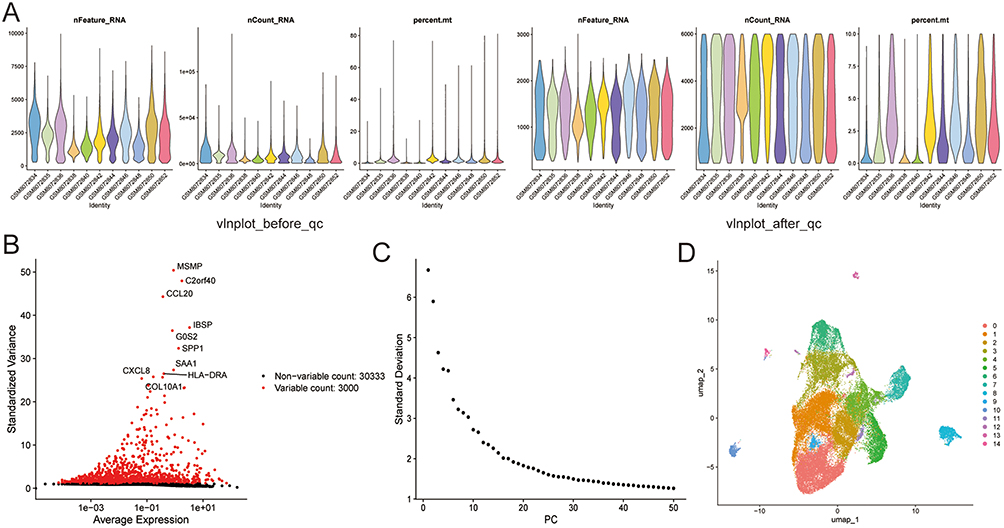 |
Figure 7 Single-cell RNA sequencing data processing. (A) Quality control and cell filtering. (B) Identification of highly variable genes. (C) PCA analysis of highly variable genes. (D) UMAP visualization of cell clusters. |
DEGs in Differential Cell Types and Enrichment Analysis
Firstly, 11 cell types were annotated according to the expression of the marker genes, including preinflammatory chondrocytes (preInfC) (IFI27, IFI16), fibrochondrocyte (FC) (HES1, TPM1), etc. (Figure 8A). Among them, consistent with the original study, the OA group accounted for the highest percentage of hypertrophic chondrocytes (HTC) and repair cartilage cells (RepC), and the effector chondrocyte (EC) and homeostatic chondrocyte (HomC) had a high percentage in the control group (Figure 8B). This further confirms that there is a transformation of cell populations toward hypertrophic and repair phenotypes in OA cartilage. In addition, the proportion of different cells in each sample was also shown. (Figure S2). The DEGs in different cell types were obtained by screening in Figure 8C. Subsequently, GO enrichment analysis showed that regulation of cell-cell adhesion was remarkably gathering in the BP, focal adhesion was significantly enriched in the CC, and cadherin binding was remarkably gathering in the MF (Figure 8D and Table S6).
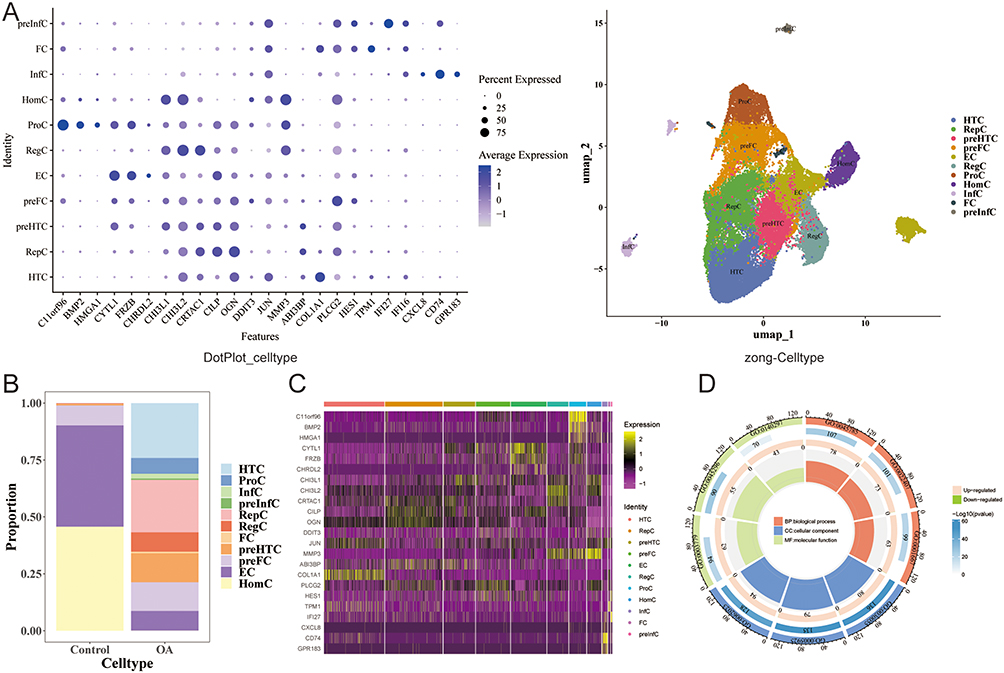 |
Figure 8 Cell type annotation and differential expression analysis. (A) Bubble plot of marker genes for cell type identification. (B) Proportion of cell types in OA and control groups. (C) Heatmap of DEGs across cell types. (D) GO enrichment analysis of cell-type-specific DEGs. |
Analysis of Key Cell Clusters
First, both PLK2 and SUN2 were distributed in OA samples, and SUN2 was more widely distributed in OA samples (Figure 9A). Second, there were significant differences in HTC, preInfC, RepC, and Inflammatory chondrocyte (InfC) cells among the OA and control groups (Figure 9B). In addition, HTC and preInfC cells existed two biomarkers’s expression in cells and have the highest expression levels, which is regarded as a key cell cluster (Figure 9C).
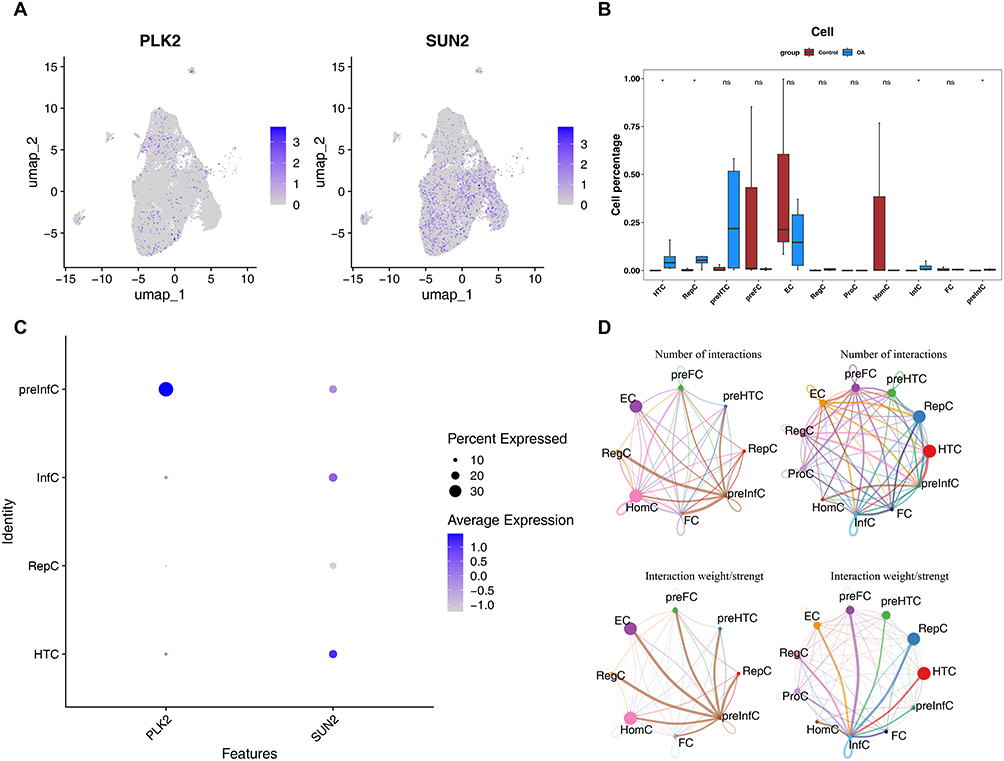 |
Figure 9 Key cell cluster analysis (A) UMAP showing distribution of PLK2 and SUN2 in OA samples. (B) Differential cell type proportions between OA and control groups. (C) Expression levels of biomarkers in key cell clusters. (D) Cell-cell communication network in OA and control samples. |
The results of cell interaction network diagram showed that HTC and RepC had the most interactions with other cells in OA samples, and there was strong communication relationship between HTC and preInfC. HomC and EC had the most communication interactions with other cells in the control samples, with preInfC and other cells having the strongest communication interactions (Figure 9D).
Finally, the pseudo-time of key cell clusters was analyzed. According to the results, preInfC was differentiation into different branches successively from the developmental starting position, with 7 different developmental stages and multiple cell clusters at different stages (Figure 10A). At the same time, PLK2 showed a trend of first increasing, then decreasing and then increasing in pseudo-time trajectory sequence of preInfC, and SUN2 first had an increasing trend and then decreased in pseudo-time trajectory sequence (Figure 10B).
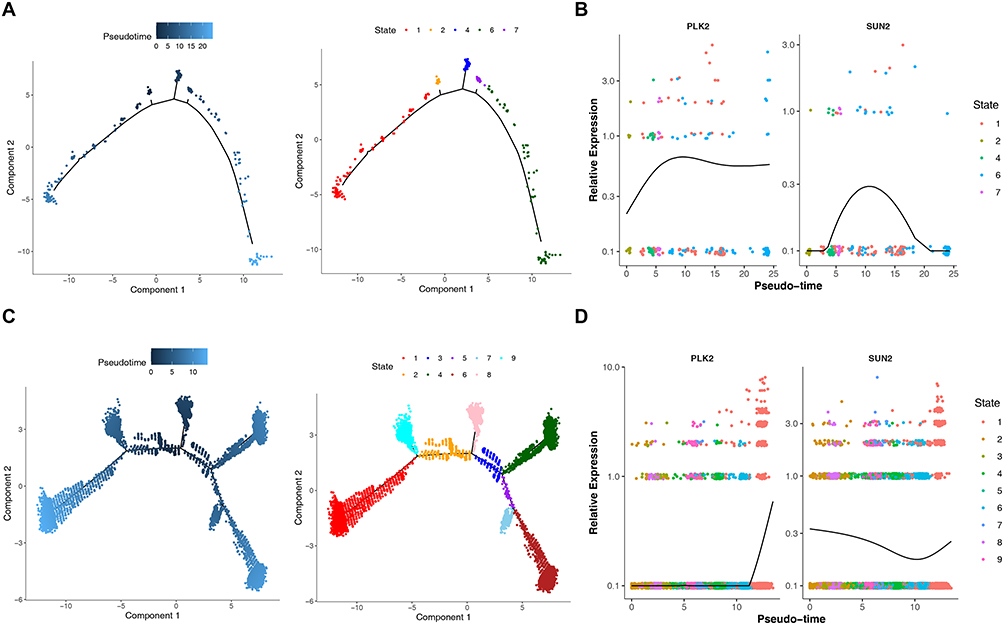 |
Figure 10 Pseudo-time Trajectory and PLK2/SUN2 Expression Trends in preInfC and HTC Cell Clusters. (A) Pseudotime trajectory of preInfC cells. (B) Expression dynamics of PLK2 and SUN2 along preInfC pseudotime. (C) Pseudotime trajectory of HTC cells. (D) Expression dynamics of PLK2 and SUN2 along HTC pseudotime. |
HTC from the starting position of development has been divided into different branches, there are 8 different stages of development, multiple cell clusters in different stages of development (Figure 10C). PLK2 showed an upward trend in the timing of HTC cells, and SUN2 showed a downward trend and then an upward trend in the timing of HTC cells (Figure 10D).
RT-qPCR Results
In the RT-qPCR, compared with the control group, the expression levels of PLK2 and SUN2 were strikingly lower in the OA group (P < 0.05) (Figure 11). The results of RT-qPCR were consistent with the bioinformatics analysis results, indicating the reliability of the bioinformatics analysis results.
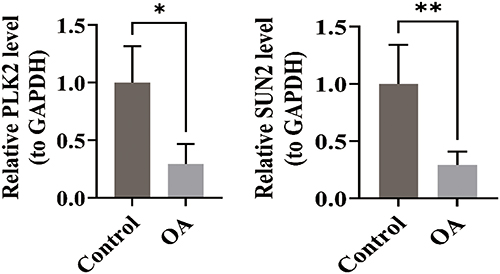 |
Figure 11 RT-qPCR validation of PLK2 and SUN2 expression in clinical samples. Expression levels of PLK2 and SUN2 were significantly downregulated in OA cartilage tissues compared to controls (p< 0.05) (Data are shown as mean ± SD. *p < 0.05, **p < 0.01, ***p < 0.001, ****p < 0.0001 vs control group). |
Discussion
CA, while a hallmark of malignancy, is increasingly recognized as a pivot point in metabolic and inflammatory homeostasis.3,12,50 This study is the first to systematically explore CA-related molecular mechanisms in OA, centered on two key genes, PLK2 and SUN2.13,21 By integrating MR analysis, with single-cell solution, our findings suggest that the downregulation of these CA-related genes coincides with the transition of chondrocytes from a homeostatic state toward pro-inflammatory and hypertrophic phenotypes.
PLK2 (Polo-like kinase 2) serves as a key regulator of centrosome cycling and ciliogenesis, maintaining centriole replication homeostasis through phosphorylation of relevant proteins and centrosomal localization.51,52 This study reveals a 2.3-fold downregulation of PLK2 in OA cartilage (p = 0.008), which may lead to the loss of its antioxidant function (eg, modulating Nrf2),53 and impair chondrocyte function via two potential pathways: ① By disrupting centrosome replication, it may induce functional anomalies or compensatory amplification (CA), thereby compromising cell polarity and ECM secretion; ② Through the inhibition of TAp73,54 it may influence mitotic checkpoints to suppress abnormal proliferation. Animal studies indicate that the PLK2/miR-27a axis regulates synovial angiogenesis,55 while aberrant angiogenesis depends on centrosome-mediated cell polarity and microtubule dynamics. Thus, PLK2 may represent a hub molecule linking CA, cellular stress, and joint degeneration in OA.
SUN2 (SAD1/UNC84 domain protein-2), previously reported to inhibit tumor metastasis,56 is here first revealed to play a pathological role in OA. As a linker between the nuclear envelope and cytoskeleton, SUN2 participates in centrosome-mediated microtubule network regulation, where nucleus-centrosome coordination is critical for spindle assembly.56 Its deficiency disrupts nuclear-centrosome coupling, potentially inducing centrosome amplification (CA).57 The potential pathogenic mechanisms of SUN2 downregulation in OA include: ① It triggers CA and impairs nuclear envelope mechanotransduction,57,58 leading to chromosomal instability and cellular stress, while also compromising the cell’s ability to respond to joint mechanical loads. ② Its ubiquitination and degradation are mediated by FBXO2,59 establishing a molecular bridge between inflammatory signaling and CA. ③ Dysregulation of nucleocytoplasmic transport60 indirectly exacerbates CA and aggravates synovial inflammation.61
To contextualize our findings supplementary GSEA analysis (data available upon request) revealed that both PLK2 and SUN2 were co-enriched in lysosome and Parkinson’s disease (PD) pathways, suggesting a possible molecular connection between CA and the lysosomal dysfunction observed in OA. Previous studies demonstrated that hydroxyapatite crystals deposited in OA chondrocytes can activate the NLRP3 inflammasome via lysosomal pathways, thereby promoting chondrocyte pyroptosis.62 Our findings imply that the downregulation of PLK2 and SUN2 may compromise lysosomal membrane stability, thereby driving chondrocyte senescence—a hypothesis that warrants functional validation through lysosomal permeability and β-galactosidase assays. Furthermore, the enrichment of PLK2/SUN2 in PD pathways aligns with clinical observations that OA is the most common comorbidity of PD,63 as well as the finding that WDR43 is a shared potential diagnostic biomarker.64 This implies that certain common pathway disruptions may exist between degenerative joint diseases and neurodegenerative diseases. Nevertheless, these enrichment results alone cannot confirm the actual occurrence of CA in OA chondrocytes, nor can they directly verify that CA drives disease progression by inducing lysosomal dysfunction via PLK2 and SUN2.
This study identified PLK2 and SUN2 as potential biomarkers associated with CA in OA. Both genes were screened from the CA-related gene set, and GO enrichment analysis showed significant enrichment in terms such as “microtubule organizing center attachment site” (Figure 3D), further supporting their association with centrosome function. Downregulation of PLK2 and SUN2 may contribute to abnormal proliferation, senescence, and inflammatory responses in OA chondrocytes by affecting centrosome stability, microtubule organization, and cell division regulation.
Therefore, one of the most important implications of this study is the proposal of a core hypothesis to be validated: in OA chondrocytes, does CA act as an upstream event that disrupts lysosomal homeostasis by regulating the expression or function of genes such as PLK2 and SUN2, thereby exacerbating cellular senescence and joint degeneration? Future functional studies (eg, inducing CA in chondrocytes to observe changes in lysosomal function and PLK2/SUN2 expression, or detecting centrosomal phenotypes and lysosomal activity after PLK2/SUN2 knockdown) are crucial for clarifying the specific role of this potential “CA-lysosome” axis in OA pathogenesis.
Given the established role of chronic low-grade inflammation65 drive the “degeneration-inflammation cycle” in OA joints,66 we investigated whether PLK2 and SUN2, might be involved in modulating the articular immune microenvironment. Our analysis revealed a robust positive correlation between PLK2 expression and the infiltration of Th2 cells and eosinophils. Previous studies confirmed that IL-4/IL-5 secreted by Th2 cells can promote eosinophil recruitment51; in turn, eosinophils may release IL-1 to participate in chondrocyte destruction.67 Given our finding that PLK2 is downregulated in OA patients, there is a potential association between reduced PLK2 expression and early OA progression, which may be linked to altered Th2/eosinophil-mediated inflammatory responses; the precise mechanism underlying this link requires further experimental validation. Conversely, SUN2 exhibited a negative correlation with central memory CD4+ T cells (r=−0.38), suggesting regulatory role of SUN2 in T cell activation; this observation aligns with SUN2’s known function in maintaining nuclear envelope stability in other diseases.68,69
Single-cell analysis revealed that PLK2 and SUN2 exhibited distinct expression patterns in two critical cell subpopulations—preInfC (pre-inflammatory chondrocytes) and HTC (hypertrophic chondrocytes)—a finding that closely aligns with OA’s core pathological mechanisms: preInfC-initiated early inflammation and HTC-driven abnormal endochondral ossification. Notably, our scRNA-seq analysis of GSE255460 replicated Fan et al’s (2024) core findings on OA cartilage cell heterogeneity and key inflammatory/hypertrophic subpopulations, laying a reliable foundation for analyzing CA-related gene expression in specific subpopulations. Building on their cell atlas, we added a CA molecular layer, proposing the novel “CA-immune microenvironment-cartilage degeneration” pathogenic axis.
Our observation that PLK2 is persistently upregulated (p<0.01) along the HTC pseudotime trajectory suggests it may promote terminal chondrocyte differentiation by regulating cell cycle exit (GO enrichment in “meiotic cell cycle”). More critically, SUN2 expression in preInfC—the “initiator cells” of early OA inflammation20—displayed a dynamic rise-and-fall pattern (p<0.05), which synchronizes with these preInfC’s transition from pro-inflammatory to matrix-degrading phenotypes. RT-qPCR validation using clinical cartilage samples further supported these findings: compared with controls, PLK2 expression decreased 2.3-fold (p=0.008) and SUN2 decreased 1.8-fold (p=0.012) in OA versus controls, fully consistent with bioinformatics predictions (all differential p<0.05). These results not only delineate the regulatory roles of CA-related genes in OA-critical cell subpopulations but also suggest that the transition from preInfC to HTC—modulated by PLK2 and SUN2—may represent the cellular basis for CA-driven OA progression.
Through integrated multi-omics analysis, this study tentatively identified PLK2 and SUN2 as candidate CA-associated biomarkers in OA for the first time (to our knowledge, for the first time in this context). It further suggested potential roles of these genes in OA progression: PLK2 may be linked to oxidative stress, SUN2 may contribute to cytoskeletal stability maintenance, and both genes exhibit associations with components of the immune microenvironment. Functional characterization at single-cell resolution adds context to their dynamic expression patterns of these genes in pathological cell subpopulations such as preInfC and HTC, preliminary insights that may inform future exploration of therapeutic strategies targeting CA pathways (eg, PLK2 or SUN2 modulators). Although the combination of bioinformatic predictions and experimental validation has strengthened support for these observations, several limitations remain: On the one hand, direct evidence for the occurrence of centrosome amplification (CA) in OA chondrocytes and its correlation with PLK2/SUN2 expression is lacking. Future studies are needed to validate CA’s occurrence in OA cartilage (eg, via γ-tubulin/centrin staining and fluorescence microscopy) and its correlation with PLK2/SUN2 expression. On the other hand, the functional roles of PLK2/SUN2 in OA chondrocyte biology, especially their contributions to centrosomal dynamics, remain untested. Gain- and loss-of-function experiments are required to clarify their regulatory effects on centrosomal function and OA-relevant cellular phenotypes (eg, senescence, inflammation). Future research will focus on two aspects: First, employing cellular (chondrocyte) and animal (OA mouse) models through CRISPR-Cas9-mediated genetic editing to regulate the expression levels of PLK2 and SUN2 will clarify their regulatory roles in chondrocyte proliferation, apoptosis, and extracellular matrix metabolism, thereby elucidating their specific mechanisms in the pathogenesis of OA. Second, establishing a multicenter cohort to detect the protein expression of PLK2 and SUN2 in patient serum, synovial fluid, and cartilage tissue will assess the sensitivity, specificity, and prognostic value of these molecules as OA diagnostic markers, providing an evidence-based foundation for clinical application. These efforts aim to advance the early diagnosis of osteoarthritis and optimize stratified therapeutic strategies.
Data Sharing Statement
Data are available from the corresponding author upon request.
Ethics Statement
All procedures performed in studies involving human participants were in accordance with the ethical standards of the institutional and/or national research committee and with the 1964 Helsinki Declaration and its later amendments or comparable ethical standards. The study was approved by the Ethics Committee of Fujian Medical University Union Hospital.
Acknowledgments
We acknowledge support from the Research project of Fujian Medical University Union Hospital (No. 2024XH032, 2025XH008).
Author Contributions
Contributions were made in accordance with the CRediT (Contributor Roles Taxonomy) guidelines: Conceptualization: Chengjie Lian, Hua Zhang. Data Curation: Shixin Nie, Pei Zhao, Zhi Chen, Siyi Wu, Mingxuan Li. Formal Analysis: Shixin Nie, Pei Zhao. Investigation: Zhi Chen, Siyi Wu, Mingxuan Li. Supervision: Chengjie Lian, Hua Zhang. Writing – Original Draft: Shixin Nie, Pei Zhao. Writing – Review & Editing: Chengjie Lian, Hua Zhang. All authors took part in drafting, revising or critically reviewing the article; gave final approval of the version to be published; have agreed on the journal to which the article has been submitted; and agree to be accountable for all aspects of the work.
Disclosure
The author(s) report no conflicts of interest in this work.
References
1. Ozeki N, Koga H, Sekiya I. Degenerative Meniscus in Knee Osteoarthritis: from Pathology to Treatment. Life. 2022;12(4):603. doi:10.3390/life12040603
2. Pettenuzzo S, Berardo A, Belluzzi E, et al. Mechanical insights into fat pads: a comparative study of infrapatellar and suprapatellar fat pads in osteoarthritis. Connective Tissue Res. 2025;66(4):272–21. doi:10.1080/03008207.2025.2502591
3. Glyn-Jones S, Palmer AJR, Agricola R, et al. Osteoarthritis. Lancet. 2015;386(9991):376–387. doi:10.1016/S0140-6736(14)60802-3
4. Steinmetz JD, Culbreth GT, Haile LM, et al. Global, regional, and national burden of osteoarthritis, 1990–2020 and projections to 2050: a systematic analysis for the Global Burden of Disease Study 2021. Lancet Rheumatol. 2023;5(9):e508–e522. doi:10.1016/S2665-9913(23)00163-7
5. Cao X, Zhu R, Liu D, Cheng Y, Sun Y, Huang Z. Epidemiological trends in burden of osteoarthritis in China: an analysis from 1990 to 2021 with forecasts for 2022–2050. Front Public Health. 2025;13:1612596. doi:10.3389/fpubh.2025.1612596
6. Martel-Pelletier J, Barr AJ, Cicuttini FM, et al. Osteoarthritis. Nat Rev Dis Primers. 2016;2(1):16072. doi:10.1038/nrdp.2016.72
7. Mukherjee A, Das B. The role of inflammatory mediators and matrix metalloproteinases (MMPs) in the progression of osteoarthritis. Biomater Biosystems. 2024;13:100090. doi:10.1016/j.bbiosy.2024.100090
8. Chang AH, Roemer FW, Guermazi A, et al. Do Existing Magnetic Resonance Imaging Definitions of Knee Osteoarthritis Identify Knees That Will Develop Clinically Significant Disease Over Up To 11 Years of Follow‐Up? Arthritis Rheumatol. 2025;77(2):140–150. doi:10.1002/art.42982
9. Taruc-Uy RL, Lynch SA. Diagnosis and Treatment of Osteoarthritis. Primary Care: Clinics in Office Practice. 2013;40(4):821–836. doi:10.1016/j.pop.2013.08.003
10. Shih PC, Lee YH, Tsou HK, Cheng-Chung Wei J. Recent targets of osteoarthritis research. Best Pract Res. 2023;37(2):101851. doi:10.1016/j.berh.2023.101851
11. Henrotin Y. Osteoarthritis in year 2021: biochemical markers. Osteoarthritis Cartilage. 2022;30(2):237–248. doi:10.1016/j.joca.2021.11.001
12. Cho Y, Jeong S, Kim H, et al. Disease-modifying therapeutic strategies in osteoarthritis: current status and future directions. Exp Mol Med. 2021;53(11):1689–1696. doi:10.1038/s12276-021-00710-y
13. Zhao JZ, Ye Q, Wang L, Lee SC. Centrosome amplification in cancer and cancer-associated human diseases. Biochim Biophys Acta Rev Cancer. 2021;1876(1):188566. doi:10.1016/j.bbcan.2021.188566
14. Zhang Y, Tian J, Qu C, et al. A look into the link between centrosome amplification and breast cancer. Biomed Pharmacother. 2020;132:110924. doi:10.1016/j.biopha.2020.110924
15. Dias Louro MA, Bettencourt-Dias M, Bank C. Patterns of selection against centrosome amplification in human cell lines. PLoS Comput Biol. 2021;17(5):e1008765. doi:10.1371/journal.pcbi.1008765
16. Wang SQ, Xie WP, Yue L, Cai YL. Screening and validation for core genes in osteoarthritic cartilage based on weighted gene co-expression network analysis. Eur Rev Med Pharmacol Sci. 2022;26(22):8234–8246. doi:10.26355/eurrev_202211_30355
17. Mobasheri A. Osteoarthritis year 2012 in review: biomarkers. Osteoarthritis Cartilage. 2012;20(12):1451–1464. doi:10.1016/j.joca.2012.07.009
18. Woetzel D, Huber R, Kupfer P, et al. Identification of rheumatoid arthritis and osteoarthritis patients by transcriptome-based rule set generation. Arthritis Res Ther. 2014;16(2):R84. doi:10.1186/ar4526
19. Fisch KM, Gamini R, Alvarez-Garcia O, et al. Identification of transcription factors responsible for dysregulated networks in human osteoarthritis cartilage by global gene expression analysis. Osteoarthritis Cartilage. 2018;26(11):1531–1538. doi:10.1016/j.joca.2018.07.012
20. Fan Y, Bian X, Meng X, et al. Unveiling inflammatory and prehypertrophic cell populations as key contributors to knee cartilage degeneration in osteoarthritis using multi-omics data integration. Ann Rheumatic Dis. 2024;83(7):926–944. doi:10.1136/ard-2023-224420
21. Denu RA, Burkard ME. Analysis of the “centrosome-ome” identifies MCPH1 deletion as a cause of centrosome amplification in human cancer. Sci Rep. 2020;10(1):11921. doi:10.1038/s41598-020-68629-4
22. Liu Y, He M, Ke X, et al. Centrosome amplification-related signature correlated with immune microenvironment and treatment response predicts prognosis and improves diagnosis of hepatocellular carcinoma by integrating machine learning and single-cell analyses. Hepatol Int. 2024;18(1):108–130. doi:10.1007/s12072-023-10538-5
23. Ritchie ME, Phipson B, Wu D, et al. limma powers differential expression analyses for RNA-sequencing and microarray studies. Nucleic Acids Res. 2015;43(7):e47. doi:10.1093/nar/gkv007
24. Gustavsson EK, Zhang D, Reynolds RH, Garcia-Ruiz S, Ryten M. ggtranscript: an R package for the visualization and interpretation of transcript isoforms usingggplot2. Bioinformatics. 2022;38(15):3844–3846. doi:10.1093/bioinformatics/btac409
25. Gu Z, Hübschmann D. Make Interactive Complex Heatmaps in R. Bioinformatics. 2022;38(5):1460–1462. doi:10.1093/bioinformatics/btab806
26. Gao CH, Yu G, Cai P. ggVennDiagram: an Intuitive, Easy-to-Use, and Highly Customizable R Package to Generate Venn Diagram. Front Genet. 2021;12:706907. doi:10.3389/fgene.2021.706907
27. Wu T, Hu E, Xu S, et al. clusterProfiler 4.0: a universal enrichment tool for interpreting omics data. Innovation. 2021;2(3):100141. doi:10.1016/j.xinn.2021.100141
28. Hemani G, Zheng J, Elsworth B, et al. The MR-Base platform supports systematic causal inference across the human phenome. Elife. 2018:7e34408. doi:10.7554/eLife.34408.
29. Skrivankova VW, Richmond RC, Woolf BAR, et al. Strengthening the Reporting of Observational Studies in Epidemiology Using Mendelian Randomization. JAMA. 2021;326(16):1614. doi:10.1001/jama.2021.18236
30. Obenchain V, Lawrence M, Carey V, Gogarten S, Shannon P, Morgan M. VariantAnnotation: a Bioconductor package for exploration and annotation of genetic variants. Bioinformatics. 2014;9(14):2076–2078. doi:10.1093/bioinformatics/btu168
31. Burgess S, Thompson SG. Interpreting findings from Mendelian randomization using the MR-Egger method. Eur J Epidemiol. 2017;32(5):377–389. doi:10.1007/s10654-017-0255-x
32. Bowden J, Davey Smith G, Haycock PC, Burgess S. Consistent Estimation in Mendelian Randomization with Some Invalid Instruments Using a Weighted Median Estimator. Genetic Epidemiology. 2016;40(4):304–314. doi:10.1002/gepi.21965
33. Burgess S, Scott RA, Timpson NJ, Davey Smith G, Thompson SG. Using published data in Mendelian randomization: a blueprint for efficient identification of causal risk factors. Eur J Epidemiol. 2015;30(7):543–552. doi:10.1007/s10654-015-0011-z
34. Obenchain V, Lawrence M, Carey V, et al. Depression and prostate cancer risk: a Mendelian randomization study. Cancer Med. 2020;9(23):9160–9167. doi:10.1002/cam4.3493
35. Hu J, Song J, Chen Z, et al. Reverse causal relationship between periodontitis and shortened telomere length: bidirectional two-sample Mendelian random analysis. Front Immunol. 2022;13:1057602. doi:10.3389/fimmu.2022.1057602
36. Shannon P, Markiel A, Ozier O, et al. Cytoscape: a Software Environment for Integrated Models of Biomolecular Interaction Networks. Genome Res. 2003;13(11):2498–2504. doi:10.1101/gr.1239303
37. Robin X, Turck N, Hainard A, et al. pROC: an open-source package for R and S+ to analyze and compare ROC curves. BMC Bioinf. 2011;12(1):77. doi:10.1186/1471-2105-12-77
38. Xu J, Yang T, Wu F, Chen T, Wang A, Hou S. A nomogram for predicting prognosis of patients with cervical cerclage. Heliyon. 2023;9(11):e21147. doi:10.1016/j.heliyon.2023.e21147
39. Chen Y, He J, Pan X. Prediction of risk factors for preoperative deep vein thrombosis in patients with pelvic fracture. Front Surg. 2025;12:1585460. doi:10.3389/fsurg.2025.1585460
40. Hu Y, Yan C, Hsu CH, et al. OmicCircos: a Simple-to-Use R Package for the Circular Visualization of Multidimensional Omics Data. Cancer Inform. 2014;13:S13495. doi:10.4137/CIN.S13495
41. Robles-Jimenez LE, Aranda-Aguirre E, Castelan-Ortega OA, et al. Worldwide Traceability of Antibiotic Residues from Livestock in Wastewater and Soil: a Systematic Review. Animals. 2021;12(1):60. doi:10.3390/ani12010060
42. Hänzelmann S, Castelo R, Guinney J. GSVA: gene set variation analysis for microarray and RNA-Seq data. BMC Bioinf. 2013;14(1):7. doi:10.1186/1471-2105-14-7
43. Hao Y, Hao S, Andersen-Nissen E, et al. Integrated analysis of multimodal single-cell data. Cell. 2021;184(13):3573–3587.e29. doi:10.1016/j.cell.2021.04.048
44. Kang X, Zhang K, Wang Y, Zhao Y, Lu Y. Single-cell RNA sequencing analysis of human chondrocytes reveals cell–cell communication alterations mediated by interactive signaling pathways in osteoarthritis. Front Cell Dev Biol. 2023;11. doi:10.3389/fcell.2023.1099287
45. Swahn H, Li K, Duffy T, et al. Senescent cell population with ZEB1 transcription factor as its main regulator promotes osteoarthritis in cartilage and meniscus. Ann Rheumatic Dis. 2023;82(3):403–415. doi:10.1136/ard-2022-223227
46. Ji Q, Zheng Y, Zhang G, et al. Single-cell RNA-seq analysis reveals the progression of human osteoarthritis. Ann Rheumatic Dis. 2019;78(1):100–110. doi:10.1136/annrheumdis-2017-212863
47. Jin S, Guerrero-Juarez CF, Zhang L, et al. Inference and analysis of cell-cell communication using CellChat. Nat Commun. 2017;12(1). doi:10.1038/s41467-021-21246-9
48. Qiu X, Mao Q, Tang Y, et al. Reversed graph embedding resolves complex single-cell trajectories. Nat Methods. 2017;14(10):979–982. doi:10.1038/nmeth.4402
49. Altman R, Asch E, Bloch D, et al. Development of criteria for the classification and reporting of osteoarthritis: classification of osteoarthritis of the knee. Arthritis Rheum. 1986;29(8):1039–1049. doi:10.1002/art.1780290816
50. Palmer AJR, Brown CP, McNally EG, et al. Non-invasive imaging of cartilage in early osteoarthritis. Bone Joint J. 2013;95B(6):738–746. doi:10.1302/0301-620X.95B6.31414
51. Warnke S, Kemmler S, Hames RS, et al. Polo-like kinase-2 is required for centriole duplication in mammalian cells. Curr Biol. 2004;14(13):1200–1207. doi:10.1016/j.cub.2004.06.059
52. Hoffmann I. Playing polo in G1: a novel function of polo-like kinase-2 in centriole duplication. Cell Cycle. 2004;3(10):1230–1231. doi:10.4161/cc.3.10.1192
53. Fan Y, Wang J, He N, Feng H. PLK2 protects retinal ganglion cells from oxidative stress by potentiating Nrf2 signaling via GSK‐3β. J Biochem Molecular Tox. 2021;35(8):e22815. doi:10.1002/jbt.22815
54. Li W, Zhang X, Xi X, et al. PLK2 modulation of enriched TAp73 affects osteogenic differentiation and prognosis in human osteosarcoma. Cancer Med. 2020;9(12):4371–4385. doi:10.1002/cam4.3066
55. Liu W, Zha Z, Wang H. Upregulation of microRNA‐27a inhibits synovial angiogenesis and chondrocyte apoptosis in knee osteoarthritis rats through the inhibition of PLK2. J Cellular Physiol. 2019;234(12):22972–22984. doi:10.1002/jcp.28858
56. Tapley EC, Starr DA. Connecting the nucleus to the cytoskeleton by SUN–KASH bridges across the nuclear envelope. Curr Opin Cell Biol. 2013;25(1):57–62. doi:10.1016/j.ceb.2012.10.014
57. He D, Liu X, Yang W, Guan T, Wang G. The role of mechanosensitive ion channel Piezo1 in knee osteoarthritis inflammation. Channels. 2024;18(1):2393088. doi:10.1080/19336950.2024.2393088
58. Liu L, Li S, Yuan W, Tang J, Sang Y. Downregulation of SUN2 promotes metastasis of colon cancer by activating BDNF/TrkB signalling by interacting with SIRT1. J Pathol. 2021;254(5):531–542. doi:10.1002/path.5697
59. Ji J, Shen J, Xu Y, et al. FBXO2 targets glycosylated SUN2 for ubiquitination and degradation to promote ovarian cancer development. Cell Death Dis. 2022;13(5):442. doi:10.1038/s41419-022-04892-9
60. Huang Y, Peng Q, Tian X, et al. Nuclear membrane protein SUN2 promotes replication of flaviviruses through modulating cytoskeleton reorganization mediated by NS1. Nat Commun. 2024;15(1):296. doi:10.1038/s41467-023-44580-6
61. Nasi S, Ea HK, So A, Busso N. Revisiting the Role of Interleukin-1 Pathway in Osteoarthritis: interleukin-1α and −1β, and NLRP3 Inflammasome Are Not Involved in the Pathological Features of the Murine Menisectomy Model of Osteoarthritis. Front Pharmacol. 2017;8:282. doi:10.3389/fphar.2017.00282
62. Ye T, Wang C, Yan J, et al. Lysosomal destabilization: a missing link between pathological calcification and osteoarthritis. Bioact Mater. 2024;34:37–50. doi:10.1016/j.bioactmat.2023.12.001
63. Jones JD, Malaty I, Price CC, Okun MS, Bowers D. Health comorbidities and cognition in 1948 patients with idiopathic Parkinson’s disease. Parkinsonism Related Disord. 2012;18(10):1073–1078. doi:10.1016/j.parkreldis.2012.06.004
64. Heng H, Liu J, Hu M, Li D, Su W, Li J. WDR43 is a potential diagnostic biomarker and therapeutic target for osteoarthritis complicated with Parkinson’s disease. Front Cell Neurosci. 2022;16:1013745. doi:10.3389/fncel.2022.1013745
65. Woodell‐May JE, Sommerfeld SD. Role of Inflammation and the Immune System in the Progression of Osteoarthritis. J Orthopaedic Res. 2020;38(2):253–257. doi:10.1002/jor.24457
66. Zhu X, Lee CW, Xu H, et al. Phenotypic alteration of macrophages during osteoarthritis: a systematic review. Arthritis Res Ther. 2021;23(1):110. doi:10.1186/s13075-021-02457-3
67. Di J, Song L, Liu Y, et al. Eosinophil-to-Lymphocyte Ratio and Eosinophil Count as New Predictive Markers for Osteoarthritis. JPR. 2024;17:3803–3815. doi:10.2147/JPR.S480925
68. Turgay Y, Champion L, Balazs C, et al. SUN proteins facilitate the removal of membranes from chromatin during nuclear envelope breakdown. J Cell Biol. 2014;204(7):1099–1109. doi:10.1083/jcb.201310116
69. Belaadi N, Pernet L, Aureille J, et al. SUN2 regulates mitotic duration in response to extracellular matrix rigidity. Proc Natl Acad Sci USA. 2022;119(45). doi:10.1073/pnas.2116167119
 © 2026 The Author(s). This work is published and licensed by Dove Medical Press Limited. The
full terms of this license are available at https://www.dovepress.com/terms
and incorporate the Creative Commons Attribution
- Non Commercial (unported, 4.0) License.
By accessing the work you hereby accept the Terms. Non-commercial uses of the work are permitted
without any further permission from Dove Medical Press Limited, provided the work is properly
attributed. For permission for commercial use of this work, please see paragraphs 4.2 and 5 of our Terms.
© 2026 The Author(s). This work is published and licensed by Dove Medical Press Limited. The
full terms of this license are available at https://www.dovepress.com/terms
and incorporate the Creative Commons Attribution
- Non Commercial (unported, 4.0) License.
By accessing the work you hereby accept the Terms. Non-commercial uses of the work are permitted
without any further permission from Dove Medical Press Limited, provided the work is properly
attributed. For permission for commercial use of this work, please see paragraphs 4.2 and 5 of our Terms.