Back to Journals » Risk Management and Healthcare Policy » Volume 14
Exploring Asymmetric Nexus Between CO2 Emissions, Environmental Pollution, and Household Health Expenditure in China
Authors Zeeshan M, Han J, Rehman A, Ullah I, Afridi FEA ![]()
Received 16 September 2020
Accepted for publication 21 January 2021
Published 11 February 2021 Volume 2021:14 Pages 527—539
DOI https://doi.org/10.2147/RMHP.S281729
Checked for plagiarism Yes
Review by Single anonymous peer review
Peer reviewer comments 2
Editor who approved publication: Dr Kent Rondeau
Muhammad Zeeshan,1 Jiabin Han,1 Alam Rehman,2 Irfan Ullah,3 Fakhr E Alam Afridi4
1College of Business Administration, Liaoning Technical University, Xingcheng, Liaoning Province, 125105, People’s Republic of China; 2Faculty of Management Sciences, National University of Modern Languages, Islamabad, Pakistan; 3Reading Academy, Nanjing University of Information Science and Technology, Nanjing, People’s Republic of China; 4Islamia College Peshawar, Peshawar, Pakistan
Correspondence: Alam Rehman
Faculty of Management Sciences, National University of Modern Languages, Pakistan
Email [email protected]
Objective: This study investigates the nexus between household health expenditure, CO2 emissions and environmental pollution in China. We analyzed the asymmetric dynamic relationship between CO2 emissions, environmental pollution and household health expenditure for the period 1990 to 2019 in China.
Methods: This study adopted nonlinear autoregressive distributed lag (NARDL) and Granger causality following the diagnostic test. Furthermore, we applied Dickey–Fuller (ADF), PP unit root tests, Zivot and Andrews test for structural breaks in our analysis. The NARDL is the most suitable econometric technique for estimations, especially if the asymmetric relationship exists among the variables. NARDL technique is capable to explore the dynamic relationship between CO2 emissions, environmental pollution and household health expenditure.
Results: The empirical results verify the asymmetric nexus between CO2 emissions, environmental pollution and household health expenditure in the context of China. The outcomes revealed that in the short run and long run positive shocks of CO2 emissions and environmental pollution positively affecting health expenditure, while negative shocks reduce health spendings. The results also demonstrate bi-directional causality among household health spendings, CO2 emissions and environmental pollution.
Conclusion: Our results support many previous studies, documenting that CO2 emissions positively contribute to the amount of household health expenditure, confirming the asymmetric relationship between CO2 emissions and household health expenditure. The results also confirm the statistically significant and asymmetrically positive relationship between environmental pollution and household health expenditure. This implies that Chinese residents have to bear more household health expenditure, in the case of more CO2 emissions and a greater amount of environmental pollution.
Keywords: CO2 emissions, environmental pollution, household health expenditure, China
Introduction
The last decade has witnessed more mortality and morbidity across the world, mainly caused by various sources of pollution.1 The excessive increase of biomass gasses ie, CO2, NO2, and environmental degradation on public health is the most debatable issue in the literature. Almost half of the world’s population as a whole, and in low-income countries still 95% of the population use firewood and biomass fuels for their energy needs, covering their cooking and heating, meanwhile the same is increasing in the third world and more developing countries.2 The use of biomass gasses and environmental degradation put pressure on the health care system of the government in terms of health cost, and significantly affect the budget of households. Public policies in this regard, are important to protect public health as well as the ecosystem.1 Polluted air and biomass gasses as a source of energy consumption affect the environment and cause more diseases that adversely affect the health care spendings of the government as well as household.3 Trade openness following the massive use of biomass gasses and hydro technology in the manufacturing units directly affect the environment, which resultantly affects human health that further adversely affects labor productivity. Biomass gasses lead to deteriorating the environment and put pressure on the health spendings of both households and the government. Population density is the key factor that affects the urban environment and has an important link with the urban ecological system. Due to huge number of residents in urban areas, inadequate water supplies, insufficient drainage system and scarcity of green areas have costed human health. In this regard, a special attempt must be given by the Chinese government to address this issue.4
China population was recorded as 1.37 billion in year 2012. Fifty percent of residents live in rural regions. Despite going through the fast expansion era, there is a big gap in health facilitation and wealth distribution between rural and urban residencies. The unbalanced societal growth further intensified by a dualistic financial form at the consequences of individual comforts.5 However, as compared to urban residents, rural families have a scarcity of income, societal social welfare rights, and less access to essential services. The weaker socio-financial position and scarcity of public safety for rural families raise their possibility of dropping into a downhill cycle of “deprivation and illness”. Plenty of research indicated that individuals with poor financial circumstances are exposed and may be affected more due to the shortage of medical expenses.6 However, the expansion of the New Rural Cooperative Medical Scheme (NCMS), by the Chinese Government is the initiative to disrupt the negative cycle of “deprivation and illness”. The NCMS, a society-based funding program, plans to support rural people and provide them with their medical expenses.7 The World Health Report 2000 highlighted the health scheme that involves individuals’ lives and businesses.8 The challenges to the wellbeing protection scheme-built health treatment impartial and viable with effective use of funds. In many developing countries, the rising of health service is the prime goal. Improved entrance to healthcare permitting need to raise equity and attain effectiveness through a decrease of per-capita health care expenses.9 However, the under-consumption of health public facilities is still an ancient dilemma in the emerging countries.8
China is facing a serious domestic issue in terms of energy shortage, environmental pollution and reduction of carbon emission. In this regard, China has made several attempts to better comprehend these issues. Coping with this, Chinese government has made several announcements for reducing emission intensity.10 China earlier set targets of reducing carbon emission up to 60% by 2020, from the current level in 2005.11 With fast economic development, the improvement in people’s incomes and consumption abilities may upsurge the level of household energy consumption. It is evident that after 2000, a noticeable annual increase in energy consumption by 8.4% and carbon emission by 8.7% have been reported.12 In view of these statistics, it is a complex question for the Chinese policy makers in term of formulating effective measures that could improve the living standards of their residents and also contribute to energy saving and emission reduction, which will facilitate and pave the way to a sustainable development that is the top front target for the government of China to address.10 The emission reduction would make environmental quality as human friendly. More carbon emission and environmental degradation has put in test both individuals and government to deal with the extra expenditure been incurred due to human health issues. A healthier society is a viable determinant of the country’s growth and prosperity. After 1960s, developing economies have seen a dramatic increase in urban population and concentration. While at the same period they actively embraced globalization. Towards this end, most of the studies related to CO2 emissions focus on macro variables such as energy consumption, unemployment, GDP, economic development, and so on. However, there is a greater need for research using micro data of regions/cities in China to compare more empirically the effects on health expenditure from both perspectives, citizens and government budget for health development. This will help in capturing the effect of economic transformation, for which the government has already introduced plans with urbanization health expenditure, demanded by regions or cities.
This paper contributes to the existing literature from the following aspects; firstly, the household health spending with CO2 emissions and environmental pollution in China has not been analyzed before. Therefore, in this study, we explore the household health expenditure, CO2 emissions and environmental pollution in China. Secondly, we use asymmetric ARDL approach for the analysis, which is the methodological contribution of this study in terms of these variables. Thirdly, we use both CO2 emissions and environmental pollution in the model, which helps to understand the degree of association of CO2 emissions and environmental pollution with health spending.
In recent years the effect of carbon dioxide emission on healthcare expenditure (HCE) has attracted the interest of many researchers. However, most of which have adopted traditional empirical methods, such as quantile regression (QR), to analyze the issue.13 There are only a few studies which provide the method to this field, especially using macro data. These studies found that carbon dioxide emission is, indeed, an important factor affecting healthcare expenditure in China,14 although its influence is not as great as the income variable. It was also revealed that the effect of carbon dioxide emission on HCE at a higher quantile was much smaller,13 which indicates that most people are not paying sufficient attention to the correlation between air pollution and healthcare. Therefore, the primary purpose of this study is to investigate the relationship between household health expenditure, CO2 emissions and environmental pollution in China.
Literature Review and Hypothesis Development
CO2 Emissions and Household Health Expenditures
The nexus between CO2 emissions and health expenditures have been tested in the empirical literature, using different cases and methodological tools, which provide diverse empirical outcomes. Bernstein, Alexis, Barnes, Bernstein, Nel, Peden, Diaz-Sanchez, Tarlo, Williams15 applied ARDL methodology, and argued that CO2 emissions promote a polluted environment, which directly affects human health and creates health concerns for the residents. Apergis, Jebli, Youssef16 using NARDL methodology recommended that the use of green energy in manufacturing units to lower down the amount of CO2 emissions, which will reduce household health expenditure. Chaabouni, Saidi17 investigated the relationship among health expenditure and CO2 emissions for the case of 51 regions from 1995 to 2013, by applying the GMM (generalized method of moments) for analysis and found that CO2 positively contributes to health expenditures for the individuals and reported a bidirectional causality between CO2 emissions and health expenditures. Similarly, Yahaya, Nor, Habibullah, Ghani, Noor18 asserted the nexus between CO2 emissions and health expenditures for 125 emerging economies for the period 1995–2012, applying panel cointegration methodology, and found that CO2 emissions are the main responsible factor for the higher health expenditure. In line with the same studies,19 also highlighted the relationship between CO2 emission and health expenditures. The study applied quantile regression across US states for the period 1996–2009 and observed in findings that CO2 emissions effect is much stronger at conditional distribution upper end of healthcare expenditure. Likewise, Ghorashi, Alavi Rad,20 in their research using dynamic Simultaneous Equation Models for the case of Iran over the period 1972–2012, observed the causal nexus between CO2 emissions and health expenditure. However, Murthy, Ukpolo21 highlighted the factors affecting average individual healthcare expenditure in the US using a cointegration test and reported that the income elasticity of healthcare expenditure is significantly different from the analytical results obtained from cross-sectional data. Likewise, Chaabouni, Zghidi, Mbarek22 have studied health expenditure, CO2 emissions and economic growth causal relationship for a global panel of 51 countries for the period 1995 to 2013, using dynamic Simultaneous Equation Models. Their study implemented empirical models for group of low-income level and found empirical evidence of bidirectional causality among economic growth and CO2 emissions; and between economic growth and health expenditure for their global panel data, and observed unidirectional causality from health expenditure to CO2 emissions, except countries of low-income level. Recent studies show that with the development of economic growth in China has caused serious health problems and increased healthcare economic burdens. However, most of the studies used the traditional adopted empirical methods such as ordinary least squares (OLS) or quantile regression (QR), to investigate the issue.13,14 However, earlier studies mostly focused on the CO2 emissions effect on the expenditure of health.21,23 While this study contributes to the existing literature by investigating the causal relationship among CO2 emissions, and health expenditures. We establish the following hypothesis purely on the relationship established in the previous literature we discussed above.
H1: There is a positive nexus between CO2 emissions and household health expenditure.
Presently, with the rapid economic development, China is facing environmental pollution, which adversely affects people health. Therefore, public health expenditure continuously increased while environment quality declined. Liu, Lu, Song, Lei, Hu, Lv, Zhou, Cao, Shi, Yang24 explained the effect of environmental pollution on people’s health-related expenditure by applying the generalized method of moments (GMM) methodology and used Chinese provinces’ data for the period 1998–2015. The results demonstrated that the medical expenses of Chinese people have been increased mainly due to environmental pollution. Similarly, Li, Li, Jiang, Duan, Ge, Zhang, Deng, Wang, Hao,25 and Zhang, Wang26 proclaimed that once air pollution and CO2 emission cross the upper level then it start affecting human health, which cause more health expenditure for the individuals. Likewise, Lu, Chen, Hao, Wang, Song, Mok27 argued that environmental pollution causes serious respiratory and heart diseases. In line to these findings, Chen, Shao, Tian, Xie, Yin,28 and Lu, Chen, Hao, Wang, Song, Mok27 also confirmed the negative effect of the environmental pollution on human health and financial burden on individuals. Extending the same, Li, Tan, Wang, Zhang, Lao, Wong, Feng29 argued that pollution directly affects the immune system of the individual which is costly for the government as well as individuals. Likewise, Guan, Zheng, Chung, Zhong30 documented that both water and air pollution cause illness. Similarly,27,31 and Chen, Shao, Tian, Xie, Yin28 highlighted that environmental pollution is the most dangerous factor in influencing the health of the people. Besides, the amount of CO2 emissions and health expenditures budget of the individuals have been significantly increased in the last two decades.26,32 Likewise,2,33 and Ebenstein34 reported that the health of the people is affected by environmental pollution. Likewise, Xu, Evans, Kawabata, Zeramdini, Klavus, Murray,35 and Haskell, Lee, Pate, Powell, Blair, Franklin, Macera, Heath, Thompson, Bauman36 investigated that people’s health level is determined by medical expenditure. While some variables of socioeconomic such as public facility and level of education also affect directly the medical expenses of the people which influence the status of the health of the people.37–39 Similarly, Neidell33 investigated that Carbon monoxide has verified statistically significant impact on asthma in children in the age of 1 to 18 years, and the same resultantly affect people’s medical care expenditure. Likewise, Narayan, Narayan40 documented using OECD date and argued that short-run revenue and carbon monoxide emissions have statistically significant and positive effect on health expenditures, however, in the long run high sulfur also causes an increase in health expenditure. Several other studies verified and reported that there is an association between people health and medical expenditure. For instance, by using data for the period 1999–2004 for 47 African countries’ Anyanwu, Erhijakpor,41 found that the individual’s health expenditure has a negative and statistically significant effect on the mortality rate of the newborn children. We develop the following hypothesis based on the empirical relationship.
H2: There is a positive nexus between environmental pollution and household health expenditure.
The nexus between CO2 emissions and environmental pollution has also been witnessed in the literature. According to Aunan, Berntsen, Myhre, Rypdal, Streets, Woo, Smith,42 China’s environment is highlighted all over the world. Here we explain that China has the ability up to some extent to recover the water and air quality for their urban residents at the local level. Presently, CO2 emissions in China continuously growing, but in the future, its growth seems to be slow. In many studies, it has been reported that China has significantly set up regulations for the improvement of the environment. According to State of Environment Report of 1998 states, which shows a continuous progress to control industrial pollution and a larger observed improvement in urban environment. China also the world’s biggest possibly source of CO2 emissions.12,43–45 In 2007, the CO2 emissions of China were 14% higher than U.S reported by Netherlands Environmental Assessment Agency.46 El Arafy47 explained that the growth of CO2 emission in the environment is recognized as a key contributor to the Global Warming Problem caused by this Green House Gas. Likewise, Lee, Brahmasrene48 explained the effect of carbon dioxide in European union by using the data from 1988 to 2009, and the outcomes of the panel-cointegration method as well as fixed effect model show a long-run relationship exists between these two. China is producing higher air pollution and greenhouse gas emissions. To solve the environmental problem many researchers have discussed effective ways to deal with this phenomenon. In this regard, Yang, Chen, Ulgiati49 defined the association of the reduction of CO2 emissions for the quality of the air in Beijing, which gives new idea on framing neutral and real strategies for lessening the air pollution and the reduction of CO2 emission.
Stylized Facts of China
Figure 1 shows the environmental pollution and household health expenditure relationship for China. The figure clearly pictures, a similar increasing trend for both environmental pollution and household health expenditure over the period of time. In the year 2016, and onward household health expenditure has been drastically dropped, while environmental pollution showing flat demonstration after 2016. The significant downward trend in household health expenditure is due to the measures taken by the Chinese government in the health care system and other penetrative measures, to counter water and wastage pollution. These initiatives regarding the environment have lower down the respiratory and other heart problems being faced by the residents which resultantly reduce the burden of expenditures incurred by households. Figure 2 shows the trend of CO2 emissions and household health expenditure for the Chinese economy. To this context, the increasing trend can be witnessed for both CO2 emissions and household health expenditure. Like the nexus of environmental pollution and household health expenditure, the relationship between CO2 emissions and household health expenditure is seen having same pattern from 2016 and onward. As mentioned earlier in Figure 1, the Chinese government initiated structural reforms and improvements in its public health care system by initiating quality measures to counter the growing trend of CO2 emissions through renewable energy options in the industrial units and special SOPs for manufacturing concerns in regards to their production. These preventative measures for emission reduction have worked in reducing the emission of biomass gasses, which resultantly featured the wellbeing, standard of living and health of the residents and the same has helped in curtailing the out of pocket health expenditure of the residents.
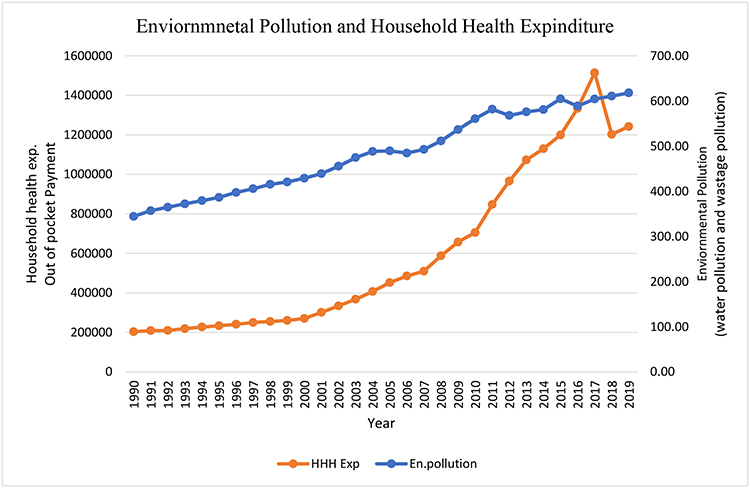 |
Figure 1 Environmental pollution and household health expenditures. |
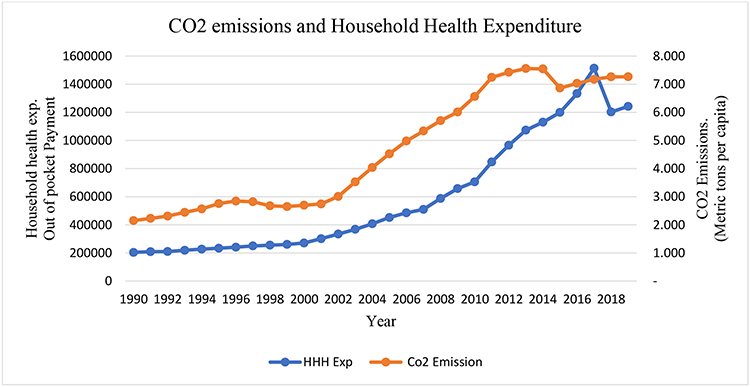 |
Figure 2 CO2 emissions and household health expenditure. |
Figure 3 exhibits the dynamic relationship between environmental pollution and CO2 emissions. As discussed earlier in Figure 2, both have shown increasing trend with household health expenditure and the same increasing trend can be seen in this figure. Since 1990 up to 2016, the up-surging trend in both environmental pollution and CO2 emissions is seen, mainly due to the trade liberalization and establishments of industrial zones and sectors in China and a heavy influx of FDI. This has caused environmental degradation. But due to the recent reforms made by the Chinese government has successfully worked to curb the growing flow and pattern of environmental pollution and CO2 emissions, due to which the wellbeing and living standard of the residents have been improved significantly in term of per capita income and health index.
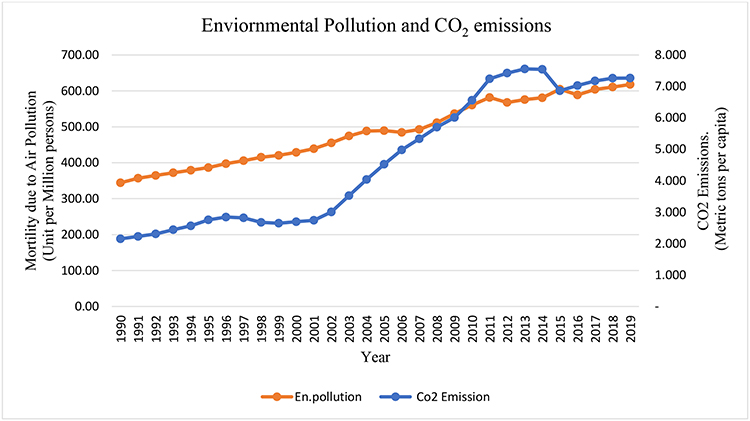 |
Figure 3 Environmental pollution and CO2 emissions. |
Methodology
Data Source, Sampling Method and Variables
We collect the data from the fourth National Health Service Survey (NHSS, 2008). WHO (Current health expenditure by financing schemes), and WDI, for the period 1990 to 2019. CO2 emissions are measured as metric tons per capita, while environmental pollution is measured as the combined index of both water pollution and wastage pollution. These units are taken by the previous researcher such as,50–52 and household health expenditure (HHHEx) is measured as the household out-of-pocket payment which in past studies has been similarly used.53,54
Models, and Econometric Techniques
This research is based on the asymmetric relationship between CO2 emissions, environmental pollution, and household health expenditure in China using the NARDL model. Annual data series for the period 1990–2019 have been used to calculate the relationship and predict results. For empirical evaluation, we recommend the following:

Below Equation is of linear form (1)

Where CO2 is Carbon dioxide emissions
E.P is used for environmental pollution
HHHE is used for household health expenditure.
The long-term association between two or more variables is determined by using the Auto regressive distributed lag (ARDL) technique, error correction model,55 and Granger causality according to econometric methodology. These models consider the asymmetrical type of relationship among the variables. Alternatively, linear correlation between variables is estimated over linear models of regression, which fail to capture the nonlinear behavior of the variables. Since in our case the house health expenditure and Co2 have a dynamic trend, therefore, it essential to use a nonlinear methodology for analysis. In light of the recent non-linear complexity of the variables, Shin, Yu, Greenwood-Nimmo56 expanded the Auto regressive distributed lag (ARDL) structure of Pesaran, Shin, Smith57 and Pesaran, Shin, Smith58 asymmetric ARDL with cointegration approach was used. This method can catch short-term instabilities and structural breaks (asymmetries). We examine the asymmetric impact of CO2 and environmental pollution on household health expenditures.
The actual long-term asymmetric equation of household health expenditures follows as:
(3)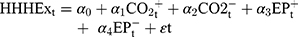
Where HHHEx indicate household health expenditure, CO2 is Carbon Dioxide Emissions, EP symbolizes environmental pollution, and a = (
 ) is a co-integrating matrix to be assessed. In Equation (3),
  ,
,  ,
,  and
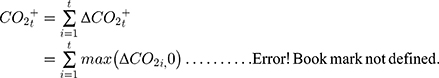
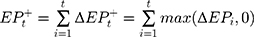
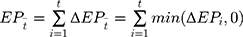
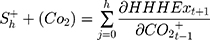
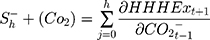
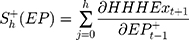
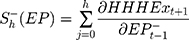
and  are fractional sums of negative and positive changes of CO2 emissions, environmental pollution, respectively in household health expenditures. Now we split the coefficients into negative and positive in order to present the asymmetric behavior of the variables as follows

Following Eq (2), developed by Shin, Yu, Greenwood-Nimmo,56 in the asymmetric ARDL system.
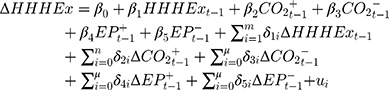
In Equation (8) we represented m, n, p, q, and r as lags orders. But,  ,
,  ,
,  ,
,  and
and  represent the long-term positive and negative shock effects of CO2 emissions and environmental pollution on household health expenditures.
 ,
,  ,
,  and
and  measured the short-term consequences of both positive and negative effects of CO2 emissions and environmental pollution on household health expenditures, correspondingly. In this analysis, the nonlinear long-term relationship is captured by using NARDL method. The asymmetric ARDL model takings subsequent steps. Firstly, through augmented Dickey–Fuller (ADF) and Phillips– Perron (PP) unit root tests the stationarity of all variables is tested. For the ARDL method, stationary inspection is not compulsory, when all the variables are strictly stationary at 1(0), or 1(1), or a combination of 1(1) or (0), we can employ the ARDL model. While there is some constraint in the model because the ARDL model cannot continue in the existence of 1(2) series.59 Therefore, for avoiding ambiguity in results we first check the stationarity of variables. In the second stage, Equation (8) is assessed by OLS. Additionally, we trailed the SIC information criterion and the general-to-specific method as followed by.60 In the third stage, co-integration is tested using the bound test to validate whether co-integration exists or not.
After the co-integration is endorsed then we use the asymmetric ARDL model. The asymmetric cumulative vibrant multiplier effects of one percent change are extracted in this step

Empirical Results and Strategy
Table 1 presents the descriptive statistics of the variables, while the essential condition for implementing the ARDL bound testing techniques is that at 1(2) as explained in Table 2, that it provides less restriction on the order of integration and we can use mix order of integration. Likewise, Ouattara,61 the outcome of ARDL will be unacceptable if any of the I (2) of any variable is incurred in the model. Hence, it is important to define the stationarity of the data. That is why, we used augmented Dickey–Fuller (ADF), and PP unit root tests, and the findings of both tests are shown in Table 2. The unit root test results indicated that household health expenditures, CO2 emissions, and environmental pollution are not stationary at level and all of them come to be stationary at the first difference. Additionally, we used Zivot, Andrews62 unit root testing procedure which deems structural breaks as stated by Perron,63 that the basic augmented Dickey–Fuller unit root test gives false results in structural breaks to refute the unit root’s null hypothesis. Studying the problem of structural splits, using the unit root test of Zivot, Andrews,62 we also observed that none of the variables is stationary at 1(2) (See Table 3). Therefore, it is verified that we can use ARDL bounds testing methodology as none of the series are stationary at 1(2) or over. Bahmani-Oskooee, Bohl64 argued that long-term relations vary on optimum lags. Stock and,65 also validated that applying many lags or utilizing less lags can avoid the most vital information of the model or trigger a worthless assessment. Hence, contemplating the significance of optimal lags, we employed only two lags as optimal resulting SIC information criteria. Table 4 describes bounds test outcomes in the nonlinear statements. The computed F-statistic value is greater than the upper bounds critical value at 5% level, which verifies asymmetrical co-integration. We should, therefore, lead to asymmetric ARDL formation. We projected Eq. (8) by utilizing the general-to specific methodology utilizing p=q=2 as optimal lags length. Shin, Yu, Greenwood-Nimmo,56 in their ground breaking research also adopted this approach to meet the final description of the asymmetric ARDL model. According to the general to a specific method, we dropped all the insignificant lagged regressors. Katrakilidis, Trachanas60 indicated that the removal of insignificant lagged regressors is required as the insignificant lagged regressors may generate noise in dynamic multipliers. We also test other primary regression problem, such as the normality of residuals for which we applied the Jarque–Bera method, the serial correlation has been checked through Breusch–Godfrey LM serial correlation test, heteroskedasticity has been tested through Breusch–Pagan–Godfrey test, and model stability with CUSUM and CUSUMSQ. The results of all tests listed are shown in Table 7. We have noticed that the model does not suffer from any of the problems, so we can move towards a realistic NARDL approach. It is also originating that structural breaks happened dramatically in 2008, and have had a long-term negative effect on the economy, this structural break can be attributed to the 2008 global financial crunch that has adversely impacted the world economy. The NARDL assessment findings are shown in Table 5. The research examines the long-term asymmetric relationship amongst CO2 emissions, environmental pollution, and household health expenditure in the context of China. Table 6 contains the results of long run asymmetric relationship.
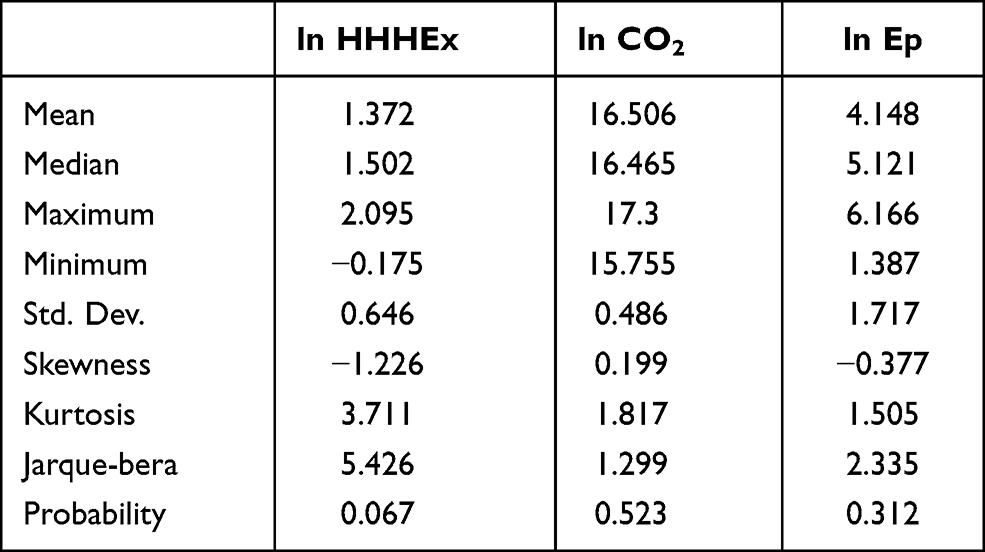 |
Table 1 Descriptive Statistics |
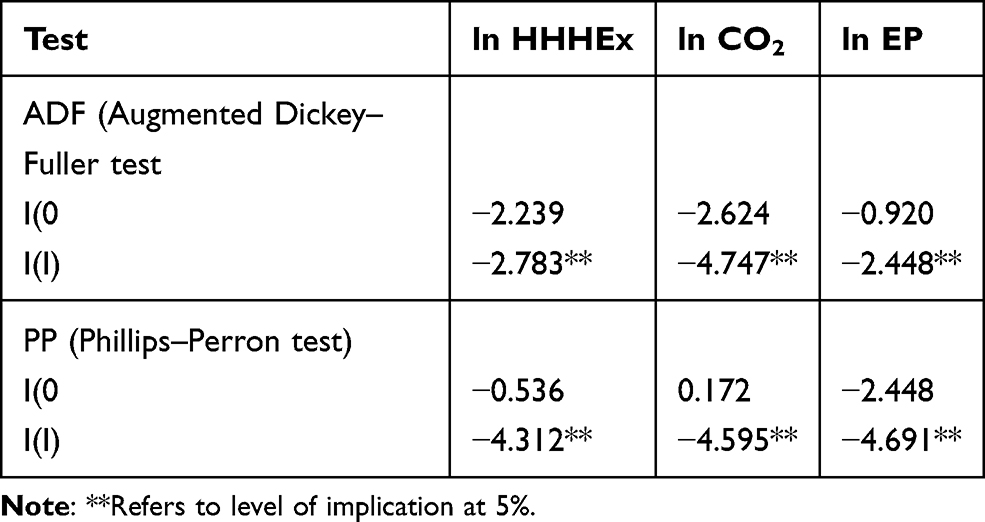 |
Table 2 ADF and PP Unit Root Tests |
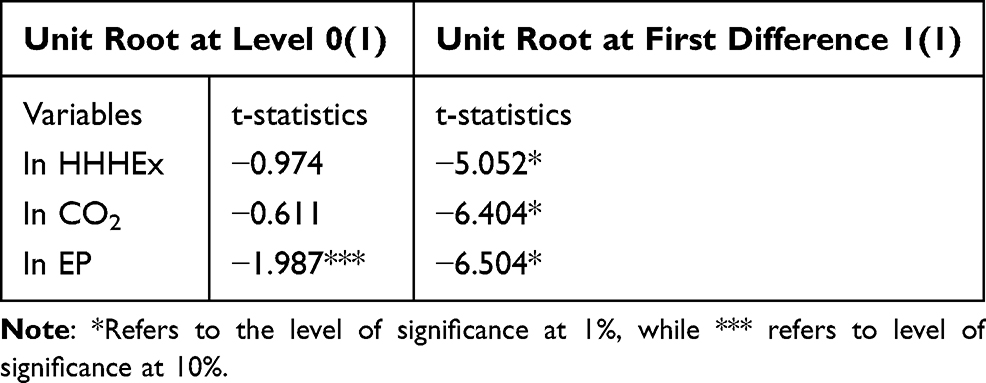 |
Table 3 Zivot and Andrews (1992) Unit Root Test |
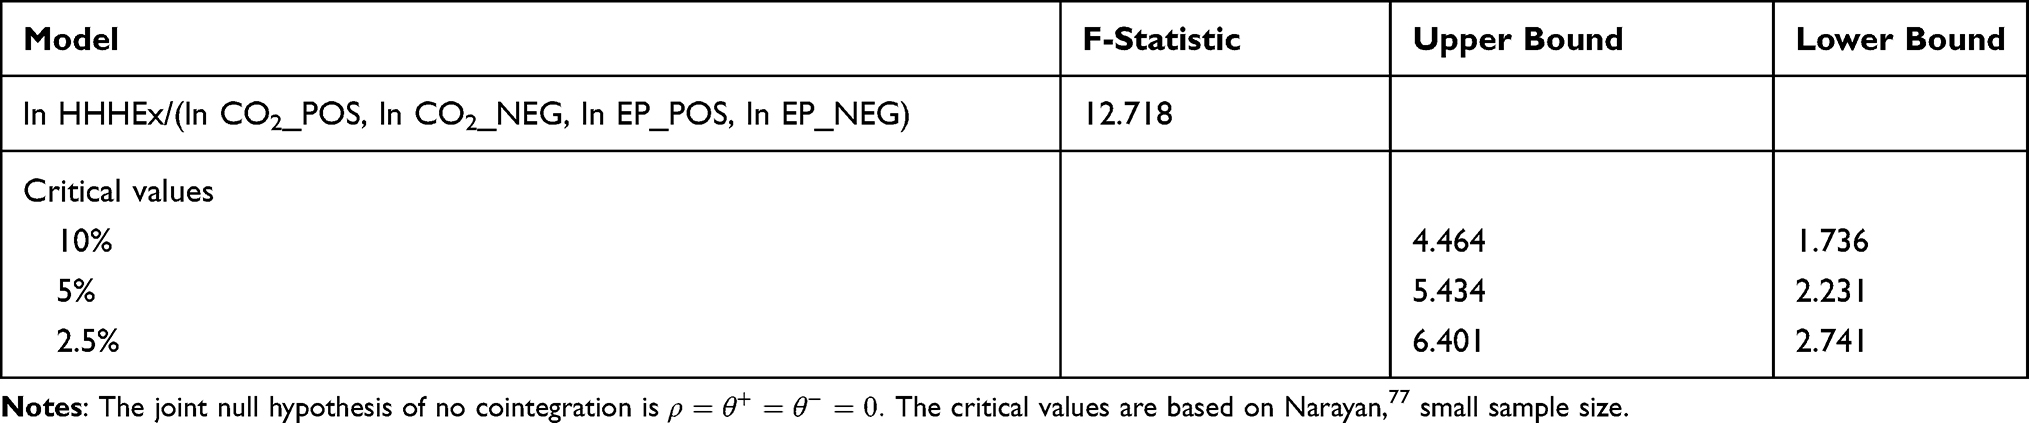 |
Table 4 Bounds Test Results in Nonlinear Specification |
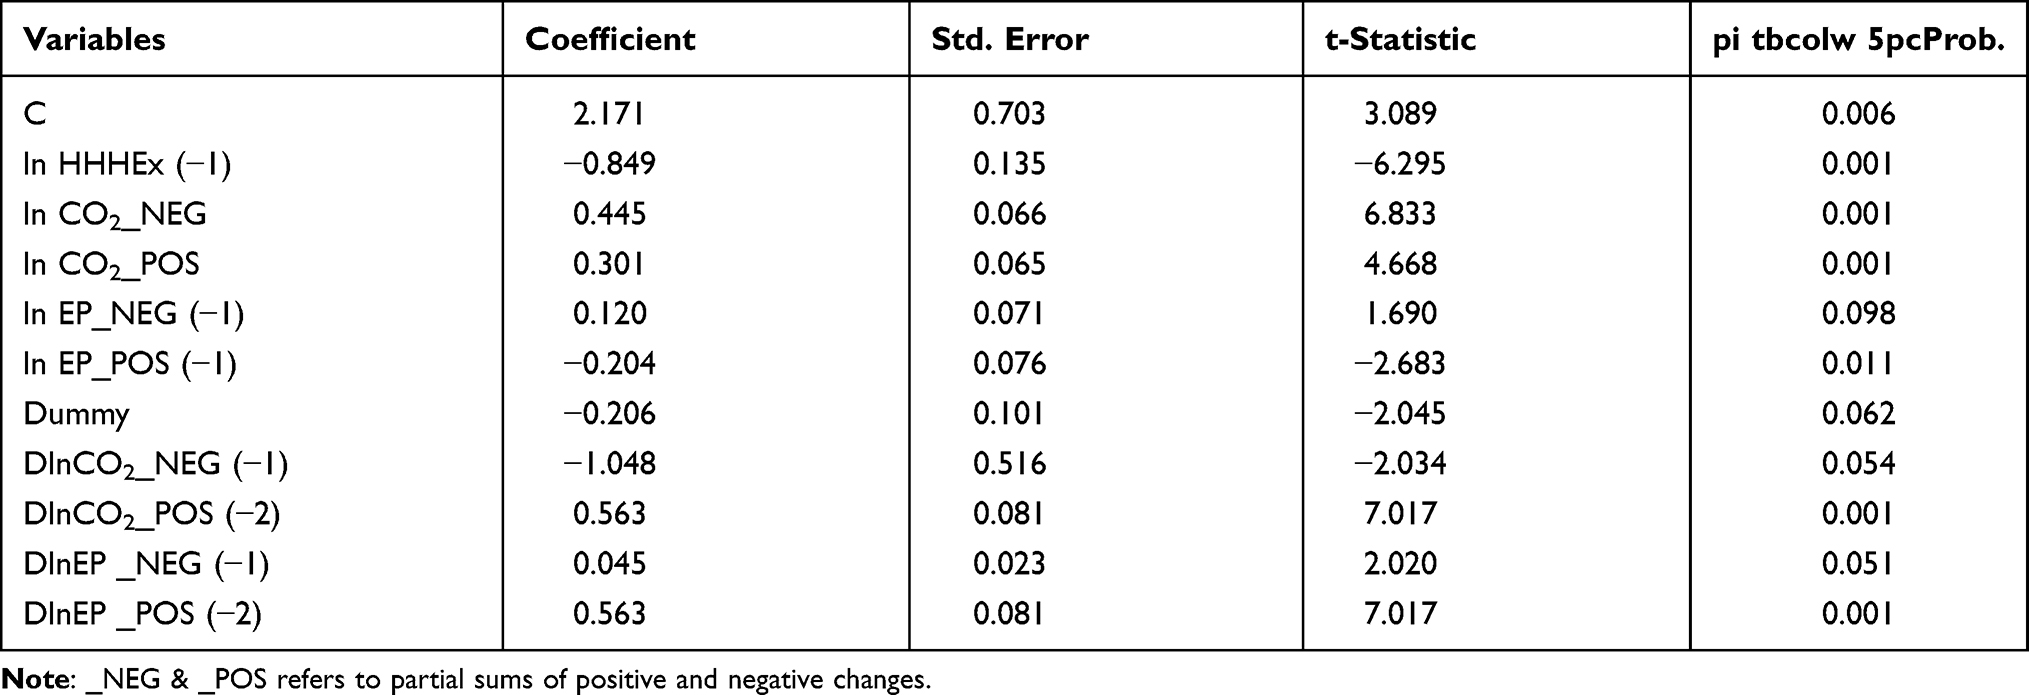 |
Table 5 Dynamic Estimation of NARDL Results |
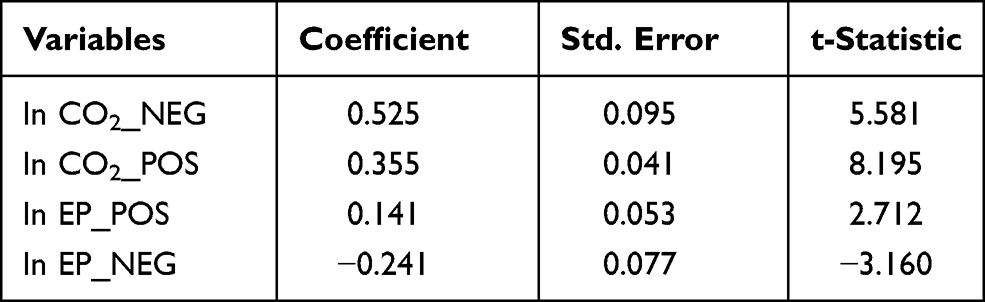 |
Table 6 Long-Run Asymmetric Relationship |
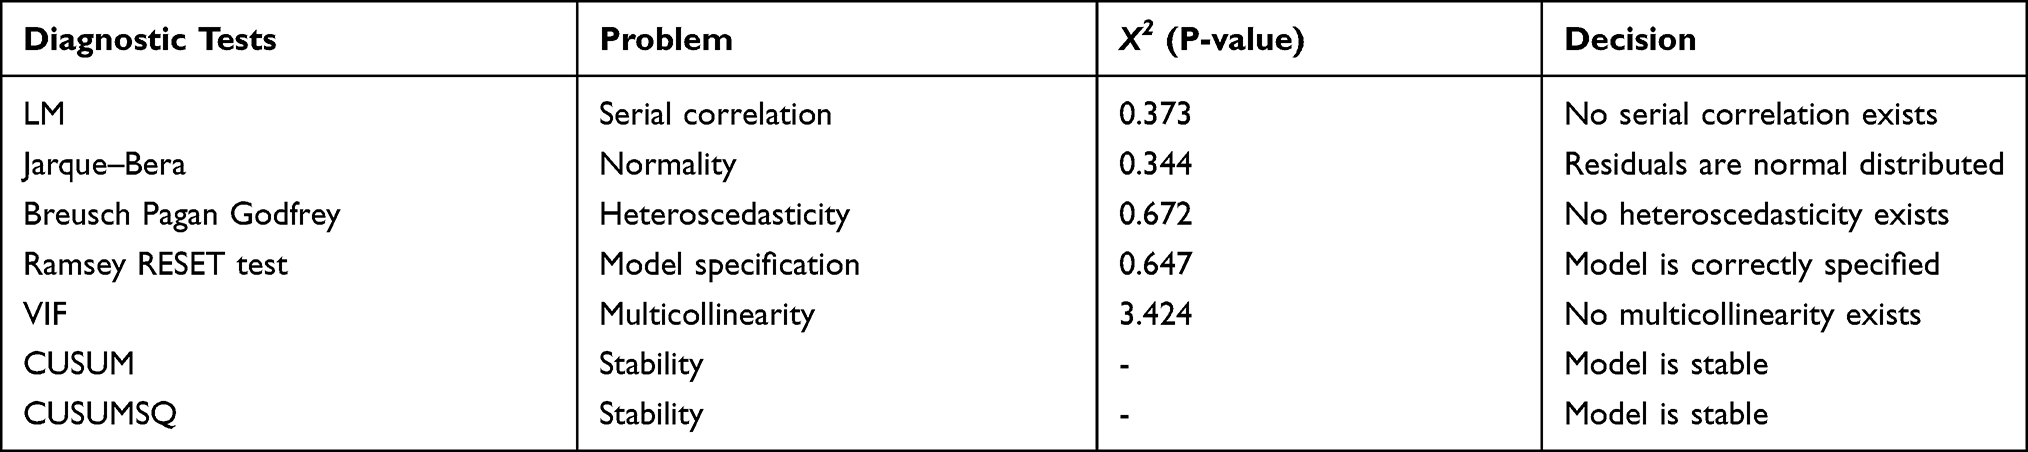 |
Table 7 Diagnostic Review |
The estimated variables long-term asymmetric association have been witnessed, as CO2 emissions and household health expenditures are correlated asymmetrically in the long run. It is noticed, because of the positive shock in CO2 emissions, the household health expenditures grow by 0.52%, while due to the negative shock in the CO2 emissions household health expenditures grow by 35%. Nevertheless, the sign of each coefficient is the same in size, but different direction which indicates the major asymmetric effect of CO2 emissions on household health expenditures. There are different studies that suggest a positive association between CO2 emissions and household health expenditures. CO2 emissions affect human health, it increases government expenditures, decreases in household saving etc. which ultimately positively affect the economy of any country.66,67 The main cause of asymmetric behavior of household health expenditures due to positive and negative changes in CO2 emissions is that when CO2 emissions increase in a country, their household health expenditures also tend to increase, while the reduction in CO2 emissions reduces household health expenditures. However, the positive change in CO2 emissions has a bigger impact than failure. Moreover, it has been found that environmental pollution has an asymmetric effect on household health expenditures. Subsequently, ensuing a negative shock account for the household health expenditures at a rate of 0.14%, whereas positive shock in environment pollution, the HHHEx accounts for 0.24% change. A significant difference in HHHEx is evident from the results is an answer to -ive and +ive variations in environmental pollution that is clear from the outcomes. Asymmetries can be found in the form of effect size as well as in the sign of coefficients. Several researchers verified results like.68,69 Compared with negative shock/decline in environmental emission, the amount of evidence-based and rational explanations for these associations that increased environmental pollution has a greater impact on household health expenditures. When environmental pollution increases, it directly affects human health which results in lungs infection and heart attacks and other health concerns for the residents. Farming and breathing toxic air in polluted environmental pollution raises the risk of cancer. Air pollution devastating the immune system.70 Environmental pollution disturbs the people’s lives and prosperity, and it raises the risk for foreign investors.71,72
A number of diagnostic tests were carried out prior to the final implementation of this asymmetric ARDL model. The results of those tests are recorded in Table 7. The X2(P-value) of LM and Breusch– Pagan–Godfrey tests are 0.373 and 0.672, correspondingly, which demonstrate that our model is free from serial correlation and heteroscedasticity. Furthermore, the Jarque–Bera test also confirmed residuals normality. The value reported (eg 0.647) of Ramsey RESET is also statistically insignificant, which describes that our model is defined correctly. The variance inflation factor (VIF) value is 3.424 which is less than 5, and it illustrates that our model has no multicollinearity problem. Additionally, we consider that our model is stable and all coefficients provide reliable results (See Table 7).73,74
Robustness Test
For further confirmation of the baseline NARDL model estimates, we applied Granger Causality test.75 Table 8 displays the findings of Granger Causality and we found a bidirectional causality between CO2 emissions, environmental pollution and household health expenditure as the F-statistics are significant in both cases for the relationships of each pairs.
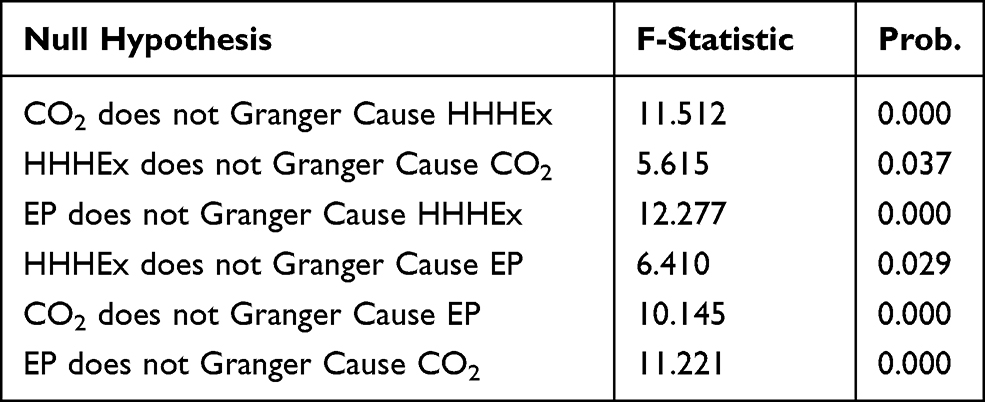 |
Table 8 Granger Causality Test |
Conclusion
As a result of China’s economic growth, air pollution, including carbon dioxide (CO2) emission, has caused serious health problems and accompanying heavy economic burdens on healthcare.14 This study contributes to the existing literature by finding the asymmetric nexus between CO2 emissions, environmental pollution and household health expenditure in the context of China. This study is a novel attempt in the area of environment and health. The inclusion of household health expenditure has been found touch missing in terms of the relationship with CO2 emissions and environmental pollution. We prefer Non-liner methodology by using NARDL to find the asymmetric dynamic nexus between CO2 emissions, environmental pollution and household health expenditure. Our results support many previous studies, documenting that CO2 emissions positively contribute to the amount of household health expenditure, confirming the asymmetric relationship between CO2 emissions and household health expenditure. The results also confirm the statistically significant and asymmetrically positive relationship between environmental pollution and household health expenditure. The result findings are in parallel with Bernstein, Alexis, Barnes, Bernstein, Nel, Peden, Diaz-Sanchez, Tarlo, Williams15 applied ARDL methodology, and argued that CO2 emissions promote a polluted environment, which directly affects human health and creates health concerns for the residents. Moreover, our results demonstrate that CO2 emissions and environmental pollution both positively contribute to the individual household health expenditure, implying that Chinese residents have to bear more household health expenditure, in case of more CO2 emissions and a greater amount of environmental pollution.
This study contributed to the existing knowledge by further highlighting the importance of globally acknowledged consequences of CO2 emissions on heath well-being in society. However, in developing economies the possible interlinks between population urbanization and health expenses increase have been ignored in the present literature, especially in the context of low-income residencies. This piece of research focuses on the health problems faced by low-income residency people who struggle with their health increasing expenses, due to the environmental pollution and greater CO2 emissions caused by industrialization activities.76 Thus, greater concerns arise for the stakeholders to focus on bringing equilibrium in certain situations.
Based on the results, we establish policy implications that would be handy for societal development and growth of the country. Firstly, we argue that the concentration of population urbanization in developing economies has linkage with health expenditure and trade activities. There is a need for special attention on the part of the government and other interested stakeholders, to center around their health development policy to the needs of older persons with disabilities, women, and children. Our study points out the valuable direction of financial investments which aims to provide public services and goods. Finally, for sustainable health development, consider all the possible ways to promote sustainable economic growth and orderly population urbanization which improves the well-being of the society. Secondly, the government of China should lower down the use of hydro machines in their production units and should set standard procedures for those industries contributing to the greater amount of CO2 emissions to curb this phenomenon, as it directly affects resident’s health, wellbeing and financial structure in the country. Thirdly, the government of China should promulgate special legislation through National People’s Congress to counter and control urbanization, air pollution, municipal waste water and mine waste, this effort will lower down the volume of environmental pollution. Fourth, Chania’s government should identify and control pollution sources through central monitoring stations, which will co-operate with local environmental protection organizations to overcome these issues well in time. Fifth, the government should frame an adequate, supportive and robust public health system to facilitate the wellbeing of the people both in rural and urban territories.
Future studies should include more health-related variables with urbanization related focus to capture closely the urbanization policies implemented by the government to examine its effect on the health expenditure of low-income residents. Likewise, future studies can also be conducted by using comparative cases if two or more countries with somehow similar population, health systems and trade behavior are used. Moreover, country legislation and statutory framework as a moderator in the relationship of these variables will also provide a new insight to the researchers. In addition, the regional comparison would also be a novel attempt in the existing body of literature.
Acknowledgment
I would like to extend my gratitude to my professor Mr Han Jia Bin for his encouragement and advice by making sure this work has been carried out in a timely and appropriate manner. National Social Science Fund Project (18BJL032).
Disclosure
The authors report no conflicts of interest for this work.
References
1. Khoshnevis Yazdi S, Khanalizadeh B. Air pollution, economic growth and health care expenditure. Econ Res. 2017;30(1):1181–1190. doi:10.1080/1331677X.2017.1314823
2. Currie J, Neidell M, Schmieder JF. Air pollution and infant health: lessons from New Jersey. J Health Econ. 2009;28(3):688–703. doi:10.1016/j.jhealeco.2009.02.001
3. Jerrett M, Eyles J, Dufournaud C, Birch S. Environmental influences on healthcare expenditures: an exploratory analysis from Ontario, Canada. J Epidemiol Community Health. 2003;57(5):334–338. doi:10.1136/jech.57.5.334
4. Yuanjun H, Zhongxing Z. Environmental pollution and control measures in China. Ambio. 1987;16(5):257–261.
5. Shi L. Health care in China: a rural-urban comparison after the socioeconomic reforms. Bull World Health Organ. 1993;71(6):723.
6. Zhu N, Ling Z, Shen J, Lane J, Hu S. Factors associated with the decline of the cooperative medical system and barefoot doctors in rural China. Bull World Health Organ. 1989;67(4):431.
7. Liu Y. Development of the rural health insurance system in China. Health Policy Plan. 2004;19(3):159–165. doi:10.1093/heapol/czh019
8. Organization WH. The World Health Report 2000: Health Systems: Improving Performance. World Health Organization; 2000.
9. Routh S, Thwin AA, Barb N, Begum A. Cost efficiency in maternal and child health and family planning service delivery in Bangladesh: implications for NGOs. Health Policy Plan. 2004;19(1):11–21. doi:10.1093/heapol/czh002
10. Wang Z, Yang L. Delinking indicators on regional industry development and carbon emissions: Beijing–Tianjin–Hebei economic band case. Ecol Indic. 2015;48:41–48. doi:10.1016/j.ecolind.2014.07.035
11. Liu Z, Guan D, Crawford-Brown D, Zhang Q, He K, Liu J. A low-carbon road map for China. Nature. 2013;500(7461):143–145. doi:10.1038/500143a
12. Fan Y-Z, Yu Y-W, Xu D, et al. A supramassive magnetar central engine for GRB 130603B. Astrophys J Lett. 2013;779(2):L25. doi:10.1088/2041-8205/779/2/L25
13. Chen L, Zhuo Y, Xu Z, Xu X, Gao X. Is carbon dioxide (CO2) emission an important factor affecting healthcare expenditure? Evidence from China, 2005–2016. Int J Environ Res Public Health. 2019;16(20):3995. doi:10.3390/ijerph16203995
14. Xu X, Xu Z, Chen L, Li C. How does industrial waste gas emission affect health care expenditure in different regions of China: an application of bayesian quantile regression. Int J Environ Res Public Health. 2019;16(15):2748. doi:10.3390/ijerph16152748
15. Bernstein JA, Alexis N, Barnes C, et al. Health effects of air pollution. J Allergy Clin Immunol. 2004;114(5):1116–1123. doi:10.1016/j.jaci.2004.08.030
16. Apergis N, Jebli MB, Youssef SB. Does renewable energy consumption and health expenditures decrease carbon dioxide emissions? Evidence for sub-Saharan Africa countries. Renew Energy. 2018;127:1011–1016. doi:10.1016/j.renene.2018.05.043
17. Chaabouni S, Saidi K. The dynamic links between carbon dioxide (CO2) emissions, health spending and GDP growth: a case study for 51 countries. Environ Res. 2017;158:137–144. doi:10.1016/j.envres.2017.05.041
18. Yahaya A, Nor NM, Habibullah MS, Ghani JA, Noor ZM. How relevant is environmental quality to per capita health expenditures? Empirical evidence from panel of developing countries. SpringerPlus. 2016;5(1):925. doi:10.1186/s40064-016-2505-x
19. Apergis N, Gupta R, Lau CKM, Mukherjee Z. US state-level carbon dioxide emissions: does it affect health care expenditure? Renew Sust Energ Rev 2018;91:521–530. doi:10.1016/j.rser.2018.03.035
20. Ghorashi N, Alavi RA. Impact of banking development on CO2 emissions in Iran. Tolooebehdasht. 2017;16(3):81–92.
21. Murthy NV, Ukpolo V. Aggregate health care expenditure in the United States: evidence from cointegration tests. Appl Econ. 1994;26(8):797–802. doi:10.1080/00036849400000094
22. Chaabouni S, Zghidi N, Mbarek MB. On the causal dynamics between CO2 emissions, health expenditures and economic growth. Sustainable Cities and Society. 2016;22:184–191. doi:10.1016/j.scs.2016.02.001
23. Narayan PK, Narayan S. Modelling oil price volatility. Energy Policy. 2007;35(12):6549–6553. doi:10.1016/j.enpol.2007.07.020
24. Liu M, Lu S, Song Y, et al. Microplastic and mesoplastic pollution in farmland soils in suburbs of Shanghai, China. Environ Pollut. 2018;242:855–862. doi:10.1016/j.envpol.2018.07.051
25. Li Q, Li X, Jiang J, et al. Semi-coke briquettes: towards reducing emissions of primary PM 2.5, particulate carbon and carbon monoxide from household coal combustion in China. Sci Rep. 2016;6(1):1–10. doi:10.1038/s41598-016-0001-8
26. Zhang X, Wang Y. How to reduce household carbon emissions: a review of experience and policy design considerations. Energy Policy. 2017;102:116–124. doi:10.1016/j.enpol.2016.12.010
27. Lu Z-N, Chen H, Hao Y, Wang J, Song X, Mok TM. The dynamic relationship between environmental pollution, economic development and public health: evidence from China. J Clean Prod. 2017;166:134–147. doi:10.1016/j.jclepro.2017.08.010
28. Chen X, Shao S, Tian Z, Xie Z, Yin P. Impacts of air pollution and its spatial spillover effect on public health based on China’s big data sample. J Clean Prod. 2017;142:915–925. doi:10.1016/j.jclepro.2016.02.119
29. Li S, Tan H-Y, Wang N, et al. The role of oxidative stress and antioxidants in liver diseases. Int J Mol Sci. 2015;16(11):26087–26124. doi:10.3390/ijms161125942
30. Guan W-J, Zheng X-Y, Chung KF, Zhong N-S. Impact of air pollution on the burden of chronic respiratory diseases in China: time for urgent action. Lancet. 2016;388(10054):1939–1951. doi:10.1016/S0140-6736(16)31597-5
31. Fang EF, Kassahun H, Croteau DL, et al. NAD+ replenishment improves lifespan and healthspan in ataxia telangiectasia models via mitophagy and DNA repair. Cell Metab. 2016;24(4):566–581. doi:10.1016/j.cmet.2016.09.004
32. Zhao J, Li Y, Yang G, et al. Efficient organic solar cells processed from hydrocarbon solvents. Nature Energy. 2016;1(2):1–7. doi:10.1038/nenergy.2015.27
33. Neidell MJ. Air pollution, health, and socio-economic status: the effect of outdoor air quality on childhood asthma. J Health Econ. 2004;23(6):1209–1236. doi:10.1016/j.jhealeco.2004.05.002
34. Ebenstein A. The consequences of industrialization: evidence from water pollution and digestive cancers in China. Rev Econ Stat. 2012;94(1):186–201. doi:10.1162/REST_a_00150
35. Xu K, Evans DB, Kawabata K, Zeramdini R, Klavus J, Murray CJ. Household catastrophic health expenditure: a multicountry analysis. Lancet. 2003;362(9378):111–117. doi:10.1016/S0140-6736(03)13861-5
36. Haskell WL, Lee I-M, Pate RR, et al. Physical activity and public health: updated recommendation for adults from the American College of Sports Medicine and the American Heart Association. Circulation. 2007;116(9):1081.
37. Gerdtham U-G, Søgaard J, Andersson F, Jönsson B. An econometric analysis of health care expenditure: a cross-section study of the OECD countries. J Health Econ. 1992;11(1):63–84. doi:10.1016/0167-6296(92)90025-V
38. Jütting JP. Do community-based health insurance schemes improve poor people’s access to health care? Evidence from rural Senegal. World Dev. 2004;32(2):273–288. doi:10.1016/j.worlddev.2003.10.001
39. Li Y, Baldassi M, Johnson EJ, Weber EU. Complementary cognitive capabilities, economic decision making, and aging. Psychol Aging. 2013;28(3):595. doi:10.1037/a0034172
40. Narayan PK, Narayan S. Does environmental quality influence health expenditures? Empirical evidence from a panel of selected OECD countries. Ecol Econ. 2008;65(2):367–374. doi:10.1016/j.ecolecon.2007.07.005
41. Anyanwu JC, Erhijakpor AE. Health expenditures and health outcomes in Africa. Afr Dev Rev. 2009;21(2):400–433. doi:10.1111/j.1467-8268.2009.00215.x
42. Aunan K, Berntsen TK, Myhre G, et al. Radiative forcing from household fuel burning in Asia. Atmos Environ. 2009;43(35):5674–5681. doi:10.1016/j.atmosenv.2009.07.053
43. Wang T, Watson J. China’s carbon emissions and international trade: implications for post-2012 policy. Climate Policy. 2008;8(6):577–587. doi:10.3763/cpol.2008.0531
44. Gregg JS, Andres RJ, Marland G. China: emissions pattern of the world leader in CO2 emissions from fossil fuel consumption and cement production. Geophys Res Lett. 2008;35(8). doi:10.1029/2007GL032887
45. Qiyong X, Jiaoju G. Reduction of CO2 emission using bioreactor technology for waste management in China. Energy Procedia. 2011;5:1026–1031. doi:10.1016/j.egypro.2011.03.181
46. Balance N. Netherlands Environmental Assessment Agency. Bilthoven; 2008.
47. El Arafy RAET. Discrimination of various rock units in Abu Zenima area, Southwestern Sinai, Egypt, with emphases to the radioactive areas using the hyperspectral remote sensing and GIS techniques, The University of Alabama at Birmingham; 2016
48. Lee JW, Brahmasrene T. Investigating the influence of tourism on economic growth and carbon emissions: evidence from panel analysis of the European Union. Tour Manag. 2013;38(69):69–76. doi:10.1016/j.tourman.2013.02.016
49. Yang S, Chen B, Ulgiati S. Co-benefits of CO2 and PM2. 5 emission reduction. Energy Procedia. 2016;104:92–97. doi:10.1016/j.egypro.2016.12.017
50. Hanle LJ, Jayaraman KR, Smith JS. CO2 emissions profile of the US cement industry. Washington DC: Environmental Protection Agency 2004.
51. Rohde RA, Muller RA, Ding A. Air pollution in China: mapping of concentrations and sources. PLoS One. 2015;10(8):e0135749. doi:10.1371/journal.pone.0135749
52. Matus K, Nam K-M, Selin NE, Lamsal LN, Reilly JM, Paltsev S. Health damages from air pollution in China. Global Environ Change. 2012;22(1):55–66. doi:10.1016/j.gloenvcha.2011.08.006
53. Laokri S, Soelaeman R, Hotchkiss DR. Assessing out-of-pocket expenditures for primary health care: how responsive is the Democratic Republic of Congo health system to providing financial risk protection? BMC Health Serv Res. 2018;18(1):451. doi:10.1186/s12913-018-3211-x
54. You X, Kobayashi Y. Determinants of out-of-pocket health expenditure in China. Appl Health Econ Health Policy. 2011;9(1):39–49. doi:10.2165/11530730-000000000-00000
55. Kecman V. Learning and Soft Computing: Support Vector Machines, Neural Networks, and Fuzzy Logic Models. MIT press; 2001.
56. Shin Y, Yu B, Greenwood-Nimmo M. Modelling asymmetric cointegration and dynamic multipliers in a nonlinear ARDL framework. In: Festschrift in Honor of Peter Schmidt. Springer; 2014:281–314.
57. Pesaran MH, Shin Y, Smith RP. Pooled mean group estimation of dynamic heterogeneous panels. J Am Stat Assoc. 1999;94(446):621–634. doi:10.1080/01621459.1999.10474156
58. Pesaran MH, Shin Y, Smith RJ. Bounds testing approaches to the analysis of level relationships. J Appl Econ. 2001;16(3):289–326. doi:10.1002/jae.616
59. Aminu IM. Mediating role of access to finance and moderating role of business environment on the relationship between strategic orientation attributes and performance of small and medium enterprises in Nigeria, Universiti Utara Malaysia; 2015.
60. Katrakilidis C, Trachanas E. What drives housing price dynamics in Greece: new evidence from asymmetric ARDL cointegration. Econ Model. 2012;29(4):1064–1069. doi:10.1016/j.econmod.2012.03.029
61. Ouattara B. Modelling the Long Run Determinants of Private Investment in Senegal. Credit Research Paper; 2004.
62. Zivot E, Andrews DWK. Further evidence on the great crash, the oil-price shock, and the unit-root hypothesis. J Bus Econ Stat. 2002;20(1):25–44. doi:10.1198/073500102753410372
63. Perron P. The great crash, the oil price shock, and the unit root hypothesis. Econometrica. 1989;57(6):1361–1401. doi:10.2307/1913712
64. Bahmani-Oskooee M, Bohl MT. German monetary unification and the stability of the German M3 money demand function. Econ Lett. 2000;66(2):203–208. doi:10.1016/S0165-1765(99)00223-2
65. Watson J. The Double Helix. Hachette UK; 2012.
66. Maki DM, Palumbo M. Disentangling the wealth effect: a cohort analysis of household saving in the 1990s; 2001.
67. Confalonieri U, Menne B, Akhtar R, et al. Human Health. Cambridge: Cambridge University Press; 2007.
68. Öcal N, Yildirim J. Regional effects of terrorism on economic growth in Turkey: a geographically weighted regression approach. J Peace Res. 2010;47(4):477–489. doi:10.1177/0022343310364576
69. Azam M, Khan AQ, Ozturk I. The effects of energy on investment, human health, environment and economic growth: empirical evidence from China. Environ Sci Pollut Res. 2019;26(11):10816–10825. doi:10.1007/s11356-019-04497-4
70. Mortimer K, Neugebauer R, Lurmann F, Alcorn S, Balmes J, Tager I. Air pollution and pulmonary function in asthmatic children: effects of prenatal and lifetime exposures. Epidemiology. 2008;19(4):550–557. doi:10.1097/EDE.0b013e31816a9dcb
71. Porter G. Trade competition and pollution standards: “race to the bottom” or “stuck at the bottom”. J Environ Dev. 1999;8(2):133–151. doi:10.1177/107049659900800203
72. Li S. The Legal Environment and Risks for Foreign Investment in China. Springer Science & Business Media; 2007.
73. Thompson CG, Kim RS, Aloe AM, Becker BJ. Extracting the variance inflation factor and other multicollinearity diagnostics from typical regression results. Basic Appl Soc Psych. 2017;39(2):81–90. doi:10.1080/01973533.2016.1277529
74. Leung SF, Yu S. On the choice between sample selection and two-part models. J Econom. 1996;72(1–2):197–229. doi:10.1016/0304-4076(94)01720-4
75. Granger CW. Investigating causal relations by econometric models and cross-spectral methods. Econometrica. 1969;37(3):424–438. doi:10.2307/1912791
76. Dong F, Wang Y, Su B, Hua Y, Zhang Y. The process of peak CO2 emissions in developed economies: a perspective of industrialization and urbanization. Resour Conserv Recycl. 2019;141:61–75. doi:10.1016/j.resconrec.2018.10.010
77. Narayan PK. The structure of tourist expenditure in Fiji: evidence from unit root structural break tests. Appl Econ. 2005;37(10):1157–1161. doi:10.1080/00036840500109373
 © 2021 The Author(s). This work is published and licensed by Dove Medical Press Limited. The
full terms of this license are available at https://www.dovepress.com/terms
and incorporate the Creative Commons Attribution
- Non Commercial (unported, 3.0) License.
By accessing the work you hereby accept the Terms. Non-commercial uses of the work are permitted
without any further permission from Dove Medical Press Limited, provided the work is properly
attributed. For permission for commercial use of this work, please see paragraphs 4.2 and 5 of our Terms.
© 2021 The Author(s). This work is published and licensed by Dove Medical Press Limited. The
full terms of this license are available at https://www.dovepress.com/terms
and incorporate the Creative Commons Attribution
- Non Commercial (unported, 3.0) License.
By accessing the work you hereby accept the Terms. Non-commercial uses of the work are permitted
without any further permission from Dove Medical Press Limited, provided the work is properly
attributed. For permission for commercial use of this work, please see paragraphs 4.2 and 5 of our Terms.