")
Back to Journals » Clinical, Cosmetic and Investigational Dermatology » Volume 15
Exploration of Potential Biomarkers for Type 2 Diabetes by UPLC-QTOF-MS and WGCNA of Skin Surface Lipids
Authors Li H, Ma Y, Feng N, Wang W, He C
Received 1 November 2021
Accepted for publication 23 December 2021
Published 18 January 2022 Volume 2022:15 Pages 87—96
DOI https://doi.org/10.2147/CCID.S347245
Checked for plagiarism Yes
Review by Single anonymous peer review
Peer reviewer comments 2
Editor who approved publication: Dr Jeffrey Weinberg
Huike Li,1 Yuchen Ma,1 Nan Feng,2 Wenbo Wang,2 Congfen He1
1Beijing Key Laboratory of Plants Resource Research and Development, School of Chemistry and Materials Engineering, Beijing Technology and Business University, Beijing, People’s Republic of China; 2Department of Endocrinology, Peking University Shougang Hospital, Beijing, People’s Republic of China
Correspondence: Congfen He
Beijing Key Laboratory of Plants Resource Research and Development, School of Chemistry and Materials Engineering, Beijing Technology and Business University, Beijing, 100048, People’s Republic of China
Tel +86 188 0011 0801
Fax +86 1068984946
Email [email protected]
Background: Diabetes has become popular and has become one of the most important global health care challenges. Patients with diabetes have a high incidence of skin diseases. Cell and animal models are often used to study the skin conditions of people with diabetes.
Methods: In this study, a volunteer questionnaire survey, skin lipomics analysis based on ultra-high performance liquid chromatography-quadrupole tandem time-of-flight mass spectrometry (UPLC-QTOF-MS), and weighted gene co-expression network analysis (WGCNA) were used to study the differences in skin conditions and skin lipids of participants with type 2 diabetes mellitus (Group D) versus healthy individuals (Group H) and the correlation between these groups. The questionnaire was used to investigate personal basic, diabetes, and facial skin status information of 77 female volunteers aged 55– 65 years old from the Peking University Shougang Hospital. The facial skin lipids of all volunteers were analysed by UPLC-QTOF-MS technique; the differential lipids between groups D and H were analysed by partial least-squared discriminant and univariate analysis.
Results: In total, 23 kinds of differential lipids were identified, all of which belonged to sphingolipids. The use of WGCNA combined clinical information with lipid analysis to study the relationship between glycosylated haemoglobin, skin pigmentation/non-pigmentation, and skin lipids. Two types of lipids were identified to distinguish between hub lipids of high and low glycosylated haemoglobin; 12 types of lipids were identified that could distinguish between the hub lipids of pigmented and non-pigmented participants (PLS-DA).
Conclusion: The experimental results not only provide a reference for the diagnosis and classification of diabetes via analysing the skin lipids of patients, but also provides a theoretical basis for further study on the effects of diabetes on the skin of patients.
Keywords: diabetes, skin lipidomics, UPLC-QTOF-MS, WGCNA
Introduction
In the past few decades, diabetes has become popular and has become one of the most important global health care challenges due to its associated morbidity and mortality.1 It is estimated that approximately 8.3% of the world’s population suffer from diabetes, some of which are undiagnosed, whereas 21.4% of the 34.1 million people in the United States and 63.5% of the 114.4 million people in China have diabetes.2 According to reports, the global prevalence of diabetes patients in 2015 is estimated to be 415 million, and this number is expected to reach 642 million by 2040.3 There are two main subgroups of diabetes type-1 and type 2, of which type 2 diabetes (T2D) accounts for more than 80% of all diabetic patients. The main feature of T2 is insulin resistance.4 The complications associated with diabetes the result of a combination of factors such as metabolism, hormones, environment, and genetics, which can affect all organ systems including the skin. Worldwide, 97% of T2D patients suffer from skin diseases.5 Additionally, infectious dermatological conditions are more common in patients with T2D.6
Skin surface lipids (SSL), which are derived from the epidermis and sebaceous glands, and their composition changes depending on where these compounds are produced on the skin. Through skin lipidomics analysis, it has been identified that the intercellular lipids of the stratum corneum are supplied by sebum. Sebum is produced in the sebaceous glands and is rich in triglycerides, wax esters and squalene. In addition, sebaceous glands secrete glycerin and vitamin E to maintain the moisturizing function of the stratum corneum.7
Lipidomics is an important branch of metabolomics and has been widely used to obtain total lipids in biological systems. In recent years, an increasing number of studies have used lipidomics to detect changes in lipid species to identify specific biomarkers for various diseases.8–10 Ultra-high-performance liquid chromatography combined with quadrupole time-of-flight mass spectrometry (UPLC-QTOF-MS) is a combination of UPLC and high-resolution mass spectrometry, which can obtain richer and clearer substance information, and is currently the most commonly used lipid analysis method. Some studies based on UPLC-QTOF-MS method accurately and effectively analyze the metabolic changes in rat biosamples over time to study the metabolic process of drugs in the body.11,12
Weighted gene co-expression network analysis (WGCNA) is a systems biology method for mining gene association patterns between samples. Gene clusters (modules) are identified with close coordination changes, and then the target module according to the correlation within the module and the degree of correlation with external information is obtained. In comparison to methods that only focus on gene with differences, WGCNA analyzes the information of all genes, correlation expression coefficient between molecules to measure the co-expression relationship between molecules, and simplifies the high-dimensional data into several biologically meaningful modules related to phenotypic information.13
In this study, UPLC-QTOF-MS was used to obtain lipid spectrum data of the facial skin samples of patients with T2D and healthy individuals. These data and data from PLS-DA were subjected to pattern recognition analysis to identify lipid markers that showed significant differences under the screening conditions. Simultaneously, WGCNA was used to analyze the relationship between facial skin lipids and clinical data, looking for SSL that can identify facial skin conditions associated with T2D patients. We hope that these data will provide a useful theoretical basis for the development of facial skin care products for people with T2D.
Materials and Methods
Chemicals and Reagents
Analytical grade methanol, acetone and chloroform were purchased from Beijing Chemical Works. LC‐MS grade ammonium formate, isopropanol, acetonitrile and formic acid were obtained from Thermo Fisher Scientific. Distilled water was obtained from Watsons. Sebutape® was purchased from Cuderm Corporation.
Participants
A total of 77 female participants (42 T2D patients and 35 healthy people) aged 55–65 years from Beijing were enrolled in this study. Our inclusion criteria for participants were menopause and no other skin disorders. The T2D grade was assessed by an endocrinologist using the China Guideline for Type 2 Diabetes.14 Informed consent was obtained from each participant before any samples were collected. The study was conducted in accordance with the Declaration of Helsinki, and the study was approved by the Ethics Committee of the Beijing University Shougang Hospital (SHERLL2019030).
The participants washed their faces with clean water and were seated in an environment with a relative humidity of 50% at 20°C for 30 minutes. The lipids were subsequently collected using Sebutape® test strips which were pasted on the right side of the foreheads for 3 minutes. The tape was subsequently collected and added to 1.5 mL sample tubes, and stored at −80°C. Blood glucose 2 hours after meal (BG), glycohemoglobin (HbA1c) were measured as previously described.15 The SSL collected on the Sebutape® were gathered using modified Bligh and Dyer method.16 Specific methods refer to our previous experiment.17
Sample Preparation
In order to extract skin lipids, a modified Bligh and Dyer method was used for sample processing. Add a mixture of chloroform and methanol to the sample. The components were mixed thoroughly by vortexing for 3 minutes. Next, an equal volume of acetone was added to each sample, followed by vortexing for 10 minutes at room temperature. The Sebutape® test strips were then removed from the test tubes, and the remaining lipid extract was dried with a nitrogen‐blowing instrument. Finally, a mixed reagent (methanol: isopropanol) was used to dissolve lipids for testing. Quality controls (QCs) were prepared by mixing equal volumes of each analytical sample and running these QCs after every 10 samples.
UPLC-MS Analysis
UPLC Conditions
Chromatography column: Waters UPLC CSH C18 (1.7 μm, 2.1 mm × 100 mm); mobile phase: A (acetonitrile: water, 4:6; 0.1% formic acid; and 10 mmol/L ammonium formate) and B (acetonitrile: isopropanol,9:1; 0.1% formic acid; and 10 mmol/L ammonium formate);flow rate: 0.3 mL/min; sample volume: 2.0 μL; and column temperature:50°C.
MS Conditions
Mass spectrometry detection was operated using a mass spectrometer purchased from waters, equipped with a positive electrospray ionization (ESI+) source and with a mass scanning range of 50–1200 M/Z. The source and desolation temperatures were set at 120°C and 500°C, respectively. The capillary voltage was set at 2.0 kV, the desolvation gas flow was set at 800 L/h, and leucine enkephalin (m/z 554.2771) was used as an external marker for accurate mass locking.
Data Processing and Statistical Analysis
The differences of BG, HbA1c, age and body mass index (BMI) between group D and group H were analyzed using Student’s t-test. Skin condition, education background, diet and exercise status was assessed using Pearson’chi-squared test. Spearman correlation coefficients (rs) were calculated among sphingolipids, as well as their associated diabetes traits, adjusting for age, skin condition, education background, diet and exercise status.
Firstly, the acquired mass data were pre-processed by Progenesis QI (Waters, Man-chester, UK) for peak detection, alignment and normalization. Both supervised method, partial least squares-discriminant analysis (PLS-DA), and unsupervised method, principal component analysis (PCA), were carried out to identify the differences in lipid profiles between the two groups. The lipids were screened by comparison with the LIPID MAPS. Using univariate and multivariate analysis, variable importance projection (VIP) from the peak intensity and fold change (FC) analysis were applied to screen for potential biomarkers. Heatmap analysis was used to show the lipidomic patterns in different groups. The Mann–Whitney U-test (p ≤ 0.05) was used to identify whether there was significant difference between groups D and H.
The candidate biomarkers were evaluated by receiver operating characteristic (ROC) curve analysis, which was carried out using SPSS 19.0 (IBM, UK).
Network Inference Analysis
WGCNA was used to determine highly interconnected lipid modules (R package WGCNA, version 1.63). The neighborhood of interconnected lipids was defined by topological overlap measurement (TOM). The module was represented by the first main component of metabolites contained in the module.
Results
Clinical Characteristics of the Subjects
The demographic and general clinical information are summarized (Table 1), no statistical differences were found in age and BMI between group D and group H, but statistically significant differences were found in both BG and HbA1c in both groups. In group D, 83.33% of the participants are dry skin and 23.81% are pigmented skin; and in group H, 71.43% of the participants are dry skin and 25.71% are pigmented skin. There was no statistical difference in skin condition between the two groups.
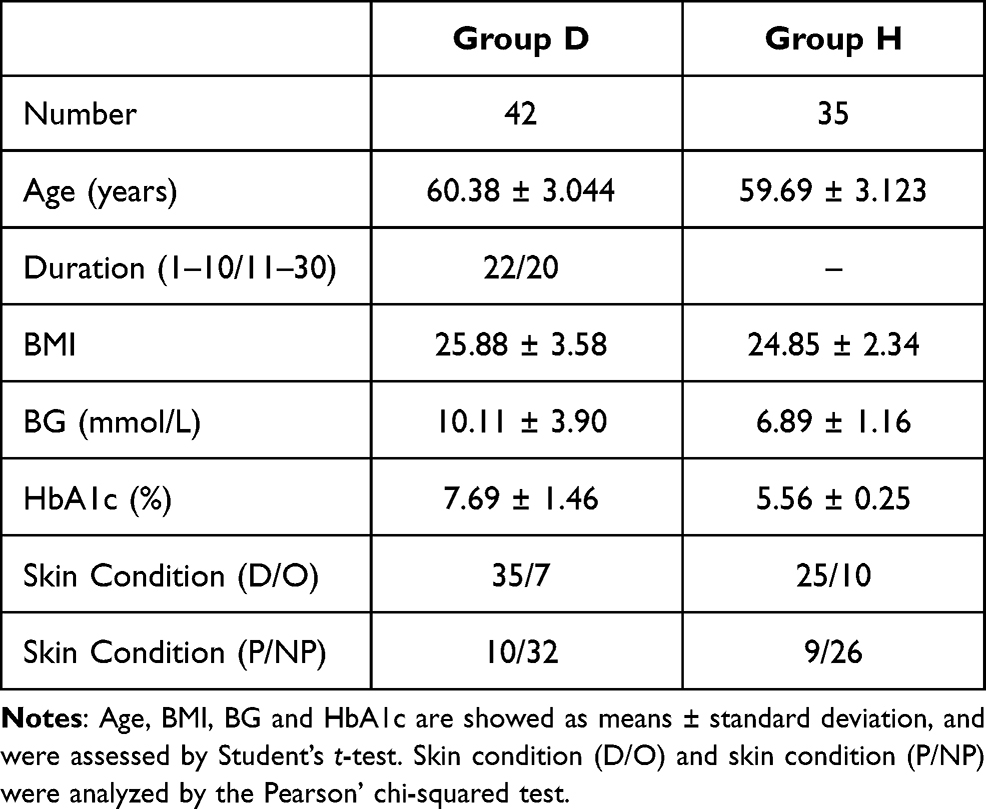 |
Table 1 Clinical Demographics of the Subjects |
Lipid Metabolic Profiling and Identification of Significantly Altered Metabolites in T2D Patients
To access the changes in lipidome of patients with T2D and to detect the notably changed lipid metabolites in T2D as compared with control, the PLS-DA analysis with two-predictive components was carried out. The PLS-DA plots could be completely segregated into two clusters, illustrating that skin surface lipid profiles were remarkably changed in diabetes group (Figure 1A). The PLS-DA plots in positive ion mode with R2 of 0.914 and Q2 of 0.711 were clearly capable of distinguishing T2D patients from controls. The 300-permutation test showed that the blue Q2 values on the left were all lower than the original points on the right (R2 = 0.671, Q2 = −0.0299), proving that PLS-DA has sufficient sensitivity and predictive ability (Figure 1B).
To evaluate the PLS-DA, R2 and Q2 were used. R2 is the variable (X or Y) change percentage model, and Q2 is the predictive ability of the parameter prediction estimation model. The SSL difference between the two groups can be explained using PLS-DA.
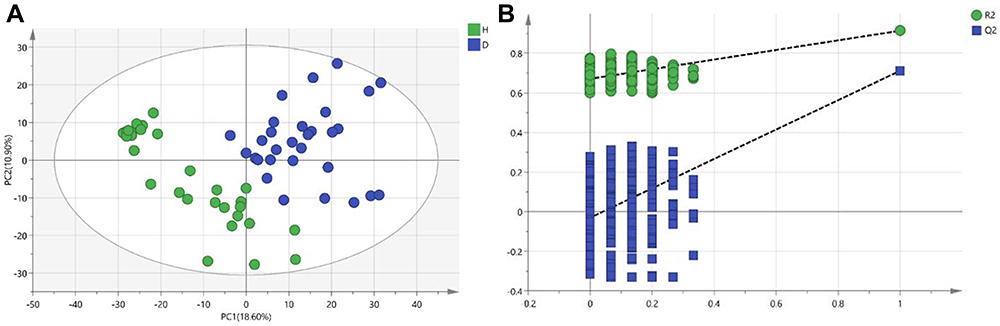 |
Figure 1 (A) PLS-DA model of H and D groups (R2Y = 0.914, Q2 = 0.711). (B) A 300-permutation test of the PLS-DA model for H and D groups (R2 = 0.671, Q2 = −0.0299). |
Initially, 1275 variables under positive ion mode was selected based on the combinations of VIP > 1, p < 0.05, and fold change >2. Additionally, the same changing trends as the belonging main classes and subclasses were also factors during the screening. AUC is the area under the ROC curve, and substances with AUC greater than 0.9 are likely to be biomarkers.
Lipid metabolites that fulfilled the screening criteria were matched to the human lipid database, Basic Lipid. We identified 27 lipid components with significant differences (Table 2). According to the eight major lipids in LIPIDMAPS, sphingolipids accounted for 85.19% of these lipids (23/27).
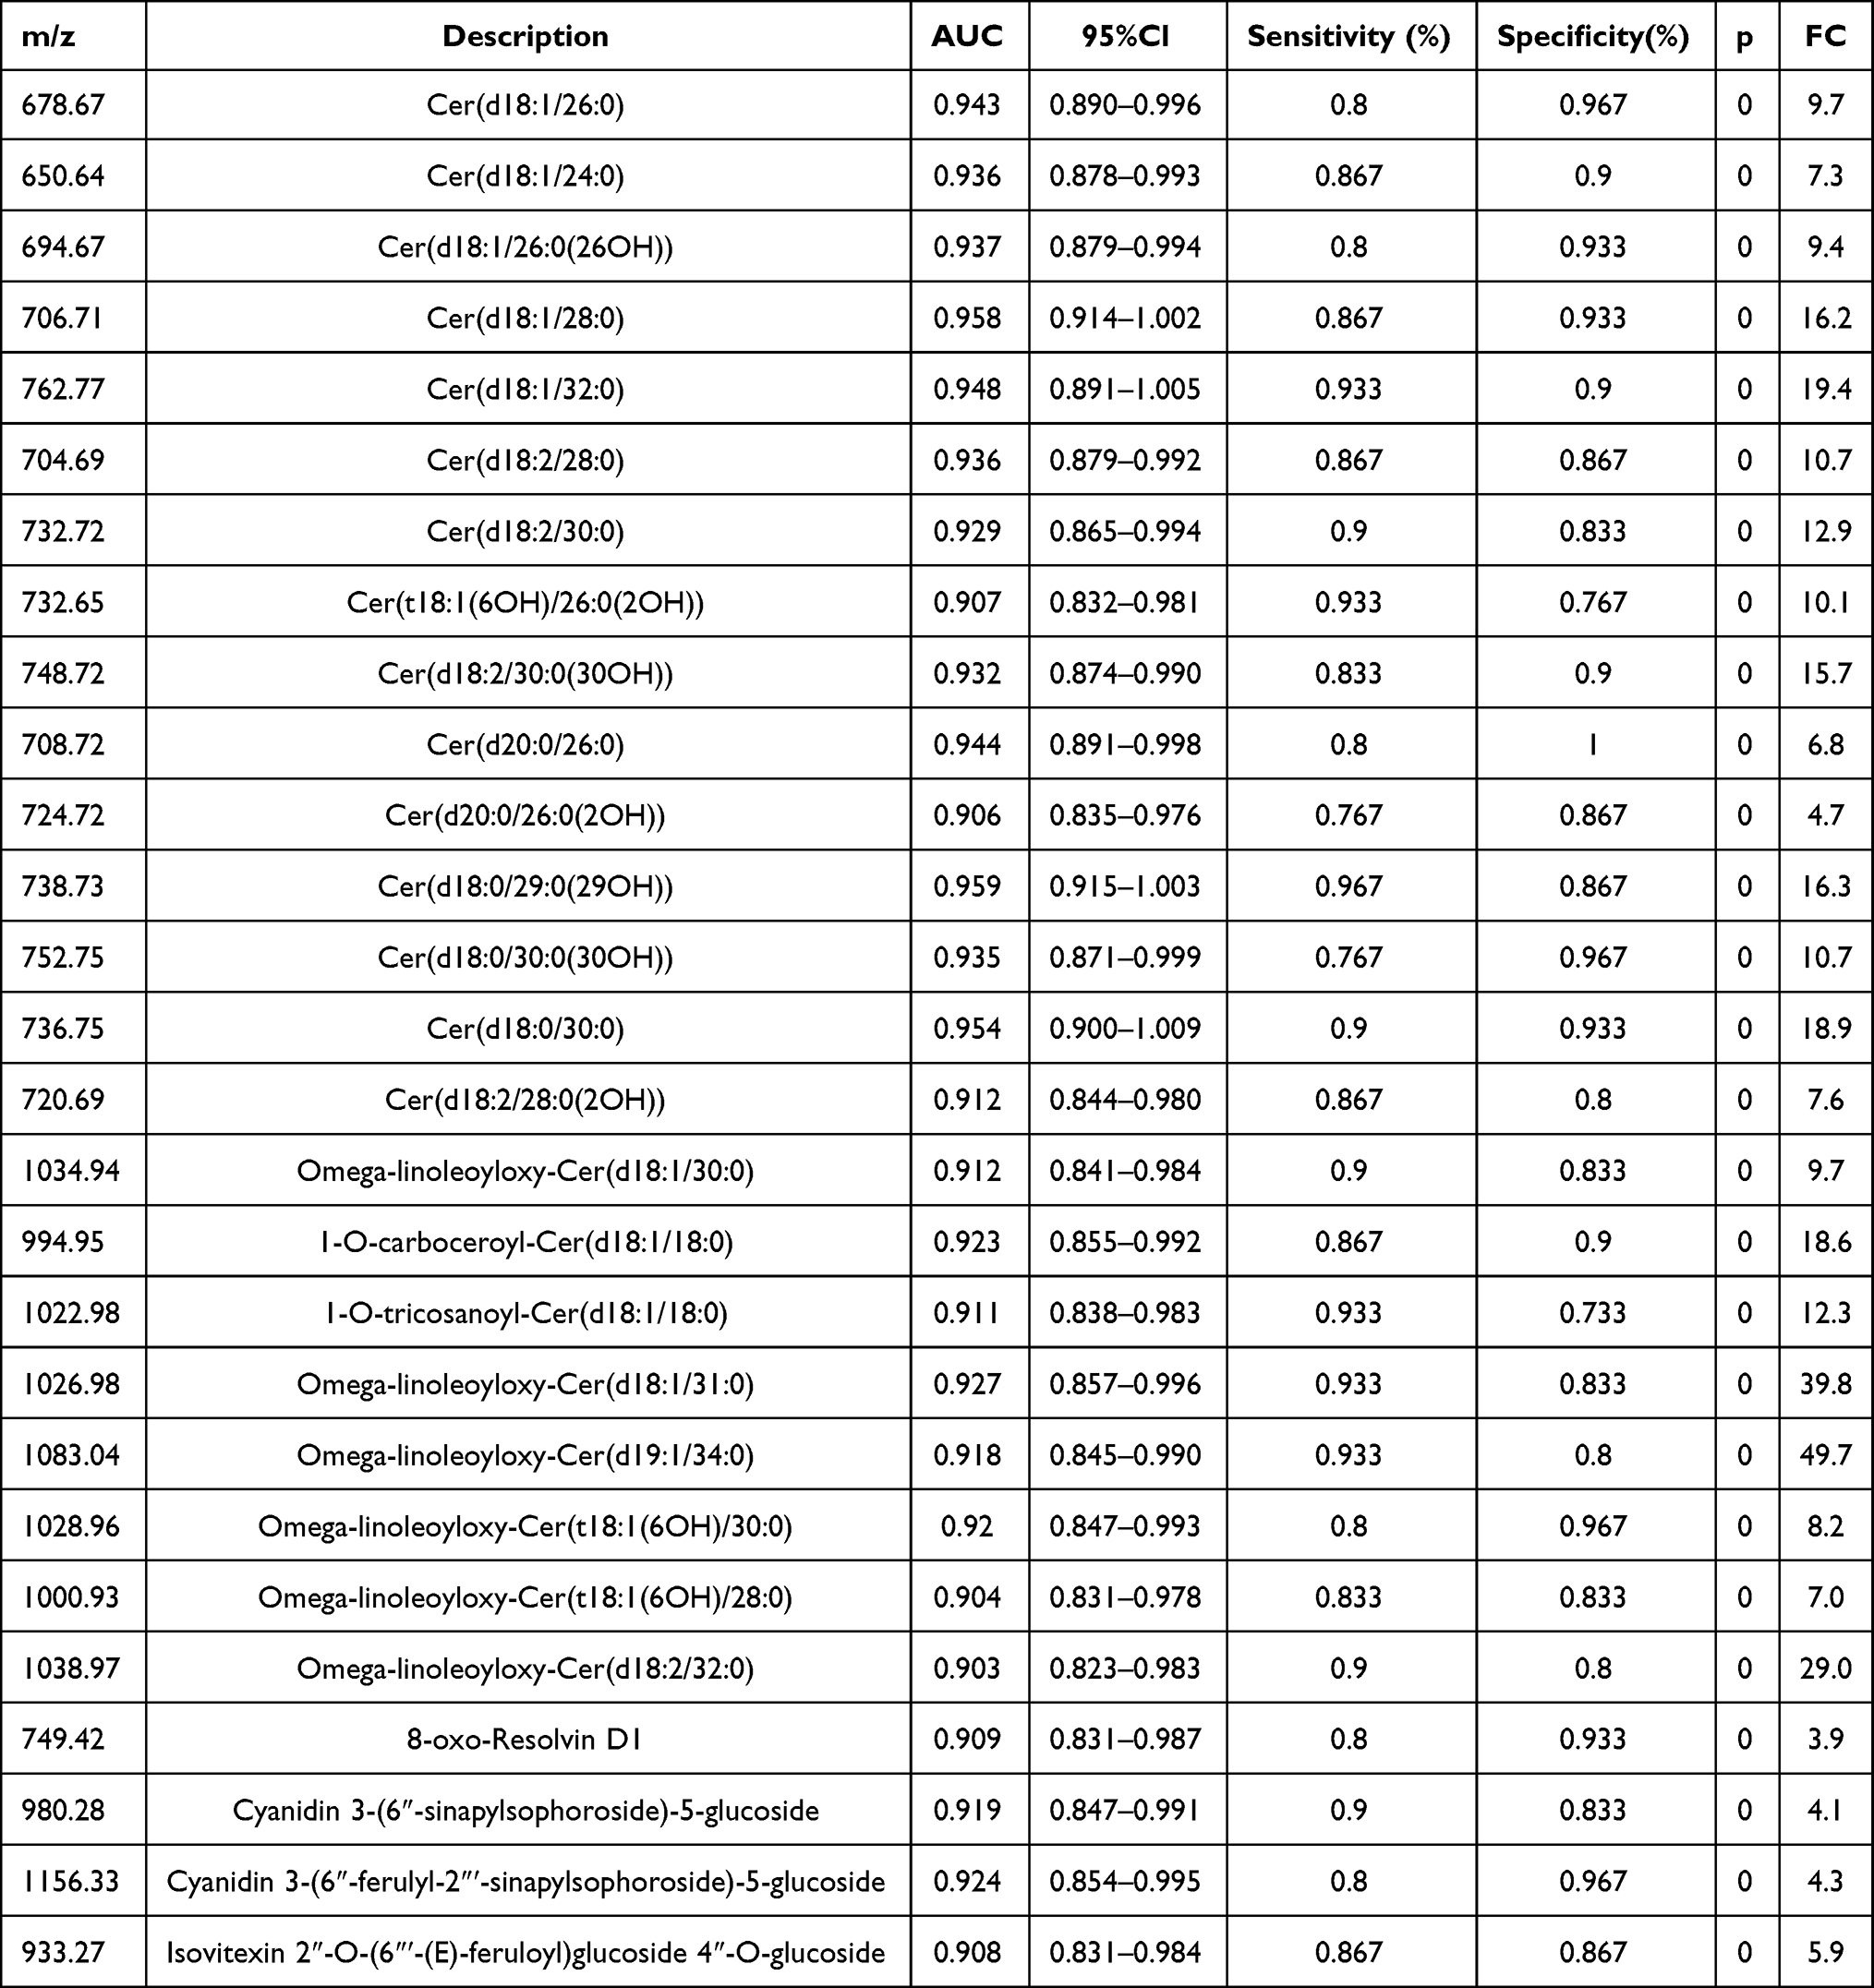 |
Table 2 AUC > 0.9 Together with VIP > 1, p-values < 0.05 and Fold Change > 2 |
Lipids Network Analysis
Using the dynamic tree cutting algorithm, a total of 5 different modules were identified from 1275 lipids (Figure 2). Using a cutting height of 0.3 to cluster the modular feature genes (MEs) (merging dynamics), none of the modules were merged (Figure 2). The blue, brown, gray, turquoise and yellow modules contain 96, 92, 833, 170 and 35 lipids, respectively. Additionally, 833 irrelevant lipids were assigned to the gray modules and were excluded from further analysis. According to the module-characteristic correlation heat map (Figure 3), module turquoise was correlated with HbA1c_H & HbA1c_N (rs = 0.16). Module turquoise and module brown were correlated with P & NP (rs = 0.054 to 0.19).
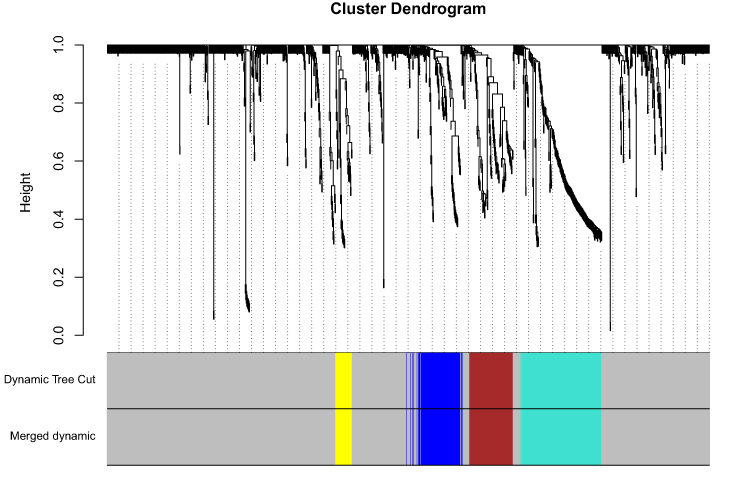 |
Figure 2 According to the pairwise dissimilarity between lipids, a hierarchical clustering tree is obtained. The dynamic tree cut yielded five modules. The merged dynamic yielded same modules as the dynamic tree cut using a cut-off of 0.3. Module colors are shown correspondingly. |
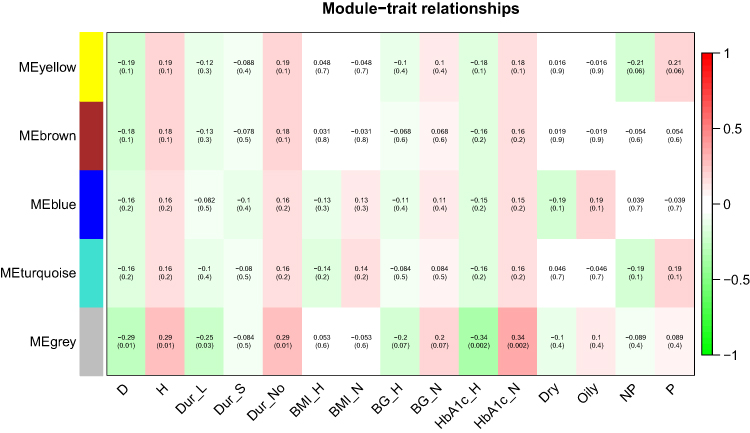 |
Figure 3 Heatmap of module-trait relationships depicting correlations between module eigenlipids and clinical characteristics traits. Numbers in the table correspond to the correlation r and the p-value in parentheses. The degree of correlation is illustrated with the color legend. Abbreviations: D, diabetes group; H, health group; Dur_L/S/No, duration long/short/no; BMI_H/N, body mass index high/normal; BG_H/N, blood glucose high/normal; HbA1c_H/N, Hemoglobin A1c high/normal; Dry/Oily, dry/oily skin; P/NP, pigmented/ Non-pigmented skin. |
Gene significance (GS) was used to measure the correlation between clinical information and the genes. The higher the value, the more biologically significant the gene is related to the external information. Module intramodular connectivity (IC) is used to describe the degree of association between a node in a module and other nodes in the module, and can be used to measure module membership (MM). In the turquoise module, the GS of HbA1c_H & HbA1c_N and P & NP were significantly correlated with MM (r=−0.33 p=1.1e-05, r= 0.57 p=4.9e-16, respectively). In the brown module, the GS and MM of P & NP were significantly correlated (r=0.54 p=2.8e-08). Therefore, the turquoise and brown modules are regarded as interesting modules for subsequent analysis.
Hub Lipids Analysis
The hub lipids of the turquoise and brown modules were analysed to explore the underlying mechanism of the observed associations. Due to the large number of hub lipids, GS > 0.2 and MM > 0.8 were selected as conditions for screening. In the turquoise module, there were 2 hub lipids related to HbA1c_H & HbA1c_N, and 11 hub lipids related to P & NP (Table 3). In the brown module, there was 1 hub lipid related to P & NP (Table 3).
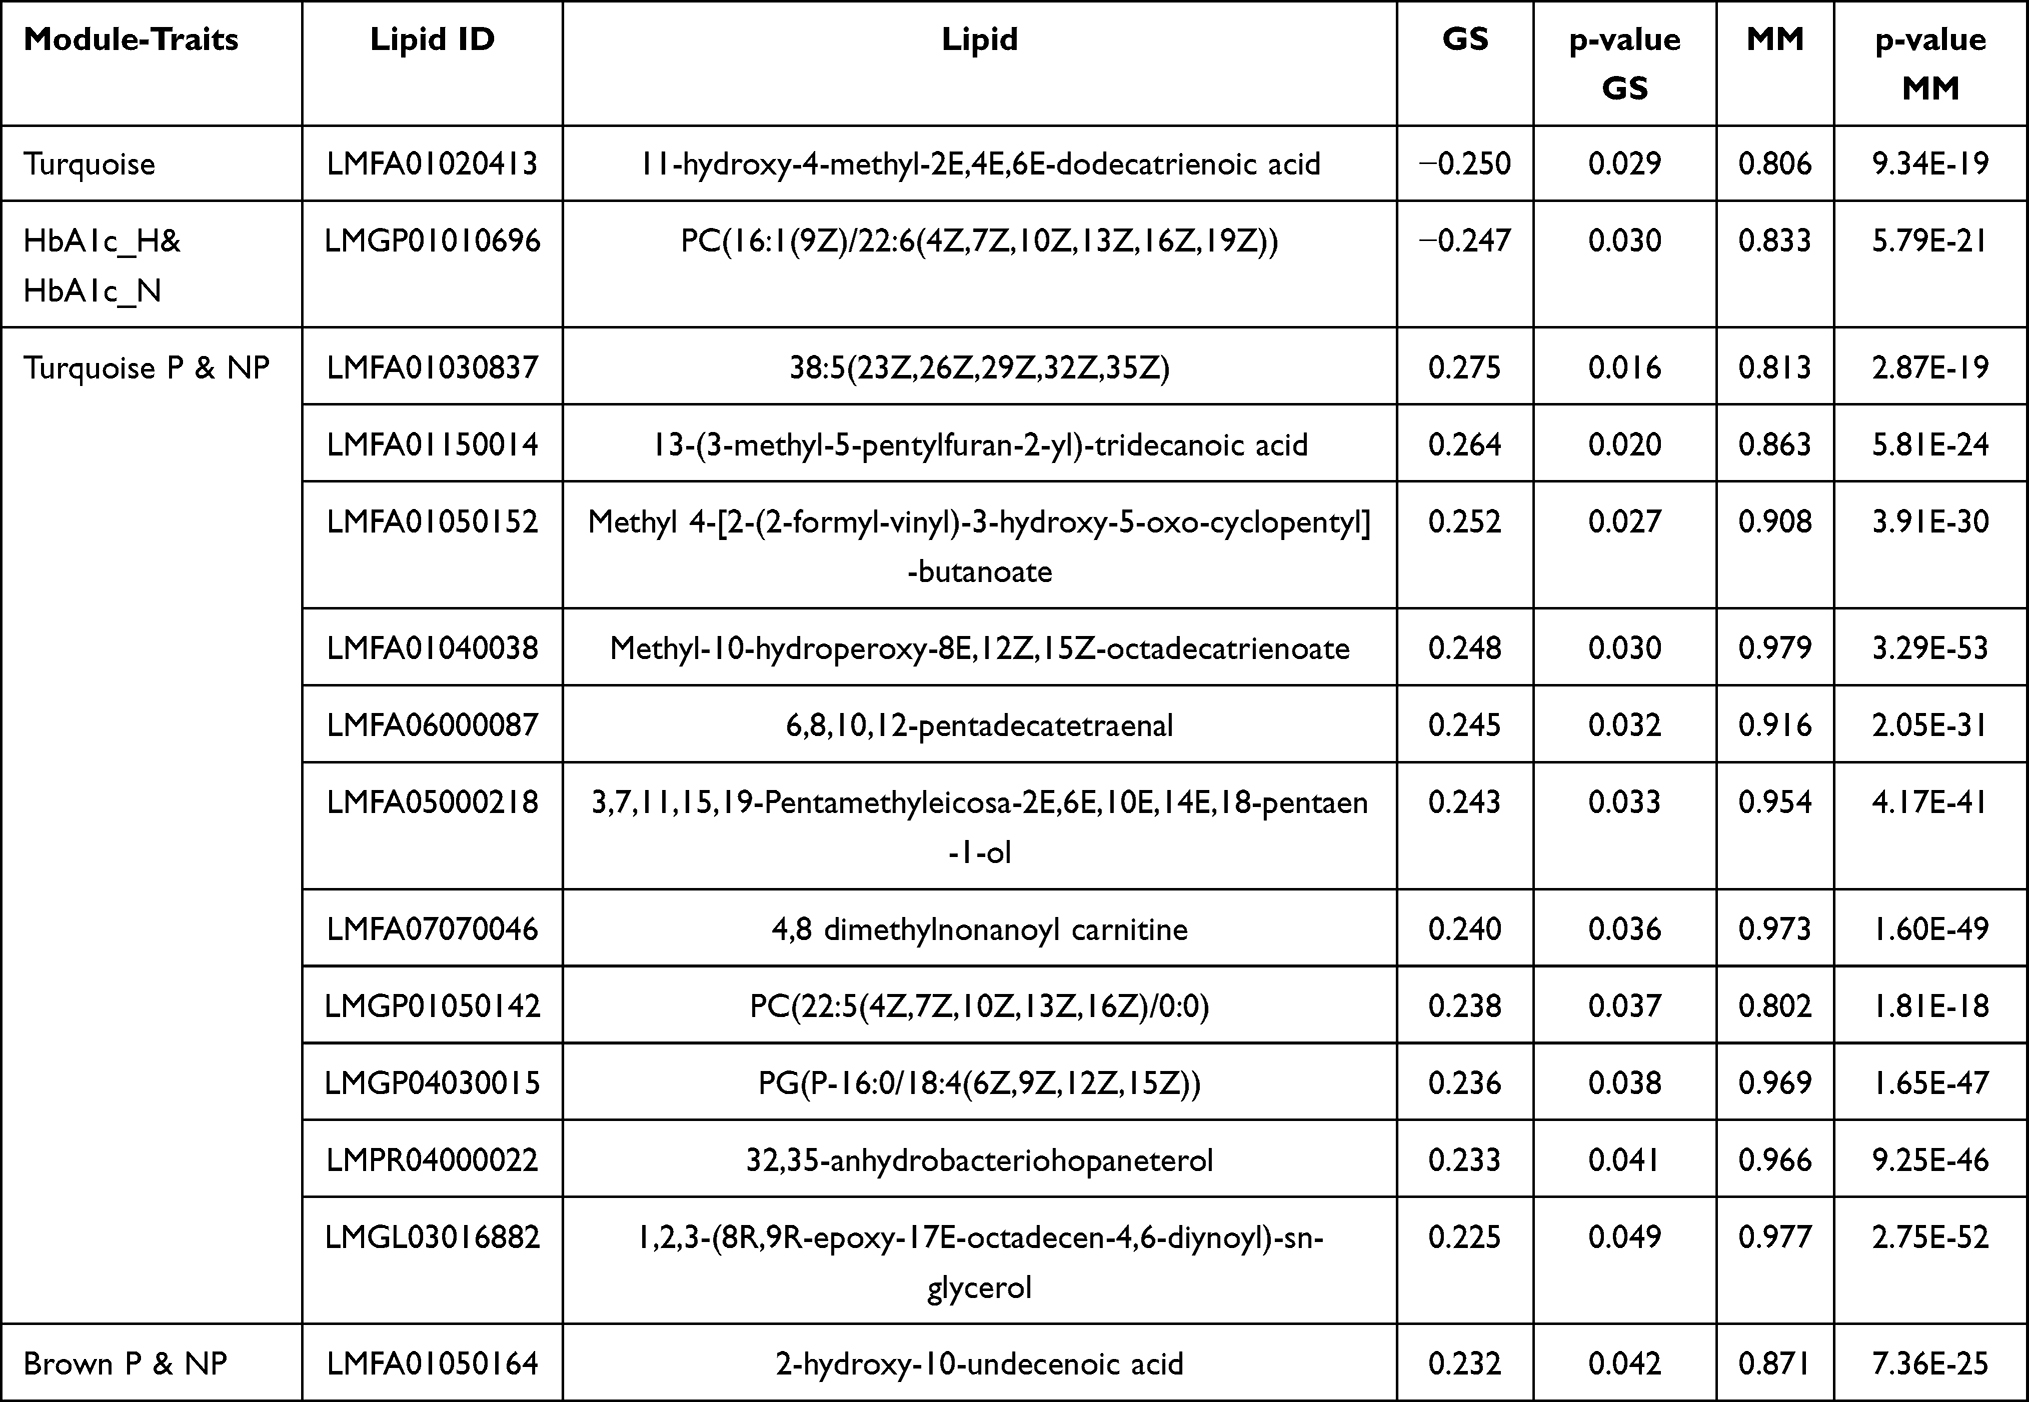 |
Table 3 Hub Lipids Identified from WGCNA Analysis |
Discussion
In the current study, we described the characteristics of the skin surface lipids in patients with T2D. We demonstrated that, compared to healthy controls, the SSL profile of patients with T2D has undergone significant changes. To the best of our knowledge, this is the first study that has widely focused on the UPLC-QTOF-MS analysis of the non-targeted lipidome profile of SSL obtained from female patients with T2D.
Sphingolipids and Diabetes Metabolism
By applying a skin lipidomic approach to measure volunteer’s SSL, we observed that 23 sphingolipids were significantly associated with T2D. The 23 were all ceramides, including 9 ceramides (Cers), 6 dihydroceramides (dhCers) and 8 acyl-ceramides [SP0204]. In order to further explore the content changes of these several substances, we calculated their relative abundance, as shown in Figure 4. The relative abundance of the three subcategories of ceramide in group D was higher than that in group H, and were statistically significant differences.
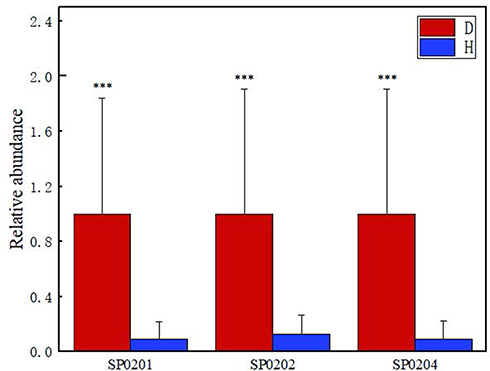 |
Figure 4 The difference in relative content of ceramide subclasses between group D and group H. [SP0201]: ceramides, [SP0202]: dihydroceramides, [SP0204]: acyl-ceramides. (***p<0.01) |
Sphingolipids are involved in the regulation process of eukaryotic cell structure, barrier function, metabolism and signal transduction. The diversity of sphingolipid structures determines the pleiotropy of its effects. A distinctive feature of the sphingolipid composition profile is its unevenness. Although sphingolipids are abundant in cells of all mammals, the relative abundance of a single sphingolipid species varies significantly between different tissues and cell types, especially the skin, compared with other organs. The presence of unusual ceramide supplements, especially rich in omega-hydroxyceramide.18 Changes sphingolipid content will also affect the communication and adhesion between cells.19 The increase in ceramide levels is also lipotoxic and may cause metabolic disorders such as insulin resistance.20
With the rapid development of lipidomics Technology, more than 600 sphingolipids have been detected in humans.21 However, only a few human studies have investigated the effects of sphingolipids on fasting blood glucose.22 insulin resistance, and β-cell dysfunction.23 Even fewer prospective cohorts have studied the effects of sphingolipids on T2D and the avaliable studies have produced controversial results.24–27 For example, the relationship between SM(d18:1/18:0) and T2D was negatively correlated in the PREDIMED trial22 and positively correlated in the Singapore cohort.25 It is worth noting that Cers and SMs with different chain lengths, number of double bonds, and number of hydroxyl groups on sphingosine bases and/or fatty acid residues may have different effects on metabolism; Concurrently, some unique structures may influence the genetics and dietary structure of the population.20,28 However, even though Cers and SMs have different chain lengths, most studies usually only cover 4 to 15 types, and focus on the study of unsaturated sphingosine bases (such as d18:1), saturated fatty acids (SFA) and bound sphingolipids instead of saturated sphingosine bases combined with SFA or monounsaturated fatty acids (MUFA).24–27
Recently, the key role of sphingolipids in various metabolic diseases has attracted increasing attention.29–31 Through animal model studies, it was found that the increase in Cer levels antagonise the serine/threonine-protein kinase signal transduction process stimulated by insulin receptors, leading to an imbalance iin glucose homeostasis and accelerating the process of T2D;32 SM level increase in mitochondrial dysfunction, reactive oxygen generation and inflammation can induce insulin resistance; GSL in rodents may induce metabolic toxicity.33
The lipotoxicity caused by lipid metabolism disorders is closely associated with insulin resistance. Excess lipids can cause serious damage to important signaling pathways in the body. Additionally, the concentration of ceramide in plasma and tissues is closely related to the risk of development T2D.34 For example, Cer16:0 plays an important role in the occurrence and development of insulin resistance. Experiments in mice show that the decrease of Cer16:0 concentration can prevent obesity induced by high-fat diet, improve insulin resistance, and balance the body’s glucose homeostasis;35 Cer18:0 has also been proven to have the same effect.36 Furthermore, the results of lipid screening in a large clinical cohort showed that the levels of ceramide and/or dihydroceramide in serum and tissues have a particularly strong correlation with insulin resistance and T2D.37
WGCNA and Metabolic Pathway Analysis
The lipids listed in Table 3 were analyzed by Kyoto Encyclopedia of Genes and Genomes (KEGG), and compared with Human Metabolome Database (HMDB) and Organic Small Molecule Biological Activity Database (Pubchem). Four lipids were identified: (PC(16:1(9Z)/22:6(4Z,7Z,10Z,13Z,16Z,19Z)), aldosterone 18-glucuronide, 4,8 dimethylnonanoyl carnitine, and PC(22:5(4Z,7Z,10Z,13Z, 16Z)/0:0)). Then compared with the metabolome database of mammalian Homo sapiens (KEGG), it was found that these four lipids would affect linoleic acid metabolism, alpha-linolenic acid metabolism, Arachidonic acid metabolism and Glycerophospholipid metabolism(as shown in Figure 5).
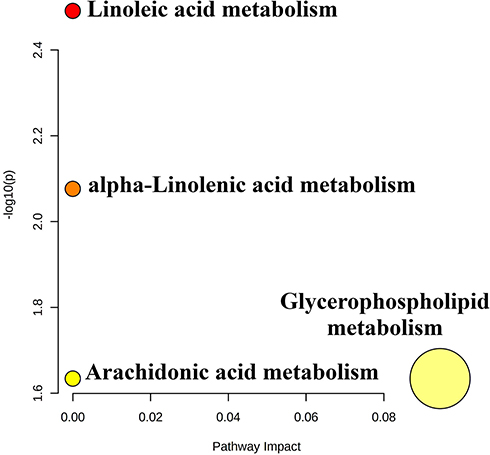 |
Figure 5 KEGG pathway analysis of hub lipids screened by WGCNA. |
Although we have successfully identified potential T2D skin lipid biomarkers using non-targeted lipidomics methods, the current research has certain limitations. The main limitation was the small sample size. Concurrently, some confounding factors, such as the correlation between the course of T2D and age, may affect lipidomics characteristics. Therefore, our findings should be verified in a more comprehensive study.
Conclusion
In this study, UPLC-QTOF-MS was used to prove that the skin surface lipid metabolism of patients with T2D was significantly changed, and 23 sphingolipids were identified as potential biomarkers for the diagnosis of T2D. KEGG metabolic pathway analysis shows that the N-ceramide sphingosines in these lipids can affect the sphingomyelin metabolic pathway, thereby causing the body’s insulin metabolism to be disordered. This is in contrast to the previous literature on the effect of sphingolipid lipids on insulin. The reports of the resistance process are consistent and show that diabetic patients can be distinguished from the lipid molecular level. WGCNA was used to obtain the hub lipids related to the Hemoglobin A1c high/normal group and pigmented/ Non-pigmented skin group and the affected metabolic pathways. The lipids obtained from these screenings will be verified and correlated in follow-up work, in order to provide a theoretical basis for the development of facial skin care products for people with type 2 diabetes.
Acknowledgments
The authors would like to thank the study participants. Thanks to Wenbo Wang and Nan Feng, (Doctor of Endocrinology Department, Peking University Shougang Hospital) for assistance in recruitment. Special thanks to Congfen He and Yuchen Ma (Professors and Graduate Students, Beijing Technology and Business University) for assistance with project support and development.
Disclosure
The authors report no conflicts of interest in this work.
References
1. Bustan RS, Wasim D, Yderstræde KB, Bygum A. Specific skin signs as a cutaneous marker of diabetes mellitus and the prediabetic state - a systematic review. Dan Med J. 2017;64(1):A5316.
2. Wang LM, Gao P, Zhang M, et al. Prevalence and ethnic pattern of diabetes and prediabetes in China in 2013. JAMA. 2017;317(24):2515–2523. doi:10.1001/jama.2017.7596
3. Chatterjee S, Khunti K, Davies MJ, et al. Type 2 diabetes – authors’ reply. Lancet. 2018;391(10127):1261–1262. doi:10.1016/S0140-6736(18)30609-3
4. Intekhab A, Barry G. Diabetes mellitus. Clin Dermatol. 2006;24(4):237–246. doi:10.1016/j.clindermatol.2006.04.009
5. Macedo GD, Nunes S, Barreto T, et al. Skin disorders in diabetes mellitus: an epidemiology and physiopathology review. Diabetol Metab Syndr. 2016;8(1):63. doi:10.1186/s13098-016-0176-y
6. Jelinek JE. Cutaneous manifestations of diabetes mellitus. Int J Dermatol. 1994;33(9):605–617. doi:10.1111/j.1365-4362.1994.tb02915.x
7. Ludovici M, Kozul N, Materazzi S, Risoluti R, Picardo M, Camera E. Influence of the sebaceous gland density on the stratum corneum lipidome. Sci Rep. 2018;8(1):11500. doi:10.1038/s41598-018-29742-7
8. Sahle FF, Gebre-Mariam T, Dobner B, Wohlrab J, Neubert RH. Skin diseases associated with the depletion of stratum corneum lipids and stratum corneum lipid substitution therapy. Skin Pharmacol Physiol. 2015;28(1):42–55. doi:10.3945/ajcn.113.061218
9. Knox S, O’Boyle NM. Skin lipids in health and disease: a review. Chem Phys Lipids. 2021;236:105055. doi:10.1016/j.chemphyslip.2021.105055
10. Trivedi DK, Sinclair E, Xu Y, et al. Discovery of volatile biomarkers of parkinson’s disease from sebum. ACS Cent Sci. 2019;5(4):599–606. doi:10.1021/acscentsci.8b00879
11. Tang YN, Pang YX, He XC, et al. UPLC-QTOF-MS identification of metabolites in rat biosamples after oral administration of Dioscorea saponins: a comparative study. J Ethnopharmacol. 2015;165:127–140. doi:10.1016/j.jep.2015.02.017
12. Yi T, Zhu L, Tang Y-N, et al. An integrated strategy based on UPLC-DAD-QTOF-MS for metabolism and pharmacokinetic studies of herbal medicines: tibetan “snow lotus” herb (Saussurea laniceps), a case study. J Ethnopharmacol. 2015;153(3):701–713. doi:10.1016/j.jep.2014.03.031
13. Yan T, Zhu S, Zhu M, et al. Integrative identification of hub genes associated with immune cells in atrial fibrillation using weighted gene correlation network analysis. Front Cardiovasc Med. 2021;7:631775. doi:10.3389/fcvm.2020.631775
14. Chinese Diabetes Society. Guidelines for the prevention and treatment of type 2 diabetes in China (2017 edition). Chin J Pract Med. 2017;38(04):34–86. doi:CNKI:SUN:SYNK.0.2018-04-009
15. Zong G, Zhu J, Sun L, et al. Associations of erythrocyte fatty acids in the de novo lipogenesis pathway with risk of metabolic syndrome in a cohort study of middle-aged and older Chinese. Am J Clin Nutr. 2013;2:319–326. doi:10.3945/ajcn.113.061218
16. Bligh EG, Dyer WJ. A rapid method of total lipid extraction and purification. Can J Biochem Physiol. 1959;37:911–917. doi:10.1139/o59-099
17. Cui L, Jia Y, Cheng Z-W, et al. Advancements in the maintenance of skin barrier/skin lipid composition and the involvement of metabolic enzymes. J Cosmet Dermatol. 2016;15(4):549–558. doi:10.1111/jocd.12245
18. Wartewig S, Neubertr. HH. Properties of ceramides and their impact on the stratum corneum structure: a review. Part 1: ceramides. Skin Pharmacol Appl Skin Physiol. 2007;20(5):220–229. doi:10.1159/000104420
19. D’Angelo G, Capasso S, Sticco L, et al. Glycosphingolipids: synthesis and functions. FEBS J. 2013;280(24):6338–6353. doi:10.1111/febs.12559
20. Chaurasia B, Summers SA. Ceramides - lipotoxic inducers of metabolic disorders. Trends Endocrinol Metab. 2015;26(10):538–550. doi:10.1016/j.tem.2015.07.006
21. Chew WS, Seow WL, Chong JR, et al. Sphingolipidomics analysis of large clinical cohorts. part 1: technical notes and practical considerations. Biochem Biophys Res Commun. 2018;504(3):596–601. doi:10.1016/j.bbrc.2018.04.076
22. Jensen PN, Fretts AM, Yu C, et al. Circulating sphingolipids, fasting glucose, and impaired fasting glucose: the strong heart family study. EBioMedicine. 2019;41::44–49. doi:10.1016/j.ebiom.2018.12.046
23. Lemaitre RN, Yu C, Hoofnagle A, et al. Circulating sphingolipids, insulin, HOMA-IR, and HOMA-B: the Strong Heart Family Study. Diabetes. 2018;67(8):1663–1672. doi:10.2337/db17-1449
24. Razquin C, Toledo E, Clish CB, et al. Plasma lipidomic profiling and risk of type 2 diabetes in the predimed trial. Diabetes Care. 2018;41(12):2617–2624. doi:10.2337/dc18-0840
25. Chew W, Torta F, Ji S, et al. Large-scale lipidomics identifies associations between plasma sphingolipids and T2DM incidence. JCI Insight. 2019;5. doi:10.1172/jci.insight.126925
26. Floegel A, Stefan N, Yu Z, et al. Identification of serum metabolites associated with risk of type 2 diabetes using a targeted metabolomic approach. Diabetes. 2013;62(2):639–648. doi:10.2337/db12-0495
27. Hilvo M, Salonurmi T, Havulinna AS, et al. Ceramide stearic to palmitic acid ratio predicts incident diabetes. Diabetologia. 2018;61(6):1424–1434. doi:10.1007/s00125-018-4590-6
28. Hanamatsu H, Ohnishi S, Sakai S, et al. Altered levels of serum sphingomyelin and ceramide containing distinct acyl chains in young obese adults. Nutr Diabetes. 2014;4(10):e141. doi:10.1038/nutd.2014.38
29. Samuel VT, Shulman GI, Phimister EG. Nonalcoholic fatty liver disease, insulin resistance, and ceramides. N Engl J Med. 2019;381(19):1866–1869. doi:10.1056/NEJMcibr1910023
30. Hammerschmidt P, Ostkotte D, Nolte H, et al. CerS6-derived sphingolipids interact with Mff and promote mitochondrial fragmentation in obesity - sciencedirect. Cell. 2019;177(6):1536–1552.e23. doi:10.1016/j.cell.2019.05.008
31. Chaurasia B, Tippetts TS, Mayoral Monibas R, et al. Targeting a ceramide double bond improves insulin resistance and hepatic steatosis. Science. 2019;365(6451):386–392. doi:10.1126/science.aav3722
32. Iqbal J, Walsh MT, Hammad SM, et al. Sphingolipids and lipoproteins in health and metabolic disorders. Trends Endocrinol Metab. 2017;28(7):506–518. doi:10.1016/j.tem.2017.03.005
33. Meikle PJ, Summers SA. Sphingolipids and phospholipids in insulin resistance and related metabolic disorders. Nat Rev Endocrinol. 2017;13(2):79–91. doi:10.1038/nrendo.2016.169
34. Kusminski C, Scherer PJS. Lowering ceramides to overcome diabetes. Science. 2019;365(6451):319–320. doi:10.1126/science.aax6594
35. Raichur S, Brunner B, Bielohuby M, et al. The role of c16:0 ceramide in the development of obesity and type 2 diabetes: cers6 inhibition as a novel therapeutic approach. Mol Metab. 2019;21:36–50. doi:10.1016/j.molmet.2018.12.008
36. Turpin-Nolan SM, Hammerschmidt P, Chen W, et al. Cers1-derived c 18:0 ceramide in skeletal muscle promotes obesity-induced insulin resistance. Cell Rep. 2019;26(1):1–10. doi:10.1016/j.celrep.2018.12.031
37. So A, Mehl F, Harris N, Chobaz V, Gallart-Ayala H. Op0053 ceramides and dihydroceramides levels are associated with the inflammatory response in a murine model of gout. Annu Eur Congr Rheumatol EULAR. 2019;78(Suppl 2):
 © 2022 The Author(s). This work is published and licensed by Dove Medical Press Limited. The full terms of this license are available at https://www.dovepress.com/terms.php and incorporate the Creative Commons Attribution - Non Commercial (unported, v3.0) License.
By accessing the work you hereby accept the Terms. Non-commercial uses of the work are permitted without any further permission from Dove Medical Press Limited, provided the work is properly attributed. For permission for commercial use of this work, please see paragraphs 4.2 and 5 of our Terms.
© 2022 The Author(s). This work is published and licensed by Dove Medical Press Limited. The full terms of this license are available at https://www.dovepress.com/terms.php and incorporate the Creative Commons Attribution - Non Commercial (unported, v3.0) License.
By accessing the work you hereby accept the Terms. Non-commercial uses of the work are permitted without any further permission from Dove Medical Press Limited, provided the work is properly attributed. For permission for commercial use of this work, please see paragraphs 4.2 and 5 of our Terms.