Back to Journals » International Journal of General Medicine » Volume 14
Exploration of MRI T2 Mapping Image Application in Articular Disc Displacement of the Temporomandibular Joint in Adolescents
Authors Zhao Z, Ge H, Xiang W, Bai G ![]()
Received 22 July 2021
Accepted for publication 16 September 2021
Published 24 September 2021 Volume 2021:14 Pages 6077—6084
DOI https://doi.org/10.2147/IJGM.S330116
Checked for plagiarism Yes
Review by Single anonymous peer review
Peer reviewer comments 2
Editor who approved publication: Dr Scott Fraser
Zhoujing Zhao, Huaizhi Ge, Wei Xiang, Guanghui Bai
Department of Radiology, The Second Affiliated Hospital and Yuying Children’s Hospital of Wenzhou Medical University, Wenzhou, 325027, People’s Republic of China
Correspondence: Guanghui Bai
Department of Radiology, The Second Affiliated Hospital and Yuying Children’s Hospital of Wenzhou Medical University, Wenzhou, 325027, People’s Republic of China
Tel/Fax +86 577 88002750
Email [email protected]
Purpose: To explore the application of magnetic resonance imaging (MRI) T2 mapping technique in clinical practice through morphological and quantitative analysis of T2 mapping sequences in adolescents with temporomandibular disorders (TMDs) and control groups comprising healthy participants.
Patients and Methods: A total of 45 and 63 patients, who had articular disc displacement with and without reduction, respectively, were assigned to the experimental groups, and 57 participants with normal articular discs of the temporomandibular joint were considered as the control group. All participants in the three groups underwent MRI. T2 mapping was performed in the oblique sagittal plane. The regions of interest (ROIs) for the T2 relaxation time maps of the disc were selected manually. The performance of morphological and structural changes and quantitative parameters in MRI T2 mapping image artifacts were statistically compared.
Results: In the control group, the mean T2 value was 39.284 ± 5.634 ms, in the group of disc displacement with reduction, the mean T2 value was 33.634 ± 4.235 ms, and in the group of disc displacement without reduction, the mean T2 value was 30.982 ± 3.205 ms. The T2 mapping values of the experimental groups, together with different morphological structures, were significantly lower than were those of the control group.
Conclusion: MRI T2 mapping enables a more accurate evaluation of TMD severity. Sequentially, it helps provide a more reliable medical imaging basis for classifying diagnosis and evaluation in clinical practice.
Keywords: temporomandibular joint disorders, articular disc of temporomandibular joint, adolescents, magnetic resonance imaging
Introduction
Temporomandibular disorder (TMD) is also known as temporomandibular joint (TMJ) disturbance syndrome. It is a disease that includes disorders of the jaw muscles and TMJs, commonly characterized by orofacial pain, chewing dysfunction, or both. TMD has a high incidence rate in adolescents, especially in women. However, TMD symptoms may also occur after adolescence, which may result in pain around the joints that connect the jaw to the skull and even the jaw muscles. Other symptoms include clicking or grating noises while opening the mouth or chewing, abnormal joint movements, uncomfortable range of movements, and unusual mouth-opening.1,2 TMD has been ranked fourth among oral epidemic diseases by the World Health Organization.3 It is believed that TMD greatly affects the quality of life of adolescents.
Magnetic resonance imaging (MRI) enables the visualization and delineation of various tissues within the TMJ, such as cartilage and the articular disc, and remains the gold standard for the diagnosis of TMJ and soft tissue disorders. MR T2 mapping is a biochemical imaging technique that uses T2 relaxation times as an indirect indicator of structural changes in the cartilage collagen fiber organization and network. The interaction between water molecules and collagen fibers is used to visualize the collagen organization, extracellular matrix structure, and water content.4 Since changes in T2 values can indicate early structural changes, the technique has been used in many studies of various joints.5–8 MR T2 mapping has been proven feasible for evaluating the health of the TMJ.9
However, previous studies on TMDs mostly emphasized the relief of patients’ symptoms, with a focus on the quantitative analysis of MR T2 mapping and classification of joint displacement.
Considering the imaging characteristics of TMD patients in terms of structural and functional changes, this study aims to provide a reliable medical imaging basis for classifying the diagnosis and evaluation of TMD in clinical practice using the quantitative analysis method, based on the classification of the articular disc of TMJ.
Materials and Methods
Study Design
A total of 86 participants (58 women and 28 men), aged 7–20 years (mean age: 16.41 years), were recruited from patients at the Second Affiliated Hospital of Wenzhou Medical University from April 2019 to April 2020. All patients underwent MRI and T2 mapping scans of their bilateral TMJs; 165 joints were included in the study, while 7 unilateral temporomandibular joint had to be excluded because of motion artifacts. The T2 values of the articular disc were measured. In addition, color changes in T2 mapping image artifacts were observed.
The exclusion criteria included fixed orthodontic device, metallic foreign bodies in the head, treatment histories, trauma histories, and surgical conditions and diseases, such as congenital deformity and specific inflammation.
MRI Examination Methods
The bilateral TMJs in the closed- and open-mouth positions were scanned using a GE Discovery MR750 3.0T scanner (GE Healthcare, Chicago, IL, USA) equipped with 32-channel quadrature coils. Scanning sequences such as fat-suppressed T2-weighted image (T2WI), sagittal T1WI, coronal T2WI, multiple echo recombined gradient echo (MERGE), and T2 mapping were observed. The T2 mapping parameters were as follows: repetition time, 2500 ms; echo time, 7.5~59.7 ms; slice thickness, 3 mm; slice interval, 0.6 mm; and FOV, 192×128 mm.
Diagnosis and Analysis Criteria
The specific criteria for MRI diagnosis of displacement of articular disc of TMJ were as follows (Figures 1 and 2A–C): Based on the sagittal slope of the closed-mouth position, if the angle between the line perpendicular to the articular eminence and tangent to the posterior band of the articular disc ranges from 0° to 10° backward or forward, it was defined as normal disc placement. If the angle was 10° forward, it was considered an anterior disc displacement. Based on the sagittal slope of the open-mouth position, if the anteriorly displaced disc returned to its normal position, it was categorized as anterior disc displacement with reduction; if the disc could not return to its normal position and was displaced to the front edge of the condyle, it was referred to as anterior disc displacement without reduction.10 The TMJs were divided into one of the three groups according to the above criteria as follows: the control group (TMJs exhibiting normal disc placement); the anterior disc displacement with reduction group; and the anterior disc displacement without reduction group.
 |
Figure 1 Schematic diagram. |
 |
Figure 2 Sketch map of temporomandibular joint: normal TMJ(A); disc displacement of TMJ with reduction(B); disc displacement of TMJ without reduction(C). |
T2 Mapping Image Quantitative Analysis
Three experienced examiners who specialized in temporomandibular disease (TMD) therapy [M.D. (5 years’ experience) in TMJ dysfunction syndrome treatment] were blinded to the volunteers’ identity. One examiner assessed the normal location and position of the condyle and the disc on the morphological, oblique sagittal, and coronal slices in the open and closed positions.
The regions of interest (ROIs) for the T2 relaxation time maps were selected manually by each examiner. For the ROI of the TMJ disc, the contours of the disc were drawn on the image that revealed the best morphological contrast and put into the image work station T2MAP.
Using the image work station T2 map, the T2 mapping image artifacts were automatically generated in accordance with the MERGE images along with the selected optimum ROI. The results of the T2 values in the signal region are clearly presented in –figure 5.
 |
Figure 3 Normal temporomandibular joint in adolescents: closed-mouth position (A), open-mouth position (B), and T2 mapping image artifact (C). |
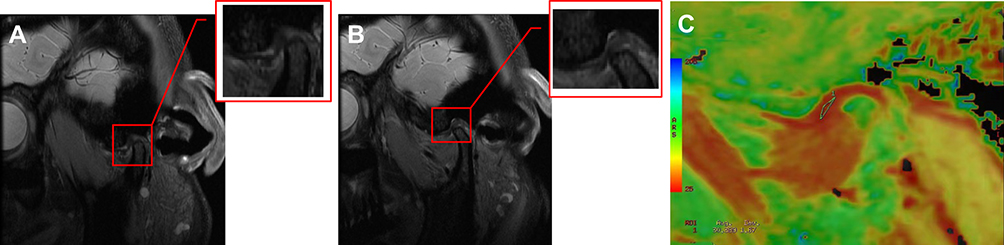 |
Figure 4 Disc displacement of temporomandibular joint with reduction in adolescents: closed-mouth position (A), open-mouth position (B), and T2 mapping image artifact (C). |
 |
Figure 5 Disc displacement of temporomandibular joint without reduction in adolescents: closed-mouth position (A), open-mouth position (B), and T2 mapping image artifact (C). |
The evaluation was performed at the Department of Radiology, under the supervision of a radiologist with 20 years of experience in clinical and experimental MR research and diagnostics.
Statistical Analysis
Statistical analyses were performed using SPSS version 26.0. Metric data, such as T2 values, are presented using the mean ± SD. A one-factor analysis of variance was used to analyze T2 values in the three groups. The outcome of P < 0.001 showed statistically significant differences among the three groups.
Results
T2 Mapping Value
The results (Table 1, Figures 6–8) demonstrated that, in the control group, the mean T2 value was 39.284 ±5.634 ms; in group 1 (disc displacement with reduction), 33.634 ±4.235 ms; and in group 3 (disc displacement without reduction), 30.982 ±3.205 ms. The mean value of the experimental groups was significantly lower than that of the control group in the independent sample t-test, indicating a statistically significant difference (P < 0.001). Meanwhile, the average value of group 2 was significantly lower than that of group 1, indicating a statistically significant difference (P < 0.001).
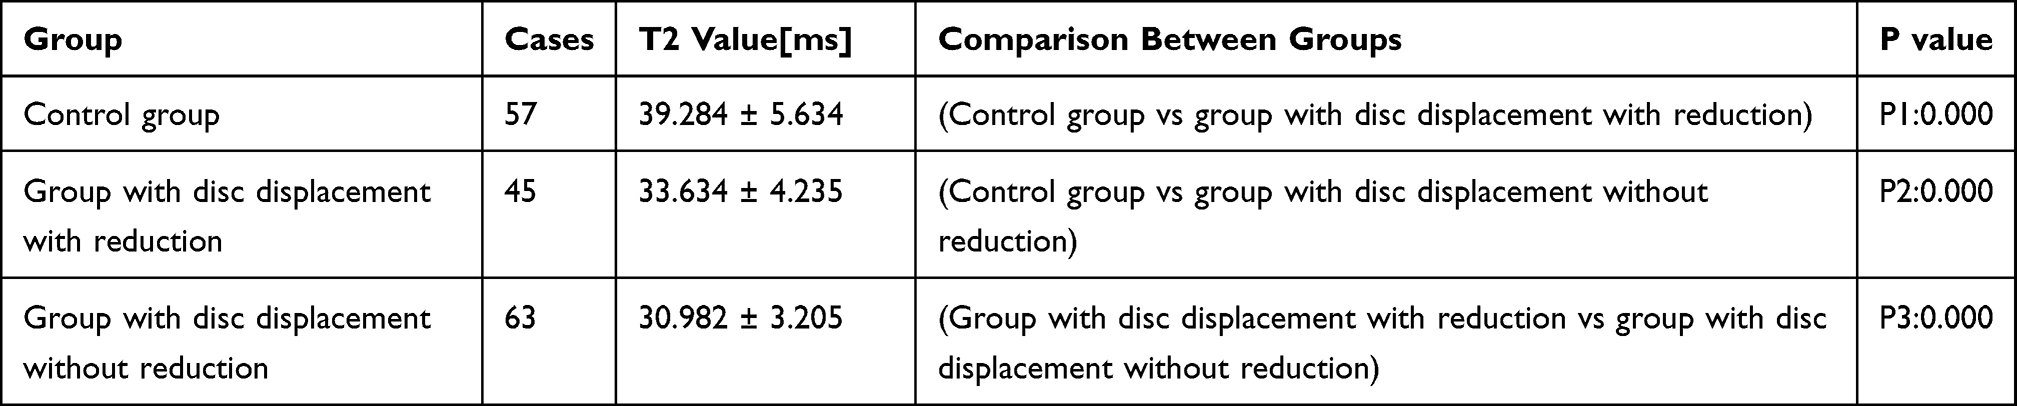 |
Table 1 Comparison of Parameters Between Patients with Normal Articular Discs of Temporomandibular Joints and Those with Articular Discs of Temporomandibular Joints with Temporomandibular Disorders |
 |
Figure 6 T2 mean value. |
 |
Figure 7 T2 value box plot. |
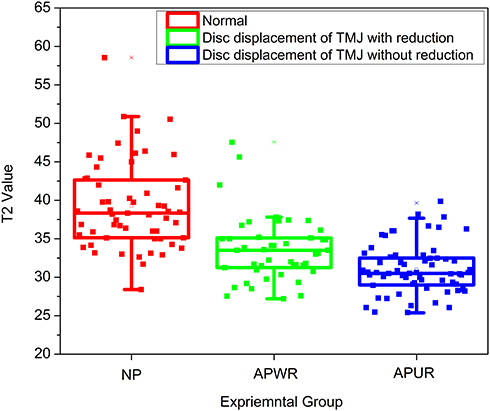 |
Figure 8 T2 value box plot and scatter plot overlay. |
Image Analysis
The morphological structures in normal articular discs, articular disc displacement with reduction, and disc displacement without reduction differed from each other. The green region was selected as the ROI for analysis. The T2 mapping images of normal articular disc, disc displacement with reduction, and disc displacement without reduction are shown in Figures 3C, 4C and 5C, respectively. It is obvious that the water content in the articular disc of the TMJ and T2 values successively decreased, while the color in the ROI was enhanced.
Discussion
TMD is one of the most common orofacial impairments and is especially prevalent among adolescents. MRI, with its predominance in the diagnosis of TMD, has been considered the gold standard in imaging of the articular disc of the TMJ in recent studies.11,12 MRI T2 mapping, a technique that reveals the biochemical parameters and structural changes by measuring the T2 transverse relaxation time13 and is used to analyze the structural composition of the articular cartilage, was adopted in previous studies to evaluate the early stage of cartilage tissue degeneration;5–8 to evaluate the knee joint, femoral condyle, and intervertebral disc; and for subsequent therapy.
Some scholars have conducted studies on the imaging characteristics of disc displacement of TMJ in adolescents.14–16 They believed that TMD had adverse effects on the growth of craniofacial structures in adolescents and caused poor occlusion. Therefore, early assessment is particularly important before morphological changes in the TMJ disc occur. The fibrocartilage disc, one of the most important structures of the TMJ, is composed of type I and type II collagen, making it feasible to test for morphological changes. T2 mapping, a standard morphological MRI technique, makes this early testing possible in clinical practice. Early diagnosis and therapy can prevent the development of chronic symptoms.
A pilot study targeting 10 patients without any symptoms proved the feasibility of MRI T2 mapping in the diagnosis of TMD.9 The results of the current study are similar to those reported in a previous study; in that, there are statistically significant differences between the control group and subgroups (disc displacement with reduction and disc displacement without reduction). We concluded that the T2 mapping value was positively correlated with group division: the control group had the highest T2 value, while the group with articular disc displacement without reduction had the lowest T2 value. Other studies proposed that T2 mapping was still not suitable as a routine diagnostic technique for patients with TMD due to its high sensitivity and the small TMJ disc volume.17
The majority of related studies on TMD pointed out that the image signal in an examination would be affected by several parameters, such as the position of the condyle, structural changes of the articular disc of the TMJ, and effusion in the articular cavity.18–21 This combination of multiple parameters may cause the measured values to offset each other. In this study, the group with disc displacement with reduction had 45 cases of TMJ capsule effusion at different degrees and 21 cases of articular disc compression deformation. Additionally, the manual measurement of the ROI may also result in modest errors. To reduce these errors, three examiners manually selected the ROI, measured the T2 values, and calculated the average value. T2 mapping has the potential to provide additional information to that of standard morphological MR imaging, which may allow the diagnosis of early stages of disc degeneration before morphological changes occur.
In addition, T2 mapping may be a sensitive tool for the monitoring of different therapies, both surgical and conservative, for TMD. T2 mapping can also be used to monitor the longitudinal changes in MR structure and function of individuals before and after treatment. In combination with the evaluation of the clinical treatment effect, it will help to understand the physiology and pathophysiology of the articular disc in depth. Therefore, changes in the articular disc position, articular capsule, and condyle should be considered when evaluating TMDs. A more reliable medical imaging basis and a wider study scale for the evaluation of TMD are worth exploring.
Conclusion
This study demonstrates how the T2 mapping technique enables analysis of the TMJ disc, and includes a quantitative analysis of the T2 mapping value of the articular disc of TMJ images, presenting a more accurate evaluation of the severity of TMD in patients. This is expected to provide a reliable basis for classification of diagnosis and evaluation in clinical practice.
Abbreviations
MRI, Magnetic Resonance Imaging; TMDs, temporomandibular disorders; TMJ, temporomandibular joint; T2WI, T2-weighted image; MERGE, multiple echo recombined gradient echo; ROI, region of interest.
Ethics Approval
This study was conducted with approval from the Ethics Committee of The Second Affiliated Hospital and Yuying Children’s Hospital of Wenzhou Medical University, Wenzhou. This study was conducted in accordance with the declaration of Helsinki. The parents or legal guardians of the patients also provided informed consent for participation in this study.
Consent for Publication
The consent for publication of this manuscript was obtained from a parent or legal guardian of the study participants.
Acknowledgments
We would like to thank Editage for English language editing.
Author Contributions
All authors made substantial contributions to conception and design, acquisition of data, or analysis and interpretation of data; took part in drafting the article or revising it critically for important intellectual content; agreed to submit to the current journal; gave final approval for the version to be published; and agreed to be accountable for all aspects of the work.
Funding
Wenzhou Municipal Science and Technology Plan Project Grant/Award Number: 2021Y0637 and Wenzhou Science and Technology Bureau in China(No.Y20180112).
Disclosure
The authors report no conflicts of interest in this work.
References
1. Dahlström L, Carlsson GE. Temporomandibular disorders and oral health-related quality of life. A systematic review. Acta Odontol Scand. 2010;68(2):80–85. doi:10.3109/00016350903431118
2. Motghare V, Kumar J, Kamate S, et al. Association between harmful oral habits and sign and symptoms of temporomandibular joint disorders among adolescents. J Clin Diagn Res. 2015;9(8):ZC45–ZC48.
3. Wadhwa S, Kapila S. TMJ disorders: future innovations in diagnostics and therapeutics. J Dent Educ. 2008;72(8):930–947.
4. Mosher TJ, Dardzinski BJ. Cartilage MRI T2 relaxation time mapping: overview and applications. Semin Musculoskelet Radiol. 2004;8(4):355–368. doi:10.1055/s-2004-861764
5. Juras V, Zbýň S, Mlynarik V, et al. The compositional difference between ankle and knee cartilage demonstrated by T2 mapping at 7 Tesla MR. Eur J Radiol. 2016;85(4):771–777. doi:10.1016/j.ejrad.2016.01.021
6. Apprich S, Mamisch TC, Welsch GH, et al. Quantitative T2 mapping of the patella at 3.0T is sensitive to early cartilage degeneration, but also to loading of the knee. Eur J Radiol. 2012;81(4):e438–443. doi:10.1016/j.ejrad.2011.03.069
7. Apprich S, Mamisch TC, Welsch GH, et al. Evaluation of articular cartilage in patients with femoroacetabular impingement (FAI) using T2* mapping at different time points at 3.0 Tesla MRI: a Feasibility Study. Skeletal Radiol. 2012;41(8):987–995. doi:10.1007/s00256-011-1313-1
8. Welsch GH, Trattnig S, Paternostro-Sluga T, et al. Parametric T2 and T2* mapping techniques to visualize intervertebral disc degeneration in patients with low back pain: initial results on the clinical use of 3.0 Tesla MRI. Skeletal Radiol. 2011;40(5):543–551. doi:10.1007/s00256-010-1036-8
9. Schmid-Schwap M, Bristela M, Pittschieler E, et al. Biochemical analysis of the articular disc of the temporomandibular joint with magnetic resonance T2 mapping: a Feasibility Study. Clin Oral Investig. 2014;18(7):1865–1871. doi:10.1007/s00784-013-1154-5
10. Ma XC. Fundamental and Clinical Study on Temporomandibular Disorders. Beijing: People’s Medical Publishing House Co.Ltd; 2000:129.
11. Kaya K, Dulgeroglu D, Unsal-Delialioglu S, et al. Diagnostic value of ultrasonography in the evaluation of the temporomandibular joint anterior disc displacement. J Craniomaxillofac Surg. 2010;38(5):391–395. doi:10.1016/j.jcms.2009.10.017
12. Dergin G, Kilic C, Gozneli R, Yildirim D, Garip H, Moroglu S. Evaluating the correlation between the lateral pterygoid muscle attachment type and internal derangement of the temporomandibular joint with an emphasis on MR imaging findings. J Craniomaxillofac Surg. 2012;40(5):459–463. doi:10.1016/j.jcms.2011.08.002
13. Katzberg RW, Tallents RH. Normal and abnormal temporomandibular joint disc and posterior attachment as depicted by magnetic resonance imaging in symptomatic and asymptomatic subjects. J Oral Maxillofac Surg. 2005;63(8):1155–1161. doi:10.1016/j.joms.2005.04.012
14. Zhu HM, Song XY, He DM, Yang Z, Shan YH. Research progress in the relationship between temporomandibular joint anterior disc displacement and dentofacial deformities in juveniles. Chin J Prac Stomatol. 2017;10(12):754–758.
15. Xiaohu Z, Yong W. Analysis of three-dimensional imaging findings in patients with temporomandibular joint disorders. Chin J Stomatol. 2017;37(12):1070–1074.
16. Flores-Mir C, Nebbe B, Heo G, Major PW. Longitudinal study of temporomandibular joint disc status and craniofacial growth. Am J Orthod Dentofacial Orthop. 2006;130(3):324–330. doi:10.1016/j.ajodo.2005.01.024
17. Bristela M, Skolka A, Eder J, et al. T2 mapping with 3.0 T MRI of the temporomandibular joint disc of patients with disc dislocation. Magn Reson Imaging. 2019;58:125–134. doi:10.1016/j.mri.2019.02.002
18. Cağlar E, Şahin G, Oğur T, Aktaş E. Quantitative evaluation of hyaline articular cartilage T2 maps of knee and determine the relationship of cartilage T2 values with age, gender, articular changes. Eur Rev Med Pharmacol Sci. 2014;18(22):3386–3393.
19. Larheim TA, Hol C, Ottersen MK, Mork-Knutsen BB, Arvidsson LZ. The role of imaging in the diagnosis of temporomandibular joint pathology. Oral Maxillofac Surg Clin North Am. 2018;30(3):239–249. doi:10.1016/j.coms.2018.04.001
20. Kretapirom K, Okochi K, Nakamura S, et al. MRI characteristics of rheumatoid arthritis in the temporomandibular joint. Dentomaxillofac Radiol. 2013;42(4):31627230. doi:10.1259/dmfr/31627230
21. Yu X-M, Jaskula-Sztul R, Ahmed K, Harrison AD, Kunnimalaiyaan M, Chen H. Resveratrol induces differentiation markers expression in anaplastic thyroid carcinoma via activation of Notch1 signaling and suppresses cell growth. Mol Cancer Ther. 2013;12(7):1276–1287. doi:10.1158/1535-7163.MCT-12-0841
 © 2021 The Author(s). This work is published and licensed by Dove Medical Press Limited. The
full terms of this license are available at https://www.dovepress.com/terms
and incorporate the Creative Commons Attribution
- Non Commercial (unported, 3.0) License.
By accessing the work you hereby accept the Terms. Non-commercial uses of the work are permitted
without any further permission from Dove Medical Press Limited, provided the work is properly
attributed. For permission for commercial use of this work, please see paragraphs 4.2 and 5 of our Terms.
© 2021 The Author(s). This work is published and licensed by Dove Medical Press Limited. The
full terms of this license are available at https://www.dovepress.com/terms
and incorporate the Creative Commons Attribution
- Non Commercial (unported, 3.0) License.
By accessing the work you hereby accept the Terms. Non-commercial uses of the work are permitted
without any further permission from Dove Medical Press Limited, provided the work is properly
attributed. For permission for commercial use of this work, please see paragraphs 4.2 and 5 of our Terms.