Back to Journals » Nature and Science of Sleep » Volume 13
Exhaled Nitric Oxide as a Surrogate Marker for Obstructive Sleep Apnea Severity Grading: An In-Hospital Population Study
Authors Dang-Thi-Mai K ![]() , Le-Dong NN, Le-Thuong V
, Le-Dong NN, Le-Thuong V ![]() , Tran-Van N
, Tran-Van N ![]() , Duong-Quy S
, Duong-Quy S ![]()
Received 17 February 2021
Accepted for publication 25 May 2021
Published 14 June 2021 Volume 2021:13 Pages 763—773
DOI https://doi.org/10.2147/NSS.S307012
Checked for plagiarism Yes
Review by Single anonymous peer review
Peer reviewer comments 2
Editor who approved publication: Prof. Dr. Ahmed BaHammam
Khue Dang-Thi-Mai,1 Nhat-Nam Le-Dong,2 Vu Le-Thuong,1 Ngoc Tran-Van,1 Sy Duong-Quy3,4
1Department of Respiratory Diseases, Cho Ray Hospital, Ho Chi Minh City, Vietnam; 2Department of Technology, Sunrise, Namur, Belgium; 3Bio-Medical Research Centre, Lam Dong Medical College, Dalat, Vietnam; 4Penn State Medical College, Hershey Medical Center, Hershey, PA, USA
Correspondence: Sy Duong-Quy
Bio-Medical Research Centre, Lam Dong Medical College, 16 Ngo Quyen, Dalat, Vietnam
Tel +84 918413813
Fax +84 2633815000
Email [email protected]
Purpose: Our study aimed to evaluate the relationship between exhaled nitric oxide (eNO) markers and obstructive sleep apnea (OSA) severity and verify the changes in eNO profiles among mild, moderate, and severe OSA subgroups.
Methods: This study was a cross-sectional and in-hospital population-based study. We investigated 123 OSA patients (17 mild, 23 moderate and, 83 severe OSA) in the department of respiratory diseases. Studied data included anthropometry, respiratory polygraphy, biological markers, spirometry, and multi-flow eNO measurements. Data analysis implied linear correlation, non-parametric ANOVA, and pair-wise comparison.
Results: No significant difference could be found among 3 OSA severity subgroups for FENO at – four sampling flow rates (50– 350 mL/s). The bronchial production rate of NO (J’awNO) was proportionally increased, with median values of 11.2, 33.9, and 36.2 in mild, moderate, and severe OSA, respectively (p=0.010). The alveolar concentration of NO (CANO) changed with a non-linear pattern; it was increased in moderate (6.49) vs mild (7.79) OSA but decreased in severe OSA (5.20, p = 0.015). The only correction that could be established between OSA severity and exhaled nitric oxide markers is through J’AWNO (rho=0.25, p=0.02) and CANO (rho= 0.18, p=0.04). There was no significant correlation between FENO measured at three different flow rates and the OSA severity. We also found a weak but significant correlation between FENO 100 and averaged SpO2 (rho = 0.07, p= 0.03).
Conclusion: The present study showed that J’AWNO, which represents eNO derived from the central airway, is proportionally increased in more severe OSA, while eNO from alveolar space, indicated by CANO, was also associated with OSA severity and relatively lower in the most severe OSA patients. In contrast, stand-alone FENO metrics did not show a clear difference among the three severity subgroups.
Keywords: exhaled nitric oxide, FENO, J’AWNO, CANO, obstructive sleep apnea
Introduction
Obstructive sleep apnea (OSA) is a sleep-related breathing disorder characterized by repeated collapse of the upper airway, which induces intermittent episodes of apnea or hypopnea during sleep despite an ongoing respiratory effort. The worldwide prevalence of OSA is about 13% in males and 6% in females;1 it was estimated at 8.5% in Vietnam2 and currently emerging with the development of obesity. A recent study showed that the estimated prevalence of OSA diagnosed with an apnea-hypopnea index (AHI) ≥ 15/hour in the population aged from 30 to 69 years might up to 34.4%.3 OSA is also considered an independent risk factor for cardio-vascular/cardiovascular diseases such as hypertension, arrhythmia, or stroke.4 The treatment of OSA with continuous positive airway pressure (CPAP) in hypertensive patients, especially for those who are resistant to antihypertensive therapy, might decrease cardiovascular risks5 The well-known consequences of OSA include arousals and intermittent hypoxia. Intermittent hypoxia would be a mechanism of oxidative stress, inflammation, and metabolic dysfunctions in OSA patients.6 Following some previous studies, cardiovascular morbidities usually develop with OSA severity. Thus, evaluating pulmonary inflammation due to oxidative stress may be useful for early detection of patients with severe OSA before going forward with polysomnography or respiratory polygraphy for making the diagnosis and therapeutical decisions.
Nitric oxide (NO) plays an important role both as a physiological modulator of vascular tone and a pathological pro-inflammatory biomarker implicated in different respiratory disorders.7 NO can be easily measured in the exhaled air. Hypotheses support the implication of exhaled NO (eNO) in the two principal pathological processes observed in OSA, including pulmonary or local inflammation and endothelium dysfunction.8 Techniques for measuring eNO offer a noninvasive, reliable, and easy way to assess the inflammation within the upper airway and bronchial system through the fraction of NO in the airway compartment (FENO). However, the OSA related changes in FENO have been reported in previous study with controversial findings.9–12 Some authors observed an increased eNO in OSA patients compared with non-OSA subjects, whereas others demonstrated a decreased value of this marker. These differences might be related to the measured outcome (as FENO is sensitive to many confounding factors), or the structure of the studied population (distribution of OSA severities among the patients). FENO values tend to be higher in subjects with OSA than in healthy subjects.13
Therefore, we conducted this study on an in-hospital population to evaluate the relationship between eNO markers and OSA severity, and to verify the changes in eNO profiles among Mild, Moderate, and Severe OSA subgroups.
Participants and Methods
Participants
Consecutive patients meeting the inclusion criteria were prospectively recruited for the present study after signing a written consent form. All patients had been referred to the Department of Respiratory Diseases of Cho Ray Hospital from October 2017 to October 2019 because of clinical symptoms suggestive of OSA and underwent respiratory polygraphy.
Inclusion criteria: adults with suspected symptoms of OSA (snoring or choking during sleep, daytime sleepiness, nocturia, headache in the morning, or daytime tiredness); being capable of doing laboratory tests and respiratory polygraphy under technicians’ instructions, and accepting to sign the consent form.
Exclusion criteria: an acute infectious disease with respiratory symptoms; diagnosed asthma or asthma like symptoms; chronic obstructive pulmonary disease (COPD); diagnosed lung fibrosis or pulmonary hypertension; decompensation of cardiovascular diseases; mental or physical deficits; other comorbidities such as systemic sclerosis, lupus, and polyarthritis; subjects who currently use systemic corticosteroids or inhaled corticosteroids were also excluded from the study.
Ethics Statement
This study was approved by the Institutional Review Board of Cho Ray Hospital and the University of Medicine and Pharmacy of Ho Chi Minh city (192/ĐHYD-HĐ; June, 26th 2016). All patients were informed about the purpose of the study, and that it was conducted in accordance with the Declaration of Helsinki.
Physical Examination and Sleep Questionnaires
All subjects underwent a detailed clinical interview with the questionnaires for symptoms of sleep disorder breathing, medical history, sleep habits, and other sleep disorders, as well as the Epworth sleepiness scale (ESS).14 The ESS assesses the general level of daytime sleepiness by having individuals evaluate the likelihood of drowsiness during eight different daytime situations. Scores ≥11 are considered excessive daytime sleepiness (EDS), otherwise, to be non-EDS (scores 0–10). Self-evaluation of sleepiness was measured by visual analog scale (0–10). PICHOT scale was used to measure the severity of tiredness (0–32).15 The general information was recorded, such as age, sex, body mass index (BMI), abdomen circumference (AC), and neck circumference (NC). The waist circumference was measured with a measuring tape in a horizontal plane around the abdomen at the level of the iliac crest and the end of a normal expiration of the subject. The neck circumference was measured at mid-neck, between the mid-cervical spine and the mid-anterior neck, on issues standing upright and facing forwards, with shoulders relaxed.
Respiratory Polygraphy and Parameters
Each subject underwent overnight respiratory polygraphy (RP) in a sleep laboratory (CareFusion; Germany). The following parameters were continuously recorded oxygen saturation (pulse oximeter). Respiratory effort was measured by thoracoabdominal strain gauges and nasal airflow (thermistor signals and pressure cannula), position with a suprasternal sensor.
Apnea was defined as recommended by the American Academy of Sleep Medicine (AASM) as the cessation of airflow for at least 10 seconds; hypopnea was defined if all of the following criteria were met: (1) peak signal excursions drop by at least 30% of pre-event baseline, (2) duration of the at least 30% drop in signal excursion was ten or more seconds, and (3) there was 3% or greater oxygen desaturation from pre-event baseline.16,17
All the RP were done at the hospital under supervising sleep technicians via camera observation during the night. The RP was switched on or off by sleep technicians on duty and depended on patients’ sleep onset or awake status. The sleep diary was also done for each patient during the present study.
Exhaled NO Measurements
Exhaled nitric oxide was measured at multiple flow rates (50 mL/s, 100 mL/s, 150 mL/s, and 350 mL/s) after RP (6:00 AM) using an electrochemical-based analyzer (FeNO+; Medisoft-MGCD, USA). Technical measurement of exhaled NO was conducted according to manufacturer’s instructions and as described previously and recommended by the European Respiratory Society.10,18 The maximal bronchial production rate of NO (J’awNO) and alveolar concentration of NO (CANO) were automatically determined using the two-compartment model by Tsoukias and George: VNO = J’awNO + CANO × VE via Expair’s software.
Biochemical Testing
At the end of the sleep test in the following day, blood exams were taken from each subject, and the following tests were done: fasting glucose and lipid profile (HDL-c, LDL-c, Triglyceride). The fasting glucose and lipid profiles were done by using the Aptio® Automation systems of Siemens Healthineers –Germany.
Spirometry
All patients underwent standard spirometry (KoKo; nSpire; UK). For each pulmonary function test, three maximal flow-volume loops were taken to determine FVC and FEV1; the largest one was retained to calculate the ratio of FEV1 to FVC (FEV1/FVC).
Data Analysis
Data were analyzed using a scientific computing package (scipy) in the Python programming language. The analysis plan consists of 3 steps: First, the characteristics of comorbidities, anthropometric, cardiovascular and respiratory function were described for 3 clinical sub-groups. The difference in the distribution of sleepiness score and polygraphy metrics among OSA severity levels was also evaluated. Next, we explored the relationship between exhaled nitric oxide markers (FENO, J’AWNO, CANO) and the conventional OSA markers, such as sleepiness score, AHI, and SpO2 based indices, Spearman correlation analysis.
Finally, we performed a non-parametric ANOVA (Kruskal–Wallis H-test) and pair-wise comparison using Conover post-hoc test to verify the changes in exhaled NO profiles among Mild, Moderate, and Severe OSA subgroups. Null-hypothesis testing was based on a significance threshold of p < 0.05.
Results
Characteristics of the Studied Population
From January 2017 to December 2019, 123 patients with a confirmed diagnosis of OSA have been consecutively included - in the study and completed the study; six other patients were excluded from the study due to being unable to do the repeated exhaled NO measurements. According to the AASM severity grading system, most of these patients (67.5%) have severe OSA, while the Mild and Moderate OSA patients occupied respectively 13.8% and 18.7%. Their clinical characteristics are shown in Table 1. In brief, there were significant differences in LDL level, BMI, neck, and waist circumferences among three severity subgroups, which indicate an association between obesity as a risk factor and the severity of OSA. However, no significant difference has been found for blood glucose, HDL, and triglycerides.
 |
Table 1 Characteristics of the OSA Patients in 3 Severity Sub-Groups |
Among the cardiovascular comorbidities, only hypertension was significantly associated with OSA severity. Though the frequency of ischemic heart disease was relatively high within the Severe OSA group compared with Mild or Moderate groups, such difference was not statistically significant.
The distributions of 25 numeric variables, stratified by three severity subgroups are shown in Figure 1. As expected, the AHI was normally distributed within each group. All morphometric parameters, as well as blood pressure and sleepiness scores have a normal distribution. Still, a skewed distribution with large dispersion characterizes other physiological metrics, such as FEV1, FENO, J’AWNO, CANO, and SpO2. Among the studied parameters, only BMI, SpO2, FENO 350, J’AWNO, and CANO showed relatively straightforward contrast among three subgroups, suggesting a potential association between those parameters and the OSA severity.
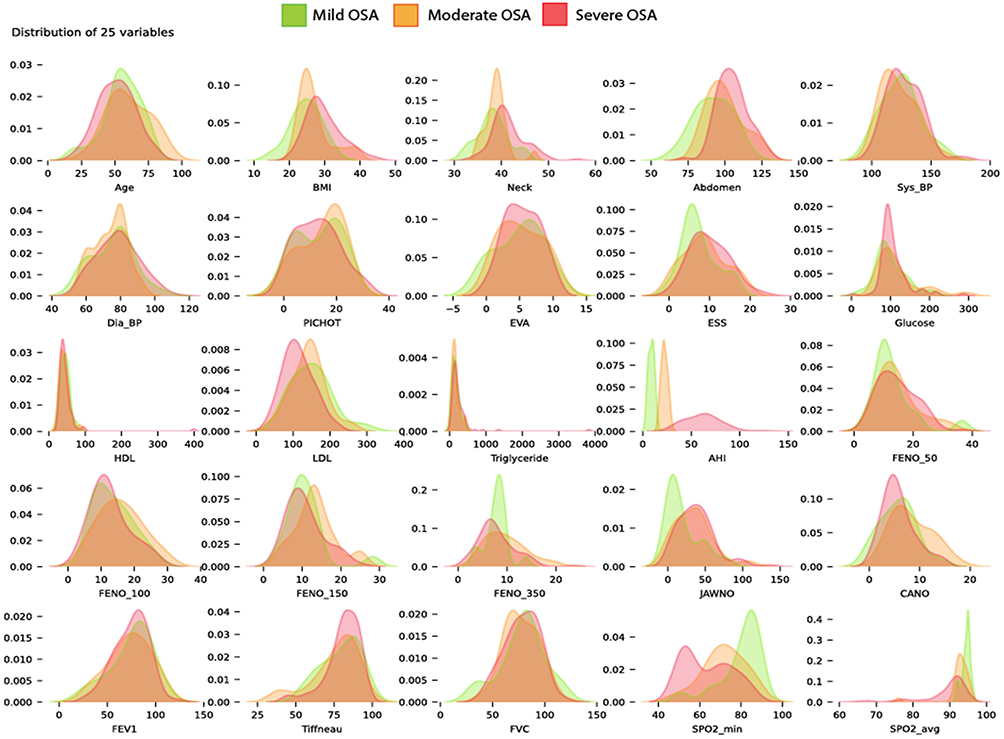 |
Figure 1 Distribution of 25 parameters among 3 clinical subgroups. Abbreviations: Sys_BP, systolic blood pressure; Dia_BP, diastolic blood pressure; BMI, body mass index; HDL, high density lipid; LDL, low density lipid; FEV1, forced expiratory volume in one second; FVC, forced vital capacity; FENO, fractional exhaled nitric oxide; J’AWNO, bronchial nitric oxide flow; CANO, alveolar concentration of nitric oxide; ppb, part per billion; ESS, Epworth sleepiness scale; VAS, visual analog scale; HDL, high density lipid; LDL, low density lipid; SpO2, pulse oxygen saturation. Notes: Each panel consists of a stratified Kernel density plot, visualizing the distribution of a numeric variable within 3 OSA severity subgroups (Mild in green, Moderate in orange and Severe in red). |
In our study, clinical aspects of OSA were evaluated using both subjective and objective methods. These outcomes are represented in Table 2. The subjective approach consists of using the questionnaires such as Epworth, EVA, and PICHOT; none of them showed a significant difference. In contrast, all the objective measurements, including AHI and SpO2 indices, showed an evident disparity among three OSA severity subgroups.
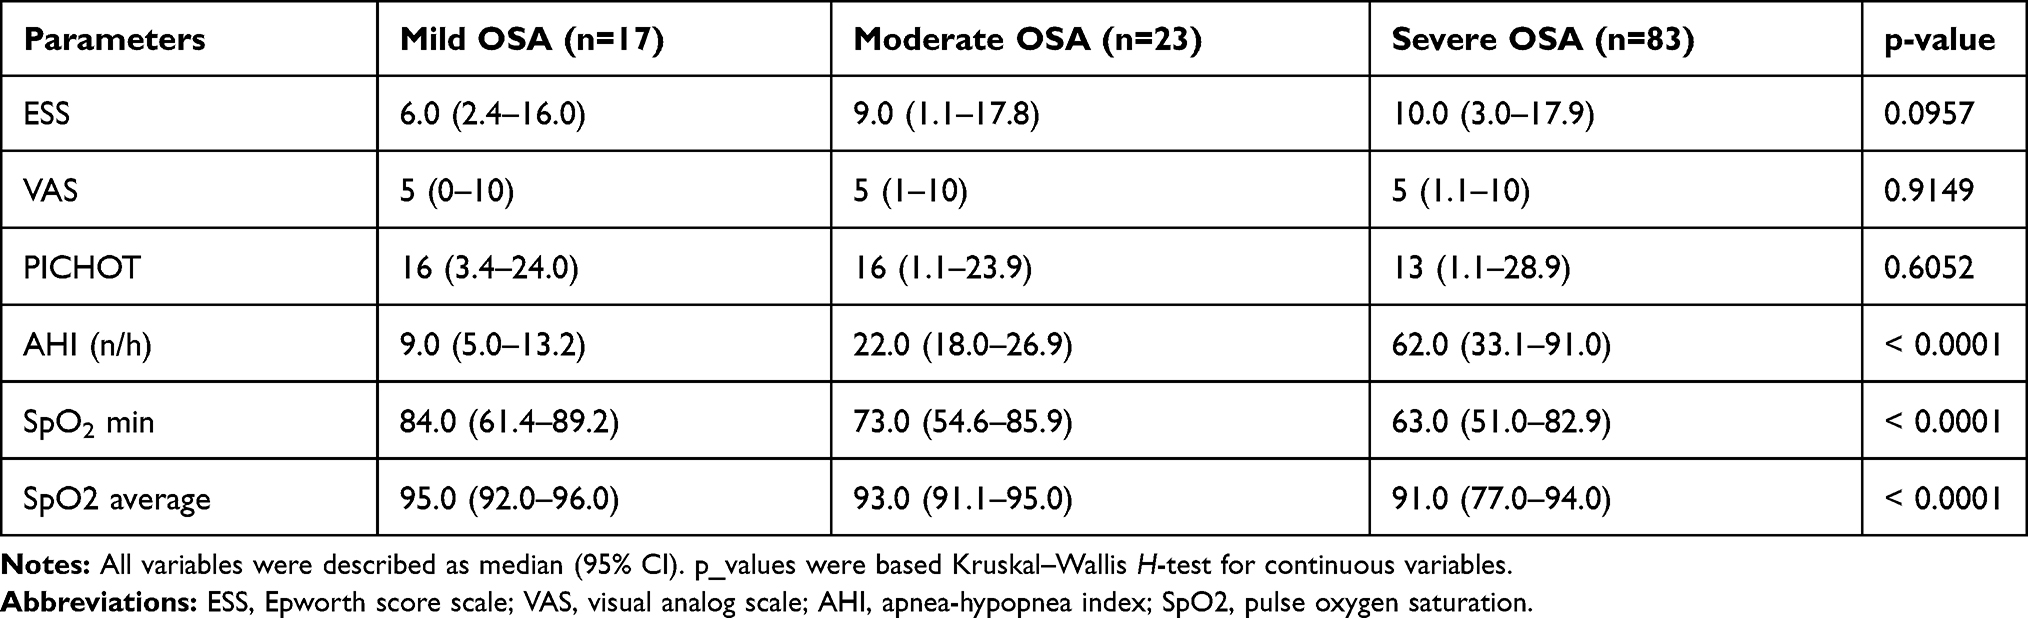 |
Table 2 Sleepiness Score and Polygraphy Metrics Among 3 OSA Severity Sub-Groups |
Exhaled Nitric Oxide in the Association Network with Other Clinical Parameters
In the present study, we measured the exhaled nitric oxide at multiple sampling flow rates. This maneuver allows an assessment of nitric oxide variation at different locations in the respiratory system, including CANO and FENO 350 for the distal compartment (alveoli, alveolar duct and bronchioles), and J’AWNO, FENO50-150 for the proximal airway (bronchi and tracheal tube).
Before targeting those parameters as a surrogate marker in OSA, we performed a pair-wise linear correlation analysis. The association network (Figure 2) allows an overview of the relationship between exhaled nitric oxide parameters and other clinical metrics.
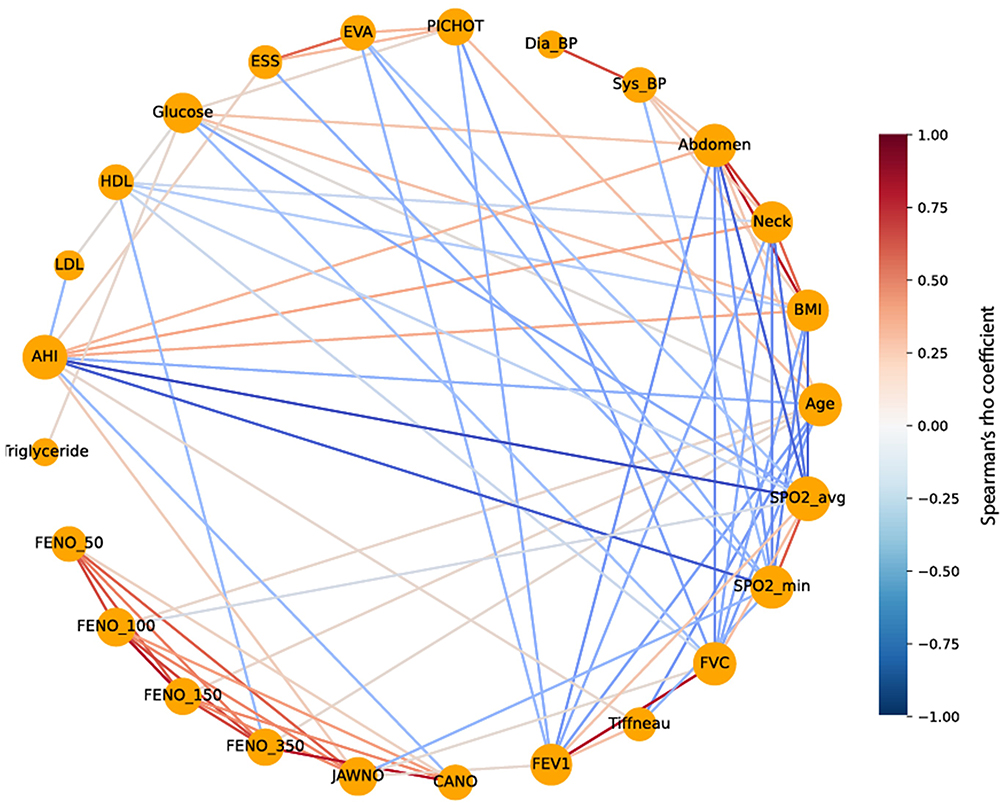 |
Figure 2 Correlation network of 25 parameters. Abbreviations: Sys_BP, systolic blood pressure; Dia_BP, diastolic blood pressure; BMI, body mass index; HDL, high density lipid; LDL, low density lipid; FEV1, forced expiratory volume inone second; FVC, forced vital capacity; FENO, fractional exhaled nitric oxide; J’AWNO, bronchial nitric oxide flow; CANO, alveolar concentration of nitric oxide; ppb, part per billion; ESS, Epworth sleepiness scale; VAS, visual analog scale; HDL, high density lipid; LDL, low density lipid; SpO2, pulse oxygen saturation. Notes: In this correlation network, each node (in orange) indicates a clinical or functional parameter, the node size is proportional to number of significant correlations between that parameter to others. |
The AHI, and SpO2 have a central role in this network, as they got the highest number of association links to other parameters. The six exhaled nitric oxide parameters (FENO50, 100, 150, J’AWNO, and CANO) formed a cluster with dense co-relationships among them.
The only connection that could be established between OSA severity and exhaled nitric oxide markers was through J’AWNO (bronchial maximal diffusing rate, rho=0.25, p=0.02) and CANO (alveolar concentration, rho= 0.18, p=0.04). There was no significant correlation between FENO measured at three different flow rates and the OSA severity. We also found a weak but significant correlation between FENO 100 and averaged SpO2 (rho = 0.07, p= 0.03).
Changes in Exhaled NO Profiles Among Three Levels of OSA Severity
Next, we evaluated the changes in 6 nitric oxide markers among 3 OSA severity subgroups using a non-parametric analysis of variance and pair-wise comparisons. The results are presented in Tables 3 and 4.
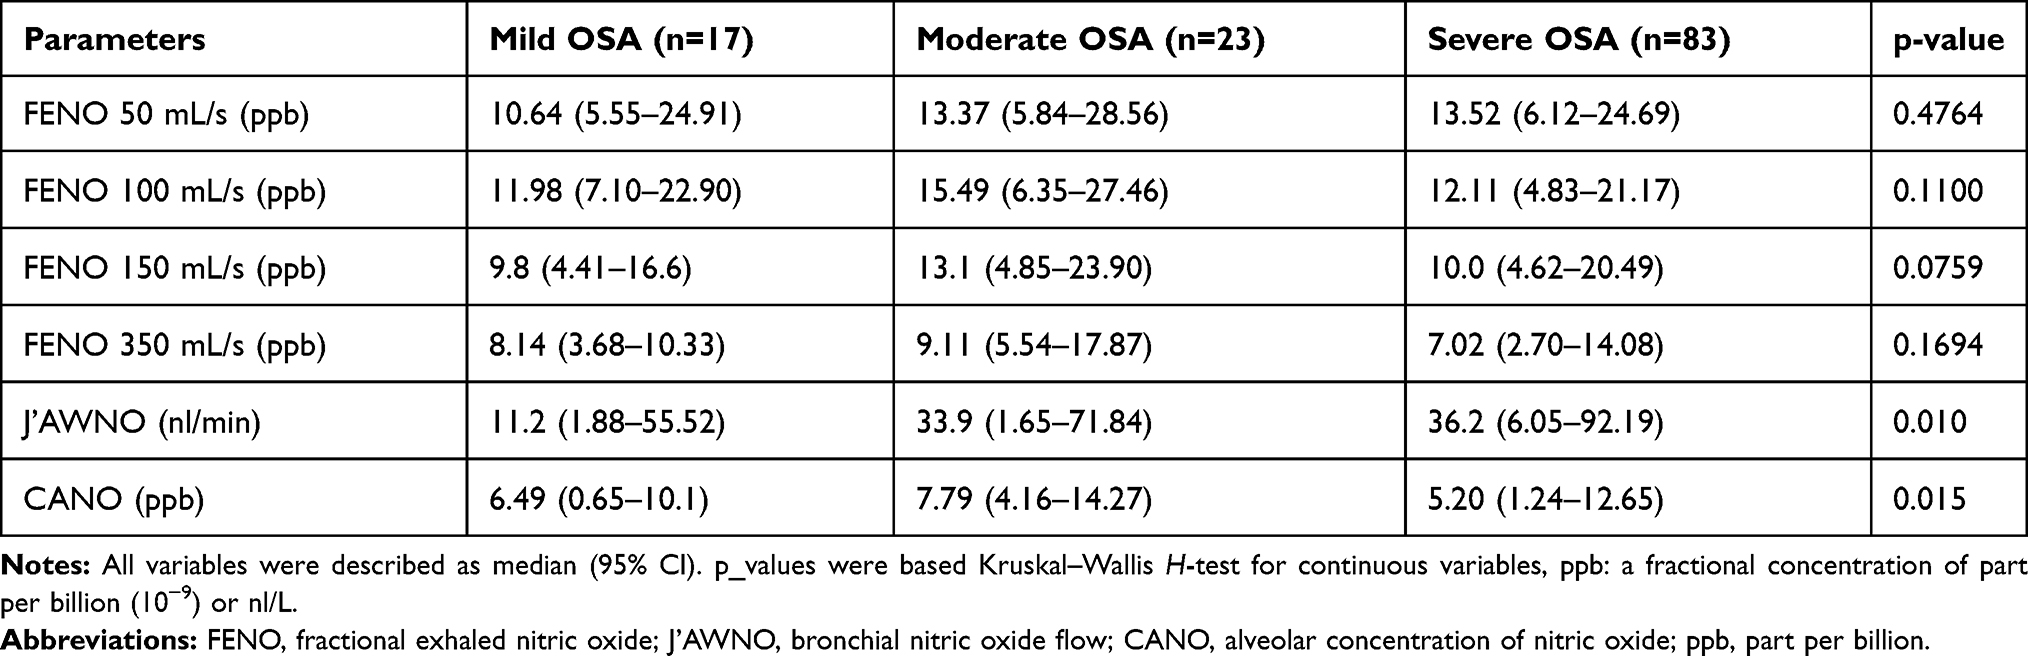 |
Table 3 Distribution of Exhaled NO Metrics Within 3 OSA Severity Sub-Groups |
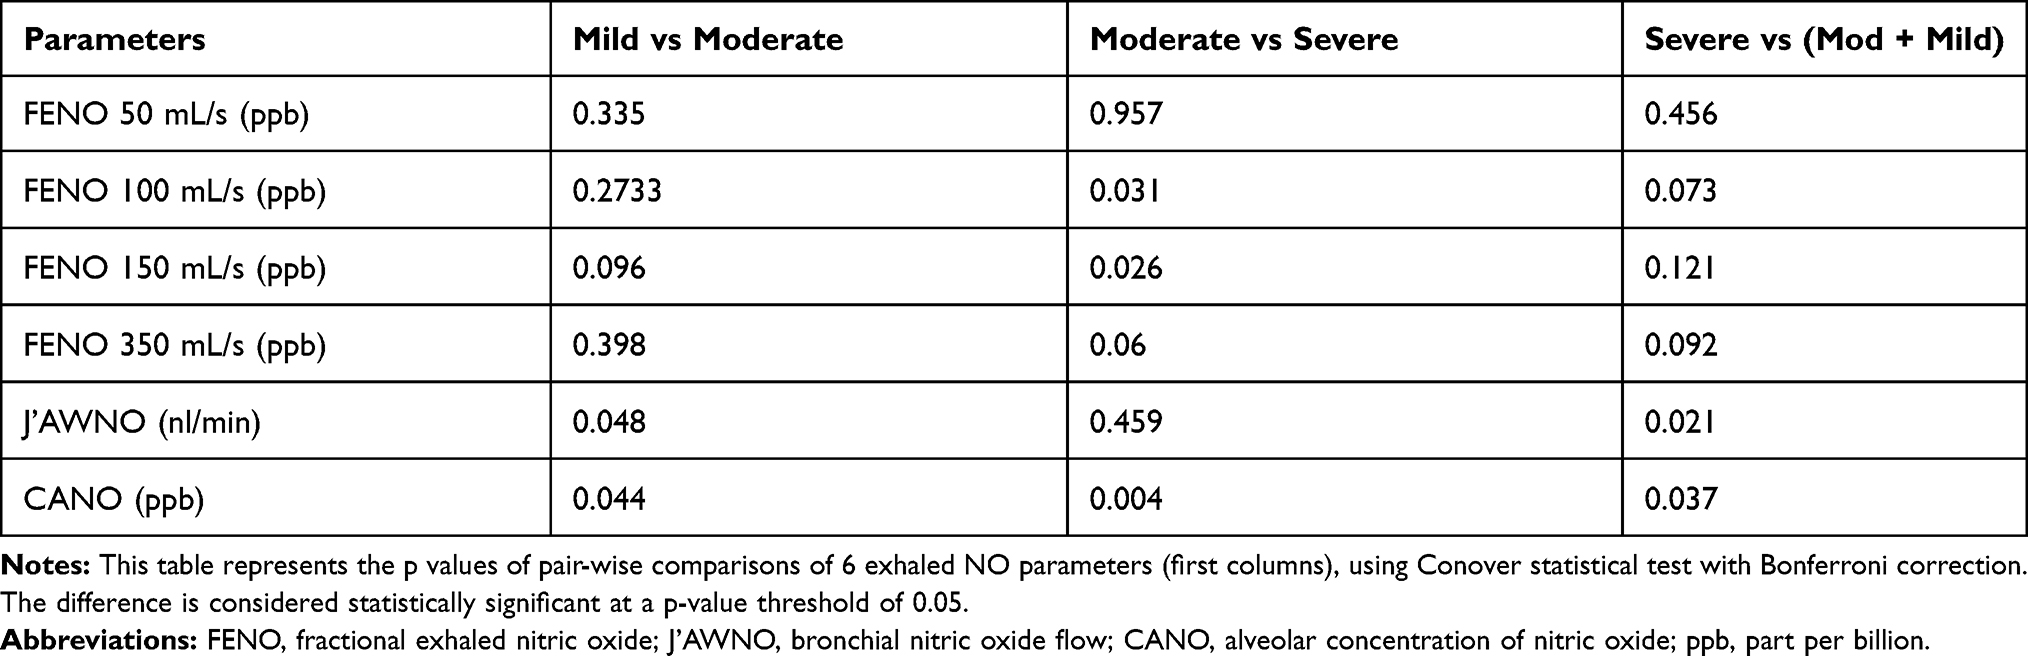 |
Table 4 Results of Pair-Wise Comparison for Exhaled NO Parameters |
Though the overall analysis of variance showed no significant difference in the distribution profile of FENO markers, the pair-wise comparison reveals that the FENO measured at a medium sampling flow rate (100–150 mL/s) did change significantly between moderate and Severe OSA (p = 0.03).
The median value of bronchial maximal NO production rate (J’AWNO) was significantly increased in proportion with the OSA severity (11.2 vs 33.9 vs 36.2, p=0.01). After applying a Bonferroni adjustment, we found that the change in J’AWNO was relatively weak but significant and mainly located between Mild versus Moderate, but not significant between Moderate and Severe levels. We could differentiate the Severe versus Moderate and Mild OSA by J’AWNO with p-values of 0.021.
The alveolar concentration of NO (CANO) also represents a significant variation among 3 severity groups (p=0.015); however the variation pattern was not linear: the patients with moderate OSA had higher CANO than that in mild OSA (7.79 ppb vs 6.49 ppb), but the CANO was decreased in severe OSA group (5.2 ppb). The pair-wise comparisons indicated that CANO allows significantly differentiate between Mild versus Moderate, Moderate versus Severe, and Severe versus Moderate or Mild OSA (p values = 0.04, 0.004, and 0.037, respectively).
Each sampling flowrate (50, 100, 150 and 350 mL/s) allows to the measurement of a specific value of FENO, and each one represents a mixture of NO from different origins, including alveolar concentration (CANO) – the first compartment and contribution of NO production from epithelial tissues to varying depths of the bronchial tube. Therefore, stand-alone FENO metrics may not characterize nitric oxide production rate in each compartment. Applying a simple linear regression model, as proposed by Georges and Tsoukias in 1998, we could determine the J’AWNO and CANO from a combination of 3 or more FENO values measured at different sampling flow rates. As shown in Figure 3, there is a clear differentiation between the regression line in Moderate OSA groups, compared to that in the other 2 OSA severity groups. The regression line of Moderate OSA has higher intercept and slopes, indicating higher values of J’AWNO and CANO, respectively.
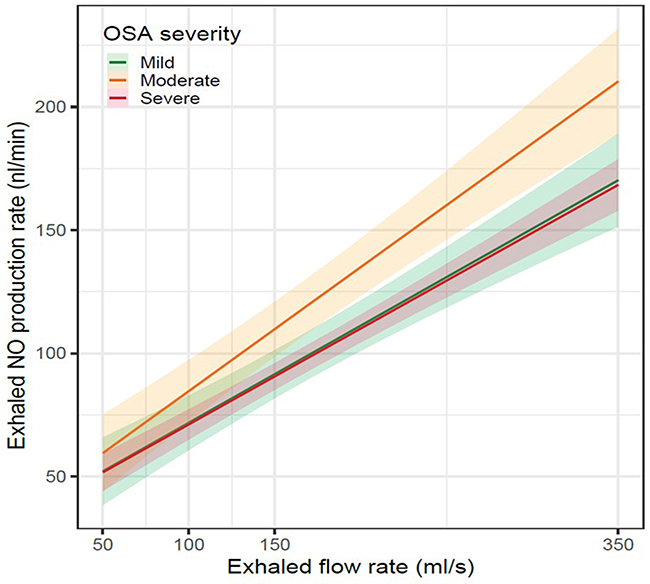 |
Figure 3 Impact of OSA severity on the result of multi-flow exhaled NO measurement. Notes: This regression plot reproduces the SC Georges’s bi-compartment linear model: VNO = J’AWNO + CANO *VE, exploring the exhaled nitric oxide production rate (VNO, nl/min) to the sampling flow rate (VE). Based on this model, we determine the J’AWNO (bronchial nitric oxide flow) as the intercept of the regression line, and CANO (alveolar concentration of nitric oxide) as the regression slope. The graph illustrates how OSA (obstructive sleep apnea) severity (mild in green, moderate in orange, and severe red) modifies the J’AWNO and CANO values. |
Discussion
Our study provides for the first time a comprehensive analysis of all 6 exhaled nitric oxide metrics as surrogate markers at different severity grades of OSA. Unlike the previous studies that implied a case-control design, our study targeted mild to severe patients instead of comparing OSA and non-OSA subgroups.
The key findings in our study: (1) There is a weak but significant relationship between the bronchial production rate of NO and alveolar concentration of NO and OSA severity; (2) the bronchial NO rate would increase in proportional as AHI values increase, while the CANO increases in mild to moderate OSA, but decreases in patients with severe OSA. Together, these results indicate that J’AWNO and CANO drove from a multi-flow exhaled; NO measurement could be used as potential surrogate markers for distinguishing among 3 severity levels of OSA.
The potential utility of exhaled NO in OSA was previously demonstrated in case-control studies, which reported a significantly higher level of FENO between OSA and non-OSA patients. Some authors have also reported a correlation between OSA severity and FENO.10,19,20 Physiologically, increased FENO might suggest an eosinophilic inflammation within the upper and/lower airways.7 However, unlike asthma, OSA-related inflammation does not imply the eosinophil cells. Previous studies demonstrated that many inflammatory cells, including neutrophils and lymphocytes in the sputum, mucosa, and muscular layer of the upper airway in OSA patients.21–23
Snoring is an important symptom of OSA. Local inflammation due to mechanic stress might explain the increased level of exhaled NO in snorer and OSA patients.24 Intermittent hypoxia and its close relationship with oxidative stress might also explain the correlation between exhaled NO metrics and OSA severity.25
In our study, J’AWNO and CANO were correlated with AHI, the key metric for OSA severity grading. Though the FENO values by themselves were not associated with OSA severity, a FENO measurement using at least three sampling flowrate levels is required to obtain J’AWNO and CANO. In the present study, all the measurement of exhaled NO were done in duplicates, and which one with higher confident coefficients done by Hypair FeNO+ device was selected for analysis. Previously, Lazar et al showed that some patients could not deliver reliable measurements of exhaled NO with multiple flows.26 However, in comparison with Lazar’s study, where the measurements of CANO were done in asthmatic patients, which was in our study was done in subjects without chronic respiratory disease, and all subjects completed the measurements of exhaled NO without any difficulty.
Our findings suggest that a measurement of FENO at multiple flow rates might be more beneficial than a conventional single flow measurement (FENO 50 mL/s) for monitoring local inflammation associated with OSA severity in a population of mild to severe OSA patients. The fact that J’AWNO was increased in more severe OSA suggests that though the fraction of NO would be consistently high within the mouth and tracheal tube of all patients, those who have more severe OSA were characterized by a higher bronchial NO production rate, which is independent to the sampling flowrate. A persistent high rate of NO biosynthesis within the bronchial tissues is an indicator of chronic airway inflammation, contributing to disease worsening or development in OSA, as suggested by Culla et al.19 High J’AWNO was also well correlated with nadir SpO2, suggesting an association between intermittent hypoxia combined with micro-arousal and airway inflammation.
However, the nonlinear pattern of CANO in patients with moderate to severe OSA is more difficult to explain. Here, we focused on the decreased CANO when passing from Moderate to Severe OSA, as identification of such population would be helpful for a decision on OSA therapy and screening for cardiovascular comorbidities. CANO value is determined by a dynamic equilibration between the NO level between alveolar space and pulmonary circulation. A decreased CANO value could be explained by inhibiting alveolar eNOS under the hypoxic burden, or increased uptake by hemoglobins within the pulmonary capillary circulation.
Girgis et al reported that reduced CANO could be attributable to an injury of alveolar endothelium and increased reactive oxidative species production in leukocytes in peripheral airspace.27 Oxidative stress due to intermittent hypoxia inhibits phosphorylation of endothelial nitric oxide synthase (eNOS) and reduces NO levels.28 These processes are consistent with the pathological pattern in severe OSA, representing more systemic inflammation than mild, moderate OSA. In addition, alveolar NO diffuses rapidly after its biosynthesis across the air-blood barrier for its lipid-soluble feature. Liu Jie et al reported in their study that in alveoli, NO serves as a compensatory mechanism contributing to the regulation of pulmonary circulation, This process occurred rapidly and constantly because NO could bind to hemoglobin and oxidize it quickly.29 Beyond that, a prolonged increase of inflammatory cytokines, adhesion molecules, and microparticles in OSA have been proved to be responsible for local inflammation and endothelial dysfunction.30
Thus, it would be reasonable if both high J’AWNO and low CANO could be observed in severe OSA, compared with mild or moderate OSA. Though CANO correlated with AHI, airway obstruction, and age, neither COPD nor Tiffeneau (FEV1/VC) index was associated with OSA severity. We could exclude the effect of chronic lung diseases on the change of exhaled NO in our patients. Therefore, OSA is probably the essential attribution of airway inflammation. Although the analysis of exhaled NO is a non-invasive, harmless, and still not fully standardized method to investigate the pathophysiology of OSA,13,31–33 based on our findings, CANO could be used as marker of endothelial dysfunction for differentiating patients from healthy subjects. However, the contradictions with the CANO value measured using the simple linear model should be considered the limitation of this technique. A previous study demonstrated by Fortuna et al showed that severe OSA patients had lower CANO levels, and these were restored to normal after CPAP treatment. A recent meta-analysis done by Zhang et al suggested that OSA was significantly associated with elevated FENO levels. Still, J’awNO and CANO levels were not very different between the OSA groups and control groups.32 Inversely, Duarte et al found out the FENO values were similar among subjects with and without OSA −0.610); however, this study did not measure CANO levels in OSA patients. Finally, the present study also has some other limitations regarding the lack of a control group and respiratory polygraphy instead of PSG. In addition, the result of exhaled NO values, especially for CANO, was not presented in adjusting on cofounders, including age, sex and BMI. Although one of the exclusion criteria was having a current chronic respiratory disease such as asthma or chronic obstructive pulmonary disease, two subjects had a medical history of childhood asthma. It was sure that the limited number of issues in each subgroup also contributed to the study limitation.
Conclusion
The present study showed that J’AWNO, which represents eNO derived from the central airway, is proportionally increased in more severe OSA, whilst eNO from alveolar space, indicated by CANO, was also associated with OSA severity and relatively lower in the most severe OSA patients. In contrast, stand-alone FENO metrics did not show a clear difference among the three severity subgroups. Therefore, it’s recommended measure exhaled NO at multiple sampling flow rates for evaluating pathological changes in airway inflammation and/or endothelial dysfunction, which differentiate the most severe patients from those who have moderate or mild OSA.
Disclosure
The authors declare no conflicts of interest.
References
1. Kapur VK. Obstructive sleep apnea: diagnosis, epidemiology, and economics. Respir Care. 2010;55(9):1155–1167.
2. Duong-Quy S, Dang Thi Mai K, Tran Van N, et al. Study about the prevalence of the obstructive sleep apnoea syndrome in Vietnam. Rev Mal Respir. 2018;35(1):14–24. doi:10.1016/j.rmr.2017.10.006
3. Benjafield AV, Ayas NT, Eastwood PR, et al. Estimation of the global prevalence and burden of obstructive sleep apnoea: a literature-based analysis. Lancet Respir Med. 2019;7(8):687–698. doi:10.1016/S2213-2600(19)30198-5
4. Lévy P, Kohler M, McNicholas WT, et al. Obstructive sleep apnoea syndrome. Nat Rev Dis Primers. 2015;1:15015.
5. Gonzaga C, Bertolami A, Bertolami M, et al. Obstructive sleep apnea, hypertension and cardiovascular diseases. J Hum Hypertens. 2015;29(12):705–712. doi:10.1038/jhh.2015.15
6. Dewan NA, Nieto FJ, Somers VK. Intermittent hypoxemia and OSA: implications for comorbidities. Chest. 2015;147(1):266–274. doi:10.1378/chest.14-0500
7. Bjermer L, Alving K, Diamant Z. Current evidence and future research needs for FeNO measurement in respiratory diseases. Respir Med. 2014;108(6):830–841. doi:10.1016/j.rmed.2014.02.005
8. Vicente E, Marin JM, Carrizo SJ, et al. Upper airway and systemic inflammation in obstructive sleep apnoea. Eur Respir J. 2016;48(4):1108–1117. doi:10.1183/13993003.00234-2016
9. Cowan DC, Allardice G, Macfarlane D, et al. Predicting sleep disordered breathing in outpatients with suspected OSA. BMJ Open. 2014;4(4):e004519. doi:10.1136/bmjopen-2013-004519
10. Duong-Quy S, Hua-Huy T, Tran-Mai-Thi HT, et al. Study of exhaled nitric oxide in subjects with suspected obstructive sleep apnea: a pilot study in Vietnam. Pulm Med. 2016;2016:3050918. doi:10.1155/2016/3050918
11. Hua-Huy T, Le-dong NN, Duong-Quy S, et al. Increased alveolar nitric oxide concentration is related to nocturnal oxygen desaturation in obstructive sleep apnoea. Nitric Oxide. 2015;45:27–34. doi:10.1016/j.niox.2015.01.008
12. JalilMirmohammadi S, Mehrparvar AH, Safaei S, Samimi E, Torab Jahromi M. The association between exhaled nitric oxide and sleep apnea: the role of BMI. Respir Med. 2014;108(8):1229–1233. doi:10.1016/j.rmed.2014.05.010
13. Bikov A, Hull JH, Kunos L. Exhaled breath analysis, a simple tool to study the pathophysiology of obstructive sleep apnoea. Sleep Med Rev. 2016;27:1–8. doi:10.1016/j.smrv.2015.07.005
14. Johns MW. A new method for measuring daytime sleepiness: the Epworth Sleepiness Scale. J Sleep Res Sleep Med. 1991;14(6):540–545.
15. Pichot P, Brun JP. Questionnaire bref d’auto-évaluation des dimensions dépressive, asthénique et anxieuse. Ann Més-Psychol. 1984;142:862–865.
16. American Academy of Sleep Medicine. International Classification of Sleep Disorders: Diagnostic and Coding Manual. 2. Westchester: American Academy of Sleep Medicine; 2005.
17. Collop NA, Anderson WM, Boehlecke B, et al. Portable Monitoring Task Force of the American Academy of Sleep Medicine. Clinical guidelines for the use of unattended portable monitors in the diagnosis of obstructive sleep apnea in adult patients. Portable Monitoring Task Force of the American Academy of Sleep Medicine. J Clin Sleep Med. 2007;3(7):737–747.
18. Horváth I, Barnes PJ, Loukides S, et al. A European Respiratory Society technical standard: exhaled biomarkers in lung disease. Eur Respir J. 2017;49(4):1600965. doi:10.1183/13993003.00965-2016
19. Culla B, Guida G, Brussino L, et al. Increased oral nitric oxide in obstructive sleep apnoea. Respir Med. 2010;104(2):316–320. doi:10.1016/j.rmed.2009.09.020
20. Ai-Ping C, Aboussouan Loutfi S, Minai Omar A, et al. Long-term continuous positive airway pressure therapy normalizes high exhaled nitric oxide levels in obstructive sleep apnea. J Clin Sleep Med. 2013;9(6):529–535. doi:10.5664/jcsm.2740
21. Devouassoux G, Levy P, Rossini E, et al. Sleep apnea is associated with bronchial inflammation and continuous positive airway pressure-induced airway hyperresponsiveness. J Allergy Clin Immunol. 2007;119(3):597–603. doi:10.1016/j.jaci.2006.11.638
22. Kheirandish-Gozal L, Gozal D. Obstructive sleep apnea and inflammation: proof of concept based on two illustrative cytokines. Int J Mol Sci. 2019;20(3):459. doi:10.3390/ijms20030459
23. Sabato R, Guido P, Salerno FG, et al. Airway inflammation in patients affected by obstructive sleep apnea. Monaldi Arch Chest Dis. 2006;65(2):102–105. doi:10.4081/monaldi.2006.572
24. Inancli Hasan M, Murat E. Obstructive sleep apnea syndrome and upper airway inflammation. Recent Pat Inflamm Allergy Drug Discov. 2010;4(1):54–57. doi:10.2174/187221310789895568
25. May AM, Mehra R. Obstructive sleep apnea: role of intermittent hypoxia and inflammation. Semin Respir Crit Care Med. 2014;35(5):531–544. doi:10.1055/s-0034-1390023
26. Lázár Z, Horváth P, Puskás R, et al. A suitable protocol for measuring alveolar nitric oxide in asthma with differing severity to assess peripheral airways inflammation. J Asthma. 2019;56(6):584–593. doi:10.1080/02770903.2018.1477957
27. Girgis RE, Gugnani MK, Abrams J, et al. Partitioning of alveolar and conducting airway nitric oxide in scleroderma lung disease. Am J Respir Crit Care Med. 2002;165(12):1587–1591. doi:10.1164/rccm.2104003
28. Vinnikov D, Brimkulov N, Redding-Jones R, Jumabaeva K. Exhaled nitric oxide is reduced upon chronic intermittent hypoxia exposure in well-acclimatized mine workers. Respir Physiol Neurobiol. 2011;175(2):261–264. doi:10.1016/j.resp.2010.11.013
29. Liu J, Li Z, Liu Z, et al. Exhaled nitric oxide from the central airway and alveoli in OSAHS patients: the potential correlations and clinical implications. Sleep Breath. 2016;20(1):145–154. doi:10.1007/s11325-015-1198-7
30. Garvey JF, Taylor CT, McNicholas WT. Cardiovascular disease in obstructive sleep apnoea syndrome: the role of intermittent hypoxia and inflammation. Eur Respir J. 2009;33(5):1195–1205. doi:10.1183/09031936.00111208
31. Fortuna AM, Miralda R, Calaf N, et al. Airway and alveolar nitric oxide measurements in obstructive sleep apnea syndrome. Respir Med. 2011;105(4):630–636. doi:10.1016/j.rmed.2010.12.004
32. Zhang D, Luo J, Qiao Y, et al. Measurement of exhaled nitric oxide concentration in patients with obstructive sleep apnea: a meta-analysis. Medicine (Baltimore). 2017;96(12):e6429. doi:10.1097/MD.0000000000006429
33. Duarte RLM, Rabahi MF, Oliveira-E-Sá TS, et al. Fractional exhaled nitric oxide measurements and screening of obstructive sleep apnea in a sleep-laboratory setting: a cross-sectional study. Lung. 2019;197(2):131–137. doi:10.1007/s00408-018-0190-y
 © 2021 The Author(s). This work is published and licensed by Dove Medical Press Limited. The
full terms of this license are available at https://www.dovepress.com/terms
and incorporate the Creative Commons Attribution
- Non Commercial (unported, 3.0) License.
By accessing the work you hereby accept the Terms. Non-commercial uses of the work are permitted
without any further permission from Dove Medical Press Limited, provided the work is properly
attributed. For permission for commercial use of this work, please see paragraphs 4.2 and 5 of our Terms.
© 2021 The Author(s). This work is published and licensed by Dove Medical Press Limited. The
full terms of this license are available at https://www.dovepress.com/terms
and incorporate the Creative Commons Attribution
- Non Commercial (unported, 3.0) License.
By accessing the work you hereby accept the Terms. Non-commercial uses of the work are permitted
without any further permission from Dove Medical Press Limited, provided the work is properly
attributed. For permission for commercial use of this work, please see paragraphs 4.2 and 5 of our Terms.