Back to Journals » International Journal of Chronic Obstructive Pulmonary Disease » Volume 11 » Issue 1
Exacerbations and health care resource utilization in patients with airflow limitation diseases attending a primary care setting: the PUMA study
Authors Montes de Oca M, Aguirre C, Lopez Varela MV, Laucho-Contreras ME, Casas A, Surmont F
Received 26 August 2016
Accepted for publication 3 November 2016
Published 7 December 2016 Volume 2016:11(1) Pages 3059—3067
DOI https://doi.org/10.2147/COPD.S120776
Checked for plagiarism Yes
Review by Single anonymous peer review
Peer reviewer comments 2
Editor who approved publication: Prof. Dr. Richard Russell
Maria Montes de Oca,1 Carlos Aguirre,2 Maria Victorina Lopez Varela,3 Maria E Laucho-Contreras,1 Alejandro Casas,2 Filip Surmont4
1Service of Pneumology, Hospital Universitario de Caracas, Facultad de Medicina, Universidad Central de Venezuela, Caracas, Venezuela; 2Colombian Pneumological Foundation, Bogotá, Colombia; 3Universidad de la República, Facultad de Medicina, Hospital Maciel, Montevideo, Uruguay; 4Medical Affairs, AstraZeneca Latin America, Coral Gables, FL, USA
Background: COPD, asthma, and asthma–COPD overlap increase health care resource consumption, predominantly because of hospitalization for exacerbations and also increased visits to general practitioners (GPs) or specialists. Little information is available regarding this in the primary care setting.
Objectives: To describe the prevalence and number of GP and specialist visits for any cause or due to exacerbations in patients with COPD, asthma, and asthma–COPD overlap.
Methods: COPD was defined as post-bronchodilator forced expiratory volume in 1 second/forced vital capacity (FEV1/FVC) ratio <0.70; asthma was defined as prior medical diagnosis, wheezing in the last 12 months, or wheezing plus reversibility (post-bronchodilator FEV1 or FVC increase ≥200 mL and ≥12%); asthma–COPD overlap was defined as post-bronchodilator FEV1/FVC <0.70 plus prior asthma diagnosis. Health care utilization was evaluated as GP and/or specialist visits in the previous year.
Results: Among the 1,743 individuals who completed the questionnaire, 1,540 performed acceptable spirometry. COPD patients had a higher prevalence of any medical visits to any physician versus those without COPD (37.2% vs 21.8%, respectively) and exacerbations doubled the number of visits. The prevalence of any medical visits to any physician was also higher in asthma patients versus those without asthma (wheezing: 47.2% vs 22.7%; medical diagnosis: 54.6% vs 21.6%; wheezing plus reversibility: 46.2% vs 23.8%, respectively). Asthma patients with exacerbations had twice the number of visits versus those without an exacerbation. The number of visits was higher (2.8 times) in asthma–COPD overlap, asthma (1.9 times), or COPD (1.4 times) patients versus those without these respiratory diseases; the number of visits due to exacerbation was also higher (4.9 times) in asthma–COPD overlap, asthma (3.5 times), and COPD (3.8 times) patients.
Conclusion: COPD, asthma, and asthma–COPD overlap increase the prevalence of medical visits and, therefore, health care resource utilization. Attempts to reduce health care resource use in these patients require interventions aimed at preventing exacerbations.
Keywords: COPD, asthma, asthma–COPD overlap, exacerbation, health care resource utilization, primary care, PUMA
Introduction
Parkinson’s disease (PD), the second most common neurodegenerative disorder in the world, manifests in approximately 1%–1.5% of individuals older than 60 years of age.1 Because of the aging population and longer life expectancy, the incidence of PD is expected to increase.2 Currently available antiparkinsonian drugs include dopamine agonists (eg, apomorphine), monoamine oxidase type B inhibitors and cholinesterase inhibitors (eg, donepezil).3 Among these drugs, the most commonly used is levodopa, which alleviates the symptoms and improves the quality of life of patients for several years. However, patients gradually develop tolerance to the therapeutic benefits of levodopa, and its use is related to some harmful side effects, including response fluctuations (wearing off) and levodopa-induced dyskinesia (LID).2,4 Therefore, novel strategies that focus on sustained drug release are required to decrease the occurrence of LID and attain continuous dopaminergic stimulation (CDS).5 Rotigotine was initially developed as an adjuvant treatment for early, secondary and advanced PD. It is a non-ergoline, enantioselective dopamine agonist, with preference for D3 > D2 > D1 receptors, which is considered to be of particular importance for its efficacy in PD.6
The blood–brain barrier (BBB) is composed of microvascular endothelial cells sealed by tight junctions. It plays a central role in regulating intra- and intercellular signaling pathways and maintaining central nervous system homeostasis, but it also restricts the delivery of therapeutic agents to the brain.7 To overcome this issue, a potential route is the direct transport of drugs from the nose to the brain via the olfactory and trigeminal nerve pathways, thereby bypassing the BBB.3 Over the past decades, research efforts have been reported on the design of nasal drug carriers for brain delivery, including nanoparticles (NPs), liposomes, microspheres and microemulsions.8–11
Poly(ethylene glycol)–poly(lactic-co-glycolic acid) (PEG-PLGA) NPs constitute a promising strategy for brain-targeted delivery of rotigotine following intranasal administration. PEG-PLGA is biocompatible and biodegradable, and it has long-circulating behavior. NPs mask the physicochemical properties of drugs, in addition to providing controlled drug release, lower drug toxicity, as well as improved bioavailability, therapeutic efficacy and biodistribution.12,13 However, NPs contain surface PEG chains, which are likely to inhibit cell surface interactions.14 To achieve more efficient delivery from nose to brain, one approach is to modify NPs with biological ligands.
Lactoferrin (Lf) is a naturally occurring, iron-binding glycoprotein of the transferrin family, with a molecular weight of 80 kDa.15 Based on previous studies, the Lf receptor (LfR) is highly expressed on the apical surface of respiratory epithelial cells, as well as brain endothelial cells and neurons.16,17 Furthermore, LfR is overexpressed in the capillaries and neurons associated with age-related neurodegenerative diseases, including PD, Alzheimer’s disease and amyotrophic lateral sclerosis.18 Compared with transferrin (Tf) and OX-26, an anti-Tf receptor antibody, Lf displays higher brain uptake.19 Therefore, Lf may improve nose-to-brain delivery of NPs following intranasal administration.
Accordingly, the aim of this study was to prepare Lf-modified PEG-PLGA NPs (Lf-NPs) as a carrier for brain delivery of rotigotine, following intranasal administration for the treatment of PD. Experiments with mice and cells were conducted to evaluate the brain-targeting ability and toxicity of this system.
Materials and methods
Materials and animals
Bovine Lf, 2-iminothiolane (Traut’s reagent) and 5,5′-dithiobis-(2-nitrobenzoic acid) (Ellman’s reagent) were purchased from Sigma-Aldrich (St Louis, MO, USA). Rotigotine was kindly provided by Luye Pharma Group (Shandong, People’s Republic of China). PEG-PLGA-maleimide (mal-PEG-PLGA; 3,400–20,000 Da, 50:50 LA:GA, w/w) and methoxy-PEG-PLGA (mPEG-PLGA; 2,000–20,000 Da, 50:50 LA:GA, w/w) were purchased from Polyscitech (West Lafayette, IN, USA). Sephadex G25 and Sepharose CL-4B were purchased from GE Healthcare Bio-Sciences (Piscataway, NJ, USA). Furthermore, 1,1′-dioctadecyl-3,3,3′,3′-tetramethylindotricarbocyanine iodide (DiR) and Hoechst 33342 were purchased from Fanbo Biochemicals Co (Beijing, People’s Republic of China); 3-(4,5-dimethylthiazol-2-yl)-2,5-diphenyltetrazolium bromide (MTT reagent) and 3-(2′-benzothiazolyl)-7-diethylaminocoumarin (coumarin-6) were purchased from Aladdin Industrial Corp (Shanghai, People’s Republic of China). A bicinchoninic acid (BCA) protein quantitation kit was purchased from Beyotime Biotechnology (Shanghai, People’s Republic of China). All other reagents were of laboratory grade.
The cell lines 16HBE and SH-SY5Y and male Kunming (KM) mice (age: 4–5 weeks; weight: 20±2 g) were kindly provided by Luye Pharma Group (Shandong, People’s Republic of China). All animal studies were performed according to the Guide for the Care and Use of Laboratory Animals. The China Animal Care and Use Committee approved the study protocols.
Preparation of NPs and Lf-NPs
Preparation of NPs
Nanoprecipitation was used to prepare the NPs.20 In brief, accurately weighed mal-PEG-PLGA, mPEG-PLGA and rotigotine were dissolved in the organic phase (acetone) and then added dropwise into the aqueous phase under ice-cooling, with continued stirring to completely volatilize the organic solvent. The rotigotine NP was obtained. The same approach was applied for the coumarin-6 NP and DiR NP. All NPs were washed three times with ultrapure water, concentrated and collected by ultrafiltration.
Box–Behnken experimental design
To optimize the preparation process and to determine the impact of various factors on the encapsulation efficiency and particle size of NPs, a four-factor, two-level Box–Behnken design was used, based on preliminary experimental data.20 A total of 29 confirmatory formulation runs were generated with five center points using Design-Expert® software (version 8.0.6; Stat-Ease Inc, Minneapolis, MN, USA). Levels of the independent and dependent variables are shown in Table 1. The effect of the independent process variables on the dependent responses was studied using second-order polynomial equations.
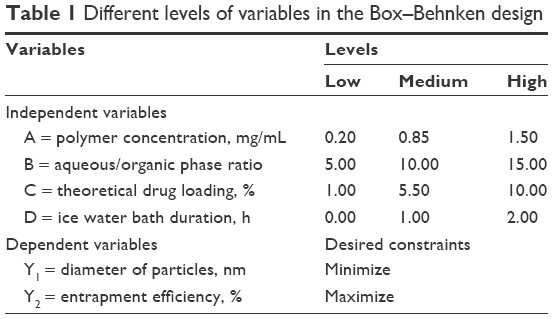 | Table 1 Different levels of variables in the Box–Behnken design |
Preparation of Lf-NPs
Lf was thiolated by reaction with a 20:1 M excess of 2-iminothiolane (Traut’s reagent) for 60 min, according to Huwyler’s method.21,22 The products were purified via a Sephadex G25 column. The quantity of introduced thiol groups was measured by ultraviolet (UV) spectrophotometry (λ=412 nm) (Metash Instruments Co, Ltd, Shanghai, People’s Republic of China) with Ellmann’s reagent. To generate the Lf-NPs, purified, thiolated Lf was mixed with maleimide-functionalized NPs and incubated at room temperature for 9 h, enabling the maleimide groups to react with the thiol groups via a maleimide–thiol coupling reaction. The product was eluted with 0.01 M phosphate-buffered saline (PBS) buffer (pH 7.4) using a 1.5×20 cm Sepharose CL-4B column to remove the unconjugated protein. The concentration of protein and the protein conjugation efficiency were assessed with the BCA kit.
Characterization of NPs and Lf-NPs
Morphology, particle size and zeta potential
Morphological examinations of NPs were conducted by transmission electron microscopy (TEM) (H-600; Hitachi, Tokyo, Japan) following negative staining with sodium phosphotungstate solution (1%, w/v). The average particle size and zeta potential of the NPs were determined with a particle analyzer (Delsa Nano C; Beckman Coulter Inc, Brea, CA, USA).
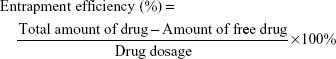
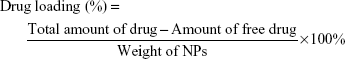
Encapsulation efficiency and drug loading capacity
The encapsulation efficiency was determined by ultrafiltration. The samples were placed in an ultrafiltration device (100 kMWCO; Sartorius, Göettingen, Germany) and centrifuged at 3,500 rpm for 10 min at room temperature to isolate the free drug. The same volume of each sample was dissolved in acetonitrile to obtain the total amount of drug. The concentrations of rotigotine and coumarin-6 were measured with a high-performance liqid chromatography (HPLC) system (LC-20A VP system; Shimadzu, Kyoto, Japan), while the concentration of DiR was measured by UV spectrophotometry. The encapsulation efficiency and drug loading capacity of the NPs were calculated using the following equation:
|
|
In vitro drug release study
Cellulose membrane dialysis tubing was used to investigate the release kinetics.23 In brief, 2 mL of NPs and Lf-NPs samples were encased in dialysis bags (molecular weight cutoff: 7 kDa), which were incubated in 30 mL phosphate buffer (pH 7.4) containing 0.5% (w/v) sodium dodecyl sulfate, with shaking in a water bath at 37°C. At prespecified time intervals, 1 mL of phosphate buffer was withdrawn from outside the dialysis bag, and an equivalent volume of release medium was supplemented. The rotigotine content was analyzed by HPLC at 223 nm. The amount of rotigotine released was calculated using a standard curve of rotigotine.
Cellular studies of NPs and Lf-NPs
Cell culture of SH-SY5Y and 16HBE cells
Cells of the human bronchial epithelial cell line 16HBE as well as SH-SY5Y cells, derived from the human neuroblastoma cell line SK-N-S, were incubated at 37°C and 5% CO2 in Dulbecco’s Modified Eagle’s Medium supplemented with 10% fetal bovine serum, 100 IU/mL penicillin and 100 mg/mL streptomycin sulfate.
Cytotoxicity studies
The MTT assay was used to determine the cytotoxicity of NPs, Lf-NPs, rotigotine NPs and rotigotine Lf-NPs. The 16HBE cells and SH-SY5Y cells were seeded into a 96-well plate at a density of 104 cells per well. After culturing for 24 h, the cells were treated with different concentrations of free rotigotine (12.5–200 μg/mL), or corresponding concentrations of rotigotine NPs or rotigotine Lf-NPs. The plates were incubated at 37°C in 5% CO2 for either 24 h or 48 h, followed by 4 h exposure to 20 μL of MTT solution (5 mg/mL) per well. To solubilize the resultant formazan crystals, 200 μL of dimethyl sulfoxide was added to each well. Then, the absorbance of each well was measured at 570 nm after gentle shaking for 10 min.
Cellular uptake of coumarin-6-labeled NPs and Lf-NPs
Qualitative analyses of cellular internalization of coumarin-6-labeled NPs and Lf-NPs were performed using fluorescence microscopy (Eclipse E400; Nikon Corporation, Tokyo, Japan), while the quantitative analyses were performed using flow cytometry (BD FACSAria III; BD Biosciences, San Jose, CA, USA).
For fluorescence microscopy, 16HBE cells and SH-SY5Y cells were seeded into 24-well plates at a density of 4,000 cells per well and incubated at 37°C in 5% CO2. On Day 2, the cells were treated with NPs or Lf-NPs containing different concentrations of coumarin-6 for 2 h. Furthermore, the cells were incubated with NPs or Lf-NPs (0.60 μg/mL) for different time intervals. Subsequently, the cells were washed three times with cold PBS and fixed with 4% paraformaldehyde for 10 min. To label the cell nucleus for locating NPs and Lf-NPs within cells, the cells were further incubated with Hoechst 33342 for 10 min. Finally, the cells were washed three times and visualized by fluorescence microscopy.
For flow cytometry, 16HBE cells and SH-SY5Y cells were seeded into six-well plates at a density of 105 cells per well and treated as described earlier. After incubation with NPs or Lf-NPs containing different concentrations of coumarin-6 (0.05–1 μg/mL) for 2 h, the cells were washed three times with cold PBS. Then, cells were trypsinized and centrifuged at 1,500 rpm for 5 min. After resuspension in PBS, the cells were analyzed by flow cytometry.
In vivo study of NPs and Lf-NPs
Brain accumulation of DiR-labeled NPs and Lf-NPs after intranasal administration
To examine the brain distribution of Lf-NPs and NPs following intranasal administration, in vivo real-time fluorescence imaging analysis (Care stream In Vivo FX; Bruker, Madison, WI, USA) was used. Mice were randomized into three groups and treated with DiR solution, DiR NPs or DiR Lf-NPs as a single dose of 0.25 mg DiR/kg of body weight. Before administration, mice were anesthetized by intraperitoneal injection of chloral hydrate. For intranasal administration, a polyethylene 10 (PE 10) tubing attached to a microliter syringe was inserted ~10 mm deep into the nares. Mice were anesthetized and imaged at 0.5, 1, 2, 4 and 6 h postadministration. To further verify the brain targeting of NPs and Lf-NPs, mice were sacrificed at 4 h postadministration and dissected to obtain the whole brain, heart, liver, spleen, lungs and kidneys. Images were captured with an in vivo imaging system.
Brain distribution of rotigotine NPs and Lf-NPs following intranasal administration
Forty mice were randomly divided into two groups for intranasal administration of either rotigotine NPs, as a control group, or rotigotine Lf-NPs. At prespecified time points (0.25, 1, 2, 4 and 8 h), blood samples were obtained by removing the eyeball, and the mice were sacrificed for dissection of the olfactory bulb, striatum, cerebrum with striatum removed and cerebellum. Blood samples were centrifuged at 5,000 rpm for 10 min to collect plasma. Other tissues were homogenized after adding three volumes of saline. To extract the drugs, two volumes of acetonitrile were added to plasma and the tissue homogenates. The concentration of drug was measured via liquid chromatography–tandem mass spectrometry (LC-MS/MS) (AB Sciex Triple Quad™ 4500; Sciex, Framingham, MA, USA) (the LC-MS/MS conditions were as follows: chromatographic column, Shim-pack XR-ODS III C18; mass spectrometer ion source, electrospray ionization source; rotigotine ion pair, 316.0/147.1).
Statistical analysis
Data are presented as the mean ± standard deviation (SD). Statistical comparisons were performed using a two-tailed Student’s t-test. Differences were considered statistically significant for a P-value <0.05 and highly significant for a P-value <0.01.
Results
Preparation and characterization of NPs and Lf-NPs
Box–Behnken design
According to the principles of response surface methodology (RSM), using the Box–Behnken design, 29 tests were designed, and the corresponding dependent variables are shown in Table 2. Design-Expert 8.0.6 software was used to perform regression analysis using various indexes, as well as to delineate the interaction between the four independent factors.
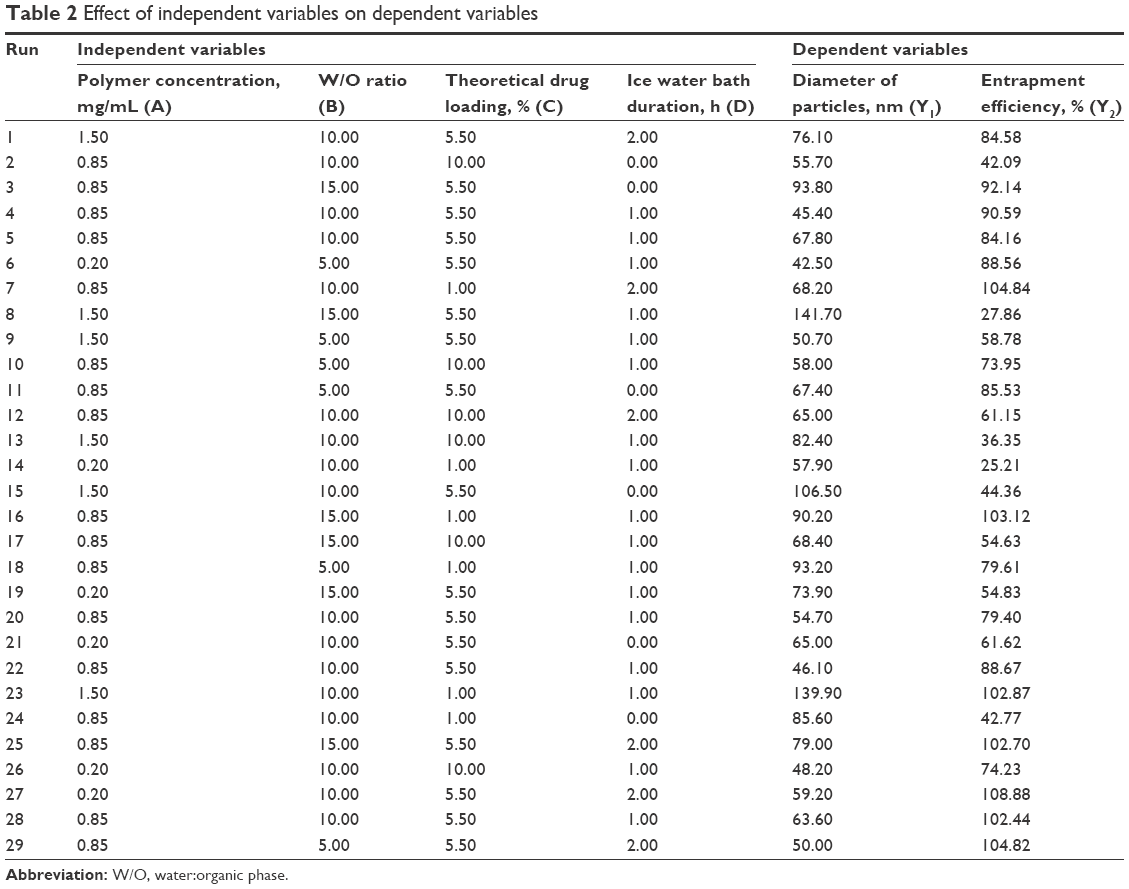 | Table 2 Effect of independent variables on dependent variables |
Polynomial equations between independent variables and dependent variables were constructed using Design-Expert 8.0.6 software.
|
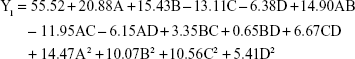
The P-value of the regression equation for the particle size was 0.0023 (P<0.01), indicating an extremely significant level. Moreover, lack-of-fit analysis (P=0.2038) revealed that the equation was a good fit and predictive of the relationship between the factors and particle size. Among the factors, A, B, C and A2 had a significant effect on the particle size.
|
The regression equation for entrapment efficiency was significant (P=0.0303), whereas the lack of fit was not significant (P=0.0515). Factors C, D, AD, A2 and C2 had a significant effect on entrapment efficiency.
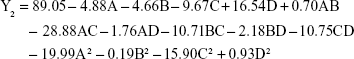
Based on real-life clinical practice and trial requirements, particle size tends to be minimum, while the encapsulation efficiency tends to be maximum. The regression model was further processed to determine the level of interaction between the four factors. The impact of the interaction between the various factors on the desirability of encapsulation efficiency and particle size was intuitive, as reflected in Figure 1. The oval and steep slopes in the response surface correspond to a significant interaction between two factors. As indicated by the flag at the highest point of the response surface, the highest response value was within the selected range of each factor.
 | Figure 1 Three-dimensional response surface plots showing the effect of independent variables on dependent variables. |
The optimum formulation of rotigotine NP was selected according to the desired constraints within the range for independent variables, as well as the minimized and maximized constraints for the diameter of particles and entrapment efficiency, respectively. The optimized formulation (A =0.81 mg/mL, B =5.55, C =7.32% and D =1.59 h, with predictable response value for Y1 =44.4 nm and Y2 =100%) was selected by the desirability factor. Values for responses Y1 (58.2±6.2 nm) and Y2 (92.57%±9.41%) for the optimized formulation were consistent with the predicted values generated by RSM, and the result confirmed the validity of the RSM model.
Morphology, particle size and zeta potential of NPs and Lf-NPs
Data on the physical characterization of NPs are shown in Table 3. The diameter of NPs as measured by dynamic light scattering (DLS) was less than 100 nm, but it increased by approximately 60 nm when modified with Lf. This is in accordance with the more complex surface structure of the Lf-modified NP. The small particle size was beneficial for nose-to-brain drug delivery. The zeta potentials were within the range of −20 mV to −22 mV, which enabled more stable and efficient NP transfer.2
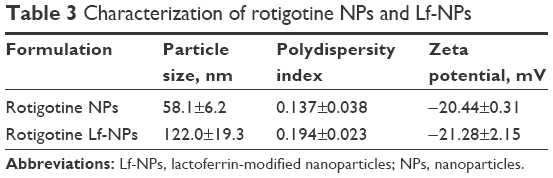 | Table 3 Characterization of rotigotine NPs and Lf-NPs |
TEM analysis confirmed that the NPs had a uniform spherical morphology, as shown in Figure 2. However, the particle size was less than that measured by DLS (Table 3). The difference in values between TEM and DLS measurements was ascribed to the state of NPs used for measurements.23 The number of the introduced thiol groups was 1.44±0.02, which was within the optimal range of 1–2. Lf conjugation efficiency was 18.99%±2.32%.
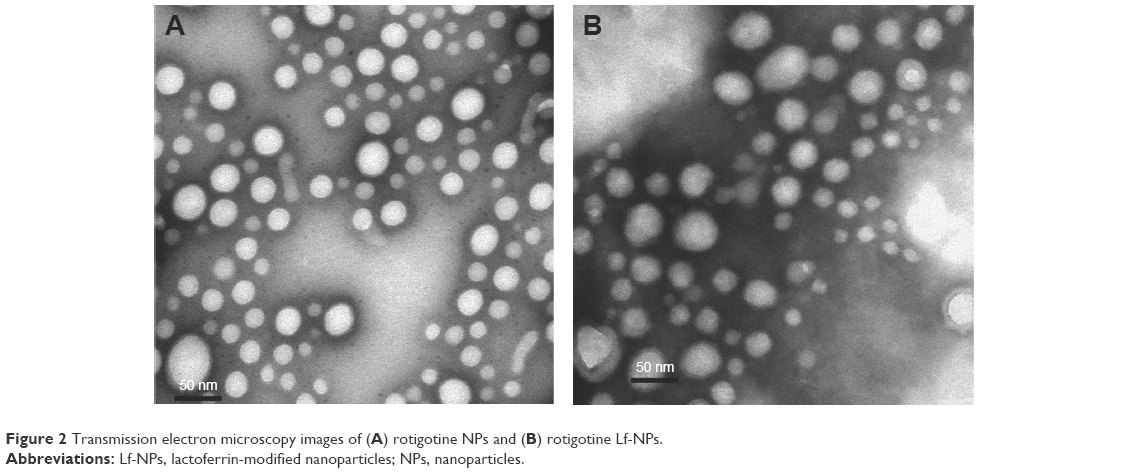 | Figure 2 Transmission electron microscopy images of (A) rotigotine NPs and (B) rotigotine Lf-NPs. |
In vitro drug release study
The in vitro drug release kinetics of rotigotine from rotigotine NPs and Lf-NPs was evaluated in PBS (pH 7.4) at 37°C. As depicted in Figure 3, free rotigotine was rapidly released from the dialysis bag within 4 h (73.0%±5.4%). With respect to the NP formulation, drug release was rapid during the first 0.5 h (surface desorption, diffusion and dissolution). Thereafter, a prolonged and sustained release without burst was observed for NPs (81.3%±2.1%) and Lf-NPs (77.8%±7.0%) for 48 h, which can provide CDS for the treatment of PD.
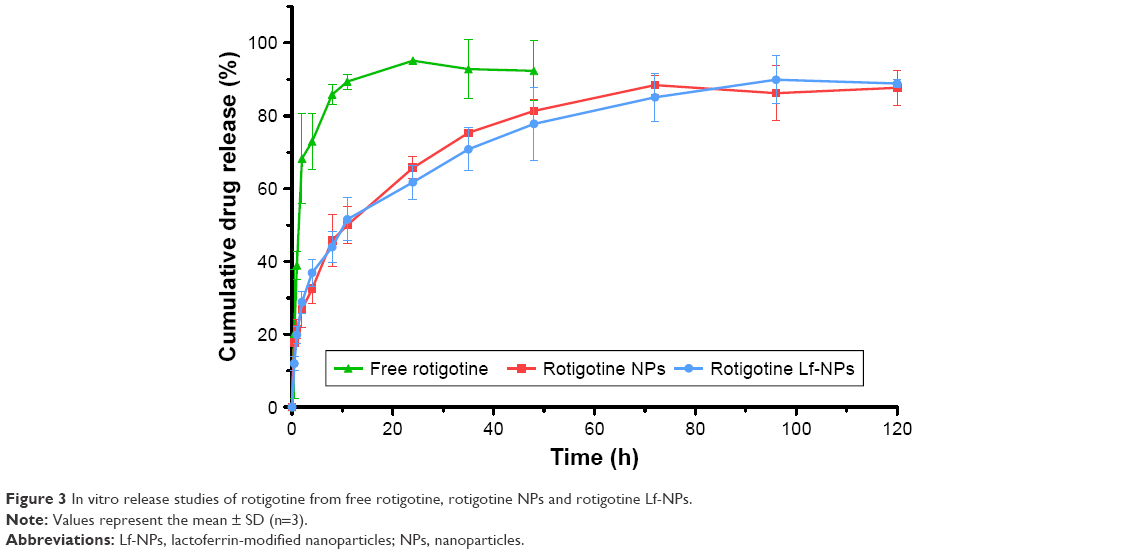 | Figure 3 In vitro release studies of rotigotine from free rotigotine, rotigotine NPs and rotigotine Lf-NPs. |
Cellular studies of NPs and Lf-NPs
Following intranasal administration of NPs, the nasal epithelial cells were exposed, followed by nerve cells in the brain. To emulate these conditions and to evaluate the safety and uptake capacity of NPs and Lf-NPs, the 16HBE cell line and SH-SY5Y cell line were used.
Cytotoxicity studies of NPs and Lf-NPs
To assess the toxicity of NPs after intranasal administration and the brain-targeting activity, NPs/Lf-NPs, either loaded with rotigotine or unloaded, were incubated with 16HBE cells and SH-SY5Y cells. Cell viability was evaluated after 24 h and 48 h by the MTT assay. Unloaded NPs and Lf-NPs were nontoxic to 16HBE and SH-SY5Y cells at all concentrations tested (data not shown). Moreover, as shown in Figure 4, rotigotine solution, rotigotine NPs and rotigotine Lf-NPs did not cause significant cell death at lower concentrations (12.5–50 μg/mL). However, exposure to higher concentrations (100 μg/mL and 200 μg/mL) of free rotigotine for 24 h and 48 h resulted in a decrease (P<0.05) in cell viability compared with the same concentration of rotigotine NPs/Lf-NPs, which indicated that the toxicity of rotigotine was reduced when encapsulated in PLGA NPs. There was no significant difference between rotigotine NPs and rotigotine Lf-NPs in terms of toxicity, suggesting the safety of Lf.
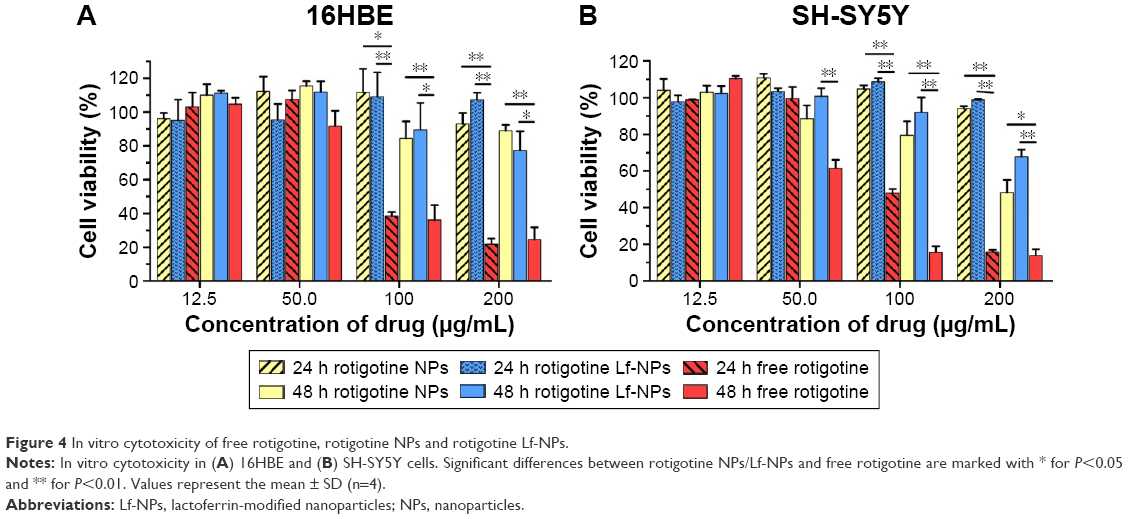 | Figure 4 In vitro cytotoxicity of free rotigotine, rotigotine NPs and rotigotine Lf-NPs. |
Cellular uptake of coumarin-6-labeled NPs and Lf-NPs
Cellular association of coumarin-6-labeled NPs and Lf-NPs in 16HBE and SH-SY5Y cells was qualitatively measured using fluorescence microscope images (Figure 5). At all the tested concentrations and time points, cellular uptake of Lf-NPs was markedly higher than that of NPs. The same result was obtained from quantitative analysis by flow cytometry (Figure 6A), in which the mean fluorescence intensity of Lf-NPs was higher than that of NPs (P<0.05) in the experimental concentration range (0.05–1 μg/mL). This indicated that Lf modification enhanced the penetration and targeting of NPs, presumably because the Lf receptor is expressed on the surface of the two cell types.
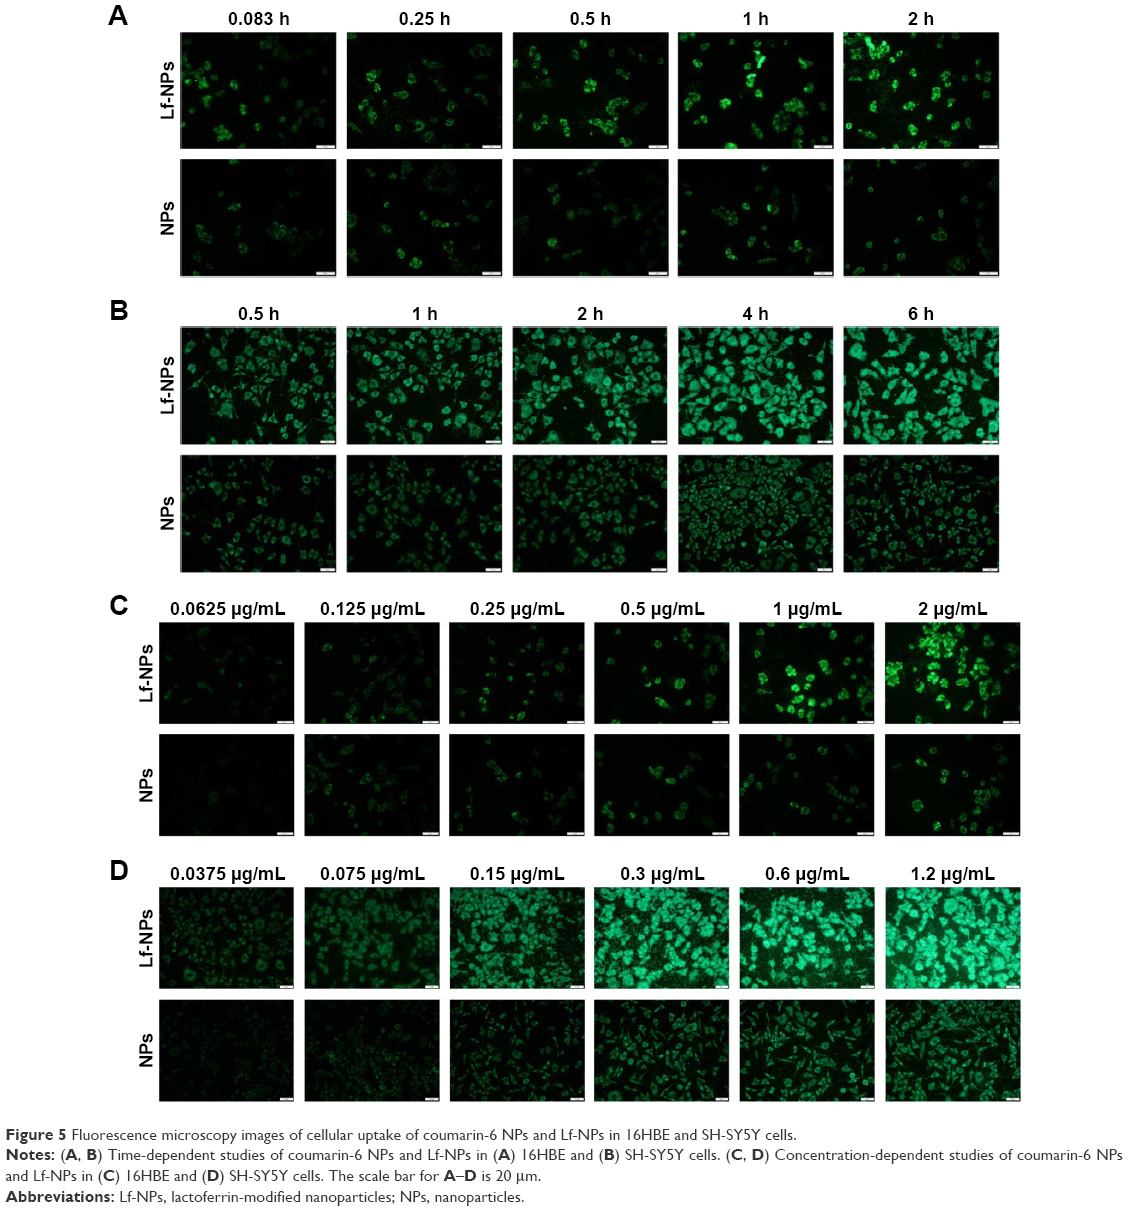 | Figure 5 Fluorescence microscopy images of cellular uptake of coumarin-6 NPs and Lf-NPs in 16HBE and SH-SY5Y cells. |
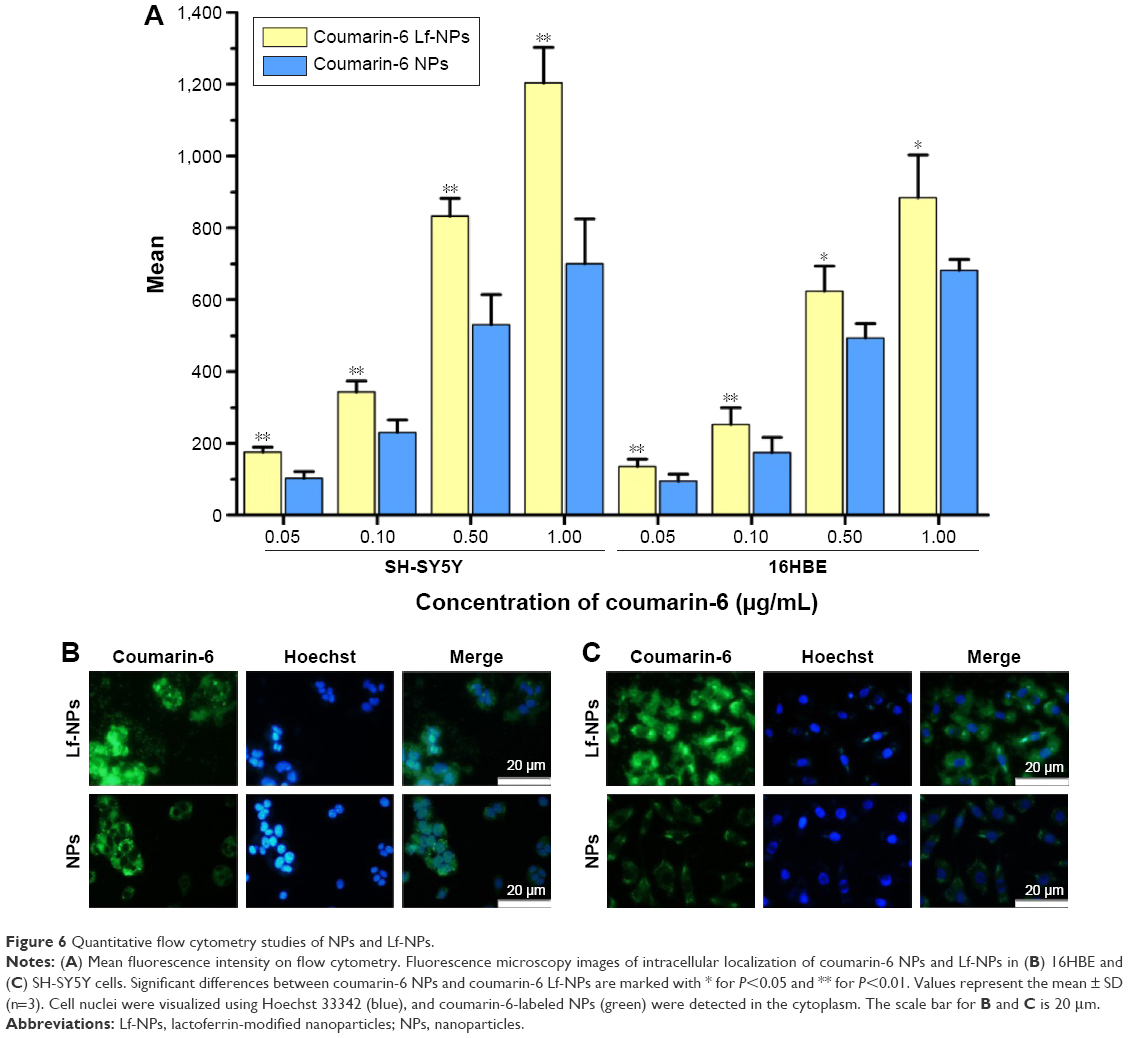 | Figure 6 Quantitative flow cytometry studies of NPs and Lf-NPs. |
Figure 5 shows that the intensity of fluorescence was increased after incubation with increasing concentrations/times of NPs. The time- and concentration-dependent uptake pattern was indicative of an active endocytic process.24 NPs were rapidly internalized by 16HBE cells, suggesting that they were rapidly absorbed after intranasal administration. Intracellular localization of NPs was visualized by confocal microscopy. As shown in Figure 6B and C, coumarin-6-labeled NPs and Lf-NPs were observed surrounding (but not colocalized with) the nuclei, reflecting the uptake of Lf-NPs into the cytoplasm of 16HBE and SH-SY5Y cells.
In vivo brain accumulation of DiR-labeled NPs and Lf-NPs after intranasal administration
Figure 7A shows the in vivo fluorescence images from mice at predefined times after intranasal administration of DiR-labeled Lf-NPs and NPs. A weak signal was observed in the free DiR group, which was attributed to the DiR remaining in the nasal cavity. However, there was a gradual increase in signal intensity, with the maximum value attained at 4 h postadministration in both NP groups. Importantly, fluorescence signals in both groups were located in the brain, demonstrating that the NPs and Lf-NPs were targeted to the brain following intranasal administration. Moreover, the higher signal intensity from the Lf-NPs group verified the active targeting effect of the Lf-modified NPs.
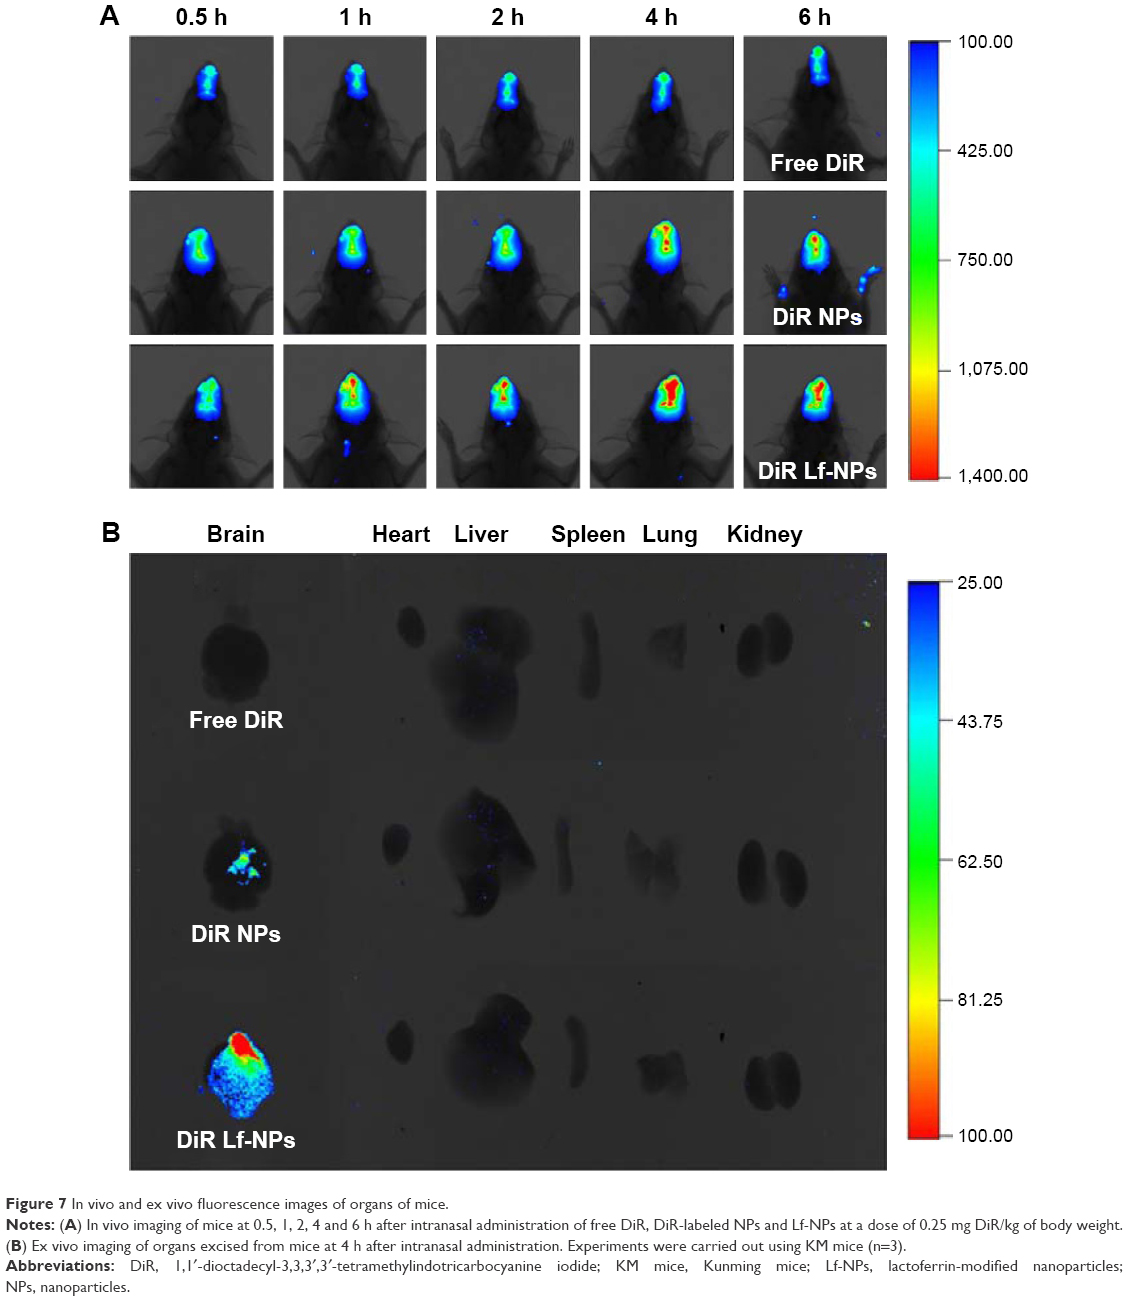 | Figure 7 In vivo and ex vivo fluorescence images of organs of mice. |
A similar conclusion was drawn from the images of ex vivo organs dissected at 4 h postadministration (Figure 7B). Fluorescence signals were only detected in the brain, and the brains of mice in the Lf-NPs group had a powerful signal. This further highlighted that the targeted conjugate displayed preferential accumulation in the brain but was poorly absorbed in other untargeted organs.
Brain distribution of rotigotine NPs and Lf-NPs following intranasal administration
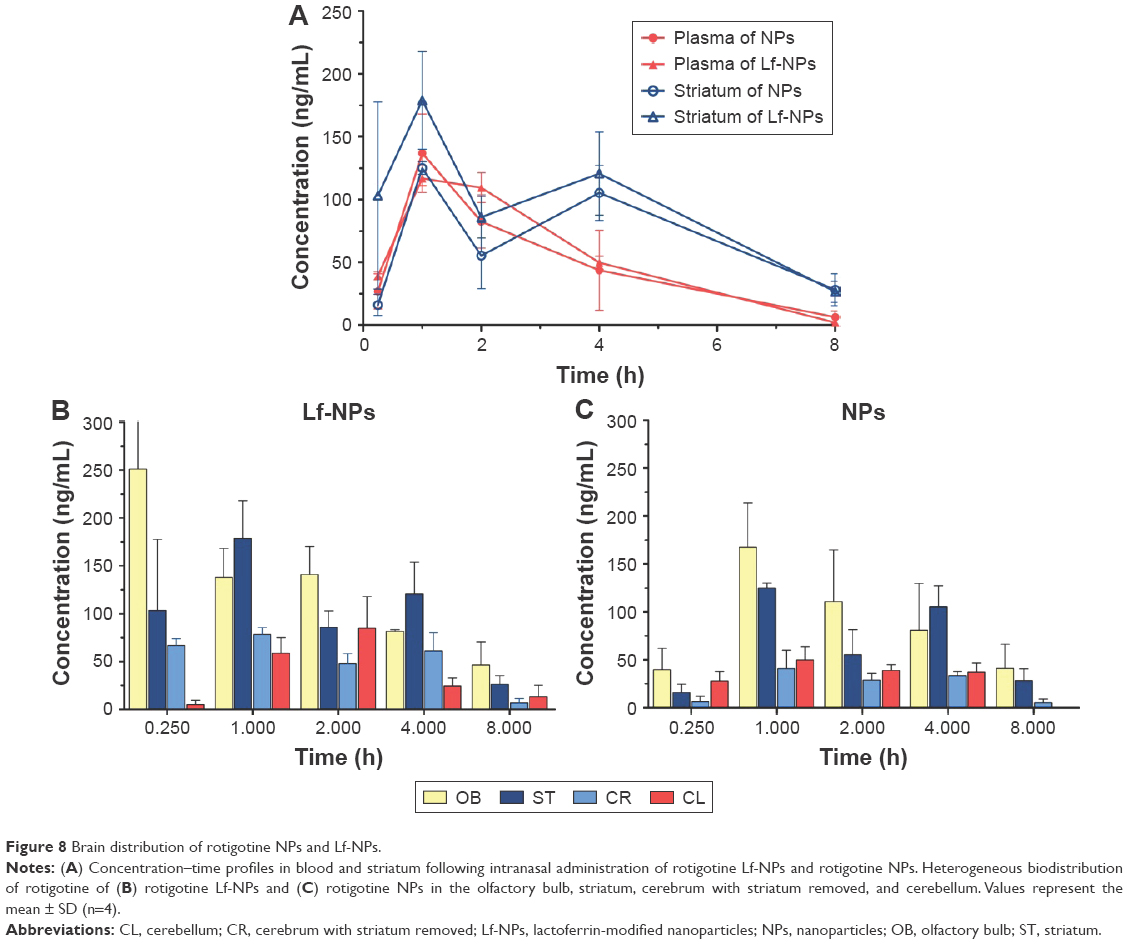
The brain distribution of rotigotine NPs was quantitatively analyzed in mice following intranasal administration. As shown in Figure 8A, plasma concentration–time curves of Lf-NPs and NPs had similar trends, which suggested that the Lf modification on the surface of NPs did not impair the long circulation time of PEG.22 After intranasal administration of rotigotine NPs/Lf-NPs, the concentration of rotigotine was much higher in the striatum than in plasma, and the area under the concentration–time curve for 0–8 h (AUC0–8 h) for NPs and Lf-NPs was 1.44- and 1.89-fold higher in the striatum compared with that in the plasma, indicating that intranasal administration may contribute to more efficient brain drug delivery. In addition, rotigotine was detected in the striatum for 8 h, suggesting that drug delivery was slow and constant, which would facilitate CDS for the treatment of PD.
 | Figure 8 Brain distribution of rotigotine NPs and Lf-NPs. |
The AUC0–8 h and the maximum plasma concentration (Cmax) values were higher for Lf-NPs than for unconjugated NPs in all four brain tissues, with the AUC0–8 h of Lf-NPs being 1.21-, 1.31-, 1.93- and 1.24-fold higher in the olfactory bulb, striatum, cerebrum with striatum removed, and cerebellum, respectively. These results indicated that Lf-NPs enabled intranasal transport, thereby increasing brain drug concentrations, which may be attributed to the interaction between Lf and LfR on respiratory epithelial cells and brain cells.
As shown in Figure 8B and C, the concentration of rotigotine in the different brain regions was variable. The high concentration of rotigotine in the striatum, which is the main site of lesions in PD, indicated that intranasal NPs administration may be promising for the treatment of PD. In addition, the high concentration of rotigotine in the olfactory bulb suggested that NPs may be directly transported to the brain via both the olfactory and the trigeminal nerve pathways.
Conclusion
In this study, we successfully established a novel nose-to-brain drug delivery system using modified biodegradable PEG-PLGA NPs with Lf, a useful targeting molecule. The NPs exhibited a spherical shape, small particle size, narrow size distribution and negative potential. The in vitro cytotoxicity of the unloaded and rotigotine-loaded NPs was low. Cellular uptake experiments showed that Lf-NPs exhibited enhanced cellular accumulation compared with unmodified NPs. Conjugation of Lf was favorable for rotigotine delivery in the olfactory bulb, striatum, cerebrum with striatum removed, and cerebellum. These results confirmed that this drug delivery system could offer a promising noninvasive approach for the treatment of PD.
Acknowledgment
This study was funded by the National Science and Technology Foundation (2013ZX09402201) and the Natural Science Foundation of Shandong Province (ZR2013HQ009).
Disclosure
The authors report no conflicts of interest in this work.
References
Alves G, Forsaa EB, Pedersen KF, Dreetz Gjerstad M, Larsen JP. Epidemiology of Parkinson’s disease. J Neurol. 2008;255(suppl 5):18–32. | ||
Leyva-Gómez G, Cortés H, Magaña JJ, Leyva-García N, Quintanar-Guerrero D, Florán B. Nanoparticle technology for treatment of Parkinson’s disease: the role of surface phenomena in reaching the brain. Drug Discov Today. 2015;20(7):824–837. | ||
Kulkarni AD, Vanjari YH, Sancheti KH, Belgamwar VS, Surana SJ, Pardeshi CV. Nanotechnology-mediated nose to brain drug delivery for Parkinson’s disease: a mini review. J Drug Target. 2015;23(9):775–788. | ||
Di Stefano A, Sozio P, Iannitelli A, Cerasa LS. New drug delivery strategies for improved Parkinson’s disease therapy. Expert Opin Drug Deliv. 2009;6(4):389–404. | ||
Garbayo E, Ansorena E, Blanco-Prieto MJ. Drug development in Parkinson’s disease: from emerging molecules to innovative drug delivery systems. Maturitas. 2013;76(3):272–278. | ||
Schmidt WJ, Lebsanft H, Heindl M, et al. Continuous versus pulsatile administration of rotigotine in 6-OHDA-lesioned rats: contralateral rotations and abnormal involuntary movements. J Neural Transm (Vienna). 2008;115(10):1385–1392. | ||
Neuwelt EA, Bauer B, Fahlke C, et al. Engaging neuroscience to advance translational research in brain barrier biology. Nat Rev Neurosci. 2011;12(3):169–182. | ||
Vaka SR, Shivakumar HN, Repka MA, Murthy SN. Formulation and evaluation of carnosic acid nanoparticulate system for upregulation of neurotrophins in the brain upon intranasal administration. J Drug Target. 2013;21(1):44–53. | ||
Heurtault B, Frisch B, Pons F. Liposomes as delivery systems for nasal vaccination: strategies and outcomes. Expert Opin Drug Deliv. 2010;7(7):829–844. | ||
Tafaghodi M, Sajadi Tabassi SA, Jaafari MR. Induction of systemic and mucosal immune responses by intranasal administration of alginate microspheres encapsulated with tetanus toxoid and CpG-ODN. Int J Pharm. 2006;319(1–2):37–43. | ||
Wang S, Chen P, Zhang L, Yang C, Zhai G. Formulation and evaluation of microemulsion-based in situ ion-sensitive gelling systems for intranasal administration of curcumin. J Drug Target. 2012;20(10):831–840. | ||
Gomes MJ, Neves J, Sarmento B. Nanoparticle-based drug delivery to improve the efficacy of antiretroviral therapy in the central nervous system. Int J Nanomedicine. 2014;9:1757–1769. | ||
Ali J, Ali M, Baboota S, et al. Potential of nanoparticulate drug delivery systems by intranasal administration. Curr Pharm Des. 2010;16(14):1644–1653. | ||
Verma A, Stellacci F. Effect of surface properties on nanoparticle-cell interactions. Small. 2010;6(1):12–21. | ||
Ward PP, Uribe-Luna S, Conneely OM. Lactoferrin and host defense. Biochem Cell Biol. 2002;80(1):95–102. | ||
Elfinger M, Maucksch C, Rudolph C. Characterization of lactoferrin as a targeting ligand for nonviral gene delivery to airway epithelial cells. Biomaterials. 2007;28(23):3448–3455. | ||
Suzuki YA, Lopez V, Lonnerdal B. Mammalian lactoferrin receptors: structure and function. Cell Mol Life Sci. 2005;62(22):2560–2575. | ||
Qian ZM, Wang Q. Expression of iron transport proteins and excessive iron accumulation in the brain in neurodegenerative disorders. Brain Res Brain Res Rev. 1998;27(3):257–267. | ||
Ji B, Maeda J, Higuchi M, et al. Pharmacokinetics and brain uptake of lactoferrin in rats. Life Sci. 2006;78(8):851–855. | ||
Sharma D, Sharma RK, Sharma N, et al. Nose-to-brain delivery of PLGA-diazepam nanoparticles. AAPS PharmSciTech. 2015;16(5):1108–1121. | ||
Huwyler J, Wu D, Pardridge WM. Brain drug delivery of small molecules using immunoliposomes. Proc Natl Acad Sci U S A. 1996;93(24):14164–14169. | ||
Liu Z, Jiang M, Kang T, et al. Lactoferrin-modified PEG-co-PCL nanoparticles for enhanced brain delivery of NAP peptide following intranasal administration. Biomaterials. 2013;34(15):3870–3881. | ||
Pahuja R, Seth K, Shukla A, et al. Trans-blood brain barrier delivery of dopamine-loaded nanoparticles reverses functional deficits in parkinsonian rats. ACS Nano. 2015;9(5):4850–4871. | ||
Allen C, Yu Y, Eisenberg A, Maysinger D. Cellular internalization of PCL(20)-b-PEO(44) block copolymer micelles. Biochim Biophys Acta. 1999;1421(1):32–38. |
 © 2016 The Author(s). This work is published and licensed by Dove Medical Press Limited. The
full terms of this license are available at https://www.dovepress.com/terms
and incorporate the Creative Commons Attribution
- Non Commercial (unported, 3.0) License.
By accessing the work you hereby accept the Terms. Non-commercial uses of the work are permitted
without any further permission from Dove Medical Press Limited, provided the work is properly
attributed. For permission for commercial use of this work, please see paragraphs 4.2 and 5 of our Terms.
© 2016 The Author(s). This work is published and licensed by Dove Medical Press Limited. The
full terms of this license are available at https://www.dovepress.com/terms
and incorporate the Creative Commons Attribution
- Non Commercial (unported, 3.0) License.
By accessing the work you hereby accept the Terms. Non-commercial uses of the work are permitted
without any further permission from Dove Medical Press Limited, provided the work is properly
attributed. For permission for commercial use of this work, please see paragraphs 4.2 and 5 of our Terms.