")
Back to Journals » Risk Management and Healthcare Policy » Volume 7
Evidence from the national health account: the case of Dubai
Authors Hamidi S
Received 24 June 2014
Accepted for publication 14 July 2014
Published 24 September 2014 Volume 2014:7 Pages 163—175
DOI https://doi.org/10.2147/RMHP.S69868
Checked for plagiarism Yes
Review by Single anonymous peer review
Peer reviewer comments 4
Samer Hamidi
School of Health and Environmental Studies, Hamadan Bin Mohammad Smart University, Dubai, United Arab Emirates
Introduction: National health accounts (NHAs) provide useful information to aid in understanding the health care financing system. This article aims to present a profile of health system financing in Dubai using data from the NHA. We also aim to compare the provider structure of financing schemes in Dubai with those of the State of Qatar and selected Organization for Economic Cooperation and Development (OECD) countries.
Methods: The author analyzed secondary data published in NHAs for Dubai and Qatar, and data collected by the OECD countries and publicly available from the Statistical Office of the European Union (Eurostat), for 25 OECD countries for comparative analysis. All health financing measures used are as defined in the international System of Health Accounts (SHA).
Results: In Dubai, only 33% of current health expenditure (CHE) is funded by the government. However, the public sector is the main source of health funding in Qatar and most OECD countries, with an average of 79% and 72%, respectively. Households in Dubai spent about 22% of CHE, equivalent to an average US$187 per capita, ranking the highest among Gulf Cooperation Council (GCC) countries, and compared with 20% of CHE across OECD countries. Hospitals in Dubai accounted for 48% of CHE, which is much higher than Qatar (40%) and the OECD average (36%).
Conclusion: The Dubai health care financing system differs substantially from that in OECD countries, as it is more private oriented. The findings point to several potential opportunities for growth and improvement. Policy areas that may be addressed using the information presented in this article are broad and include the following: shift from hospital care to ambulatory and day care, sustainability of health finance, shift the cost of health care to the private sector, introduce cost-containment measures, revise payment systems for health providers, and produce subnational accounts for non-communicable diseases. More investment in the translation of national health account data into policy is suggested for future researchers.
Keywords: Dubai, health finance, health account, health expenditures
Introduction
Located in the Arabic Gulf, the United Arab Emirates (UAE) consists of seven Emirates and covers an area of about 83,600 km2. The UAE population is made up of several different demographic groups from different cultural and socioeconomic backgrounds. The UAE National Bureau of Statistics estimates that the UAE population grew by 5.6%, from 7.2 million in 2011 to 7.6 million at the end of 2012 (17% nationals, 83% expatriates).1 Dubai is the second largest Emirate, with an area of 4,114 km2. In 2013, the population of the Emirate of Dubai was estimated at 2.2 million (24% females, 76% males). UAE nationals constitute approximately 12% of the total population, and expatriates constitute about 88%. The population doubles every 14 years, with a natural increase rate of 1.3%.2
The population in Dubai is relatively young; individuals younger than 35 years constitute about 64.4%, those aged 35–59 years constitute about 34.5%, those above 60 years constitute about 0.5%, and those older than 65 years constitute about 0.5% of the total population (0.9% for females, 0.4% of males). Demographic data reveal the distinguished population structure of the Emirate, as the largest share of the population consists of male expatriates aged 20–49 years, who constitute 62% of the total population.2 Globally, population aging explains about one-fourth of the increase in spending to gross domestic product (GDP) ratios.3 In Dubai, individuals aged 65 years and older constitute 0.5% of the total population, yet they account for 6% of the current health expenditure (CHE) in 2012.
When comparing the level of spending on health services in the UAE with that in neighboring countries, the UAE ranks better than most countries in the region. Life expectancy at birth has risen from 75.3 years in 2005 to an estimated 76.5 years in 2013. The probability of dying before reaching the age of 5 years was eight per 1,000 live births, and the infant mortality rate was 5.3 per 1,000 live births compared with 4.1 per 1000 live births in Organization for Economic Cooperation and Development (OECD) countries.4
The UAE is ranked 15th worldwide in diabetes, with the disease affecting 19% of adults. Nearly 37% of Emiratis experience hypertension.4 Diseases in the cardiovascular and circulatory systems were the leading cause of mortality in 2012, and caused 27.7% of all deaths. Cancer was the second highest cause of death, accounting for 14.8%, while diseases of the respiratory system ranked third at 10.3%. Injuries and events in the perinatal period ranked fourth and fifth at 7.5% and 5.5%, respectively.5
The Dubai health system is facing a rapid increase in population concurrent with an increasing demand for health care. The two main entities that govern health care in Dubai are the Ministry of Health (MOH), which represents the federal government, and the Dubai Health Authority (DHA), which represents the local government. Health services are provided by the DHA, the MOH, and private facilities, including Dubai Health Care City (DHCC). The flow of funds through public financing agents also reflects the level of decentralization in Dubai. For example, the share of funding from local government exceeded that from the MOH. While the number of physicians per capita increased substantially in Dubai over the past two decades (to reach 27 per 10,000 people), it remained well below the OECD average of 32. There were 56 nurses per 10,000 people in Dubai in 2012, much fewer than the average of 87 in OECD countries. The total bed capacity in Dubai was 3,815 beds in 2013, which translates to 19 beds per 10,000 people, well below the OECD average of 48 beds. The private sector dominates the delivery of health care, accounting for 76% of all outpatient visits and 61% of all inpatient visits in Dubai in 2012.
In 2012, there were about 1.5 million (primarily male) employees in Dubai; the unemployment rate was below 1%, and almost nine in ten workers were expatriates.6 The Government of Dubai Employee Healthcare Benefits Scheme (ENAYA) covers Dubai government employees and their families (39 government-owned departments with more than 90,000 beneficiaries). Since 2010, each employee or dependent has to pay 20% of the cost for inpatient or outpatient treatment, 20% for medicines, 50% of the cost of optical treatment, and 30% of the cost of dental treatment. However, medical treatment at government hospitals remains free for nationals, while expatriate government employees and their dependents incur a nominal charge of 20 UAE Dirham (AED). Military personnel are covered by another government scheme called Al Madhalla. According to the Dubai Health Survey conducted in 2009, about 48% of nationals and 13% of expatriates are covered by ENAYA. About 47% of nationals and 14% of expatriates are covered by private corporate insurance. About 73% of expatriates are not covered by any type of insurance.7
The Dubai government has introduced new health insurance legislation in an effort to implement compulsory health insurance, fully effective by 2016. The fundamental basis of the law is to ensure that every national, resident, and visitor in Dubai has essential health insurance coverage and access to essential health services. Under the new law, health insurance will be compulsory for all residents of and visitors to Dubai, including all the free zones within the Emirate. Employers will be responsible for the provision of health insurance for their employees, and sponsors will be responsible for their dependents. The government of Dubai will be responsible for nationals resident in Dubai. There will be mandated minimum coverage, in the form of a basic health plan, which will differ for nationals, expatriates, and visitors; it will be permissible to provide enhanced cover over and above the mandated essential package. The insurance law will be implemented over the following three phases: 1) companies employing over 1,000 employees; 2) companies employing 100–999 employees; 3a) companies employing fewer than 100 employees; 3b) spouses and dependents; and 3c) domestic workers.
Study objectives
The aim of this study is to describe the structure of health financing scheme providers in Dubai (specifically, the hospital, ambulatory care, medical good, and out-of-pocket components), and to draw policy issues from the published national health accounts (NHAs) by comparing Dubai with the State of Qatar (Qatar), and selected OECD countries.
Methodology
The study is based on the processing of statistical information and comparative analysis of data related to health financing in Dubai, Qatar, and 25 OECD countries. Dubai was chosen instead of the UAE because Dubai has published its own NHA; this information is not available for the UAE.
Qatar was chosen because it has the same demographic and socioeconomic context as Dubai, and is the only country in the gulf to publish its NHA. A total of 25 OECD countries were included in the analysis: Japan, France, Germany, USA, Sweden, Switzerland, Austria, Belgium, Canada, Czech Republic, Denmark, Estonia, Finland, Hungary, Iceland, Korea, the Netherlands, New Zealand, Norway, Poland, Portugal, Slovak Republic, Slovenia, Spain, and Luxembourg. These countries were chosen because they are wealthy, have been relatively well studied, have relatively accurate and complete data, and represent an interesting variety of different models of health care systems. Data collected and used were as follows:
- Secondary data collected by the DHA and published in the Dubai first NHA Report 20128
- Secondary data collected by the Supreme Council of Health in Qatar and published in the NHA Report 20129
- Secondary data collected by the OECD countries and publicly available from Eurostat (Statistical Office of the EU).10
The international System of Health Accounts (SHA) is a global standard for producing health expenditure accounts developed by the World Health Organization (WHO) in collaboration with the OECD and Eurostat.11 All measures used for Dubai and the 26 countries included in this study to form the primary base of information were based on classifications derived from the SHA to allow for cross-national comparisons. Functional and provider structures of financing schemes are an integral part of the NHAs. The population in Dubai is classified into the following three groups: nationals; non-nationals with employment visas from, and residence inside, Dubai; non-nationals with employment visas from, but residence outside, Dubai. The population boundaries for data presented in the NHA of Dubai in 2012 includes all Dubai residents (nationals and non-nationals) even if they live outside Dubai.8 Included databases are classified into the following four dimensions:
- Financing sources: entities that provide health funds.
- Financing agents: entities that receive funds from financing sources and use them to pay for health services, products, and activities. This category accounts for those entities authorized to manage and organize funds.
- Providers: entities responsible for delivering health services.
- Functions: goods, services, or activities that providers deliver to beneficiaries.
The main measures that are used for comparing countries are as follows:
- Health expenditure % GDP
- General government expenditure on health as a percentage of health expenditure
- Private expenditure on health as a percentage of health expenditure
- Out-of-pocket expenditure as a percentage of health expenditure
- Private insurance as a percentage of health expenditure
- Expenditure on inpatient care as a percentage of health expenditure
- Expenditure on outpatient care as a percentage of health expenditure
- Prevention and public health services as a percentage of health expenditure
- Medical goods as a percentage of health expenditure
- Health expenditure per capita
- Out-of-pocket expenditure per capita.
Discussion of results
Total health expenditure
Dubai’s first NHA in 2012 provided a comprehensive overview of health spending and answered questions regarding functional and provider structures of financing schemes and allocation of financial resources. The time of release of the NHA is very important because Dubai is undergoing major developments based on the recent health insurance law, where a mandatory insurance scheme will be fully effective by 2016 to achieve universal coverage, and timely data can be used to evaluate current and future health policies related to overall spending.
Spending on the various functions and providers is influenced by the availability of human resources, hospital beds, medical technology; and the financial and institutional arrangements for health care delivery; as well as national clinical guidelines and the burden of diseases.12 As major determinants of health expenditure, demographic characteristics also vary significantly between countries. Some countries have high life expectancies and relatively old populations and therefore need to spend more on older people, who incur the highest health costs per capita. The converse is true of countries with younger populations.13 Therefore, comparisons of health expenditure between Dubai, Qatar, and OECD countries cannot show whether a particular level of expenditure is appropriate; however, it will be useful in pointing out certain general patterns in spending, and will reflect specific circumstances, societal values, and solutions for each country. The total health expenditure (THE) in Dubai was 10.8 AED billion (US$2.9 billion) in 2012. Total health spending accounted for 3.4% of GDP (US$934 purchasing power parity [PPP]), the lowest share among OECD countries, and more than six percentage points lower than the OECD average of 9.3% (US$3,322 PPP). THE consists of CHE and capital formation. Table 1 summarizes selected health finance indicators for Dubai in 2012.
 | Table 1 Dubai health account summary indicators in 2012 |
CHE constitutes about 92% of THE, equivalent to 9.9 billion AED (US$2.9 billion). Capital formation constitutes about 8%, equivalent to 867 million AED (US$236 million). With the exception of Qatar, Dubai has the highest share among OECD countries, more than double that of the OECD average of 3.7% of CHE, a clear indication of the huge investments made in the health sector in Dubai during the last few years. Capital formation in terms of up-to-date equipment and the availability of essential supplies surely bolster the quality of care provided at health facilities, improve results in diagnostic and treatment services, and contribute to long-term sustainability of service provision. Figure 1 shows the capital formation (as a percentage of THE) of Dubai and other selected countries.
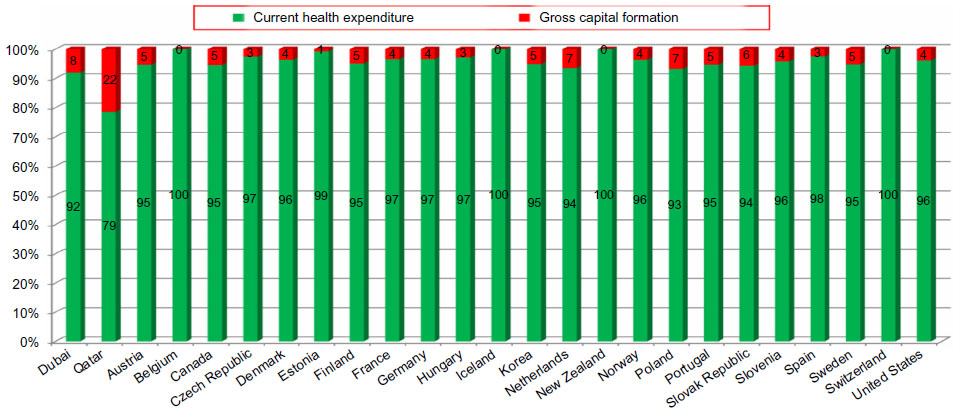 | Figure 1 Current and capital health expenditure for selected countries in 2012. |
Health expenditure by financing agent
About 33% (3,242 million AED) of money spent on health came from government, 36% (3,605 million AED) came from employers, 9% (936 million AED) came from corporates, and 22% (2,152 million AED) came from households.8 A useful comparison in developing health policy is also to assess how much of the total is being provided and pooled by both public and private sources.
Public financing
Consistent with Dubai health strategy, the public sector is not dominant in every area of health care, nor does it dominate the financing of health services. In Dubai, only 33% of CHE (3,242 million AED) is funded by the government; however, the public sector is the main source of health funding in most OECD countries and Qatar, with an average of 72.2% in 2011, and 79% in 2012, respectively.
Results show that funding agents managed their own funds, where government schemes pooled 38% (3,740 million AED). As shown in Table 2, in 2012, government schemes spent about 38% of CHE (3,740 million AED): 54% on hospitals, 27% on providers of ambulatory services, 4% on providers of ancillary services, 1% on providers of preventive services, 3% on providers of health administration, and 11% on services provided outside Dubai. The federal government spent about 3% of CHE (283 million AED): 63% on hospitals, 29% on providers of ambulatory services, and 8% on providers of preventive services. The local government spent about 35% of CHE (3,457 million AED): 54% on hospitals, 27% on providers of ambulatory services, 4% on providers of ancillary services, 1% on providers of preventive services, 2% on providers of health administration, and 12% on services provided outside Dubai.
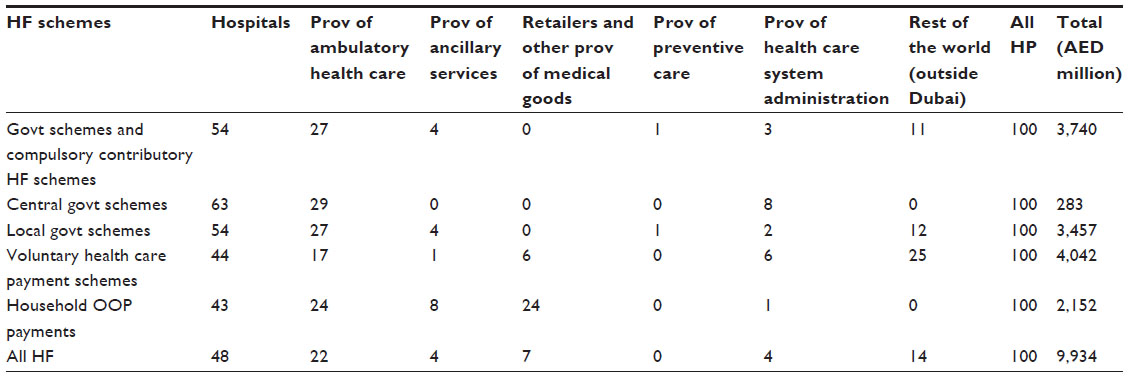 | Table 2 Provider structure by financing schemes in Dubai in 2012 (%) |
In terms of functional structure of spending, government spent around 63% of their health funds on curative services, 13% on preventive services, and 11% on medical goods. The federal governmental scheme spent about 3% of the CHE: 51% for curative services, 17% for ancillary services, 24% for medical goods, and 8% for governance. The local governmental scheme spent about 35% of the CHE: 64% for curative services, 8% for ancillary services, 10% for medical goods, 14% for preventive services, and 2% for governance, and 2% for other health services as shown in Table 3.
 | Table 3 Percentage contribution of different financing schemes to health functions (%) |
Private financing
The rising cost of providing a high standard of health care in Dubai resulted in a shift to sharing this burden with the private sector, which funds about 67% of THE. A more detailed breakdown of the private fund sources shows that 9% came from corporations, 22% came from households, and 36% came from employers funded through prepayments to private health insurance.
Results show that funding agents managed their own funds, where voluntary insurance schemes pooled 41% of funds (4,042 million AED). As shown in Table 2, the voluntary health insurance schemes spent about 41% of CHE (4,042 million AED): 44% on hospitals, 17% on providers of ambulatory services, 1% on providers of ancillary services, 6% on providers of medical goods, 6% on providers of health administration, and 25% on services provided outside Dubai. The increasing reliance on private insurance schemes is desirable, and will be realized once the mandatory insurance scheme is in place in 2016. Table 2 shows provider structure by financing schemes as in Dubai in 2012.
As shown in Table 3, the voluntary health insurance scheme spends about 41% of the CHE: 48% for curative services, 19% for ancillary services, 24% for medical goods, 1% for preventive services, 6% for governance, and 2% for other health services. Table 3 shows the percentage contribution of different financing schemes to health functions.
Household out-of-pocket payments
Global evidence indicates that it is difficult to achieve universal coverage and a high level of financial protection if out-of-pocket payments are higher than 30% of THE.14 Dubai is consistent with WHO strategy that out-of-pocket payments should not exceed 30%–40% of THE.14 Households spent about 2,152 million AED (22% of CHE), the equivalent of an average of US$187 per capita, ranking highest among GCC countries.8 Households paid about two-thirds of what the government paid for health (US$282), and one-fifth of the burden of financing the health system falls primarily on households. A reduction in out-of-pocket payments will be an additive advantage as Dubai moves towards universal coverage. On average, household out-of-pocket payments financed 20% of health spending across OECD countries in 2011, varying from 34% in Korea to 11% in Qatar, 8% in France, and 6% in the Netherlands.9,15
In terms of provider structure, 43% of out-of-pocket spending is spent on hospitals, 24% on providers of ambulatory services, 8% on providers of ancillary services, 24% on providers of medical goods, and 1% on providers of health administration. Figure 2 shows the share of household out-of-pocket payments as a percentage of CHE for Dubai (2012), Qatar (2012), and selected countries (2011).
 | Figure 2 Share of household out-of-pocket payments as percentage of current health expenditure. |
When comparing household out-of-pocket payments (about 22% of CHE) across function, about 56% of out-of-pocket payments were spent on curative services (18% on inpatient services, 3% on day care, and 35% on outpatient care), 1% on rehabilitation services, 14% on ancillary services (8% on laboratory services, 6% on imaging services), 27% on medical goods, 2% on preventive services, and 1% on health administration. Out-of-pocket payments play an increasingly important role in outpatient services and medical goods (mainly pharmaceuticals), with 35% and 27% of CHE, respectively, as shown in Table 3. As per the last Household Expenditure and Income Survey conducted in 2009, households spent an average of about 3,000 AED on health care, which is equivalent to about 2% of total household consumption.7
Health expenditure by provider
A total of 48% of CHE was spent on hospitals, 22% on providers of ambulatory health care, and 8% on retailers. Figure 3 shows the flow of money in the Dubai health system per provider in 2012.
 | Figure 3 Flow of money in the Dubai health system per provider in 2012. |
Hospitals
Hospitals in Dubai accounted for about 48% of CHE (4,756 million AED), which is much higher than in Qatar (40%) and the average in OECD countries (36%).9,15 In most OECD countries, hospitals also accounted for the highest share of CHE, ranging from 26% in Slovakia to 45% in Denmark. Figure 4 shows provider structure for selected countries (2011), Qatar (2012), and Dubai (2012).
 | Figure 4 Provider structure for selected countries (2011), Qatar (2012) and for Dubai (2012). |
Dubai ranked the highest among the 26 compared countries in spending on hospitals. As shown in Table 4, out of 48% of CHE (4,756 million AED) spent on hospitals, 39% came from local government, 4% came from central government, 38% came from voluntary insurance, and 20% came from households. Table 4 shows provider structure of spending by financing agent.
 | Table 4 Provider structure of spending by financing agent (%) |
About 74% of CHE (4,756 million AED) spent by hospitals were spent on curative services (49% on inpatient curative care, 4% on day curative care, and 21% on outpatient curative care), 1% on rehabilitation services, 10% on ancillary services (6% on laboratory and 4% on imaging), and 14% on medical goods (13% on pharmaceuticals and 1% on therapeutic appliances and others) as shown in Table 5.
 | Table 5 Provider structure by function (%) |
Providers of ambulatory care and ancillary services
The ambulatory clinics and polyclinics received the second largest share of funds at 22% (2,219 million AED), compared with as low as 19% in the Netherlands to more than 36% in the USA. As shown in Table 4, out of 2,219 million AED (22% of CHE) spent on providers of ambulatory services, 41% came from local government, 4% came from central government, 31% came from voluntary insurance, and 24% came from households. About 49% of health spending by providers of ambulatory care is spent on curative services (0.5% on day curative care, 48.5% on outpatient curative care), 15% on ancillary services (11% on laboratory, 4% on imaging), 13% on medical goods (12% on pharmaceuticals, 1% on therapeutic appliances and others), and 22% on preventive services, as shown in Table 5. In 2012, the number of primary health care centers was 23 (14 belong to the DHA, nine belong to the MOH), as well as about 1,000 private outpatient clinics, including outpatient surgical facilities. These facilities are used for performing surgery on patients who do not require hospitalization, and where surgery does not require more than 23 hours inclusive of preparation, the surgery itself, and recovery. Demand for health services grew at a higher rate in 2012. This was driven by a significant increase in outpatient encounters. A total of 7.9 million outpatients visits were recorded during the year of 2012, a 19% increase over the rate in 2011. The rate of daily visits in Dubai was 15.6 visits per 1,000 population. About 76% of these visits were to private facilities, and about 22% were to DHA facilities.5 Providers of ancillary services received a low (4%) share of funds (368 million AED). As shown in Table 4, out of 368 million AED (4% of CHE) spent on providers of ancillary services, 41% came from local government, 13% came from voluntary insurance, and 46% came from households. About 99% of health spending by providers of ancillary care is spent on ancillary services (37% on laboratory, 21% on imaging, 41% on transportation), and 1% on medical goods and pharmaceuticals as shown in Table 5.
Providers of health administration, medical goods, and preventive services
Providers of preventive services were totally funded by local government (33 million AED). Providers of medical goods received 8% of the CHE (745 million AED), compared with 4.5% in Qatar, and to more than 36% in Hungary. Providers of medical goods were funded mainly by household payments (68%) and voluntary health insurance (32%). Providers of general health administration and insurance received a low share of the funds at 4% (379 million AED). As shown in Table 4, out of 379 million AED (4% of CHE) spent on providers of health administration and insurance, 21% came from local government, 6% came from central government, 68% came from voluntary insurance, and 5% came from households.
Services outside Dubai
A significant share (14%) of the health funds paid for health services delivered outside Dubai (1,435 million AED). This high percentage deserves attention within the health care sector because these services are funded by sources in Dubai but are frequently provided outside Dubai. As shown in Table 4, out of 1,435 million AED (14% of CHE) spent outside Dubai, 29% came from local government, and 71% came from voluntary insurance. About 62% of health spending outside Dubai is spent on curative services (46% on inpatient curative care, 2% on day curative care, 14% on outpatient curative care), 15% on ancillary services (10% on laboratory, 5% on imaging), and 22% on medical goods (21% on pharmaceuticals, 1% on therapeutic appliances and others) as shown in Table 5. It is important to stress that the term “outside Dubai” embraces all patients who receive treatment consultation (outpatient) or hospitalization (inpatient) outside Dubai, either those who hold Dubai residency but live outside Dubai in other emirates like Sharjah or those who travel outside the UAE and seek treatment outside UAE. Little information is known about the services provided to citizens of Dubai in other Emirates because of the absence of a unified claiming system in 2012. However, data are available about citizens of Dubai who are treated outside the UAE. In 2012, about 1,800 patients were treated outside the UAE and sponsored through local government insurance schemes. About 35% of them sought treatment in Germany, about 31% in Thailand, and about 12% in the UK. About 20% of these patients sought oncology treatments, 13% sought orthopedic, 13% neurosurgeries, and about 5% sought cardio surgeries. The average cost per patient was about 186,000 AED, ranging from 306,000 AED in the UK, 288,000 AED in Germany, and 361,000 AED in the USA, to 20,000 AED in India.5 The DHA conducted a study jointly with the Dubai Statistics Center and concluded that the information gap between the public and available health care in the UAE is the prime reason behind potential patients looking to go abroad for medical treatment. A lack of specialist services and the length of time it takes to consult with a doctor are among the reasons residents seek medical treatment abroad. However, expatriates constitute about 88% of the total population, and a high percentage of expatriates prefer to seek health care in their home countries. For example, some patients seek rehabilitation treatment abroad because of the lack of proper acute rehabilitation services in Dubai. A 2009 survey conducted by YouGov, an international research firm, revealed a lack of confidence in the nation’s health system among expatriates, with about 70% saying they would seek treatment abroad if they fell seriously ill, compared with 57% of nationals.16 On the other hand, a Gallup survey in 2012 showed that most Emiratis are satisfied with health care in the UAE, but almost two in five still prefer to be treated abroad.17
Conclusion and recommendations
NHAs prepared for the first time in Dubai will serve as the basis for monitoring the effects of the upcoming reforms. The findings point to potential opportunities for growth and improvement in many health policy issues, including the following: shift from hospital care to ambulatory and day care, improve the sustainability of health finance schemes, shift the cost of health care to the private sector, introduce cost-containment measures, revise payment systems for health providers, and produce subnational accounts for non-communicable diseases (NCDs). The policy considerations are discussed below.
Further shift from hospital to ambulatory and day care
Health systems tend to consume resources at the hospital treatment side, which diverts those resources away from being utilized in less expensive options. Clear evidence from literature indicates that potential gains are to be made from shifting some acute inpatient services to day care or outpatient services.18 Spending on day care services in Dubai was about 2% of CHE, above the average of 19 OECD countries at 1.8% of the CHE.8 In line with international trends, this shift will be more likely a result of policy directives. A macro-policy aimed to restrain expenditure (eg, measures such as price control and case payment) may be needed to realize this shift. Given that many inpatient beds may be used for surgeries that may require a hospital stay of less than 12 hours, methods such as adopting a reimbursement price list that gives more value to day care services and doctor visits, as well as decreasing the reimbursement price for hospital services, surgeries, laboratory services, and radiology procedures, is expected to increase the amount of time physicians spend with their patients, while decreasing the number of laboratory tests administered and increasing day care services. This should increase the charges paid for doctor visits, thus encouraging health facilities to provide longer doctor–patient visits and reduce the number of tests.
Health finance sustainability
Higher priority to health in budgets is crucial for sustaining universal coverage in the long term.19 Universal coverage is usually attained in countries in which public financing of health is around 5% of GDP (WHO 2009).14 The WHO also recommends that countries spend about 15% of their annual budget on the health sector. In 2013, a total of 70 countries devoted less than 10% of government expenditure to health. In Dubai, total health spending accounted for 3.4% of GDP in 2012 (equivalent to US $934 per capita and 10.8% of general governmental expenditure), the lowest share among OECD countries, and about six points lower than the OECD average of 9.3%. Dubai is close to consistent with WHO strategy, but this amount remains inadequate in the long term. With the introduction of the new universal insurance coverage, changing demographics, aging population, and the shift to chronic diseases, the current expenditure levels may prove unsustainable. More resources need to be mobilized for health while improving the quality of health care, equity, and access to care. Extension of risk pooling should be expedited to reduce the financial burden on households. Households provide a substantial amount of health financing out-of-pocket (22% of CHE). Such spending at a time of sickness can be catastrophic. The health insurance scheme needs to be implemented expeditiously to cover all citizens so that timely use of health care is ensured and catastrophic spending at a time of sickness is avoided.
Shift the cost of health to the private sector
Despite market failures, the private sector can still play an important role in the health system depending on the preferences and constraints of each country.3 In Dubai, about 33% of health funds came from the government and 67% from private sources. The public to private ratio in health spending (67% to 33%) illustrates the relative importance of the private component in financing the health sector, and this must be considered in defining policies on financing and resource allocation. Increasing public and private sector coordination is needed for optimal health care policy design and implementation. The government has already taken the initiative to increase its role as health financier and enlist the private sector to take a more active role as well to meet the strategic objective of a 70/30 ratio between private and public providers. Greater reliance on private financing, especially of complementary health care outside the public package is featured in many countries, including Australia, Canada, and France.20 With health care demands out-pacing the supply of services and available resources, the DHA is incapable of providing treatment to all, so it is important that the DHA continue leveraging the private sector. The DHA outsourced hospital departments or other service components or signed target patient or doctor agreements with private hospitals. Engaging and building partnerships with the private sector will enable the public sector to ensure better quality and best practice across providers. It is recommended that the government provide an amiable environment to foster competition among the private sector or between the public and private sector and ensure the quality of services delivered by both. The spending will be an investment in economic growth because individuals will live longer and retain their ability to be productive members of society. Better engagement of the private health sector can also help alleviate the burden on the public sector of financing the health system.
Introduce cost-containment measures
The WHO estimated a global 20%–40% inefficiency-related loss of resources in the health sector. Dubai ranked the highest among the 26 countries compared in terms of spending on hospitals, as it spent about 48% of its CHE on hospitals and 14% of CHE on treatment outside Dubai. To continue building a more efficient and responsive health system is vital. The implementation of cost-containment strategies like utilization review mechanisms, rational drug use, and pricing of services is very important while implementing the universal coverage reform. The utilization of pharmaceuticals was a cost-containment area that was specifically highlighted as a priority. Within the structure of household health spending, spending on medical goods is considered important, as households allocate about 27% of their spending to pharmaceuticals. Rational medicine use should continue to be promoted and implemented, thus contributing to cost-containment efforts. Another area in which cost containment is a priority is treatment outside Dubai. There is a relationship between the referral abroad and type of disease, so there is a need to attract qualified staff and build capacity for those specialized diseases. Developing the relevant units in hospitals within Dubai would significantly reduce the number of transferred cases. A strict referral abroad policy might be needed to direct citizens to abandon treatment abroad. Development of a broad policy framework that will support effective coordination among all key stakeholders, use the available resources most effectively, and utilize health services provided by private organizations is also vital to reduce referrals outside Dubai.
Revise the fee-for-service payment system
To facilitate progress towards universal coverage, it is necessary to develop and implement a comprehensive health financing policy and strategy. This requires revision of the payment system to providers of health care to influence incentives and behaviors. Two potential reasons that such revision is necessary are the overtreatment that may result from payment by fee-for-services, and the lack of standardized claims information and coding. It would also be important to estimate fees based on real market prices and not historical artefacts.
Produce a subnational account for non-communicable diseases
With changing lifestyle and mortality factors in Dubai and the shift to NCDs, an increase in understanding of NCDs is vital. In view of this, there is strong need to better understand the magnitude and resource implications of financing NCD services. Introducing a subnational account for NCDs will helpful in this regard.
This article was an attempt to translate data generated from the Dubai NHA, Qatar NHA, and Eurostat database of health expenditure for OECD countries into policy-relevant information. Continued generation and use of evidence for policy initiation and use is important. This article made use of existing data to help make health financing and policy decisions by allowing comparison of Dubai with Qatar and 25 OECD countries. In addition to the need for further exploration and use of the data gathered for this round of NHA, further studies are needed to gain an even more in-depth understanding of spending on health care. This article is also an invitation to other researchers in the field to apply quantitative techniques to measure and provide deep insight into how to inform policy using the published NHA in our region. Only this kind of understanding will help us to be sure that we are moving forward in our journey to take informed health policy decisions.
Disclosure
The author reports no conflicts of interest in this work.
References
Abu Dhabi Chamber of Commerce and Industry. Abu Dhabi Economic Variables Estimates. Abu Dhabi, United Arab Emirates. 2012. | |
Dubai Statistics Center. Population Bulletin Emirate of Dubai 2013. Dubai: Dubai Statistics Center; 2014. Available from: http://www.dsc.gov.ae/EN/Themes/Pages/Publications.aspx?TopicId=23. Accessed September 3, 2014. | |
Coady D, Clements BJ, Gupta S. The Economics of Public Health Care Reform in Advanced and Emerging Economies. Washington, DC: International Monetary Fund Publications; 2012. | |
International Diabetes Federation. IDF Diabetes Atlas, 6th edition. Brussels, Belgium: International Diabetes Federation, 2013. | |
Dubai Health Authority. Dubai Annual Health Statistics Report 2012. Available from: https://www.dha.gov.ae/EN/SectorsDirectorates/Sectors/HealthPolicy/Pages/HealthDataandInformationAnalysis.aspx. Accessed September 18, 2014. | |
Dubai Statistics Center. Bulletin of Labor Force Survey Results 2012. Dubai: Dubai Statistics Center; 2013. Available from: http://www.dsc.gov.ae/EN/Themes/Pages/Publications.aspx?TopicId=22. Accessed September 3, 2014. | |
Dubai Statistics Center. Dubai Health Survey 2009. Dubai: Dubai Statistics Center. | |
Dubai Health Authority. Health Accounts System of Dubai 2012 Report. A Baseline for a New Era. Dubai: Dubai Health Authority; 2012. Available from: http://www.isahd.ae/content/docs/HASD%20English%202012.pdf. Accessed September 3, 2014. | |
Qatar Supreme Council of Health. Qatar National Health Accounts Report – 2012. Qatar: Policy Affairs Directorate; 2012. Available from: http://www.nhsq.info/app/media/1296. Accessed September 3, 2014. | |
Eurostat. Health care. Available from: http://epp.eurostat.ec.europa.eu/portal/page/portal/health/health_care. Accessed September 3, 2014. | |
Organization for Economic Cooperation and Development (OECD), World Health Organization (WHO), Eurostat. A System of Health Accounts. Paris: OECD Publishing; 2011. | |
OECD. Health at a Glance 2011: OECD Indicators. Paris: OECD Publishing; 2011. Available from: http://www.oecd.org/els/health-systems/49105858.pdf. Accessed September 3, 2014. | |
Ministry of Health. Health Expenditure Trends in New Zealand 1997–2007. Wellington, Ministry of Health; 2010. Available from: https://www.health.govt.nz/system/files/documents/publications/health-expenditure-trends1997-2007.pdf. Accessed September 3, 2014. | |
World Health Organization. Health Financing Strategy for the Asia Pacific Region (2010–2015). Geneva: World Health Organization; 2009. | |
OECD. Health at a Glance 2013: OECD Indicators. Paris: OECD Publishing; 2013. Available from: http://www.oecd.org/els/health-systems/Health-at-a-Glance-2013.pdf. Accessed September 3, 2014. | |
National T. The National YouGov Survey. 2009. | |
Inc. G. Dubai Gallup Survey. 2012. | |
The Health Foundation. Getting Out of Hospital? The Evidence for Shifting Acute Inpatient and Day Case Services from Hospitals into the Community. London: The Health Foundation; 2011. Available from: http://www.health.org.uk/public/cms/75/76/313/2539/Getting%20out%20of%20hospital%20full%20version.pdf?realName=khHFdl.pdf. Accessed September 3, 2014. | |
World Health Organization. Statistics: finding public health trends. WHO factsheet. Geneva: WHO; 2014. | |
International Monetary Fund (IMF). The economics of public health care reform in advanced and emerging countries. Washington, USA: International Monetary Fund Publications. 2014. |
 © 2014 The Author(s). This work is published and licensed by Dove Medical Press Limited. The full terms of this license are available at https://www.dovepress.com/terms.php and incorporate the Creative Commons Attribution - Non Commercial (unported, v3.0) License.
By accessing the work you hereby accept the Terms. Non-commercial uses of the work are permitted without any further permission from Dove Medical Press Limited, provided the work is properly attributed. For permission for commercial use of this work, please see paragraphs 4.2 and 5 of our Terms.
© 2014 The Author(s). This work is published and licensed by Dove Medical Press Limited. The full terms of this license are available at https://www.dovepress.com/terms.php and incorporate the Creative Commons Attribution - Non Commercial (unported, v3.0) License.
By accessing the work you hereby accept the Terms. Non-commercial uses of the work are permitted without any further permission from Dove Medical Press Limited, provided the work is properly attributed. For permission for commercial use of this work, please see paragraphs 4.2 and 5 of our Terms.