Back to Journals » Diabetes, Metabolic Syndrome and Obesity » Volume 14
Evaluation Through the Optical Coherence Tomography Analysis of the Influence of Non-Alcoholic Fatty Liver Disease on the Gingival Inflammation in Periodontal Patients
Authors Surlin P, Didilescu AC, Lazar L, Arsenie CC ![]() , Camen A, Popescu DM
, Camen A, Popescu DM ![]() , Gheorghe DN, Osiac E, Rogoveanu I
, Gheorghe DN, Osiac E, Rogoveanu I
Received 9 March 2021
Accepted for publication 13 May 2021
Published 29 June 2021 Volume 2021:14 Pages 2935—2942
DOI https://doi.org/10.2147/DMSO.S310314
Checked for plagiarism Yes
Review by Single anonymous peer review
Peer reviewer comments 3
Editor who approved publication: Professor Ming-Hui Zou
Petra Surlin,1,* Andreea Cristiana Didilescu,2,* Luminita Lazar,3,* Cristian Cosmin Arsenie,4 Adrian Camen,5 Dora Maria Popescu,1 Dorin Nicolae Gheorghe,1,* Eugen Osiac,6 Ion Rogoveanu7
1Department of Periodontology, Faculty of Dental Medicine, University of Medicine and Pharmacy of Craiova, Craiova, Romania; 2Department of Embryology, Faculty of Dental Medicine, “Carol Davila” University of Medicine and Pharmacy, Bucharest, Romania; 3George Emil Palade University of Medicine, Pharmacy, Science and Technology of Târgu Mureş, Targu-Mures, Romania; 4Doctoral School, University of Medicine and Pharmacy of Craiova, Craiova, Romania; 5Department of Oral Surgery, Faculty of Dental Medicine, University of Medicine and Pharmacy of Craiova, Craiova, Romania; 6Department of Biophysics, Faculty of Medicine, University of Medicine and Pharmacy of Craiova, Craiova, Romania; 7Department of Gastroenterology, Faculty of Medicine, University of Medicine and Pharmacy of Craiova, Craiova, Romania
*These authors contributed equally to this work
Correspondence: Cristian Cosmin Arsenie
Doctoral School, University of Medicine and Pharmacy of Craiova, 2 Petru Rareş St., Craiova, 200349, Romania
Tel +40 351 443 557
Email [email protected]
Dora Maria Popescu
Department of Periodontology, Faculty of Dental Medicine, University of Medicine and Pharmacy of Craiova, 2 Petru Rareş St., Craiova, 200349, Romania
Tel +40 351 443 557
Email [email protected]
Purpose: The purpose of this ex vivo study is to exhibit the inflammatory changes that occur within the gingival tissue by using optical coherence tomography (OCT) in periodontal patients with non-alcoholic fatty liver disease (NAFLD) and if NAFLD could influence the local periodontal inflammation.
Patients and Methods: Gingival tissue samples obtained from patients were divided into three groups – P (periodontitis), NAFLD+P (NAFLD+periodontitis) and H (healthy) groups - and were scanned using an OCT light beam, in order to perform a qualitative and quantitative analysis of images. The value of average pixel density has been associated with the degree of inflammation.
Results: The highest average pixel density was found in patients from the H group, while the lowest value of average pixel density was recorded in gingival tissue samples collected from patients with NAFLD+P. The image assessments from NAFLD+P group delivered lower values of average pixel density than those of P group, suggesting a possible influence of this disease on the inflammatory tissular changes produced by periodontal disease.
Conclusion: After comparing the OCT analysis results obtained for the three groups of patients, we can consider that NAFLD may be an aggravating factor for the inflammation of periodontal disease.
Keywords: periodontitis, non-alcoholic fatty liver disease, optical coherence tomography
Introduction
Periodontitis is a multifactorial chronic infectious disease that targets the tissues supporting the teeth.1 It is caused by the accumulation and aggressiveness of oral pathogenic bacteria of the dental subgingival biofilm that determine a chronic inflammation of the supporting structures of the teeth.2 Periodontitis is characterized by pocket formation with clinical attachment loss of the junctional epithelium, and if left untreated, eventual tooth loss.1,2 Certain systemic conditions act as risk factors for periodontitis, including coronary heart disease, atherosclerosis, pregnancy outcomes, but other disorders, such as diabetes mellitus, have been shown to share a bidirectional influence with periodontal disease,2 while the possible influence of non-alcoholic fatty liver disease (NAFLD) on periodontal inflammation is still quite little studied.3
NAFLD is a chronic and progressive liver disease, characterized by a high accumulation of lipids in the liver, affecting individuals regardless of alcohol consumption, obesity being considered an important risk factor.4 NAFLD can also be correlated with high levels of glycated haemoglobin-A1c (HbA1c) due to insulin resistance that characterizes this disease, consequently leading to type 2 diabetes,5 therefore recently researchers proposed to change the nomenclature from NAFLD to metabolic associated fatty liver disease (MAFLD).6 Clinically, NAFLD is often asymptomatic and linked to the alteration of lipid and lipoprotein metabolism, insulin resistance, therefore being associated with the metabolic syndrome.5
NAFLD can be classified into simple steatosis, that presents no significant inflammation and fibrosis, and non-alcoholic steatohepatitis (NASH), characterized by steatosis with hepatic inflammation and, frequently, with progressive fibrosis, ultimately leading to liver cirrhosis.4,7 From an epidemiological point of view, 30% of the population in the Western countries is affected by NAFLD.8 Non-alcoholic fatty liver disease can be marked by increased serum levels of LDL cholesterol, triglyceride and hepatic transaminases serum aspartate transaminase (AST) and serum alanine transaminase (ALT),9 and high-density lipoprotein HDL cholesterol levels,10 that represent risk factors for cardiovascular disease (CVD).11,12 In many cases the ALT levels can be normal,13 and LDL level slightly elevated, making these parameters, in some cases, not relevant. Therefore, ultrasonography is the most useful diagnostic tool that determines the presence of NAFLD in asymptomatic patients.8
Optical coherence tomography (OCT) is a non-invasive diagnostic technique that provides optical cross-sectional images of biological tissues,14 and detects mechanical interfaces, relying on the differences in light reflection.15 Optical coherence tomography (OCT), which was first introduced by Huang et al, is based on low coherence interferometry resulting into a two-dimensional image of the studied tissue sample.16 Optical coherence tomography (OCT) has a penetration depth of 2–3 mm within the studied tissue, depending on the structure being penetrable by light.16
The need for non-invasive and more precise diagnosis tools determined researchers to consider OCT an innovative imaging method, being used for medical purposes, such as ophthalmology,17 dermatology,18 cardiology,19 gastroenterology.20 Compared to classical radiology, OCT has important benefits, being suitable for the analysis of both soft and hard tissues. Because it uses near-infrared light, it does not produce any radiation that can be harmful to the patient, such as the case of cone beam computed tomography (CBCT).21
In dental medicine, OCT has proven valuable contributions, being used for experimental purposes in different dental specialities.22 OCT could have applications in prosthetic dentistry, were it could help the preparation process of abutment teeth, by improving dentine and enamel thickness assessment.23 In odontology, OCT analysis can be used for tooth crack’s detection and assessment of dental fillings’ marginal adaptation.24 The OCT can also be used for a better visualization of the endodontic area of the tooth and also for the detection of inter-dental carious lesions.25 In periodontology, the most studies use OCT for the ex vivo examination of periodontium but, recent ones try to validate in vivo OCT. It was used to visualize the subgingival calculus and measure the depth of gingival sulcus or periodontal pockets or the evaluate the microvascularization in the inflamed gingival tissue. OCT has a strong potential to display and assess dental plaque and gingiva in a clinical setting. Technological challenges remain to perform systematic longitudinal tracking and comparative analyses.26–29
The purpose of this ex vivo study is to illustrate the changes that occur within the gingival tissue, by using OCT, allowing to determine the pixel density of the obtained cross-sectional images. Based on the hypothesis that a lower pixel density could be associated with a higher degree of inflammation,30 we aimed to highlight the possible influence that NAFLD could have on the local inflammatory gingival changes in patients who suffer from these two conditions.
Materials and Methods
Patient Selection
The subjects included in the study were selected from the patients who addressed the Periodontology and Oral Surgery Departments of the University of Medicine and Pharmacy of Craiova, Romania. For the study, the Ethics Committee approval of the University of Medicine and Pharmacy of Craiova was obtained, registered with code number 49/20.04.2018, as well as the written consent from all the participating patients. All participants were informed about the purpose of the study and that it was conducted in accordance with the Declaration of Helsinki.
The diagnosis of the patients who reported having NAFLD was confirmed in the Gastroenterology Clinic of the University of Medicine and Pharmacy of Craiova, Romania. Ultrasonography was required for all subjects included in the study.
All periodontal patients included in the study, had at least one tooth in the lateral premolar-molar area with a periodontal pocket > 5mm, thus offering the possibility of standardized gingival tissue sampling at this level, during routine periodontal surgical therapy. They had been diagnosed with periodontitis31 in the Periodontology Department, followed by the initial periodontal therapy, and, after the reevaluation, they underwent the surgical periodontal phase. All patients were periodontal examined by the same specialized practitioner in order to eliminate the individual variability.
To conduct this study, a number of 38 patients were selected, aged 36–58 years, 16 males and 22 females, 24 of them had indication for periodontal surgical treatment, after undergoing periodontal initial instrumentation, from the Periodontology Department, divided into: group P=12 patients with periodontal disease, group P+NAFLD=12 patients with periodontal disease and non-alcoholic fatty liver disease, as test groups and 14 healthy patients without periodontal or systemic diseases who had performed extractions for orthodontic purpose at the Oral Surgery Clinic as control group H (Table 1).
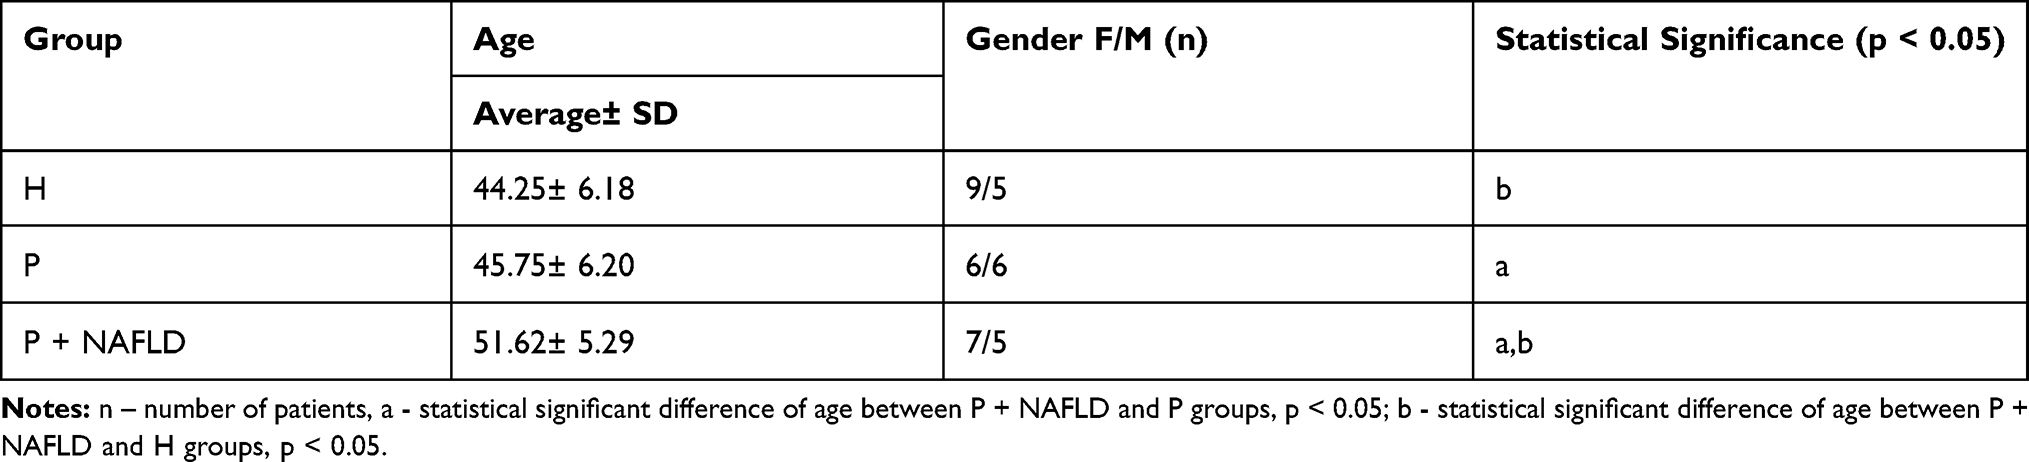 |
Table 1 Age and Gender of Patients in Each Group |
Gingival Tissue Sampling
The gingival tissue samples were collected from the gingival wall of the periodontal pocket, during periodontal surgery as part of the routine periodontal treatment after undergoing periodontal initial instrumentation, in order to eradicate the periodontal pockets detected at the reevaluation (pockets > 5mm), performed on the patients from groups P and P+NAFLD that suffered from periodontal disease. In the control group the samples were collected from the marginal gingiva of the teeth having no periodontal modifications that underwent extraction for orthodontic purposes. The gingival samples were sectioned to a size of 3×3 mm, then placed in 10% formalin solution and refrigerated at 8°C, until the time of examination.
OCT Analysis
For image acquirement, an OCT OCS 1300SS device (Thorlabs, USA) was used, with set-up and characteristics previously described.30 The device provides in air axial resolutions of 12 μm and lateral resolution of 15 μm. The OCT investigation of the periodontal tissue was conducted as previously described by the same researchers,27 by sampling 512 sections, in the form of JPEG images. Images were scanned in the following size: 2 mm x 2 mm x 2 mm (length x width x depth) and (1024x512x512) pixels, and according to Fernandes et al were calibrated using a refractive index of 1.41.32 All the other parameters of the OCT investigation were kept constant for each measurement. The analysis of these images was done by using an image processing software ImageJ free license by National Institute of Health, USA. For the pixel density analysis, five consecutive images were selected for each sample from the total of 512 images, including the median image (256), two previous images (254, 255) and two subsequent ones (257, 258), and the density was analyzed from the point of view of both pixels numbers and gray-scale values.
A measuring segment as a linear shape was placed perpendicular to the centre of each image, from the upper edge of the gingival epithelium and down to the lower edge of the connective tissue, and thus it was possible to measure the intensity of the pixels on the gray-scale (Figure 1). The length of the measuring segment was set to 0.75 mm, in order to cover the vertical dimension of the assessed tissues of the gingival sample. For standardization reasons, the same segment length was applied on all images.
 |
Figure 1 OCT cross-sectional image sample with linear shape measuring segment. |
The use of the ImageJ program resulted in a range of values, representing the intensities in gray-scale of the pixels, which included both the number of pixels present in each analyzed area, as well as the length and area occupied by the measurement segment, which were then saved in Microsoft Excel format. The pixel density (D) for each image was calculated by the formula:
I x 100/255 = D (I–intensity in measured gray tones). For each study group, the average values were calculated.
The study also included a qualitative analysis of the generated OCT images, in order to detect changes in aspect or shape, that might have occurred within the gingival epithelium or underlying connective tissue. The qualitative observation was mainly focused along the epithelial-connective tissue junction and on the shape of the connective tissue cristas, projecting into the gingival epithelium.
Statistical Analysis
In order to compare the obtained data, the t-Student test was used for the three study groups, and the statistical significance threshold having set the value p ˂ 0.05. Statistical correlation test
Pearson was performed for the age and pixel density parameters of the study groups, due to the small number of patients included in the study, it was not possible to make correlations according to gender.
Results
From the analysis of the images using the ImageJ software, it was observed that the images in group H presented the highest average density value in pixels, followed by those in group P and then group P+NAFLD, thus registering a significant difference between the average values of the densities of pixels between the three groups (p <0.05), as well as between groups P and P+NAFLD (p <0.05) (Tables 1 and 2).
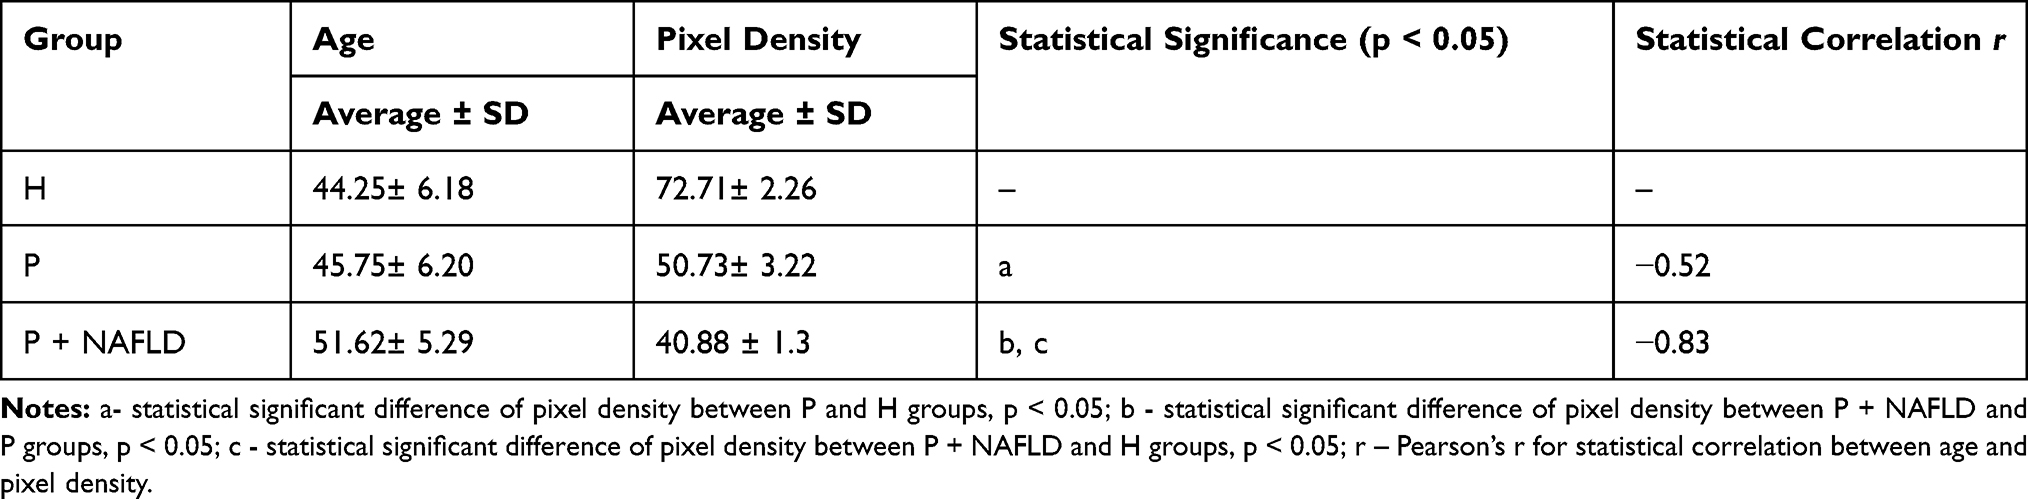 |
Table 2 Average Pixel Density for Each Study Group |
After the qualitative analysis of the images obtained by scanning the samples with the help of OCT, a good representation of the conjunctive digitations and an obvious demarcation area between the connective tissue and the gingival epithelium was revealed in the H group, whereas in those from groups P and P+NAFLD, a wiped aspect of the conjunctive digitations and a blurred boundary between the connective tissue and the gingival epithelium were observed (Figure 2).
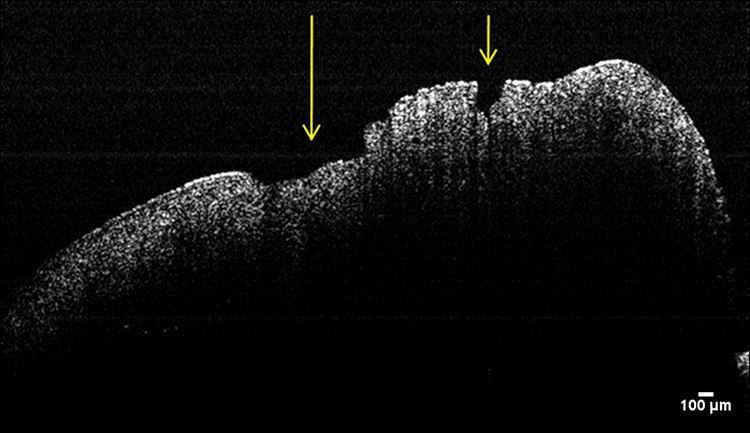 |
Figure 2 OCT cross-sectional image of gingival tissue from patient with periodontitis and NAFLD. Ulcerative lesions of the gingival epithelium (see arrows). |
Discussion
The mostly used tool that helps to diagnose and evaluate NAFLD is ultrasonography which is an efficient and non-invasive technique, having a high accuracy,33 the most used in this cases being the conventional B-mode ultrasonography.34 The ultrasound parameters aimed for NAFLD diagnosis include hepatomegaly, parenchymal brightness, and deep beam attenuation and liver-to-kidney contrast bright vessel walls.35 In order to better diagnose NAFLD, J. Moon et al assessed the LDs dynamic and cellular- and subcellular-level accumulation in hepatocytes, associated with the progression of hepatic steatosis, in an in vivo study conducted on mice, by using fluorophore SF44 and a custom-built video-rate laser scanning con-focal intra-vital microscopy system.36
For the diagnosis of periodontal disease, the frequently used investigations are periodontal probing, for periodontal pocket depth and loss of clinical attachment level assessment, together with the radiological examination. Because it is a non-invasive method, the OCT analysis method could attract increasing interest for evaluating the depth of the periodontal pockets and the loss of clinical attachment level (CAL), by using the obtained axial resolutions.37 The data obtained with in vitro OCT analysis method, can represent a reference for future appliance of the in vivo technique. Xiang et al showed in a previous study that OCT is also used to determine calculus deposition, making it easier to remove it and improving the efficiency of the periodontal treatment.1 A recent study also determined that by making the OCT instruments more ergonomic, the in vivo applicability of this technique could be improved,31 facilitating diagnose and determination of the progression of the periodontal disease.21 Due to the evolution achieved in the recent years by OCT, this method, by using photonics, may also be considered, a sixth generation periodontal probe.14
The ex vivo analysis of the gingival tissue, in order to determine its density with the help of OCT in the cases of periodontal inflammation and to highlight the changes produced at this level, by using the density analysis in pixels, has been performed in periodontal patients associated with other systemic diseases, such as diabetes mellitus and chronic hepatitis C.30 The lowest pixel density was recorded in patients with diabetes mellitus, followed by those in periodontal patients with hepatitis C. The results of our study delivered higher pixel densities in periodontal patients with NAFLD than in periodontal patients with diabetes mellitus or chronic hepatitis C from previous study, but lower values than in systemically healthy periodontal patients. This suggests that the local impact of NAFLD on periodontal inflammation is significant, but not as severe as that of diabetes mellitus or chronic hepatitis C30.
In the 1960s, Gargiulo et al determined the dimensions for the dentogingival interface, on autopsy subjects, using histological measurements for supracrestal connective tissue, junctional and sulcular epithelium.38 More recently, Tristão et al obtained histological measurements for supracrestal gingival tissue by analyzing the gingival tissues collected after tooth extraction.39
Modern technological advancements have shown that OCT is a useful and non-invasive tool for the evaluation of oral epithelial thickness of multiple sites within the oral cavity, in in vivo and real-time settings.40 In order to achieve an increased accuracy of oral mucosal diagnosis different other techniques was proposed41 as for the gingival tissue volume, Wang et al, analyzed the gingival average thickness using a 3D OCT image analysis and applied a semi-automated registration and segmentation method.42
During periodontal inflammation, histological changes can be observed within the gingival epithelium, such as the appearance of leukocyte infiltrate, inflammatory oedema, vacuolar degeneration with the formation of vesicles, leading to necrosis of the gingival epithelium and, finally, to ulceration at this level (Figure 2).43 This histopathological inflammatory changes lead to a decrease in tissue density, as shown by OCT assessment performed on gingival tissue samples originating from periodontal patients. This decrease in tissue density, as shown by OCT analysis, is more significant when the periodontal patients also suffer from systemic conditions such as diabetes mellitus.30 Our results are similar to this finding, suggesting an association between tissue pixel density and the degree of periodontal inflammation.
The connective tissue physically and nutritionally supports the epithelial tissues. The connective tissue papillae (rete pegs) allow optimal nutritional exchanges between them, although variations of the tissue morphology may exist, depending on the age and gender of individuals, and also depending on the region of the oral cavity.43 Rete pegs are mostly frequently found within the gingival epithelium and its connective tissue (119 ± 27 rete pegs per mms).44 The progression of periodontal inflammation within the depth of the marginal gingiva leads to the deletion of the epithelial-connective tissue delimitation, thus inflicting disruptions to the basal lamina.45,46 Our qualitative analysis of the OCT images revealed a wiped appearance of the connective digitations and a blurred boundary between the two types of tissue, which was mostly evident in NAFLD affected patients of the P+NAFLD group (Figure 2). To prevent OCT analysis outputs alterations, the collected samples of gingival tissue from the lateral molar-premolar area (to avoid significant variations in its thickness) were placed in formalin solution, being stored at +8OC.47
The images of the gingival samples, obtained by OCT analysis, revealed that the pixel density of the epithelium and the connective tissue was lower in group P samples as compared to those of group H. This fact can be explained by the existing chronic periodontal inflammation in the P group patients. In addition, it was observed that the samples originating from the group P+NAFLD patients expressed a lower pixel density than the ones of the P and H groups. The fact that the samples from the group P+NAFLD exhibited a lower average pixel density compared to those from group P can be interpreted that NAFLD could increase the local periodontal inflammatory reaction (Table 2).
Regarding the age implications, our results reveal that the age is higher in the P+NAFLD group and statistically significant different from H and P groups (Table 1), in line with other findings that show the prevalence of NAFLD is higher in the elderly.48
The strong and inverse correlation between the age and pixel density associated to the degree of inflammation in P+NAFLD patients, while in group P the correlation was moderate, suggests the involvement of NAFLD in exacerbating the local inflammatory reaction with increasing age.
No statistical analysis regarding the patients gender, was made in our study, due to the small number of patients. The findings obtained by other studies revealed that the prevalence of
NAFLD in women increases with age, but does not alter with age in men, aging being considered as a risk factor for NAFLD in premenopausal women, independent of weight gain or influence of metabolic syndrome, so female-sex being no longer protective with increasing age.48,49
However, the study was limited in the number of participating patients, the purpose was to draw attention to the possible influence of NAFLD on the periodontal inflammation. The data obtained motivated to expand the study on this subject in vue to understand the linking pathway,50 making possible not only the treatment but the prevention of periodontal clinical changes in patients suffering from both diseases, improving the quality of life of these patients.
Conclusion
Within the limitation of this study, given the small number of patients, analysing the images obtained by OCT technique, we could conclude that the non-alcoholic fatty liver disease may have a negative effect of aggravating the local periodontal inflammatory reaction in patients with periodontal disease, by increasing the inflammation of the gingival tissues.
Acknowledgments
A.C.D., L.L. and G.N.D equally contributed with the first author.
Funding
This research received no external funding.
Disclosure
The authors declared no conflicts of interest for this work.
References
1. Xiang X, Sowa MG, Iacopino AM, et al. An update on novel non-invasive approaches for periodontal diagnosis. J Periodontol. 2010;81:186–198. doi:10.1902/jop.2009.090419
2. Newman MG, Takei H, Klokkevold PR, Carranza FA. Chapter 12: Impact of Periodontal Infection of Systemic Health. In Newman and Carranza’s Clinical Periodontology.
3. Akinkugbe AA, Slade GD, Barritt AS. Periodontitis and Non-alcoholic Fatty Liver Disease, a population-based cohort investigation in the Study of Health in Pomerania. J Clin Periodontol. 2017;44(11):1077–1087. doi:10.1111/jcpe.12800
4. Lazo M, Clark JM. The epidemiology of nonalcoholic fatty liver dis-ease: a global perspective. Semin Liver Dis. 2008;28:339–350. doi:10.1055/s-0028-1091978
5. Byrne CD, Targher G. NAFLD: a multisystem disease. J Hepatol. 2015;62(1):S47–S64. doi:10.1016/j.jhep.2014.12.012
6. Eslam M, Sanyal AJ, George J. International Consensus Panel. MAFLD: a consensus-driven proposed nomenclature for metabolic associated fatty liver disease. Gastroenterology. 2020;158(7):1999–2014.e1. doi:10.1053/j.gastro.2019.11.312
7. Stojsavljević S, Palčić MG, Jukić LV, Duvnjak LS, Duvnjak M. Adipokines and proinflammatory cytokines, the keymediators in the pathogenesis of nonalcoholic fatty liver disease. World J Gastroenterol. 2014;20(48):18070–18091. doi:10.3748/wjg.v20.i48.18070
8. Hyysalo J, Mannisto VT, Zhou Y, et al. A population-based study on the prevalence of NASH using scores validated against liver histology. J Hepatol. 2014;60:839–846. doi:10.1016/j.jhep.2013.12.009
9. Chen CH, Huang MH, Yang JC, et al. Prevalence and etiology of elevated serum alanine aminotransferase level in an adult population in Taiwan. J Gastroenterol Hepatol. 2007;22:1482–1489. doi:10.1111/j.1440-1746.2006.04615.x
10. Fon Tacer K, Rozman D. Nonalcoholic fatty liver disease: focus on lipoprotein and lipid deregulation. J Lipids. 2011;2090–3030. doi:10.1155/2011/783976
11. Treeprasertsuk S, Leverage S, Adams LA, Lindor KD, St Sauver J, Angulo P. The Framingham risk score and heart disease in nonalcoholic fatty liver disease. Liver Int. 2012;32(6):945–950. doi:10.1111/j.1478-3231.2011.02753.x
12. Chalasani N, Younossi Z, Lavine JE, et al. The diagnosis and management of non-alcoholic fatty liver disease: practice guideline by the American gastroenterological association, American association for the study of liver diseases, and American college of gastroenterology. Gastroenterology Hepatol. 2012;55(6):2005–2023. doi:10.1002/hep.25762
13. Tarantino G, Finelli C. What about nonalcoholic fatty liver disease as a new criterion to define metabolic syndrome? World J Gastroenterol. 2013;19(22):3375–3384. doi:10.3748/wjg.v19.i22.3375
14. Kakizaki S, Aoki A, Tsubokawa M, et al. Observation and determination of periodontal tissue profile using optical coherence tomography. J Periodontal Res. 2018;53(2):188–199. doi:10.1111/jre.12506
15. Park J-Y, Chung J-H, Lee J-S, Kim H-J, Choi S-H, Jung U-W. Comparisons of the diagnostic accuracies of optical coherence tomography, micro-computed tomography, and histology in periodontal disease: an ex vivo study. J Periodontal Implant Sci. 2017;47(1):30–40. doi:10.5051/jpis.2017.47.1.30
16. Huang D, Swanson EA, Lin CP, et al. Optical coherence tomography. Science. 1991;254(5035):1178–1181. doi:10.1126/science.1957169
17. Nolan RC, Narayana K, Galetta SL, Balcer LJ. Optical coherence tomography for the neurologist. Semin Neurol. 2015;35(5):564–577. doi:10.1055/s-0035-1563579
18. Olsen J, Themstrup L, Jemec GB. Optical coherence tomography in dermatology. G Ital Dermatol Venereol. 2015;150(5):603–615.
19. Nadkarni SK. Optical measurement of arterial mechanical properties: from atherosclerotic plaque initiation to rupture. J Biomed Opt. 2013;18(12):121507. doi:10.1117/1.JBO.18.12.121507
20. Yachimski P, Shi C, Slaughter JC, Washington MK. Endoscopic mucosal resection of Barrett’s esophagus detects high prevalence of sub squamous intestinal metaplasia. World J Gastrointest Endosc. 2013;5:590–594. doi:10.4253/wjge.v5.i12.590
21. Park JY, Chung JH, Lee JS, Kim HJ, Choi SH, Jung UW. Comparisons of the diagnostic accuracies of optical coherence tomography, microcomputed tomography, and histology in periodontal disease: an ex vivo study. J Periodontal Implant Sci. 2017;47(1):30–40. doi:10.5051/jpis.2017.47.1.30
22. Hsieh YS, Ho YC, Lee SY, et al. Dental optical coherence tomography. Sensors. 2013;13(7):8928–8949. doi:10.3390/s130708928
23. Fujita R, Komada W, Nozaki K, Miura H. Measurement of the remaining dentin thickness using optical coherence tomography for crown preparation. Dent Mater J. 2014;33(3):355–362. doi:10.4012/dmj.2013-303
24. Kim JM, Kang SR, Yi WJ. Automatic detection of tooth cracks in optical coherence tomography images. J Periodont Implant Sci. 2017;47(1):41–50. doi:10.5051/jpis.2017.47.1.41
25. Shimada Y, Nakagawa H, Sadr A, et al. Noninvasive cross-sectional imaging of proximal caries using swept-source optical coherence tomography (SS-OCT) in vivo. J.Biophotonics. 2014;7(7):506–513. doi:10.1002/jbio.201200210
26. Mota CC, Fernandes LO, Cimões R, Gomes AS. Non-Invasive Periodontal Probing Through Fourier-Domain Optical Coherence Tomography. J Periodontol. 2015;86(9):1087–1094. doi:10.1902/jop.2015.150047
27. Yeragi E, Nalawade KP, Gotmare S, Yeragi P, Prabhu V. Generation Periodontal Probe??? A Review. IOSR-JDMS. 2019;18(8):5.
28. Le NM, Song S, Zhou H, et al. A noninvasive imaging and measurement using optical coherence tomography angiography for the assessment of gingiva: an in vivo study. J Biophotonics. 2018;11:e201800242. doi:10.1002/jbio.201800242
29. Won J, Darold R. Boppart Handheld optical coherence tomography for clinical assessment of dental plaque and gingiva. J Biomed Opt. 2020;25(11):116011. doi:10.1117/1.JBO.25.11.116011
30. Șurlin P, Camen A, Stratul SI, et al. Optical coherence tomography assessment of gingival epithelium inflammatory status in periodontal - Systemic affected patients. Ann Anat. 2018;219:51–56. doi:10.1016/j.aanat.2018.04.010
31. Armitage GC. Development of a classification system for periodontal diseases and conditions. Ann Periodontol. 1999;4:1–6. doi:10.1902/annals.1999.4.1.1
32. Fernandes LO, Mota CCBO, de Melo LSA, da Costa Soares MUS, da Silva Feitosa D, Gomes ASL. In vivo assessment of periodontal structures and measurement of gingival sulcus with optical coherence tomography: a pilot study. J Biophotonics. 2017;10(6–7):862–869. doi:10.1002/jbio.201600082
33. Hernaez R, Lazo M, Bonekamp S, et al. Diagnostic accuracy and reliability of ultrasonography for the detection of fatty liver: a meta-analysis. Hepatol. 2011;54(3):1082–1090. doi:10.1002/hep.24452
34. Adams LA, Talwalkar JA. Diagnostic evaluation of nonalcoholic fatty liver disease. J Clin Gastroenterol. 2006;40(1):34–38. doi:10.1097/01.mcg.0000168642.38945.f1
35. Dasarathy S, Dasarathy J, Khiyami A, Joseph R, Lopez R, McCullough AJ. Validity of real time ultrasound in the diagnosis of hepatic steatosis: a prospective study. J Hepatol. 2009;51(6):1061–1067. doi:10.1016/j.jhep.2009.09.001
36. Moon J, Kong E, Lee J, et al. Intravital longitudinal imaging of hepatic lipid droplet accumulation in a murine model for nonalcoholic fatty liver disease. Biomed Opt Express. 2020;11(9):5132–5146. doi:10.1364/BOE.395890
37. Kim S-H, Kang S-R, Park H-J, Kim J-M, Yi W-J, Kim TI. Improved accuracy in periodontal pocket depth measurement using optical coherence tomography. J Periodontal Implant Sci. 2017;47(1):13–19. doi:10.5051/jpis.2017.47.1.13
38. Gargiulo AW, Wentz FM, Orban B. Dimension and relation of the Dentogingival Junction in Humans. J Periodontol. 1961;32(3):261–267. doi:10.1902/jop.1961.32.3.261
39. Tristão GC. Supracrestal gingival tissue measurement in normal periodontium: a human histometric study. Int J Periodontics Dent. 2014;34(1):97–102. doi:10.11607/prd.1353
40. Stasio DD, Lauritano D, Iquebal H, Romano A, Gentile E, Lucchese A. Measurement of Oral Epithelial Thickness by Optical Coherence Tomography. Diagnostics. 2019;9(3):90. doi:10.3390/diagnostics9030090
41. Cicciù M, Herford AS, Cervino G, Troiano G, Lauritano F, Laino L. Tissue Fluorescence Imaging (VELscope) for Quick Non-Invasive Diagnosis in Oral Pathology. J Craniofac Surg. 2017;28(2):e112–e115. doi:10.1097/SCS.0000000000003210
42. Wang G, Le NM, Hu X, et al. Semi-automated registration and segmentation for gingival tissue volume measurement on 3D OCT images. Biomed Opt Express. 2020;11(8):4536–4547. doi:10.1364/BOE.396599
43. Newman MG, Takei H, Klokkevold PR, Carranza FA. Chapter 14: Gingival Inflammation,” in Newman and Carranza’s Clinical Periodontology.
44. Paulsen F, Thale A. Epithelial-connective tissue boundary in the oral part of the human soft palate. J Anat. 1998;193(3):457–467. doi:10.1046/j.1469-7580.1998.19330457.x
45. Klein-Szanto AJ, Schroeder HE. Architecture and density of the connective tissue papillae of the human oral mucosa. J Anat. 1997;123(1):93–109.
46. Kantarci A, Nseir Z, Kim YS, et al. Trackman Loss of basement membrane integrity in human gingival overgrowth. J Dent Res. 2011;90(7):887–893. doi:10.1177/0022034511404703
47. Gnanadesigan M, van Soest G, White S, et al. Effect of temperature and fixation on the optical properties of atherosclerotic tissue: a validation study of an ex-vivo whole heart cadaveric model. Biomed Opt Express. 2014;5(4):1038–1049. doi:10.1364/BOE.5.001038
48. Bertolotti M, Lonardo A, Mussi C, et al. Nonalcoholic fatty liver disease and aging: epidemiology to management. World J Gastroenterol. 2014;20(39):14185–14204. doi:10.3748/wjg.v20.i39.14185
49. Hamaguchi M, Kojima T, Ohbora A, Takeda N, Fukui M, Kato T. Aging is a risk factor of nonalcoholic fatty liver disease in premenopausal women. World J Gastroenterol. 2012;18(3):237–243. doi:10.3748/wjg.v18.i3.237
50. Fiorillo L, Cervino G, Laino L, et al. Porphyromonas gingivalis, Periodontal and Systemic Implications: a Systematic Review. Dent J. 2019;7(4):114. doi:10.3390/dj7040114
 © 2021 The Author(s). This work is published and licensed by Dove Medical Press Limited. The
full terms of this license are available at https://www.dovepress.com/terms
and incorporate the Creative Commons Attribution
- Non Commercial (unported, 3.0) License.
By accessing the work you hereby accept the Terms. Non-commercial uses of the work are permitted
without any further permission from Dove Medical Press Limited, provided the work is properly
attributed. For permission for commercial use of this work, please see paragraphs 4.2 and 5 of our Terms.
© 2021 The Author(s). This work is published and licensed by Dove Medical Press Limited. The
full terms of this license are available at https://www.dovepress.com/terms
and incorporate the Creative Commons Attribution
- Non Commercial (unported, 3.0) License.
By accessing the work you hereby accept the Terms. Non-commercial uses of the work are permitted
without any further permission from Dove Medical Press Limited, provided the work is properly
attributed. For permission for commercial use of this work, please see paragraphs 4.2 and 5 of our Terms.