Back to Journals » Clinical Ophthalmology » Volume 10
Evaluation of the progression of visual field damage in patients suffering from early manifest glaucoma
Authors Perdicchi A, Abdolrahimzadeh S, Cutini A, Ciarnella A, Scuderi GL
Received 31 May 2016
Accepted for publication 19 July 2016
Published 25 August 2016 Volume 2016:10 Pages 1647—1651
DOI https://doi.org/10.2147/OPTH.S113995
Checked for plagiarism Yes
Review by Single anonymous peer review
Peer reviewer comments 2
Editor who approved publication: Dr Scott Fraser
Andrea Perdicchi,1 Solmaz Abdolrahimzadeh,2 Alessandro Cutini,1 Angela Ciarnella,1 Gian Luca Scuderi1
1Ophthalmology Unit, Facoltà Medicina e Psicologia, Ospedale Sant’Andrea, 2Ophthalmology Unit, DAI Testa/Collo Policlinico Umberto I, Sapienza University of Rome, Rome, Italy
Background: This retrospective study aimed to determine how often a perimetric examination should be carried out in order to identify visual field (VF) changes in patients with relatively early manifestation glaucoma.
Materials and methods: Patients included had a relatively recent manifestation of primary open-angle glaucoma. Patients with a minimum follow-up of 5 years and a minimum of seven VF tests were included. Statistical analysis was performed to verify the trend of variations in mean defect (MD) over time (PeriData). The results were subjected to a t-test for a comparative analysis of progression of VF changes over time. The annual rate of progression provided by PeriData considering all the VFs analyzed was compared with that obtained on half of the VF examinations during the same follow-up period. An analysis of the MD trend over time was also carried out in relationship to the number of VF tests done and by dividing the sample into a high-frequency group (more than eight VFs) and a low-frequency group (fewer than eight VFs) in the follow-up period.
Results: A total of 96 eyes of 96 patients were included, and overall 846 VFs were examined. The paired t-test performed comparing the MD index of all the VFs against half of them did not show statistical significance (P=0.537). The high-frequency group comprised 39 eyes (average VF 11.05±1.91, average time interval 0.76 years) while the low-frequency group comprised 57 eyes (average VF 6.95±0.6, average time interval 1.21 years). The analysis of the MD trend in the high-frequency patients showed significance (P=0.017); the low-frequency group did not show statistical significance (P=0.08).
Conclusion: The number of VFs in a determined time interval was not significant. However, a greater frequency of tests provides a predictive evaluation of the rate of progression of early manifestation open-angle glaucoma.
Keywords: open-angle glaucoma, visual field, progression, ocular hypertension
Introduction
Glaucoma is a multifactorial neurodegenerative disorder characterized by progressive structural and functional injury of the optic nerve complex (optic nerve and parapapillary region).1–7 Evaluation of visual field (VF) damage remains the major index of the functional impact of glaucoma, and the assessment of its progression has a direct effect on therapeutic decisions and the quality of life of patients.8–13 There is an ongoing debate on the number of VF tests and the time interval between tests, which are necessary in order to obtain a reliable progression trend. Based on theoretical considerations, it has been suggested that a large number of VF examinations are necessary to detect smaller yet clinically significant progression rates, especially in eyes demonstrating a high degree of long-term fluctuation. It has also been suggested, based on simulation data, that a minimum of three VF examinations in the first 2 years are required to achieve optimal sensitivity and specificity for detection of clinically significant rates of progression analysis.14 A reliable progression trend may help the ophthalmologist to assess treatment or schedule the frequency of follow-up visits. Indeed, not all patients need frequent VF testing, and only in a minority of patients does glaucoma progress fast enough to warrant frequent testing and aggressive therapy.15 The aim of our study was to determine the number of perimetric VF examinations required to identify changes in the VF of patients in the first years of glaucoma, retrospectively. In particular, this was to establish if the number of tests carried out in an established time span influences the rate of progression and stage of disease. Therefore, we aimed to define the optimal number of examinations required over time in patients suffering from glaucoma.
Materials and methods
This research was authorized by the Sapienza Ethics Commitee and followed the tenets of the Declaration of Helsinki. Informed consent was obtained from all subjects participating in the study.
Patients with a clinical diagnosis of recently manifest primary open-angle glaucoma (POAG) were selected. Inclusion criteria were as follows: 1) Diagnosis of POAG less than 2 years prior. Subjects were classified as having glaucoma if they had: a) intraocular pressure measured with Goldmann tonometry without therapy >22 mmHg; b) upon VF examination, at least 3 adjacent points reduced in sensitivity by 5 dB, with one of the points being reduced by at least 10 dB; at least two adjacent points reduced in sensitivity by 10 dB or a difference of at least 10 dB across the nasal horizontal meridian at two adjacent points; none of the points should be edge points except immediately above or below the nasal horizontal meridian;16 c) an abnormal optic nerve head evaluated by stereophotography by a glaucoma expert (AP). 2) Patients with a minimum follow-up of 5 years of VF tests (Octopus 1-2-3 program, G1 full-threshold strategy) and a minimum of seven VF tests performed during the study period. 3) Best-corrected visual acuity of at least 30/40 at the time of the first VF selected, and a refractive defect of ±8 D (spherical equivalent).
Exclusion criteria were patients with opacities of lens that were clearly evident at slit-lamp examination, and retinal or neurological diseases that could influence VF test results. Visual acuity assessment and a complete ophthalmological examination with slit lamp and indirect ophthalmoscopy were carried out at each VF-examination date.
Based on these criteria, a total of 96 patients (47 males and 49 females) were included in this study. The age range was 58–82 years (66±15.96 years). Only one eye per patient was selected. Two VF examinations were excluded before the first VF test was included, in order to improve the reliability of the perimetric indices due to learning effects, present in any kind of perimetric technique.17–19 A VF test was considered reliable only when false-positive and false-negative responses were less than 20% and fixation losses were less than 20%.20
For each eye considered, all the VFs were studied with statistical regression analysis in order to evaluate the rate of progression of mean defect (MD; dB/year) over time (PeriData for Windows version 2.3). The annual rate of progression of MD provided by PeriData on all the VFs was also compared with the data obtained by analyzing half of the VF tests. In particular, this was done by excluding one VF out of three (one VF was considered and the successive one not considered), in order to analyze only half of the VFs in the same follow-up period.
An analysis of the trend of the MD over time with PeriData was also carried out, dividing the sample into two groups in relation to the number of VF tests done in the average follow-up time for each eye. In this way, two different groups were created: the first was arbitrarily denominated the high-frequency group, with more than eight VFs examined, and the second was denominated the low-frequency group, with fewer than eight VFs examined in the follow-up period. The high-frequency group consisted of 39 eyes, with an average number of 11.05±1.91 VF tests per eye and average interval between tests of 0.76 years, while the low-frequency group consisted of 57 eyes, with an average number of 6.95±0.6 VF tests per eye and average interval between tests of 1.21 years.
Statistical analysis
Paired t-tests were used to assess within-subject differences. Linear regression analysis was performed to assess the relationship between progression (dB/year) of the VF over time in both the high- and low-frequency groups. Intraclass correlation coefficients (ICCs) were used to determine the repeatability of measurements within groups. P-values less than 0.05 were considered statistically significant, and P<0.001 was considered to be highly statistically significant. All calculations were carried out using SPSS software (version 20; IBM, Armonk, NY, USA).
Results
Table 1 shows the baseline characteristics of the study cohort. An overall total of 846 VFs were examined from 1997 until 2014. The average number of VFs for each eye examined was 8.63±2.65. At baseline, the average MD was −4.08±4.03 dB. The rate of progression of MD of the all VFs examined (846) was −0.354 dB/year. The rate of progression of MD of half of the VFs examined (423) in the same time interval was −0.376 dB/year. Paired t-tests performed comparing the annual progression MD index of all the VFs vs MD index of half of the VFs (−0.376 dB/year) in the same time interval did not show any statistical significance (P=0.537).
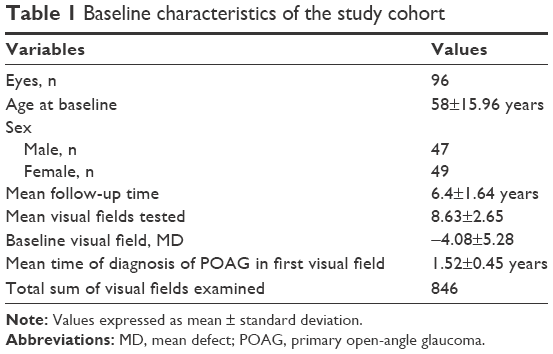 | Table 1 Baseline characteristics of the study cohort |
Although no significant differences were found between all VFs (1-year progression rate) and half of the VFs, there were significant differences between the 3-and 6-month (P=0.003) and 1-year (P<0.001) progression rates (Figure 1). In addition, ICC analysis showed good agreement between the 1-year progression rate and half of the VFs progression rate (ICC 0.94, IC 95% confidence interval [CI] 0.9–0.96; P<0.001). Instead, no agreement was found between the 3-month and 6-month progression rates vs the 1-year progression rate (ICC 0.05, 95% CI −0.42 to 0.39, P=0.40 and ICC −0.17, 95% CI −0.93 to 0.46, P=0.52, respectively).
 | Figure 1 Progression rate of mean defect in all visual field over 1 year (year), in the same follow-up period considering one VF out of three (half) and in the first 3 and 6 months of follow-up (3 month; 6 month). |
The MD-trend analysis carried out with PeriData on the high-frequency group showed significance (−0.362 dB/year, P=0.017), while in the low-frequency group the MD-trend analysis did not show any statistical significance (−0.357 dB, P=0.080). Linear regression analysis showed no relationship between the low-frequency group and follow-up in time (r2=0.002, P=0.48), whereas a significant relationship was found in the high-frequency group (r2=0.024, P<0.001) (Figure 2).
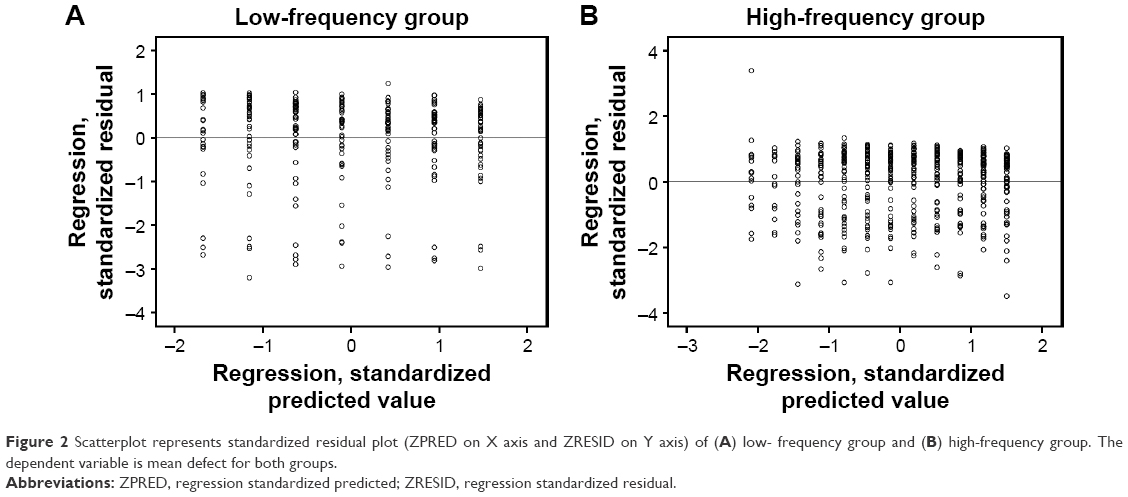 | Figure 2 Scatterplot represents standardized residual plot (ZPRED on X axis and ZRESID on Y axis) of (A) low- frequency group and (B) high-frequency group. The dependent variable is mean defect for both groups. |
Discussion
Our results suggested that in a period of 7 years, the total sum of VF tests did not significantly influence the long-term rate of progression of MD in recently manifest POAG. However, a higher frequency of VF testing, as in the high-frequency group led to earlier detection of glaucoma progression, especially with global trend analyses, demonstrating a better capacity of evidencing VF worsening than in the low-frequency group.
The evaluation of the variations of perimetric indices obtained by statistical analysis currently represents a valid tool in the evaluation of the progression of VF damage. An estimate of the rate of progression of VF damage is essential, as it enables the rapid identification of patients who present worsening, which indicates a higher risk toward visual disability. Evaluation can be focused on specific perimetric variations over time (event analyses) or it can be a global perimetric evaluation (trend analyses).21 In the event-based method, the difference in perimetric sensitivity of a test is determined with comparison of previous VFs taken as baseline tests.
The analysis of the trend of sensitivity of all VFs analyzed in follow-up is evaluated using linear regression to determine the presence of points of worsening that are statistically significant. The advantage of trend analysis is that a linear change can give an estimate of the progression over time. There are still numerous doubts on the most appropriate type of analysis, and the frequency and number of examinations necessary to determine a clinically significant perimetric variation, which can be predictive of VF deterioration over time.22 The absence of general consensus on the criteria to identify significant changes in VF over time is shown by the variability in the criteria used in various trials, such as the NTGS,23 AGIS,24 and EMGT.25
The ability to predict the future course of progression based on precedent VFs has an important role in the management of glaucoma, especially in cases that worsen. Nouri-Mahdavi et al26 studied a subgroup of 161 patients in the AGIS study in order to evaluate perimetric progression over 8 years of follow-up. Multivariate analysis of some risk factors evaluated over 4 years showed that the major predictive factor of VF deterioration was a negative index, establishing that patients with higher deterioration were those who showed worsening in the first 4 years. Therefore, the authors concluded that close follow-up is critical in the initial stages of diseases in order to determine the successive trend of the pathology, and that it is fundamental to perform a higher number of VF tests in the first stages of disease in order to determine early worsening.26
The last edition of the European Glaucoma Society guidelines suggests that all newly diagnosed patients should be tested with standard automated perimetry three times per year during the first 2 years following diagnosis.27
Other authors reported that a frequency of testing above four tests per year did not add relevant information regarding VF alterations studied with point-wise linear regression. Furthermore, they found that frequent testing, especially in patients with a low index of progression, could potentially increase the number of false positives and reduce the specificity of the test.28
Our data are in agreement with reports that suggest that in recently manifest glaucoma, in order to have an estimate index of linear regression of VF decay, a high number of tests is necessary in the first stages of follow-up, and that the capacity of evidencing VF worsening based on only one test per year is extremely low. Our results showed that in a follow-up period of 7 years, the global number of VF tests was not fundamental to determine the entity and the index of progression over time. Indeed, both the t-test relative to the annual index of progression and linear regression of global MD were not significant. However, the significance relative to MD linear regression eyes with more than eight VF tests over the follow-up period (average 11.05±1.91 VFs) was different. Our study was focused on eyes with a recent manifestation of POAG, and showed that a higher number of VF tests, especially in the first stages of disease, allowed earlier detection of VF deterioration, allowing appropriate therapeutic management and avoiding a negative influence on the quality of life of patients. It must be emphasized that in the absence of statistical significance of both the t-test, performed on half of the global VFs without considering the interval between tests, and linear regression analysis in patients who had undergone fewer than eight VF tests in 7 years confirms that a higher frequency of tests in the initial stages of disease is fundamental toward clinical predictability and the follow-up of glaucoma. Our results have significant health care policy implications with regard to determining the frequency of VF testing in patients with glaucoma. The retrospective approach of this study represents its strongest limitation.
Disclosure
The authors report no conflicts of interest in this work.
References
Goldberg I. How common is glaucoma worldwide? In: Weinreb RN, Kitazawa Y, Krieglstien GK, editors. Glaucoma in the 21st Century. London: Mosby; 2000:3–8. | ||
Thylefors B, Négrel AD, Pararajasegaram R. Epidemiologic aspects of global blindness prevention. Curr Opin Ophthalmol. 1992;3:824–834. | ||
Tielsch JM, Sommer A, Kats J, Quigley HA, Royall RM, Javitt J. Racial variations in the prevalence of primary open-angle glaucoma: the Baltimore Eye Survey. JAMA. 1990;266:369–374. | ||
Klein BE, Klein R, Sponsel WE. Prevalence of glaucoma: the Beaver Dam Eye Study. Ophthalmology. 1992;99:1499–1504. | ||
Sommer A, Tielsch JM, Katz J, et al. Relationship between intraocular pressure and primary open-angle glaucoma among white and black Americans: the Baltimore Eye Survey. Arch Ophthalmol. 1991;109:1090–1095. | ||
Sommer A. Glaucoma: facts and fancies. Eye (Lond). 1996;10:295–301. | ||
Iester M, Perdicchi A, Capris E, Siniscalco A, Calabria G, Recupero SM. Comparison between discriminant analysis models and “glaucoma probability score” for the detection of glaucomatous optic nerve head changes. J Glaucoma. 2008;17:535–540. | ||
Gutierrez P, Wilson MR, Johnson C, et al. Influence of glaucomatous visual field loss on health-related quality of life. Arch Ophthalmol. 1997;115:777–784. | ||
Recupero SM, Contestabile MT, Taverniti L, Villani GM, Recupero V. Open angle glaucoma: variations in the intraocular pressure after visual field examination. J Glaucoma. 2003;12:114–118. | ||
Sherwood MB, Garcia-Siekavizza A, Meltzer MI, Hebert A, Burns AF, McGorray S. Glaucoma’s impact on quality of life and its relation to clinical indicators: a pilot study. Ophthalmology. 1998;105:561–566. | ||
Jampel HD, Friedman DS, Quigley H, Miller R. Correlation of the binocular visual field with patient assessment of vision. Invest Ophthalmol Vis Sci. 2002;43:1059–1067. | ||
Nelson P, Aspinall P, Papasouliotis O, Worton B, O’Brien C. Quality of life in glaucoma and its relationship with visual function. J Glaucoma. 2003;12:139–150. | ||
Hyman LG, Komaroff E, Heijl A, Bengtsson B, Leske MC. Treatment and vision-related quality of life in the Early Manifest Glaucoma Trial. Ophthalmology. 2005;112:1505–1513. | ||
Chauhan BD, Garway-Heath DF, Goñi FJ, et al. Practical recommendations for measuring rates of visual field change in glaucoma. J Ophthalmol. 2008;92:569–573. | ||
Nouri-Mahdavi K, Nassiri N, Giangiacomo A, Caprioli J. Detection of visual field progression in glaucoma with standard achromatic perimetry: a review and practical implications. Graefes Arch Clin Exp Ophthalmol. 2011;249:1593–1616. | ||
Iester MM, Wollstein G, Bilonick RA, et al. Agreement among graders on Heidelberg retina tomograph (HRT) topographic change analysis (TCA) glaucoma progression interpretation. Br J Ophthalmol. 2015;99:519–523. | ||
Heijl A, Lindgren G, Olsson J. The effect of perimetric experience in normal subjects. Arch Ophthalmol. 1989;107:81–86. | ||
Heijl A, Bengtsson B. The effect of perimetric experience in patients with glaucoma. Arch Ophthalmol. 1996;114:19–22. | ||
Contestabile MT, Perdicchi A, Amodeo S, Recupero V, Recupero SM. The influence of learning effect on frequency doubling technology perimetry (Matrix). J Glaucoma. 2007;16:297–301. | ||
Enger C, Sommer A. Recognizing glaucomatous field loss with the Humphrey STATPAC. Arch Ophthalmol. 1987;105:1355–1357. | ||
Scuderi GL, Cesareo M, Perdicchi A, Recupero SM. Standard automated perimetry and algorithms for monitoring glaucoma progression. Prog Brain Res. 2008;173:77–99. | ||
Gardiner SK, Crabb DP. Frequency of testing for detecting visual field progression. Br J Ophthalmol. 2002;86:560–564. | ||
[No authors listed]. Comparison of glaucomatous progression between untreated patients with normal-tension glaucoma and patients with therapeutically reduced intraocular pressures. Am J Ophthalmol. 1998;126:487–497. | ||
[No authors listed]. The Advanced Glaucoma Intervention Study (AGIS): 7. The relationship between control of intraocular pressure and visual field deterioration. Am J Ophthalmol. 2000;130:429–440. | ||
Heijl A, Leske MC, Bengtsson B, Bengtsson B, Hussein M. Measuring visual field progression in the Early Manifest Glaucoma Trial. Acta Ophthalmol Scand. 2003;81:286–293. | ||
Nouri-Mahdavi K, Zarei R, Caprioli J. Influence of visual field testing frequency on detection of glaucoma progression with trend analyses. Arch Ophthalmol. 2011;129:1521–1527. | ||
European Glaucoma Society. Terminology and Guidelines for Glaucoma. 4th ed. Florence: EGS; 2014. | ||
Gardiner SK, Crabb DP. Examination of different pointwise linear regression methods for determining visual field progression. Invest Ophthalmol Vis Sci. 2002;43:1400–1407. |
 © 2016 The Author(s). This work is published and licensed by Dove Medical Press Limited. The
full terms of this license are available at https://www.dovepress.com/terms
and incorporate the Creative Commons Attribution
- Non Commercial (unported, 3.0) License.
By accessing the work you hereby accept the Terms. Non-commercial uses of the work are permitted
without any further permission from Dove Medical Press Limited, provided the work is properly
attributed. For permission for commercial use of this work, please see paragraphs 4.2 and 5 of our Terms.
© 2016 The Author(s). This work is published and licensed by Dove Medical Press Limited. The
full terms of this license are available at https://www.dovepress.com/terms
and incorporate the Creative Commons Attribution
- Non Commercial (unported, 3.0) License.
By accessing the work you hereby accept the Terms. Non-commercial uses of the work are permitted
without any further permission from Dove Medical Press Limited, provided the work is properly
attributed. For permission for commercial use of this work, please see paragraphs 4.2 and 5 of our Terms.