
Back to Journals » Diabetes, Metabolic Syndrome and Obesity » Volume 18
Evaluation of the Effect of Acute Elevated Intraocular Pressure on Retinal and Choroidal Microvasculature in Diabetic Rats
Authors Yao Y  , Yan Y, Wei W, Wang Q
Received 31 August 2024
Accepted for publication 5 February 2025
Published 26 February 2025 Volume 2025:18 Pages 615—625
DOI https://doi.org/10.2147/DMSO.S493984
Checked for plagiarism Yes
Review by Single anonymous peer review
Peer reviewer comments 2
Editor who approved publication: Dr Rebecca Baqiyyah Conway
Yao Yao, Yanni Yan, Wenbin Wei,* Qian Wang*
Beijing Tongren Eye Center, Beijing Tongren Hospital, Capital Medical University, Beijing, People’s Republic of China
*These authors contributed equally to this work
Correspondence: Wenbin Wei; Qian Wang, Beijing Tongren Eye Center, Beijing Tongren Hospital, Capital Medical University, Beijing, People’s Republic of China, Email [email protected]; [email protected]
Purpose: Understanding the dynamics of blood flow regulation in diabetic conditions is crucial for developing targeted interventions. This study aimed to investigate the impact of acute intraocular pressure (IOP) elevation on retinal and choroidal microvasculature in diabetic and control rats.
Methods: Male Sprague-Dawley rats were divided into two groups: diabetic and control. Acute IOP elevation was achieved through controlled perfusion pressure. Retinal and choroidal blood flow was measured using Swept-Source Optical Coherence Tomography Angiography (SS-OCT/OCTA).
Results: At baseline IOP levels, there were no statistically significant differences in perfusion area (PA) between the two groups in all regions of the retina and choroid. During acute IOP elevation, both diabetic and control rats experienced a significant reduction in retinal and choroidal blood flow perfusion. Diabetic rats manifested significantly higher (P< 0.05) alterations in PA across nearly all retinal regions compared to the control group, barring specific sub-regions of the outer ring. Concerning choroidal PA, the diabetic group exhibited a more pronounced alteration than the control group across the entire 6-mm region and certain sub-regions of the outer ring.
Conclusion: Our results demonstrate a clear association between diabetes and impaired choroidal vascular autoregulation during acute IOP elevation. The observed reduction in retinal and choroidal microvasculature in diabetic rats points towards a compromised ability to maintain blood flow homeostasis under stress conditions.
Keywords: diabetes, retinal blood flow, choroidal perfusion, optical coherence tomography angiography, intraocular pressure, vascular autoregulation
Introduction
Diabetes is a major risk factor for a wide range of chronic diseases, including cardiovascular and cerebrovascular diseases and kidney disease, constituting a major global health concern.1,2 Diabetic retinopathy (DR) is the most common and serious complication of diabetes. Characterized by progressive damage to the microvasculature of the retina, diabetic retinopathy is a leading cause of vision impairment and blindness among working-age individuals.3–5 Once diabetes-related retinal microangiopathy including microaneurysms, hemorrhages, exudates, neovascularization, etc occurs, patients are unable to control its progression even with strict control of blood glucose levels.6,7 There is still a lack of effective control and treatment for early diabetic retinopathy.
Perfusion of the microvasculature in the posterior segments of the eye, including the retina and choroid, is critical for maintaining normal vision. Pericyte and endothelial cell apoptosis triggered by hyperglycemia further leads to capillary occlusion and ischemia, which is considered to be the main mechanism for the development of diabetic retinopathy.8–10 Retinal microvascular changes such as microangiomas are also important clinical signs to observe the development and progression of DR.11 Choroidal vascular dysfunction, though less studied than retinal changes, has been implicated in the pathogenesis of diabetic retinopathy. In diabetic eyes, choroidal capillaries show endothelial atrophy, laminar deposition and stenosis, and early changes in perfusion. These vascular structural and functional changes may appear earlier than in the retina.12,13 Given the choroid’s pivotal role in supporting retinal function, understanding its response to physiological stressors is of paramount importance. Therefore, mechanistic exploration of blood flow and microvascular alterations in the retina and choroid may be an important basis for early recognition and intervention in diabetic retinopathy. However, the specific mechanisms governing these hemodynamic changes, particularly in response to acute stressors such as elevated intraocular pressure (IOP), remain incompletely understood.
The vasculature of all tissues throughout the body has some degree of self-regulation. During fluctuations in perfusion pressure or changes in metabolic demand, the vascular bed is able to ensure homeostasis of the corresponding organ by regulating blood flow. The vasculature of the eye including retinal and choroidal microvasculature is also self-regulating, and its internal perfusion is influenced by intraocular pressure.14,15 In this context, our study aimed to elucidate the impact of acute IOP elevation on retinal and choroidal blood flow dynamics in diabetic rats compared with control rats. Acute IOP elevation, a scenario commonly encountered in various ocular conditions, including glaucoma, has been implicated in exacerbating vascular dysfunction and contributing to the progression of diabetic retinopathy. Investigating the vascular response to acute IOP elevation in diabetic subjects may unveil critical insights into the mechanisms underlying diabetic retinopathy’s vascular pathology.
Materials and Methods
Animal Preparation
Animal procedures adhered to the guidelines outlined in the Association for Research in Vision and Ophthalmology Statement for the Utilization of Animals in Ophthalmic and Vision Research. Ethical approval for the protocols was secured from the Institutional Animal Care and Use Committee of Capital Medical University. Adult white Sprague-Dawley (SD) rats (n = 20) were enlisted for this investigation, with ten allocated to the diabetic group and ten to the control group.
Eight-week-old male SD rats in the control group were provided with a normal chow diet (NCD), while those in the diabetic group received a high-fat diet (HFD, 60% fat) for an 8-week duration. After the 8-week HFD regimen, a singular dose of 25 mg/kg streptozotocin (STZ), dissolved in 10 mmol/l citrate buffer (pH 4.5), was intraperitoneally administered to the HFD-fed rats each day until they reached the random glucose level of diabetes. Random glucose levels were consistently monitored through tail capillary blood glucose measurements. Rats registering more than three random glucose measurements≥ 16.7 mmol/l (severe diabetic stage to observe the development of DR earlier)16 were classified as diabetic. Subsequently, to establish a persistent Type 2 Diabetes Mellitus (T2DM) complication rat model, T2DM rats continued to be fed an HFD in subsequent feeding phases.
The right eye of each subject underwent optical coherence tomography (OCT) examination. During imaging sessions, animals were initially anesthetized with 4% isoflurane mixed with normal air (21% O2) for 10 minutes, followed by 2% isoflurane for anesthesia maintenance. Pupil dilation was achieved with a 1% tropicamide ophthalmic solution. Body temperature was upheld at 38°C with a circulating warm water blanket. Prior to cannulation, 0.5% proparacaine hydrochloride was instilled for additional corneal anesthesia, and pupil dilation with 1% tropicamide facilitated OCT beam access to the posterior segment.
Unilateral elevation of IOP was achieved through cannulation of the anterior chamber using a 31-gauge needle shortened to 5 mm, connected to a reservoir filled with balanced salt solution. Intraocular pressure was gauged using an icare IC200 tonometer (iCare Finland Oy, Helsinki, Finland) and averaged over 5 consecutive measurements. IOP was raised from baseline to 80 mmHg, inducing obstruction of retinal and choroidal blood flow, after which it was restored to baseline. At both baseline and elevated IOP levels, a 20-second interval was observed to allow IOP stabilization before image acquisition. Frequent application of saline solution was employed to sustain corneal hydration and clarity throughout the experiment.
Imaging Acquisition and Processing
OCT and optical coherence tomography angiography (OCTA) scans were executed at both baseline IOP and elevated IOP levels utilizing an SS-OCT/OCTA system (VG200D, SVision Imaging, Ltd., Guangzhou, China). The scanning procedures encompassed a 16mm OCT star-scan pattern, a 6mm × 6mm OCTA scan, and an 18mm × 18mm OCTA scan, all centered on the optic nerve head (ONH).
The SS-OCT/OCTA system featured a Swept-Source (SS) laser boasting a central wavelength of approximately 1050 nm and a scan rate of 200,000 A-scans per second. Structural OCT imaging comprised 18 radial B-scans meticulously positioned around the ONH. Each B-scan, composed of 2048 A-scans, spanned 12 mm and was distinctly separated from adjacent lines by 20°. The machine’s built-in algorithm automatically executed segmentation of the retinal and choroidal layers. Angiography involved obtaining 3-dimensional volumetric data through a raster scan protocol of 512 continuous horizontal B-scans. Vascular images of the capillary plexus, spanning from the internal limiting membrane to the outer choroid, were presented automatically. All scans were categorized based on the Early Treatment Diabetic Retinopathy Study (ETDRS) map,17 centered on the ONH, delineating circles with diameters of 1, 3, and 6 mm and divided into superior, temporal, inferior and nasal regions (Figure 1A and B).
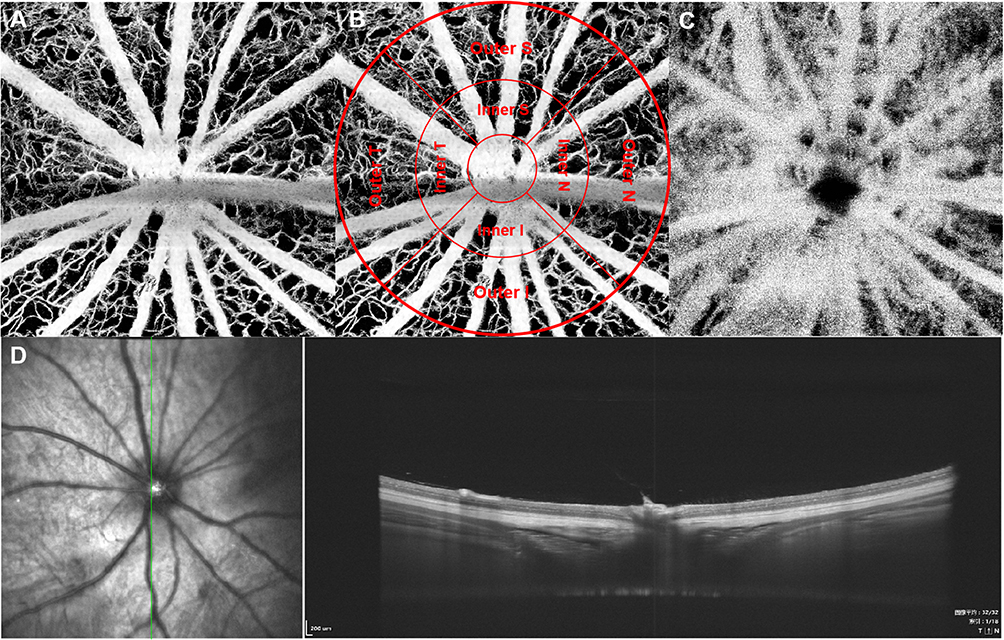 |
Figure 1 OCT/OCTA images of the ocular fundus scanned at baseline intraocular pressure of the control group; S=superior, T=temporal, I=inferior, N=nasal The 6mm × 6mm OCTA scan and 16mm OCT star-scan pattern was performed. (A) retinal blood flow of the optic nerve head; (B) the measuring region of the optic nerve head; (C) Choroidal blood flow of the optic nerve head; (D) OCT of the fundus showing the layers of the retina and choroid. |
Reduced perfusion density (PD) indicate compromised blood flow, leading to ischemia, hypoxia, and microvascular damage, ultimately impairing retinal function.18 Superficial capillary plexus (SCP) plays a critical role in maintaining the health and function of retinal neurons, while deep capillary plexus (DCP) is crucial for supporting the metabolic demands of the retinal cells in the inner nuclear layer and outer plexiform layer.19,20 The segmentation of the SCP and DCP was set in the inner two-thirds and outer one-third border of GCIPL. In this study, PD of the SCP and DCP was automatically evaluated, while perfusion area (PA) of the full retina and full choroid was assessed. PA, denoted the total area of the perfused vascular network whereas PD represented the proportion of vascular perfusion area in the total measured area. Mean PA and PD values of the microvasculature were computed using the built-in algorithm integrated into the OCTA tool.
Statistical Analysis
Statistical analyses were conducted using the IBM SPSS Statistics 27.0 software program (SPSS, version 27.0; IBM/SPSS, Chicago, IL, USA) and GraphPad Prism 9.3.1 (GraphPad Software, San Diego, CA, USA). Unless stated otherwise, continuous variables are presented as the mean ± standard error or median (interquartile range, IQR). Comparisons of two samples were performed using the two-tailed Student’s t-test or Mann–Whitney u-test. Paired t-tests were used to compare data from the same eye at baseline and after IOP elevation, whereas unpaired t-tests were used for data from different groups.
Results
The SS-OCT/OCTA system represents an advanced imaging capability, offering a high level of detail in visualizing the retina from the ONH to the choroid under normal IOP conditions (Figure 1). The vascular perfusion undergoes notable transformations when confronted with a sudden increase in IOP. In Figure 2, we present a comprehensive array of OCT/OCTA images derived from a normal rat exposed to elevated IOP levels (80 mmHg). Scrutinizing both the peripheral cross-sectional flow images surrounding the ONH and the en-face retinal image, we observe distinct alterations in the vascular framework. Although the intensity signal of retinal arteries and veins remains robust, there is a discernible reduction in the capillary network within the retinal layer at this heightened IOP threshold. Additionally, there is a significant impact on choroidal blood perfusion, characterized by a decrease in flow. In some instances, both retinal and choroidal perfusion experience a substantial decline in response to heightened IOP conditions.
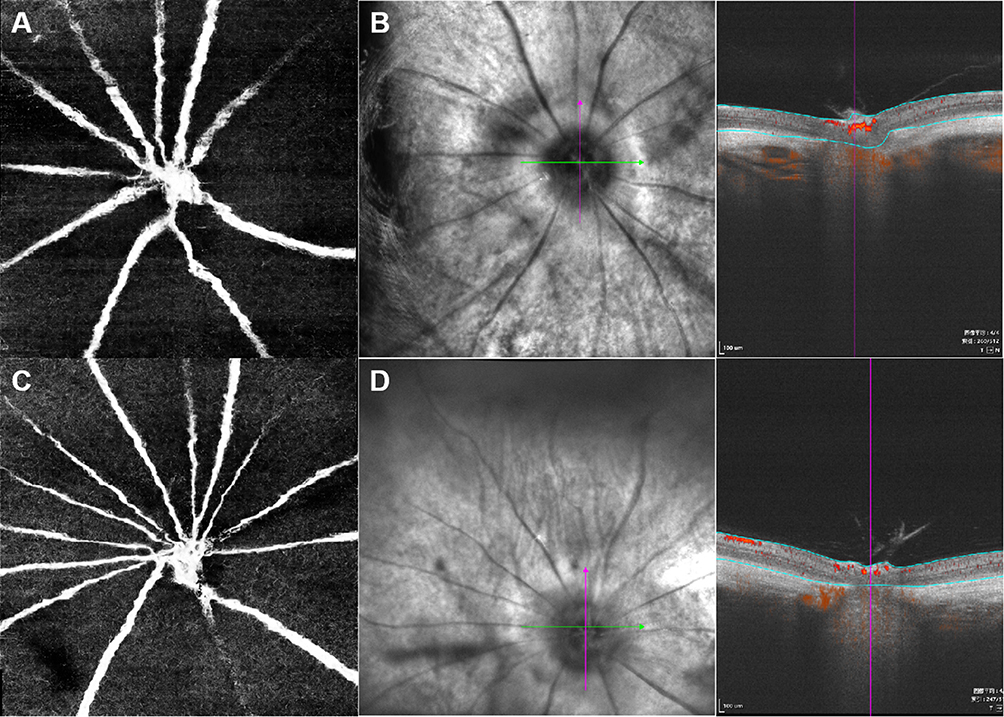 |
Figure 2 OCT/OCTA images of the ocular fundus scanned at elevated intraocular pressure in diabetic and control group. The 6mm × 6mm OCTA scan was performed. (A and B) images of control group, (C and D) images of diabetic group; (A–C) retinal blood flow of the optic nerve head; (B and D) OCT also showing blood flow of the retina and choroid. |
Before modeling, the mean body weights of rats in the control and diabetic groups were 140.1 g and 141.5 g. After successful modeling, they were 402.6 g and 358.3 g respectively. The mean values of blood glucose in the control and diabetic rats after modeling were 7.2 mmol/L and 11.4 mmol/L, respectively.
At baseline IOP levels, the retinal and choroidal PA of the control and diabetic rats were distributed on the ETDRS ring centered on the optic disc as shown in Figure 3. The mean values of retinal PA were 22.72±1.22mm2 and 21.03±1.03mm2, and choroidal PA were 25.63±0.25mm2 and 25.02±0.68mm2 in the control and diabetic rats, respectively, in the 6mm zone at baseline level. The results of the independent samples t-test showed that there were no statistically significant differences in PA between the two groups in all regions of the retina and choroid. In addition we measured the PD of SCP and DCP. There remained no significant difference between the control and diabetic groups at baseline levels.
 |
Figure 3 Distribution of the perfusion area of retina and choroid in diabetic and control group at baseline. |
To compare the disparity in PA between the control and diabetic rats in each region pre and post IOP elevation, the findings revealed that subsequent to IOP elevation, diabetic rats manifested significantly higher (P<0.05) alterations in PA across nearly all retinal regions compared to the control cohort, barring specific sub-regions of the outer ring. Concerning choroidal PA, the diabetic cohort exhibited a more pronounced alteration than the control cohort across the entire 6-mm region and certain sub-regions of the outer ring (Table 1).
 |
Table 1 Comparison of the Variation of Retinal and Choroidal Perfusion Area Before and After the IOP Elevation Between Diabetic and Control Rats |
A comprehensive measurement of superficial and deep retinal vascular perfusion density values before and after IOP elevation was provided. Rats within the diabetic cohort exhibited a more substantial decreation in PD within the central optic disc region and the inner and outer rings scattered across diverse retinal regions, spanning both the superficial and deep layers, in contrast to the control group (Table 2, Figure 4).
 |
Table 2 Comparison of the Variation of Retinal Perfusion Density Before and After the IOP Elevation Between Diabetic and Control Rats |
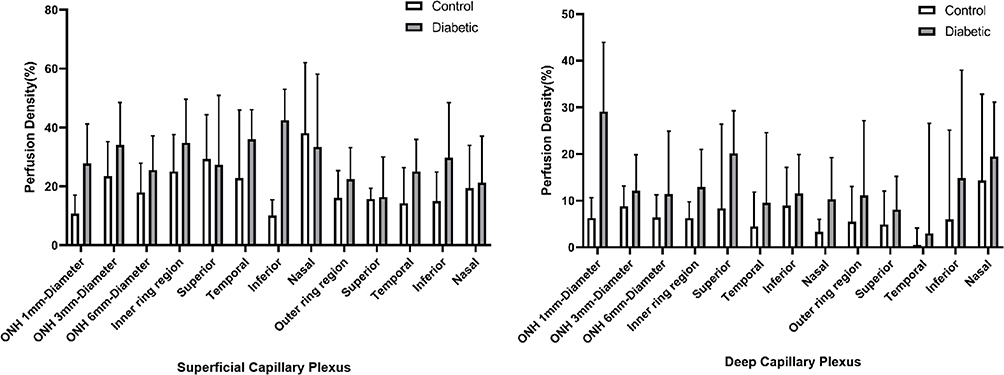 |
Figure 4 Distribution of the variation of perfusion density in diabetic and control groups. |
Discussion
The objective of this investigation was to scrutinize the early microvascular and hemodynamic variations in diabetic rodents, with or without initial diabetic retinopathy, by assessing alterations in retinal and choroidal blood flow under acute high IOP conditions. The outcomes of this inquiry revealed that fundus blood flow images acquired through SS-OCT/OCTA proficiently gauged the vascular density and perfusion density of the rat fundus. Upon contrasting the control and diabetic cohorts, discernible disparities emerged, with diabetic rats manifesting more substantial shifts in both retinal and choroidal microvasculature compared to their control counterparts during episodes of acute IOP elevation. This alteration manifested across the superficial, deep, and choroidal strata of the retina. However, the modifications in retinal blood flow appeared to be more marked and consequential when juxtaposed with the choroidal changes.
The SS-OCT/OCTA system employs an innovative overlay technique that enhances the identification of blood flow patterns across different layers of the posterior segment. By utilizing a semi-automated segmentation program, we precisely delineate the anterior boundaries of both the retina and choroid. In Figure 1, we showcase blood perfusion maps for both retinal and choroidal layers, utilizing a comprehensive color scheme to depict vessel locations in three-dimensional space. This approach allows for a more nuanced understanding of blood vessel networks within the superficial and deeper layers of the retina and choroid. Nonetheless, it’s crucial to acknowledge the presence of projection tail artifacts stemming from blood perfusion in these layers, which may obscure genuine arteries and veins within the outer choroidal layer. This highlights the necessity for further refinement in future investigations to enhance the accuracy of interpretation.
The retinal PA in the 6mm zone showed a statistically significant decrease in the diabetic group compared to controls after IOP elevation. Consistent with previously reported results, a hyperglycemic state may trigger impairment of the autoregulatory function of retinal blood flow. Thereby, greater intraocular perfusion fluctuations occur during stressful states such as elevated intraocular pressure.21–23 The diminished retinal PA in diabetic rats, especially in the central region of the optic disc, underscores the vulnerability of the diabetic microvasculature to elevated IOP. Choroidal PA also exhibited significant changes in the diabetic group following IOP elevation, with a greater magnitude of change compared to the control group. These results align with studies reporting compromised choroidal circulation in diabetic individuals under stress conditions, emphasizing the potential susceptibility of the choroidal vasculature to elevated IOP.24,25 The changes in blood flow in both the choroid and retina in the acute high IOP state were more pronounced in the diabetic group. This may indicate that the homeostatic regulatory function of both retinal and choroidal vasculature is impaired to some extent in the hyperglycemic state. Hyperglycemia triggers a series of events, such as the production of advanced glycation end products and nonenzymatic glycated proteins, that lead to vascular endothelial dysfunction. These events alter the structure and function of the extracellular matrix, basement membrane, and vessel wall, resulting in focal or generalized stiffness, stenosis, and arteriovenous stenosis of retinal vessels.26,27 Therefore, decreases in both PD and PA suggest early modifications of the microvascular network at the level of the SCP. These reductions observed in end-vessel density and perfusion may be associated with hyperglycemia-induced vascular damage including the polyol pathway, advanced glycation end products accumulation, the protein kinase C pathway and the hexosamine pathway.28,29 The decrease in choroidal perfusion compared with the control group was not as significant as the retinal changes. This may be related to the lower susceptibility of the choroidal vascular bed to stress and its greater regulatory function.
The alterations in superficial and deep retinal vascular perfusion density further underscore the differential responses of retinal microvasculature in diabetic rats to increased IOP. Comparing our results with existing literature, the observed variations in PA and PD following IOP elevation are consistent with studies demonstrating the vulnerability of the diabetic retina to hemodynamic alterations induced by elevated IOP.30,31 The greater magnitude of changes in diabetic rats may be attributed to multiple factors. Firstly, diabetes is known to induce vascular dysfunction, leading to altered endothelial function and impaired autoregulation. The compromised ability of blood vessels to respond to changes in pressure could contribute to the exacerbated reduction in blood flow observed during acute IOP elevation. Secondly, the microvascular changes in the diabetic retina, such as capillary basement membrane thickening and pericyte loss, may further exacerbate the impairment in choroidal autoregulation.8,32,33 Autoregulation is an inherent ability of the vascular beds of tissues throughout the body to maintain tissue and organ homeostasis in response to fluctuations in perfusion pressure or changes in metabolic demand.34 These structural alterations can affect the vessel wall’s elasticity and responsiveness to pressure changes, leading to a more severe reduction in blood flow. The observed vessel occlusion in diabetic rats during acute IOP elevation raises concerns about the potential long-term consequences. Chronic ischemia resulting from repeated episodes of impaired blood flow regulation may contribute to the progression of diabetic retinopathy.
Zhi et al35 found a gradual decrease in the density of functional capillaries and a gradual decrease in the diameter of large vessels in normal rats during a gradual increase in IOP from 10 mmHg to 80 mmHg. At 100 mmHg, the vessels were almost completely occluded. This is consistent with the results of our study. Vascular perfusion of the choroid exhibits remarkable resilience to IOP elevation. During the early stages of IOP elevation, choroidal blood flow experiences minimal reduction or undergoes marginal alterations until the IOP reaches the threshold of its inherent self-regulatory mechanisms. In our investigation, notwithstanding the absence of gradient IOP measurements, we observed that choroidal blood flow exhibited less pronounced fluctuations compared to the retinal flow at equivalent IOP levels. While choroidal perfusion is usually thought to be affected solely by ocular perfusion pressure,36 other studies on both animals and humans have hinted a possible self-regulatory within the choroid.15,37 Our current data can also be construed as additional support for the concept of choroidal autoregulation.
Clinical studies and trials, such as the DCCT38 and UKPDS,39 have consistently shown that better glycemic control is associated with fewer microvascular complications, including those affecting the retina’s ability to regulate blood flow. Controlling blood glucose levels reduces the risk of hypoxia by improving blood flow and oxygen delivery to the retinal tissues,40 which is crucial under conditions of high IOP. Glycemic control reduces vascular resistance, enhancing the retina’s capacity to maintain proper perfusion under various pressure conditions.20 Tight glycemic control can improve autoregulatory responses, helping the retina manage blood flow more effectively even under increased IOP.19 Therefore, improving blood glucose control can enhance the retina’s capacity to regulate blood flow, especially under conditions of high intraocular pressure, by improving endothelial function, reducing vascular resistance, and enhancing autoregulatory mechanisms. These findings augment the mounting evidence suggesting that diabetic retinal and choroidal microvasculature exhibit distinct responses to heightened IOP, implying potential ramifications for the management of ocular complications in diabetic patients. In subsequent experiments, we can also measure changes in fundus vascular density and perfusion in treated diabetic rats at high IOP to further validate the effect of glycemic control.
It is essential to acknowledge certain constraints in our study, such as the utilization of an animal model and the absence of longitudinal data. The acute nature of IOP elevation in our experimental design may not entirely mirror the chronic and progressive alterations in intraocular dynamics associated with diabetic retinopathy. Future investigations incorporating a chronic model of IOP elevation or exploring the enduring effects of impaired choroidal autoregulation in diabetic rats would yield a more comprehensive comprehension of the underlying mechanisms. Moreover, intraocular perfusion pressure is not solely influenced by intraocular pressure but is intricately linked to systemic blood pressure. Supplementary measurements of intravascular pressure may enhance our understanding of the altered ocular hemodynamics in diabetic patients.
Conclusion
In conclusion, our study furnishes valuable insights into the impact of acute IOP elevation on retinal and choroidal microvasculature in diabetic rats. The observed impairment in choroidal vascular autoregulation implies an increased vulnerability to hemodynamic shifts in diabetic eyes. These findings underscore the significance of early detection and intervention strategies aimed at preserving vascular function in individuals with diabetes, potentially influencing the prevention and management of diabetic retinopathy. Subsequent research endeavors should delve into the molecular and cellular mechanisms underlying these vascular changes to identify novel therapeutic targets for sustaining retinal health in diabetes.
Funding
National Natural Science Foundation of China (82101146); The Beijing Nova Program (Z211100002121052); The Capital Health Research and Development of Special (2020-1-2052); Science & Technology Project of Beijing Municipal Science & Technology Commission (Z201100005520045, Z181100001818003); Young Crops Plan of Beijing Municipal Hospital Administration (QML20210202).
Disclosure
The authors report no conflicts of interest in this work.
References
1. Ogurtsova K, Da RFJ, Huang Y. et al. Idf diabetes atlas: global estimates for the prevalence of diabetes for 2015 and 2040. Diabet Res Clin Pract. 2017;128:40–50. doi:10.1016/j.diabres.2017.03.024
2. Flaxman SR, Bourne R, Resnikoff S, et al. Global causes of blindness and distance vision impairment 1990-2020: a systematic review and meta-analysis. Lancet Glob Health. 2017;5(12):e1221–e1234. doi:10.1016/S2214-109X(17)30393-5
3. Cheung N, Mitchell P, Wong TY. Diabetic retinopathy. Lancet. 2010;376(9735):124–136. doi:10.1016/S0140-6736(09)62124-3
4. Gardner TW, Antonetti DA, Barber AJ, Lanoue KF, Levison SW. Diabetic retinopathy: more than meets the eye. Surv Ophthalmol. 2002;47 Suppl 2:S253-S262. doi:10.1016/s0039-6257(02)00387-9.
5. Klein R, Klein BE, Moss SE, Davis MD, Demets DL. The Wisconsin epidemiologic study of diabetic retinopathy. Ii. Prevalence and risk of diabetic retinopathy when age at diagnosis is less than 30 years. Arch Ophthalmol. 1984;102(4):520–526. doi:10.1001/archopht.1984.01040030398010
6. Wong TY, Sabanayagam C. Strategies to tackle the global burden of diabetic retinopathy: from epidemiology to artificial intelligence. Ophthalmologica. 2020;243(1):9–20. doi:10.1159/000502387
7. Yang JY, Wang Q, Yan YN, et al. Microvascular retinal changes in pre-clinical diabetic retinopathy as detected by optical coherence tomographic angiography. Graefes Arch Clin Exp Ophthalmol. 2020;258(3):513–520. doi:10.1007/s00417-019-04590-.x
8. Antonetti DA, Barber AJ, Khin S, et al. Vascular permeability in experimental diabetes is associated with reduced endothelial occludin content: vascular endothelial growth factor decreases occludin in retinal endothelial cells. Penn state retina research group. Diabetes. 1998;47(12):1953–1959. doi:10.2337/diabetes.47.12.1953
9. Schmetterer L, Findl O, Fasching P, et al. Nitric oxide and ocular blood flow in patients with IDDM. Diabetes. 1997;46(4):653–658. doi:10.2337/diab.46.4.653
10. Shakib M, Cunha-Vaz JG. Studies on the permeability of the blood-retinal barrier. Iv. Junctional complexes of the retinal vessels and their role in the permeability of the blood-retinal barrier. Exp Eye Res. 1966;5(3):229–234. doi:10.1016/s0014-4835(66)80011-8
11. Nguyen TT, Kawasaki R, Kreis AJ, et al. Correlation of light-flicker-induced retinal vasodilation and retinal vascular caliber measurements in diabetes. Invest Ophthalmol Vis Sci. 2009;50(12):5609–5613. doi:10.1167/iovs.09-3442
12. Linsenmeier RA, Padnick-Silver L. Metabolic dependence of photoreceptors on the choroid in the normal and detached retina. Invest Ophthalmol Vis Sci. 2000;41(10):3117–3123.
13. Cao J, Mcleod S, Merges CA, Lutty GA. Choriocapillaris degeneration and related pathologic changes in human diabetic eyes. Arch Ophthalmol. 1998;116(5):589–597. doi:10.1001/archopht.116.5.589
14. Popa-Cherecheanu A, Schmidl D, Werkmeister RM, et al. Regulation of choroidal blood flow during isometric exercise at different levels of intraocular pressure. Invest Ophthalmol Vis Sci. 2019;60(1):176–182. doi:10.1167/iovs.18-24992
15. Johnson PC. Autoregulation of blood flow. Circ Res. 1986;59(5):483–495. doi:10.1161/01.res.59.5.483
16. Deeds MC, Anderson JM, Armstrong AS, et al. Single dose streptozotocin-induced diabetes: considerations for study design in islet transplantation models. Lab Anim. 2011;45(3):131–140. doi:10.1258/la.2010.010090
17. Early treatment diabetic retinopathy study design and baseline patient characteristics. Etdrs report number 7. Ophthalmology. 1991;98(5 Suppl):741–756. doi:10.1016/s0161-6420(13)38009-9
18. Suciu CI, Suciu VI, Nicoara SD. Optical coherence tomography (angiography) biomarkers in the assessment and monitoring of diabetic macular edema. J Diabetes Res. 2020;2020:6655021. doi:10.1155/2020/6655021
19. Das A, Mcguire PG. Retinal and choroidal angiogenesis: pathophysiology and strategies for inhibition. Prog Retin Eye Res. 2003;22(6):721–748. doi:10.1016/j.preteyeres.2003.08.001
20. Aiello LP, Avery RL, Arrigg PG, et al. Vascular endothelial growth factor in ocular fluid of patients with diabetic retinopathy and other retinal disorders. N Engl J Med. 1994;331(22):1480–1487. doi:10.1056/NEJM199412013312203
21. Wong VH, Vingrys AJ, Jobling AI, Bui BV. Susceptibility of streptozotocin-induced diabetic rat retinal function and ocular blood flow to acute intraocular pressure challenge. Invest Ophthalmol Vis Sci. 2013;54(3):2133–2141. doi:10.1167/iovs.13-11595
22. Wong VH, Armitage JA, He Z, et al. Chronic intraocular pressure elevation impairs autoregulatory capacity in streptozotocin-induced diabetic rat retina. Ophthalmic Physiol Opt. 2015;35(2):125–134. doi:10.1111/opo.12174
23. Tani T, Nagaoka T, Nakabayashi S, Yoshioka T, Yoshida A. Autoregulation of retinal blood flow in response to decreased ocular perfusion pressure in cats: comparison of the effects of increased intraocular pressure and systemic hypotension. Invest Ophthalmol Vis Sci. 2014;55(1):360–367. doi:10.1167/iovs.13-12591
24. Dai Y, Zhou H, Chu Z, et al. Microvascular changes in the choriocapillaris of diabetic patients without retinopathy investigated by swept-source oct angiography. Invest Ophthalmol Vis Sci. 2020;61(3):50. doi:10.1167/iovs.61.3.50
25. Xu J, Li Y, Song S, et al. Evaluating changes of blood flow in retina, choroid, and outer choroid in rats in response to elevated intraocular pressure by 1300 nm swept-source oct. Microvasc Res. 2019;121:37–45. doi:10.1016/j.mvr.2018.09.003
26. Wang W, Lo A. Diabetic retinopathy: pathophysiology and treatments. Int J mol Sci. 2018;19(6). doi:10.3390/ijms19061816
27. Dhananjayan R, Koundinya KS, Malati T, Kutala VK. Endothelial dysfunction in type 2 diabetes mellitus. Indian J Clin Biochem. 2016;31(4):372–379. doi:10.1007/s12291-015-0516-y
28. Brownlee M. The pathobiology of diabetic complications: a unifying mechanism. Diabetes. 2005;54(6):1615–1625. doi:10.2337/diabetes.54.6.1615
29. Shi Y, Vanhoutte PM. Macro- and microvascular endothelial dysfunction in diabetes. J Diabetes. 2017;9(5):434–449. doi:10.1111/1753-0407.12521
30. Kohzaki K, Vingrys AJ, Armitage JA, Bui BV. Electroretinography in streptozotocin diabetic rats following acute intraocular pressure elevation. Graefes Arch Clin Exp Ophthalmol. 2013;251(2):529–535. doi:10.1007/s00417-012-2212-4
31. Kohzaki K, Vingrys AJ, Bui BV. Early inner retinal dysfunction in streptozotocin-induced diabetic rats. Invest Ophthalmol Vis Sci. 2008;49(8):3595–3604. doi:10.1167/iovs.08-1679
32. Curtis TM, Gardiner TA, Stitt AW. Microvascular lesions of diabetic retinopathy: clues towards understanding pathogenesis? Eye. 2009;23(7):1496–1508. doi:10.1038/eye.2009.108
33. Forrester JV, Kuffova L, Delibegovic M. The role of inflammation in diabetic retinopathy. Front Immunol. 2020;11:583687. doi:10.3389/fimmu.2020.583687
34. Sinclair SH, Grunwald JE, Riva CE, et al. Retinal vascular autoregulation in diabetes mellitus. Ophthalmology. 1982;89(7):748–750. doi:10.1016/s0161-6420(82)34720-x
35. Zhi Z, Cepurna WO, Johnson EC, Morrison JC, Wang RK. Impact of intraocular pressure on changes of blood flow in the retina, choroid, and optic nerve head in rats investigated by optical microangiography. Biomed Opt Express. 2012;3(9):2220–2233. doi:10.1364/BOE.3.002220
36. Alm A, Bill A. The oxygen supply to the retina. Ii. Effects of high intraocular pressure and of increased arterial carbon dioxide tension on uveal and retinal blood flow in cats. A study with radioactively labelled microspheres including flow determinations in brain and some other tissues. Acta Physiol Scand. 1972;84(3):306–319. doi:10.1111/j.1748-1716.1972.tb05182.x
37. Polska E, Simader C, Weigert G, et al. Regulation of choroidal blood flow during combined changes in intraocular pressure and arterial blood pressure. Invest Ophthalmol Vis Sci. 2007;48(8):3768–3774. doi:10.1167/iovs.07-0307
38. Lachin JM, Genuth S, Cleary P, Davis MD, Nathan DM. Retinopathy and nephropathy in patients with type 1 diabetes four years after a trial of intensive therapy. N Engl J Med. 2000;342(6):381–389. doi:10.1056/NEJM200002103420603
39. UK prospective diabetes study (UKPDS) group.Intensive blood-glucose control with sulphonylureas or insulin compared with conventional treatment and risk of complications in patients with type 2 diabetes (UKPDS 33). Lancet. 1998;352(9131):837–853. doi:10.1016/S0140-6736(98)07019-6
40. Stitt AW, Curtis TM, Chen M, et al. The progress in understanding and treatment of diabetic retinopathy. Prog Retin Eye Res. 2016;51:156–186. doi:10.1016/j.preteyeres.2015.08.001
 © 2025 The Author(s). This work is published and licensed by Dove Medical Press Limited. The
full terms of this license are available at https://www.dovepress.com/terms
and incorporate the Creative Commons Attribution
- Non Commercial (unported, 3.0) License.
By accessing the work you hereby accept the Terms. Non-commercial uses of the work are permitted
without any further permission from Dove Medical Press Limited, provided the work is properly
attributed. For permission for commercial use of this work, please see paragraphs 4.2 and 5 of our Terms.
© 2025 The Author(s). This work is published and licensed by Dove Medical Press Limited. The
full terms of this license are available at https://www.dovepress.com/terms
and incorporate the Creative Commons Attribution
- Non Commercial (unported, 3.0) License.
By accessing the work you hereby accept the Terms. Non-commercial uses of the work are permitted
without any further permission from Dove Medical Press Limited, provided the work is properly
attributed. For permission for commercial use of this work, please see paragraphs 4.2 and 5 of our Terms.