Back to Journals » Vascular Health and Risk Management » Volume 20
Evaluation of the Correlation Between Distribution Location and Vulnerability of Carotid Plaque in Patients with Transient Ischemic Attack
Authors Zhao Y, Gu Y ![]() , Liu Y, Guo Z
, Liu Y, Guo Z
Received 31 October 2023
Accepted for publication 25 February 2024
Published 4 March 2024 Volume 2024:20 Pages 77—87
DOI https://doi.org/10.2147/VHRM.S447418
Checked for plagiarism Yes
Review by Single anonymous peer review
Peer reviewer comments 3
Editor who approved publication: Prof. Dr. Pietro Scicchitano
Yinan Zhao,1 Yan Gu,2 Ying Liu,3 Zhongping Guo4
1Department of Radiology, The Affiliated Jinzhou Medical University, Jinzhou, People’s Republic of China; 2Department of Radiology, The Affiliated First People’s Hospital of Lianyungang, Lianyungang, People’s Republic of China; 3Department of Radiology, The Affiliated Lianyungang Hospital of Xuzhou Medical University, Lianyungang, People’s Republic of China; 4Department of Radiology, The Affiliated Lianyungang Clinical College of Nanjing Medical University, Lianyungang, People’s Republic of China
Correspondence: Yan Gu, Department of Radiology, Lianyungang First People’s Hospital, 1st Floor, Building 2, Gaoxin District, No. 6 East Zhenhua Road, Haizhou District, Lianyungang, Jiangsu Province, People’s Republic of China, Tel +86 18961327326, Email [email protected]
Purpose: To analyze the relationship among distribution location, characteristics, and vulnerability of carotid plaque using CTA and provide more information on the risk factors of carotid atherosclerotic plaque.
Patients and Methods: We retrospectively analyzed the CTA images of the head and neck of 93 patients with carotid atherosclerosis. Atherosclerosis was developed in 148 carotid arteries. The plaques were divided into a high-risk plaque group and a low-risk plaque group according to whether the plaques had high-risk characteristics. The maximum cross-sectional area of carotid artery bifurcation plaque on the axial image was selected, and the cross-sectional lumen was equally divided into four 90-degree sectors, ventral side wall, dorsal side wall, inner side wall, and outer side wall. The differences in the characteristics and distribution locations of the plaques in the two groups were analyzed. The characteristic parameters of the cross-sectional plaques at the bifurcation of the carotid artery. The logistic regression analysis was used to further analyze the risk factors associated with plaque vulnerability.
Results: Among 148 carotid arteries,80 were classified as high-risk and 68 as low-risk groups. There were significant differences between the two groups concerning the thickness, length, maximum cross-sectional area, burden, and cross-sectional distribution of the plaques (P < 0.05). The plaque distribution on the dorsal side wall of the carotid bifurcation was higher in the high-risk group than that in the low-risk group (P < 0.05), dorsal side wall plaque-independent risk factors for the development of vulnerability of plaques in transient ischemic attack (TIA) patients (95% CI:1.522~6.991, P< 0.05).
Conclusion: High-risk plaques tend to occur on the dorsal side wall of the carotid bifurcation, whereas low-risk plaques tend to occur on the outer side wall of the carotid bifurcation.
Keywords: carotid artery, plaque morphology, plaque vulnerability, atherosclerosis, plaque distribution
Introduction
In recent years, the incidence of stroke has shown an increasing trend; Atherosclerosis is one of the most important causes of ischaemic stroke worldwide.1 Moreover, up to 30% of ischemic stroke are associated with the rupture of vulnerable carotid plaque in atherosclerosis.2
More and more studies3 have shown that ischemic stroke secondary to carotid artery disease is due to not only stenosis of the lumen but also distal vascular embolism caused by the rupture of plaque fibrous cap. In previous studies, imaging features have been compared with pathological histological features.4 Calcified plaques were considered as stable plaques. Intraplaque haemorrhage (IPH), lipid-rich necrotic core (LRNC), fibrous components and surface ulcer were considered as high-risk features of plaques.5 At present, the characteristics of plaque can be observed through magnetic resonance imaging (MRI) high-resolution vascular wall imaging, and it has a high sensitivity to IPH and LRNC.6 However, MRI image acquisition takes a longer time and requires professional coils, which limits its wide application. In contrast, computerized tomography angiography (CTA) is widely used because it can be quickly operated and perform multi-plane reconstruction.7,8 Saba et al conducted a retrospective study to measure the average CT values of several high-risk plaques and found that the density of IPH was lower than that of LRNC.9 Therefore, low-density plaques are more likely to occur IPH and LRNC. Besides, Eisenmenger et al also found that “napkin ring sign” presents high predictability of carotid plaque bleeding.10,11 Carotid artery plaque vulnerability is also associated with plaque thickness; every 1 mm increase in calcified plaque thickness will reduce the chance of ipsilateral stroke or transient ischemic attack.12 However, increasing the thickness of the soft plaque will increase the vulnerability of the plaque.5
The formation of carotid plaque is associated with carotid geometry and hemodynamics; carotid atherosclerotic plaque often occurs at the bifurcation of arteries.12 Previous studies have only analyzed the longitudinal section of carotid artery plaque, that is, the carotid bifurcation; however, there has been no research to confirm whether the risk of cross-sectional carotid artery plaque is associated with the distribution location. Therefore, exploring the prone position of high-risk plaque is of great significance for perfecting the risk classification of carotid artery plaque. The present study aims to analyze the relationship among distribution location, characteristics, and vulnerability of carotid plaque, providing a reference for finding out responsible plaque for patients with TIA.
Materials and Methods
Study Design and Participants Enrollment
This study is in accordance with the Declaration of Helsinki. The Ethics Committee of Lianyungang First People’s Hospital approval was obtained (KY-20210416001-01), and informed consent was waived because of the retrospective nature of the study. We conducted a retrospective analysis on patients who underwent continuous head and neck CTA examinations at our hospital from October 2020 to October 2021. All patients underwent head and neck CTA, and their clinical and imaging data were complete, and signed an informed consent prior to a head and neck CTA examination.
The inclusion criteria were as follows: (1) Patients who have undergone head and neck CTA and have atherosclerotic plaques at the unilateral or bilateral carotid bifurcation; (2) Patients who presented TIA symptoms (transient neurological deficit caused by local cerebral or retinal ischemia, and clinical symptoms generally lasting for <1 h and no more than 24 h) within 3 days before visiting a doctor; (3) The clinical data involved in the research were complete (the recorded data can show in detail whether it meets the typical symptoms of TIA); (4) The image quality evaluation reached an excellent level (the image is clear without artefacts).
The exclusion criteria were as follows: (1) Patients with head and neck aneurysms or carotid artery dissection; (2) Patients with severe liver and kidney diseases; (3) Patients with blood diseases; (4) Patients with severe infection; (5) Patients with a history of malignant tumours; (6) Patients who underwent acute thrombolysis, endovascular intervention, carotid endarterectomy, or previous intracranial stent implantation before undergoing CTA examination.
Equipment and Reagents
Siemens Somatom Definition Flash dual-source CT scanner was used. The scanning parameters were set as follows: current of 125 mA, voltage of 100 kV, collimation of 16×0.6 mm, and layer thickness of 0.75mm. An intravenous indwelling catheter, a double-rod release syringe, and an iodixanol contrast agent (320 mg I/mL, Jiangsu Hengrui Pharmaceutical Co., Ltd., China) were also used. The contrast agent was enhanced by puncturing an 18-G trocar from the anterior elbow vein, and the nonionic iodinated contrast agent iodixanol (320 mg/mL) was injected at a flow rate of 3–5 mL/s (the total injection amount and flow rate of contrast agent were individually quantified based on the patient’s body weight and scanning range). After the contrast agent injection was completed, 30 mL of saline was then injected at the same flow rate.
Assessment of Carotid CTA
All patients who underwent carotid CTA had no history of heart failure or contraindication of iodine contrast agents. The patient was in the supine position, and the CT scanning ranged from the aortic arch to the carotid siphon. The scanning was conducted from the patient’s feet to the head. The images were examined before and after the injection of the contrast agent. The scanning range was from the lower edge of the aortic arch to the top of the skull, with a scanning time of 8–12 s. The contrast agent tracing method was used; the aortic arch or carotid artery level was selected as the region of interest to monitor the CT value. When the CT value exceeded 100 HU, the scanning was automatically triggered after delaying for 4 s. When the threshold was reached, the patient was instructed to hold his breath after a 4 s interval and the scanning was restarted. All imaging examinations of patients were performed by experienced radiologists. The patient was instructed not to swallow or move his head or body during scanning to obtain the required blood vessel images from the collected data through three-dimensional reconstruction technology.
Image Analysis and Index Measurement and Definition
Image analysis: The GPACS system was used to analyze the segment with a plaque at the carotid bifurcation, and the uniform window width and level were used for measurement (window width = 800 and window level = 300).
Carotid Plaque Measurement and Plaque Analysis
Every image was read by two radiologists who have been engaged in head and neck imaging diagnosis for >5 years. The two radiologists were unaware of the clinical data of the patients, and when there was disagreement on the results, the final decision was made after their discussion.
Plaque at the common carotid artery bifurcation was selected, and the maximum cross-sectional area of the plaque was chosen as the plaque measurement point from the proximal segment to the distal segment in the axial image. The GPACS system tool was used to outline the plaque characteristics. The boundary line of the carotid plaque, that is, the region of interest, was drawn. The plaque area (PA), blood vessel area (VA), reference lumen area (RLA), plaque thickness, and plaque length (the number of plaque layers from appearance to disappearance × scanning layer thickness of 0.75) were recorded, and the plaque burden (PB = PA/VA × 100%), remodelling index (RI = VA/RLA), and rate of stenosis were calculated, respectively. The reference VA is the mean value of the sum of the proximal and distal lumen areas with no plaque.
The stenosis degree was assessed according to the standard of the North American Symptomatic Carotid Artery Endometriectomy Test (NASCET): stenosis degree = (distal ICA diameter − inner diameter of ICA at the narrowest point/distal ICA diameter) × 100% (lumen stenosis rate of 0–49% indicated mild stenosis, 50–69% indicated moderate stenosis, 70–99% indicated severe stenosis, and 100% indicated total occlusions).
Measurement of CT value of plaque: The maximum cross-sectional area of plaque at the carotid bifurcation on the axial image was selected, and the edge of non-calcified plaque was drawn as the ROI. The inclusion of calcified and adipose tissue should be avoided, and the mean value of CT value within the range drawn by ROI was calculated.
Plaque Distribution and Plaque Risk Determination
The maximum cross-sectional area of plaque at the carotid bifurcation on the axial image was selected, and the cross-sectional lumen was equally divided into four 90-degree sectors, ventral side wall, dorsal side wall, inner side wall, and outer side wall. If the plaque crosses two areas, the area where the thickest plaque is located shall prevail (Figure 1).
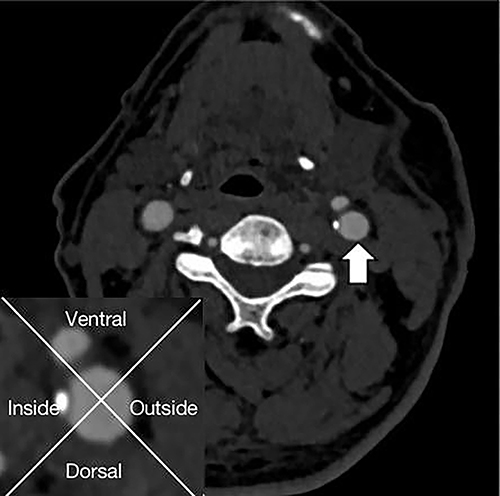 |
Figure 1 Shows how each cross-section can be divided into four quadrants. |
According to the research results by Oliver et al, the morphological characteristics of plaque of the carotid artery on CTA were compared with those of histological specimens after carotid endarterectomy,13 and the plaques were divided into high-risk plaque and low-risk plaque.
High-risk plaque (those that met one of the following five conditions): (1) Soft plaque: Low attenuation plaque, with an average CT value of approximately 60HU, indicating that it mainly includes IPH, LRNC, and fibrous components;14(2) Plaque ulcer (Figure 2a): The contrast agent extends to at least 1 mm outside the blood vessel at the plaque;14,15(3) Napkin ring sign (Figure 2b): Annular calcification of the adventitia of the internal carotid artery has a thickness of <2 mm, and soft plaques can be seen nearby, with a thickness of ≥2 mm;10,11(4) Point calcification (Figure 2c):10 It is defined as the calcified part of plaque, with a diameter of <3 mm.
 |
Figure 2 (a) Plaque ulcers; (b) Napkin ring sign; (c) Point calcification. |
Low-risk plaque: (1) Calcified plaque: CT value of plaque > 130 HU;16(2) In mixed plaques, the average CT value of non-calcified plaques is ≥60 HU, without any of the abovementioned characteristics of high-risk plaque.
High-risk and low-risk plaques were judged by two radiologists who have been engaged in head and neck imaging diagnosis for >5 years. The controversial plaque was decided by them after consultation.
Statistical Analysis
SPSS version 26.0 was used for data analysis. The continuous variables are presented as mean±standard deviation (SD) and categorical variables are expressed as percentage. Normally distributed data were described by mean ± standard deviation, whereas non-normally distributed data were described by median (interquartile spacing). The clinical characteristics, plaque characteristics and plaque distribution were compared between two groups using independent t-test or X2-test, Logistic regression analysis with generalized estimating equation correction was used to calculate the odds ratio (OR) and corresponding 95% confidence interval (CI) of the risk factors related to plaque vulnerability, with P < 0.05 indicating the statistically significant difference.
Results
Baseline Data on Patients with Carotid Plaque
In this study, 2296 patients underwent head and neck CTA examination, including 754 cases with atherosclerotic plaques at the bifurcation of unilateral or bilateral common carotid arteries. From them, 272 patients with an incomplete medical history and no typical TIA symptoms, 157 patients with head and neck aneurysms, three patients with carotid artery dissection, six patients with vertebral artery dissection, 76 patients with internal carotid artery occlusion, 58 patients with intracranial middle cerebral artery occlusion, 51 patients with a malignant tumour and another medical history, and 38 patients with poor image quality and artefacts were excluded. Finally, 93 patients were included in the study, with an average age of 68.5 (range: 49–91) years, including 91 (61.5%) males, 32 (21.6%) had coronary heart disease, 82 (55.4%) had history of smoking, and 38 (25.7%) used statins. Table 1 shows the clinical characteristics of the population. There was statistical difference in the statin use between the two groups (P < 0.05).
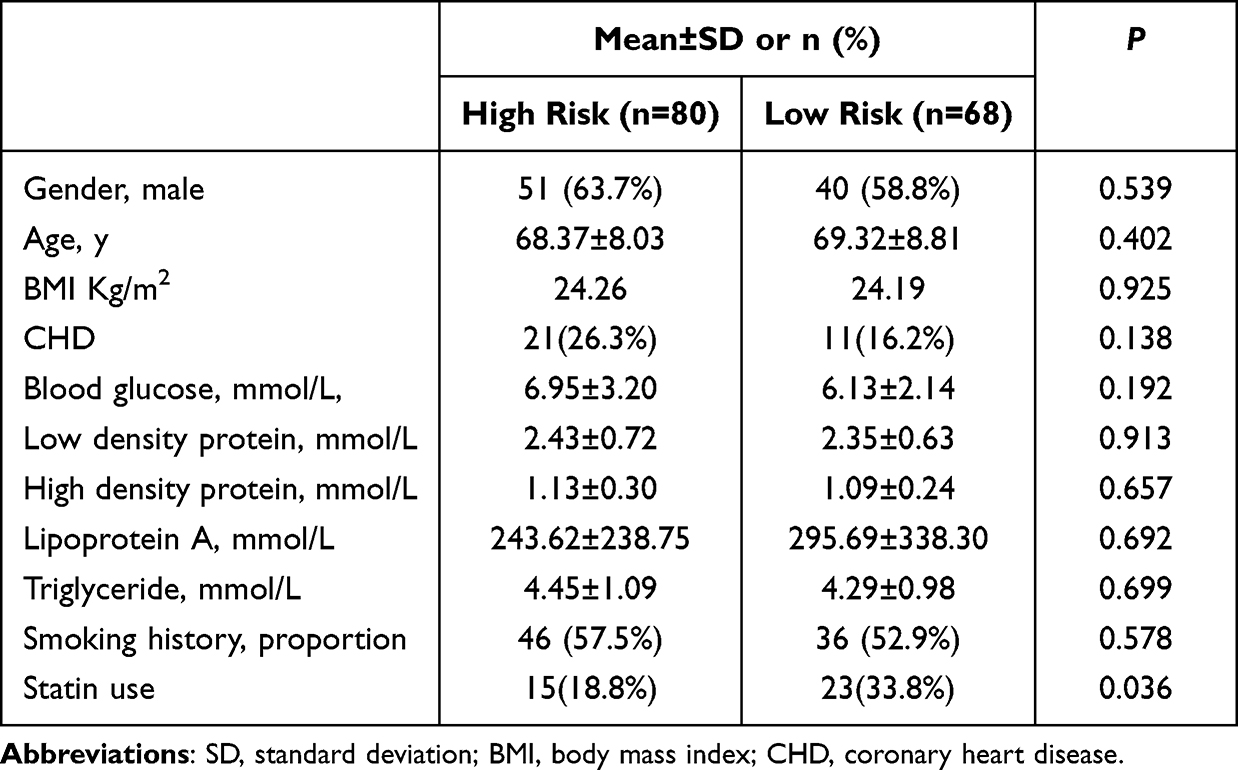 |
Table 1 Comparison of Patients’ Clinical Characteristics Between Two Groups of High and Low-Risk Plaques |
Among the 93 patients, 38 (25.7%) patients had plaques on one side of the common carotid artery bifurcation and 55 (37.2%) patients had plaques on both sides of the carotid bifurcation. Among them, 14(9.5%) of the patients had ipsilateral limb weakness. In total, 148 cross-sectional images of carotid plaques were obtained (Figure 3). The two doctors in the diagnosis group did not disagree with the image evaluation of all patients.
 |
Figure 3 Case screening flow chart. |
According to the plaque characteristics, there were 56 (37.8%) mixed plaques in line with the criteria of IPH, IRNC, and fibrous components, 9 plaques accompanied by ulcers, and 18 (12.2%) carotid arteries with point calcification. The carotid artery plaques were divided into a high-risk plaque group (80 plaques) and a low-risk plaque group (68 plaques) according to whether the plaques had the characteristics of high-risk plaque. According to the cross-sectional distribution of the plagues at the carotid bifurcation, the plaques were divided into four subgroups, including ventral, dorsal, inner, and outer side groups.
Analysis of Plaque Characteristics and Distribution Location of High-Risk and Low-Risk Plaque Groups
There were significant differences in the distribution location, thickness, length, maximum cross-sectional area, burden, and stenosis rate of plaques between the high-risk and low-risk groups (P < 0.05). Among them, statistical differences were observed in the distribution of plaques on the outer and dorsal side walls between the two groups (P < 0.05). The high-risk plaques were mostly observed on the dorsal side wall, whereas the low-risk plaques were mostly observed on the outer side wall. There was no statistical difference in the RI of plaque between the two groups (P > 0.05), as shown in Table 2.
 |
Table 2 Differences in the Distribution Location and Characteristics Between Two Groups of High and Low-Risk Plaques (n, %) |
Analysis of the Correlation Factors Between Plaque Distribution and Vulnerability
Among the high-risk and low-risk plaques, the thickness, length, and maximum cross-sectional area of the plaques distributed on the dorsal side wall of the common carotid artery bifurcation in the high-risk group were greater than those in the low-risk group, with significant differences between the two groups (P < 0.05). There was no significant statistical difference in the remodelling mode and stenosis rate of carotid plaques between the two groups (P > 0.05) (Table 3).
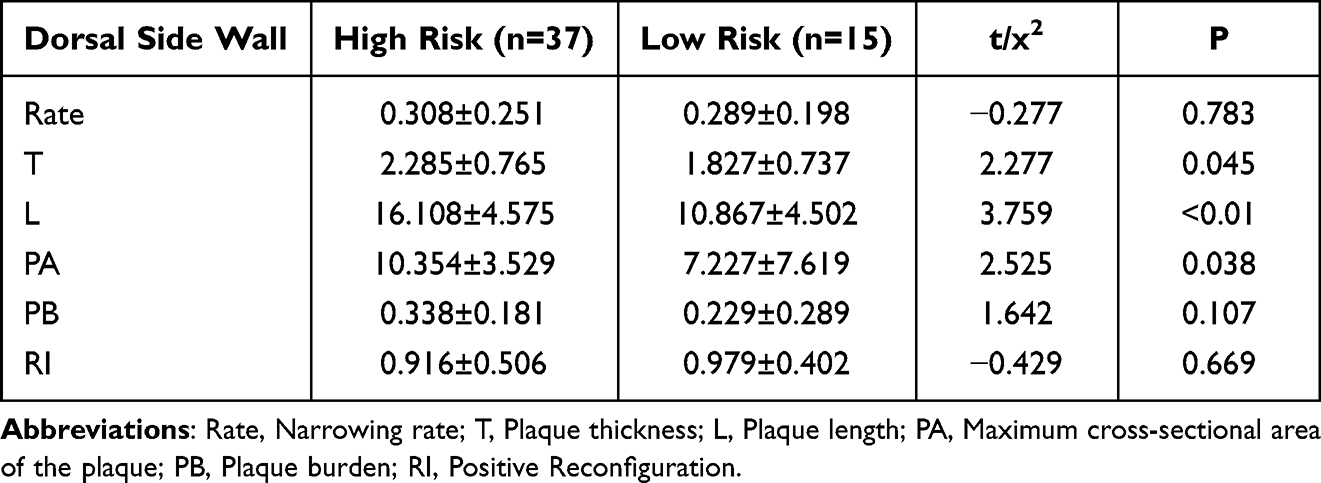 |
Table 3 Diagnostic Value of CTA Examination-Related Indicators for Vulnerability of Dorsal Side Wall Plaques |
In the high-risk plaque group, the average CT values of soft plaques distributed on the inner, outer, dorsal, and ventral side groups were 27.2 ± 25.74 HU, 46.6 ± 19.73 HU, 31.3 ± 23.66 HU, and 34.1 ± 24.84 HU, respectively. There was no significant statistical difference in the average CT values of soft plaques among the four groups (P > 0.05) (Figure 4).
 |
Figure 4 Shows the average CT values of plaques with different distribution locations in the high-risk plaque group, Error bars represent the mean with SEM (standard error of mean) of the four data sets. There was no statistical significance was analyzed using two-way ANOVA, (P>0.05). |
Multivariate Analysis of the Correlation of Plaque Characteristics and Distribution Location with Vulnerability
Multifactor logistic regression analyses showed that Dorsal side wall plaque-independent risk factors for the development of vulnerability of plaques in TIA patients (95% CI:1.522~6.991, P < 0.05)(Table 4).
 |
Table 4 Logistic Regression Analysis of the Correlation of Distribution Location, T, L, PA with Vulnerability of Plaques |
Discussion
This study assessed the relationship between the vulnerability and distribution of 148 carotid plaques in patients with TIA based on CTA. Our study found that high-risk plaques mostly occurred on the dorsal side wall of the carotid bifurcation, which had a larger thickness, length, and cross-sectional area, whereas the low-risk plaques mostly occurred on the outer side wall of the carotid bifurcation. The above findings were of great importance, suggesting that the vulnerability of carotid plaques is closely associated with the plaque distribution location.
In the present study, we found that compared with low-risk plaques, those high-risk plaques were significantly less likely to use statins. In previous studies, Derksen et al17 have shown that statin use is independently associated with carotid IPH. The use of statins can reduce the formation of new blood vessels within plaques. Reduced inflammation and angiogenesis may play a key role in the reduction of carotid plaque IPH, this will reduce the vulnerability of the plaque.18
High-risk plaque rupture often leads to ipsilateral ischemic stroke. If the condition is not diagnosed and treated in time before plaque rupture, the long-term prognosis of patients would often be poor. CTA can clearly show the high-risk characteristics of plaque. The most common characteristic of high-risk plaque is fibrous lipid plaque, which is mostly composed of IPH, LRNC, and fibrous components, and they are closely associated with plaque vulnerability and increased risk of stroke.
At present, little research has been conducted on the distribution location of plaques at the carotid bifurcation on the cross-section level. According to the images on the axis, Jiang et al have studied the distribution of intracranial atherosclerotic plaques. Their study results showed that the plaques were prone to occur in the ventral and superior lateral walls of intracranial atherosclerotic arteries, which was associated with the fact that intracranial atherosclerotic plaques were often located on the opposite side of the opening of the perforating artery.19 However, there is no perforating artery formed in the carotid artery, and the carotid canal lumen is thick with a thick wall. Therefore, the distribution law of intracranial atherosclerosis does not apply to that of the carotid artery. As a result, it is necessary to conduct a more in-depth study on the hemodynamic and geometric characteristics of the carotid artery on the cross-section level.
In this study, analysis was performed focusing on the plaque characteristics at the carotid bifurcation. This is mainly because carotid artery plaques often occur near the bifurcation, which is correlated with the unique anatomical characteristics and hemodynamics of the carotid bifurcation. A previous study20 found that blood will generate pressure on the blood vessel wall during the process of blood flow, including wall pressure (WP: perpendicular to blood vessel wall) and wall shear stress (WSS: parallel to blood vessel wall). Endothelial cells would respond to the combination of low WP and WSS, thus promoting the formation of arteriosclerosis. There is a close correlation between local low WP plaque and wall thickness, and it is easier to form atherosclerosis at low WP, particularly lipid plaque. Our study demonstrated that the thickness of high-risk plaques distributed on the dorsal and outside side wall were higher than that of low-risk plaques, thus suggesting that lower WP surrounding these plaques. Moreover, high WSS has been proven to induce specific changes in endothelial cell behaviour, aggravate inflammation, and stimulate the progress of atherosclerosis and lipid core.21 The relationship between the distribution location of high-risk plaques on cross-section and WSS needs to be further studied. In the future, the high WSS of high-risk plaques in different distribution locations can be verified by computational fluid dynamics simulation. In addition, Sitzer et al explored the relationship between the original angle of the internal carotid artery (that is, the rotation angle of the internal carotid artery from the common carotid artery) and early atherosclerosis using high-resolution ultrasound on cross-section and found that the internal carotid artery originated from the dorsomedial side was positively correlated with the increase of intima-media thickness and plaque formation in the bulbous of the internal carotid artery.22 This also suggested that the formation of high-risk plaque on the dorsal side is associated with the original angle of the internal carotid artery, and it is necessary to expand the sample size to investigate their correlation.
Conversely, the geometric factors of lumen flare and proximal curvature at carotid bifurcation have been previously proven to be significant predictors of blood flow disorder at the carotid bifurcation.23 Lee et al found that vulnerable plaques tended to appear near the shunt and at the distal end of stable plaques, and the flow disorder (low WSS or oscillating shear stress) at the carotid bifurcation could be predicted by lumen flare and centerline bending.24 High-risk plaques are more prone to form in carotid arteries with a small curvature; moreover, there is a significant negative correlation between vascular curvature and blood flow disorder.25 The dorsal side wall at the common carotid artery bifurcation may have a smaller curvature, so it is easier to form turbulence, which leads to vasoconstriction, platelet aggregation, and inflammation, thus causing the rupture of high-risk plaques.26 Follow-up studies should enhance the analysis of the geometric characteristics of the carotid artery and measure the degree of lumen flare and curvature of the carotid artery at different distribution locations to provide the basis for further confirming the results of this study. On the contrary, calcified plaques are more prone to occur on the outer side wall, probably due to the larger curvature of the outer side wall, the smaller degree of blood flow disorder, and the difficulty in forming turbulence. The appearance of calcified plaques on CTA is negatively associated with ipsilateral cerebrovascular ischemic disease, and the development probability of ipsilateral stroke or transient cerebral ischemia will decrease with each increase of 1 mm of calcified plaques.27
Analysis was also performed on the length, stenosis degree, maximum cross-sectional area, and plaque burden of plaques of the two groups, and the results showed that the above plaque characteristics were more significant in the high-risk plaque group. These plaque features were positively correlated with plaque vulnerability.28 The thickness, length, and maximum cross-sectional area of plaques distributed on the dorsal side were significantly correlated with plaque vulnerability (P < 0.05), indicating that only evaluating the degree of carotid stenosis will underestimate the risk of lesions.29 Statistical significance was only observed in the maximum cross-sectional area and plaque burden. Our study also found that there was no obvious difference in the CT values of high-risk plaques at different distribution locations, which may be due to the overlapping CT values of components constituting plaques or insufficient sample size. Furthermore, the data showed that the average CT values of high-risk plaques on the outer side were the highest among the four groups. Most are calcified plaques, statistical significance was found in the maximum cross-sectional area and plaque burden, the cross-sectional area of calcified plaque was negatively correlated with plaque vulnerability, suggesting that the plaques on the outer side have good stability.
There are a few limitations to this study: (1) To ensure the uniform distribution of ROI, we selected the location of plaque on the largest carotid bifurcation (that is, the location with the most severe carotid stenosis) to establish each ROI. However, on CTA, the periarterial adipose tissue will sometimes inevitably be included in the ROI, and considering that the calcification plaque will have hardening artefacts, we would not necessarily obtain a very accurate CT value. (2) In this study, hemodynamics and geometric characteristics around high-risk plaques were not measured.
Conclusion
Our study found that in patients with TIA, high-risk plaques tend to be distributed on the dorsal side wall of the carotid bifurcation, and the larger the cross-sectional area of the plagues at the carotid bifurcation and the greater the plaque burden, the more the plagues tend to be unstable These findings can help clinicians to judge the responsible lesions of patients with TIA and treat them as soon as possible to improve the prognosis of patients. However, the relationship between the plaque distribution location on the cross-section and stroke is still unclear, and the underlying mechanism needs to be further explored in the future through computational fluid dynamics simulation or hemodynamic measurement of 4D flow MRI.
Acknowledgments
We appreciate very much all the participants and their families.
Funding
This study received funding from the General Program of China Postdoctoral Science Foundation (2020M681534).
Disclosure
The authors report no conflicts of interest in this work.
References
1. Lineback CM, Stamm B, Sorond F, Caprio FZ. Carotid disease, cognition, and aging: time to redefine asymptomatic disease? GeroScience. 2023;45(2):719–725. doi:10.1007/s11357-022-00688-z
2. Vergallo R, Crea F. Atherosclerotic Plaque Healing. New Engl J Med. 2020;383(9):846–857. doi:10.1056/NEJMra2000317
3. Zhang L, Li X, Lyu Q, Shi G. Imaging diagnosis and research progress of carotid plaque vulnerability. J Clin Ultrasound. 2022;50(7):905–912. doi:10.1002/jcu.23266
4. Bos D, Arshi B, van den Bouwhuijsen QJA. Atherosclerotic carotid plaque composition and incident stroke and coronary events. J Am Coll Cardiol. 2021;77(11):1426–1435. doi:10.1016/j.jacc.2021.01.038
5. Gupta A, Mtui EE, Baradaran H, et al. CT angiographic features of symptom-producing plaque in moderate-grade carotid artery stenosis. Am J Neuroradiol. 2015;36(2):349–354. doi:10.3174/ajnr.A4098
6. Zhang R, Zhang Q, Ji A. Identification of high-risk carotid plaque with MRI-based radiomics and machine learning. Euro Radiol. 2021;31(5):3116–3126. doi:10.1007/s00330-020-07361-z
7. Baradaran H, Gupta A. Carotid Vessel Wall Imaging on CTA. AJNR Am J Neuroradiol. 2020;41(3):380–386. doi:10.3174/ajnr.A6403
8. Zhu X-J, Wang W, Liu Z-J. High-resolution magnetic resonance vessel wall imaging for intracranial arterial stenosis. Chinese Med J. 2016;129(11):1363–1370. doi:10.4103/0366-6999.182826
9. Saba L, Francone M, Bassareo PP, et al. CT attenuation analysis of carotid intraplaque hemorrhage. AJNR Am J Neuroradiol. 2018;39(1):131–137. doi:10.3174/ajnr.A5461
10. Feuchtner G, Kerber J, Burghard P. The high-risk criteria low-attenuation plaque <60 HU and the napkin-ring sign are the most powerful predictors of MACE: a long-term follow-up study. Euro Heart J Cardiovas Imag. 2017;18(7):772–779. doi:10.1093/ehjci/jew167
11. Eisenmenger LB, Aldred BW, Kim S-E, et al. Prediction of carotid intraplaque hemorrhage using adventitial calcification and plaque thickness on CTA. AJNR Am J Neuroradiol. 2016;37(8):1496–1503. doi:10.3174/ajnr.A4765
12. Das M, Braunschweig T, Mühlenbruch G, et al. Carotid plaque analysis: comparison of dual-source computed tomography (CT) findings and histopathological correlation. Eur J Vasc Endovascular Surg. 2009;38(1):14–19. doi:10.1016/j.ejvs.2009.03.013
13. Oliver TB, Lammie GA, Wright AR, et al. Atherosclerotic plaque at the carotid bifurcation: CT angiographic appearance with histopathologic correlation. AJNR Am J Neuroradiol. 1999;20(5):897–901. PMID: 10369363; PMCID: PMC7056169.
14. Eliasziw M, Streifler JY, Fox AJ, et al. Significance of plaque ulceration in symptomatic patients with high-grade carotid stenosis. North American Symptomatic Carotid Endarterectomy Trial. Stroke. 1994;25(2):304–308. doi:10.1161/01.str.25.2.304
15. Wintermark M, Jawadi SS, Rapp JH, et al. High-resolution CT imaging of carotid artery atherosclerotic plaques. Am J Neuroradiol. 2008;29(5):875–882. doi:10.3174/ajnr.A0950
16. Williams MC, Earls JP, Hecht H. Quantitative assessment of atherosclerotic plaque, recent progress and current limitations. J Cardiovasc Comp Tomogra. 2022;16(2):124–137. doi:10.1016/j.jcct.2021.07.001
17. Derksen WJM, Peeters W, Tersteeg C. Age and coumarin-type anticoagulation are associated with the occurrence of intraplaque hemorrhage, while statins are associated less with intraplaque hemorrhage: a large histopathological study in carotid and femoral plaques. Atherosclerosis. 2011;214(1):139–143. doi:10.1016/j.atherosclerosis.2010.10.022
18. Pucci A, Sheiban I, Formato L. In vivo coronary plaque histology in patients with stable and acute coronary syndromes: relationships with hyperlipidemic status and statin treatment. Atherosclerosis. 2007;194(1):189–195. doi:10.1016/j.atherosclerosis.2006.07.026
19. Jiang WJ, Srivastava T, Gao F, Du B, Dong KH, Xu XT. Perforator stroke after elective stenting of symptomatic intracranial stenosis. Neurology. 2006;66(12):1868–1872. doi:10.1212/01.wnl.0000219744.06992.bb
20. Soulis JV, Giannoglou GD, Parcharidis GE, Louridas GE. Flow parameters in normal left coronary artery tree. Implication to atherogenesis. Comput. Biol. Med. 2007;37(5):628–636. doi:10.1016/j.compbiomed.2006.06.006
21. Park J-B, Choi G, Chun EJ. Computational fluid dynamic measures of wall shear stress are related to coronary lesion characteristics. Heart. 2016;102(20):1655–1661. doi:10.1136/heartjnl-2016-309299
22. Sitzer M, Puac D, Buehler A. Internal carotid artery angle of origin: a novel risk factor for early carotid atherosclerosis. Stroke. 2003;34(4):950–955. doi:10.1161/01.STR.0000060895.38298.C4
23. Jiang P, Chen Z, Hippe DS. Association between carotid bifurcation geometry and atherosclerotic plaque vulnerability: a Chinese atherosclerosis risk evaluation study. Arteriosclerosis Thrombosis Vasc Biol. 2020;40(5):1383–1391. doi:10.1161/ATVBAHA.119.313830
24. Lee S-W, Antiga L, Spence JD, Steinman DA. Geometry of the carotid bifurcation predicts its exposure to disturbed flow. Stroke. 2008;39(8):2341–2347. doi:10.1161/STROKEAHA.107.510644
25. Smedby Ö, Bergstrand L. Tortuosity and atherosclerosis in the femoral artery: what is cause and what is effect? Ann Biomed Eng. 1996;24(4):474–480. doi:10.1007/BF02648109
26. Malek AM. Hemodynamic shear stress and its role in atherosclerosis. JAMA. 1999;282(21):2035–2042. doi:10.1001/jama.282.21.2035
27. Saba L, Saam T, Jäger HR. Imaging biomarkers of vulnerable carotid plaques for stroke risk prediction and their potential clinical implications. Lancet Neurol. 2019;18(6):559–572. doi:10.1016/S1474-4422(19)30035-3
28. Selwaness M, Hameeteman R, Van ‘t Klooster R. Determinants of carotid atherosclerotic plaque burden in a stroke-free population. Atherosclerosis. 2016;255:186–192. doi:10.1016/j.atherosclerosis.2016.10.030
29. Astor BC, Sharrett AR, Coresh J, Chambless LE, Wasserman BA. Remodeling of carotid arteries detected with MR imaging: atherosclerosis risk in communities carotid MRI study. Radiology. 2010;256(3):879–886. doi:10.1148/radiol.10091162
 © 2024 The Author(s). This work is published and licensed by Dove Medical Press Limited. The
full terms of this license are available at https://www.dovepress.com/terms
and incorporate the Creative Commons Attribution
- Non Commercial (unported, 3.0) License.
By accessing the work you hereby accept the Terms. Non-commercial uses of the work are permitted
without any further permission from Dove Medical Press Limited, provided the work is properly
attributed. For permission for commercial use of this work, please see paragraphs 4.2 and 5 of our Terms.
© 2024 The Author(s). This work is published and licensed by Dove Medical Press Limited. The
full terms of this license are available at https://www.dovepress.com/terms
and incorporate the Creative Commons Attribution
- Non Commercial (unported, 3.0) License.
By accessing the work you hereby accept the Terms. Non-commercial uses of the work are permitted
without any further permission from Dove Medical Press Limited, provided the work is properly
attributed. For permission for commercial use of this work, please see paragraphs 4.2 and 5 of our Terms.