Back to Journals » Diabetes, Metabolic Syndrome and Obesity » Volume 14
Evaluation of Stress and Associated Biochemical Changes in Patients with Type 2 Diabetes Mellitus and Obesity
Authors Tyagi K, Agarwal NB ![]() , Kapur P, Kohli S
, Kapur P, Kohli S ![]() , Jalali RK
, Jalali RK ![]()
Received 28 November 2020
Accepted for publication 15 January 2021
Published 16 February 2021 Volume 2021:14 Pages 705—717
DOI https://doi.org/10.2147/DMSO.S294555
Checked for plagiarism Yes
Review by Single anonymous peer review
Peer reviewer comments 3
Editor who approved publication: Prof. Dr. Juei-Tang Cheng
Kanchan Tyagi,1 Nidhi Bharal Agarwal,2 Prem Kapur,3 Sunil Kohli,3 Rajinder K Jalali4
1Department of Pharmaceutical Medicine, School of Pharmaceutical Education and Research, Jamia Hamdard, New Delhi, 110062, India; 2Centre for Translational and Clinical Research, School of Chemical & Life Sciences, Jamia Hamdard, New Delhi, 110062, India; 3Hamdard Institute of Medical Sciences and, Research, HAH Centenary Hospital, New Delhi, 110062, India; 4Physician and Healthcare Consultant. Formerly, Sun Pharmaceuticals Industries Limited, Gurgaon, 122015, India
Correspondence: Nidhi Bharal Agarwal
Centre for Translational and Clinical Research, School of Chemical & Life Sciences, Jamia Hamdard, New Delhi, 110062, India
Tel +91 9818334770
Email [email protected]
Purpose: Type 2 diabetes mellitus (T2DM), a metabolic disorder, remains associated with a physiological impairment affecting large populations worldwide. Onset of T2DM is multifactorial where obesity and abnormal basal metabolic rate are considered most critical. Of people diagnosed with T2DM, about 80% are also obese. It is also reported that obese individuals have an increased odds of developing depression, whereas T2DM is estimated to increase the incidence by two-fold. The preponderance of research data demonstrates that T2DM alters the serum level of cortisol and adiponectin which are known to be associated with neuronal physiology. The study explored, how a metabolic disorder like T2DM is linked with the altered plasma level of cortisol and adiponectin, the risk factors for stress and depression.
Patients and Methods: A cross-sectional population study was conducted in T2DM patients using a bimodal approach. First approach used questionnaires, (1) Patient Health Questionnaire (PHQ-9) and (2) Stress Coping Inventory Questionnaire (SCQ) to assess signs and symptoms of depression and stress, respectively, in T2DM patients. In the second approach, robust biochemical analysis was conducted for serum adiponectin and cortisol levels.
Results: An association of T2DM in stress and depression was evaluated in 158 subjects (105 T2DM obese patients and 53 healthy controls). A lower PHQ-9 score and adiponectin levels were seen in T2DM obese patients compared to healthy controls (p< 0.05). Further, results also depicted a lower adiponectin levels in T2DM obese patients with depression compared to T2DM obese patients without depression (p< 0.05). The study did not find a significant difference in cortisol serum levels among the T2DM and control groups. However, a higher level of serum cortisol was reported in T2DM obese patients with depression over those T2DM obese patients who lacked depression (p< 0.05).
Conclusion: The findings suggest that T2DM obese patients might have a higher risk of developing stress and depression. Further, biochemical parameters, adiponectin and cortisol, might be the potential biomarkers for T2DM and may help in early diagnosis of these comorbid conditions.
Keywords: type 2 diabetes mellitus, depression, stress, PHQ-9, SCQ, adiponectin, cortisol
Introduction
In 2019, an estimate of global burden of type 2 diabetes mellitus (T2DM) provided by the IDF stood at ~463 million. In 2010, the T2DM burden for 2025 was projected as ~438 million and it has already been surpassed by ~25 million.1 The rise in global T2DM prevalence is a complex amalgamation of development of comorbidities, most common being obesity and depression. It is important to note that prevalence of obesity, depression, and T2DM has increased in parallel at an accelerating rate suggesting interdependencies in the progression of these diseases. Numerous studies indicate the bidirectional associations between T2DM and depression, T2DM and obesity, depression and obesity and the interrelated risks.2–4 One of the key meta-analyses demonstrated that T2DM/obese patients have a 1.63-fold increased risk of depression in comparison to T2DM alone.5 The disease triad (T2DM, obesity, and depression) has biological pathways overlapping at the level of organs, tissues, cells, and biochemical substrates regulating peripheral and neural metabolism converging at the hypothalamus-pituitary-adrenal (HPA) axis. The HPA axis is central to an individual’s response to stressful conditions.6–8 However, other potential mediators of the obesity-depression association, such as changes in adipokines, have not yet been well explored.8
Depression and T2DM are both known to activate the HPA axis through increased sympathoadrenal system activity.9 There has been mixed evidence connecting depression in T2DM and obesity. Some studies have shown that depression and depression symptoms are commonly seen in T2DM and obese patients. In contrast, there are studies where no such link has been found. However, there is a reported evidence showing a bidirectional relationship between depression and T2DM which could be explained basis neurobiological mechanism involved and may be attributed to dysregulation in the HPA axis with elevated cortisol levels, changes in corticotrophin-releasing hormone levels and neurotrophins.5,9
A recent meta-analysis by González-Castro et al, assessed the risk of developing substantial depressive symptoms in individuals with obesity and T2DM and found the involvement of genetic, neurobiological and environmental factors that contribute considerably in the development of T2DM, obesity and depression, however, the risks of these conditions could be different between populations.5,10
On a closer look at the etiology of the disease triad, stress has been found as one of the well-established contributors responsible. There is a prudent possibility that patients with T2DM and obesity, depending on their stress responses, may or may not develop depression. The individual’s response can form a Gaussian distribution of a population ranging from stress resilience to stress susceptible population, suggesting that some individual suffer greater neuropsychiatric pathophysiology than others.11–14 The relatively minor stresses associated with diabetes have been thought to be enough to trigger depressive symptoms in vulnerable individuals. Both normal stressors and T2DM related distress have been linked with increased odds of developing depressive symptoms.14
In addition to stressful conditions, the body undergoes biochemical alterations to correct the imbalances and coordinates the stress response by releasing array of stress mediators in various temporal compartments of body, thus, offering a varied degree of susceptibility and resistance patterns. This mechanism has been studied by researchers, where some individuals show differential capability to cope/adapt with stress and form a distribution in a population ranging from high degree (resilient) to low degree of resistance (susceptible). The intriguing thing about stress is that, it does not affect individuals in a population, in a similar manner.15–17
Further, extensive research has established that the most probable common biochemicals that link this disease triad are cortisol and adiponectin. However, the alterations in adipokines’ serum level that may be a possible link between depression and obesity, has not explored completely. Lower adiponectin levels and raised cortisol levels are seen in T2DM, obesity and depression cases individually, however, how these levels are affected in cases of comorbid conditions in entirety, and the information regarding modulation of adiponectin in diabetic and obese patients that will develop or not develop depression is unknown.18–20
In the present study an attempt was made to understand the behavior of T2DM subjects who exhibit two distinctive behavioral phenotypes (one showing depressive behavior/symptoms and the other showing no depressive behavior or symptoms) associated with their differential sensitivity to stress (stress resilient or susceptible), quantified by stress questionnaire response and levels of biochemical markers directly or indirectly related to stress (adiponectin and cortisol).
Study Rationale
The study rationale is presented in Figure 1.
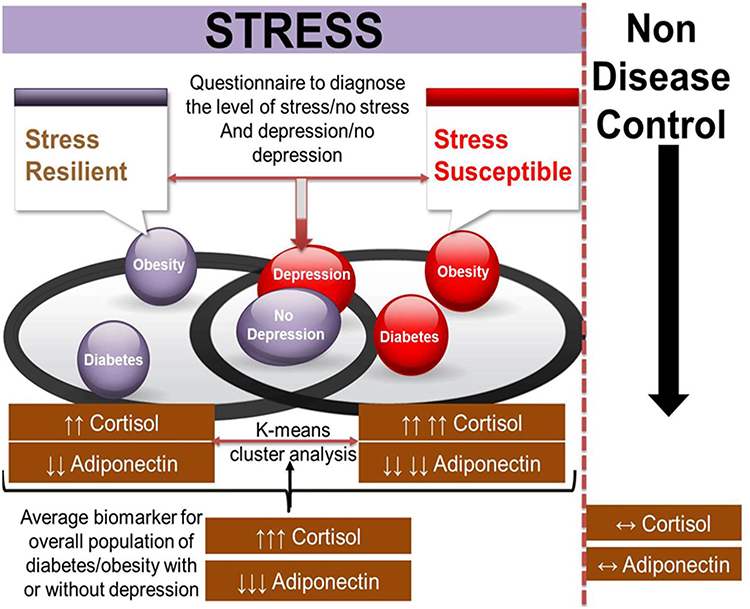 |
Figure 1 The figure represents study rationale. The figure also depicts how biochemical parameters (cortisol and adiponectin) are associated with stress including both stress resilient and susceptible populations. (↑↑ – mild increment; ↑↑↑ – moderate increment; ↑↑↑↑ – high increment; ↓↓ – mild reduction; ↓↓↓ – moderate reduction; ↓↓↓↓ – high reduction; ↔ – no change). |
It is unknown whether any biochemical changes can be estimated in a population that can differentiate the population into stress-resilient and stress-susceptible individuals and further into those that will develop or not develop depression. The body coordinates the stress response by secreting multiple stress modulating mediators which includes transmitters (nor-epinephrine/epinephrine/serotonin), peptides (corticotrophin-releasing factor, dynorphins), hormones (cortisol in humans and corticosterone in rodents, angiotensin). The complexity of an orchestrated stress response occurs at various levels, but most theories revolve around cortisol levels. The imbalance in cortisol levels is a good predictor of the over-activated stress axis. The cross-play of cortisol is also found in metabolic disorders, particularly diabetes and obesity. Besides, adiponectin’s recent involvement, a collagen-like plasma protein secreted by adipocytes is also suggested to play a substantial role in the development of insulin resistance, obesity, and depression. The protein has been found to be decreased in cases of insulin resistance, diabetes, and depression, but what is the degree of reduction? The answer to this question is still unknown.
Therefore, in the present study, we aimed to identify the biochemical levels that can differentiate diabetic/obese peoplewith or without depression can undoubtedly help in the diagnosis and prognosis of these comorbid conditions. The most probable biochemical parameters that link all these three comorbid conditions of T2DM, obesity, and depression, are cortisol and adiponectin. The lower adiponectin levels are also reported with increased cortisol levels in diabetes, obesity, and depression individually. However, how these levels are affected in entirety and the information regarding modulation of adiponectin in diabetic and obese patients that will develop or not develop depression is unknown.
Patients and Methods
Study Design
This was a cross-sectional study.
Study Investigational Plan
The investigation plan of the study is depicted in Figure 2.
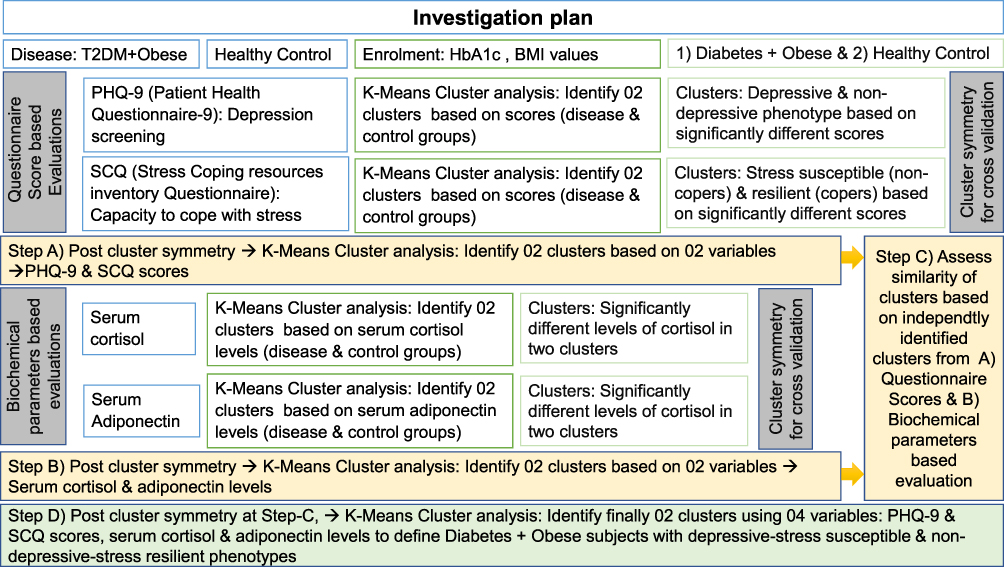 |
Figure 2 The figure demonstrates investigation plan of the study. |
Study Population
Male and female patients, aged >18 years and <65 years, diagnosed with T2DM using the American Diabetes Association criterion of Hb1Ac ≥6.5% were enrolled after a written informed consent was obtained. Other inclusion criteria included, patients treated with antidiabetic treatment for at least last six months, body mass index ≥30.0 kg/m2, able to understand and comply with study procedures. Control group included male and female subjects aged >18 years and <65 years who provided written informed consent and had no clinically significant illness and/or disease such as absence of T2DM, no history or current depression/anxiety or any other psychiatric disorder, ability to understand and comply study procedures. Patients with a history or current smokers, drug or alcohol dependence, currently diagnosed or having history of any major psychiatric illness, uncontrolled hypertension (blood pressure 180/105 mmHg or above), patient on psychotropic drugs, pregnant or breast-feeding women, patients unable or unwilling to give written informed consent were excluded from the study. Patients visiting the diabetic clinic and medicine outpatient department (OPD) were approached for participation. Healthy controls visiting for routine check-ups or along with the patients were also approached for participation.
Clinical Data
Demographic and clinical data were collected in the standard format for height, sex, age, weight, duration of T2DM and concomitant medications. The body mass index for each subject was deducted using standard formula. For T2DM patients, HbA1c and blood glucose levels were recorded and health check-up reports and biochemical parameters relevant to the study of the healthy participants were obtained.
Serum Adiponectin Analysis
The blood samples were collected in the early morning hours (between 06:00 and 08:00 am), where 5 mL approximate was obtained from participants in a fasting condition. The serum was separated from the blood according to the procedures mentioned in the ELISA manual. Serum adiponectin levels were quantified for each 40 μL of serum samples using a highly sensitive ELISA kit (RayBio® Human Acrp30 ELISA Kit).
Serum Cortisol Analysis
As levels of cortisol in serum are affected by episodic secretion of cortisol and the resulting diurnal variation, samples were collected during early morning hours (between 06:00 and 08:00 am) to have consistent and uniform cortisol measurement. A blood sample of approximately 5 mL was obtained in a fasting condition. The serum was separated from the blood according to the standard procedures of ELISA and serum cortisol levels were quantified using chemiluminescence.
Assessment of Stress
Stress Coping Resources Inventory questionnaire (SCQ) was used to assess the stress in patients. As people differ remarkably in their responses to potentially stressful events, about one in ten persons come out of captivity as mentally healthier. In contrast, others may face extreme emotional difficulty and find it difficult to cope with stress conditions. SCQ helps in the assessment of the factors that are associated with managing success. With high test-retest reliabilities and internal consistency, the SCQ helps anticipate personality type, emotional distress, occupational choice, life satisfaction, illness, and drug dependency.21
Assessment of Depression
The state of depression/depressive symptoms was assessed using the well-accepted Patient Health Questionnaire (PHQ-9). PHQ-9 is a self-administered version of the diagnostic instrument for common mental disorders. It constitutes depression module, which scores nine DSM-IV domains. Each PHQ-9 domain is recorded using scores ranging from 0–3, depicting (not at all) or (nearly every day), respectively.22
Statistical Analysis
Two clusters among the diabetic population were identified using the biochemical parameters (cortisol and adiponectin). The questionnaire-based scores (PHQ-9 and SCQ) and variables independently identified two other clusters among the T2DM population using K-means cluster analysis. After identification of clusters, ANOVA was performed on the control group (A) and diabetic group (B), and the two identified clusters from the diabetic group: diabetes/obese without depression (C1) and diabetes/obese with depression (C2). If p≤0.05 was detected in Tukey’s test-based comparisons, the individual group results were considered significantly different. The clusters identified based only on biochemical parameters and those identified by the questionnaire-based scores (PHQ-9 and SCQ) were then compared to evaluate the accuracy of the identified clusters (meaning the same subjects were identified in two clusters from the diabetic groups C1 and C2). Cluster analysis was performed using R-project; R version 3.5.3.
Sample Size Estimation
The study was carried out to test the hypothesis that the subjects with T2DM demonstrates two phenotypes that can be identified based on (1) patients’ response to stress, estimated by questionnaire responses (PHQ-9 and SCQ), and; (2) the levels of biochemical markers directly or indirectly related to stress (adiponectin and cortisol). Assuming a typical SD of 40% (using a two-tailed t-test of difference between means) for adiponectin and cortisol levels, a sample size of 42 subjects per group (depression and no depression) and control (nondiseased) was considered sufficient to detect a significant difference of 20% between groups for cortisol and adiponectin levels (separately) with coverage probability of 95%, (α=0.05, power=0.8, β=0.2) giving a total population of 126 subjects. Considering a dropout rate of 20%, the sample size required was 153 (51 per group).23,24
Results
The demographic characteristics are presented in Table 1. All study participants were administered PHQ-9 and SCQ questionnaires. Basis participants responses to PHQ-9, two clusters were identified (a) depressive and, (b) nondepressive phenotype. SCQ scores were then used to identify two independent clusters, (a) stress susceptible and, (b) stress-resilient. The literature evidence also suggests the indirect possibilities of two phenotypes (a) diabetic/obese with depression and (b) diabetic/obese without depression. The strength of these questionnaires in identifying the same clusters from the diabetic population in the study alludes to the possibility of differential responses to stress and further risk(s) of developing depression. Central to the hypothesis of these identified clusters different from each other and yet similar in HbA1c and BMI values indicates the homogeneity of diabetes population in the background, but when looking closely at the level of stress responses sheds light on the two phenotypes (Tables 2 and 3). As a result, shown in Figure 3A, 83% similarity of clusters (C1 and C2) and no clusters identified in control population further strengthens that there is one subset of the diabetic population which is at higher propensity to develop depression (stress vulnerable) compared to another subset which is resilient to the effects of stress.
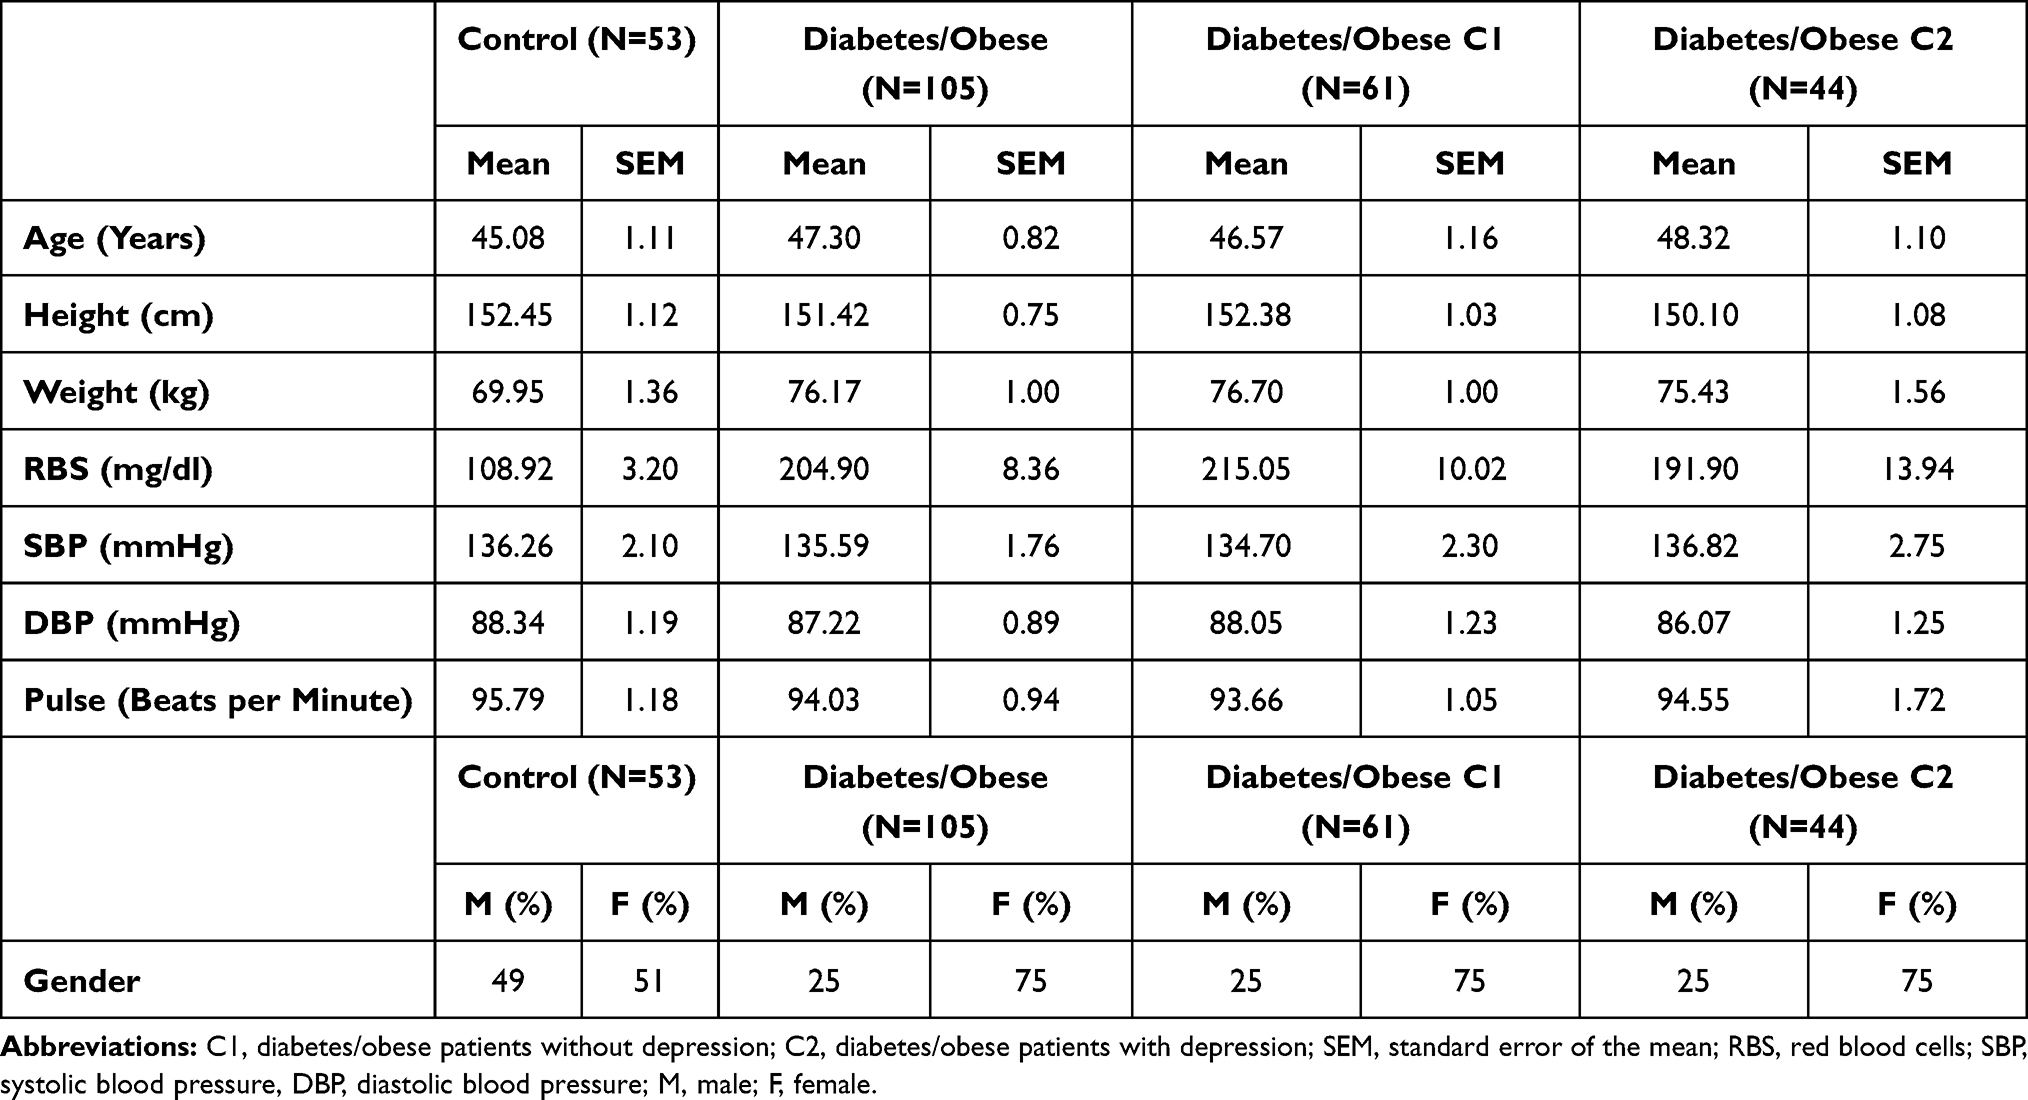 |
Table 1 Demographic Characteristics |
 |
Table 2 Independent Cluster Analysis Based on Scores from PHQ-9 and SCQ Questionnaires |
 |
Table 3 K-means Cluster Analysis: Identify Two Clusters Based on Scores from PHQ-9 and SCQ Questionnaires |
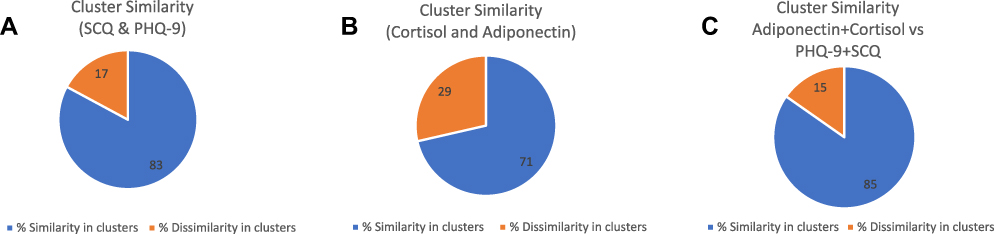 |
Figure 3 The figure demonstrates cluster similarity across study population of diabetes. (C1: diabetic/obese patients without depression; C2: diabetic/obese patients with depression). (A) Similarity of clusters based on questionnaire scores: two clusters were identified by independently using SCQ and PHQ-9 questionnaire score as variables employing K-means cluster analysis. The independent clusters (C1 and C2) identified by SCQ scores and (C1 and C2) of PHQ-9 scores were matched subject to subject for accuracy estimations. (B) Similarity of clusters based on biochemical evaluations: two clusters were identified by independently using adiponectin and cortisol levels as variables employing K-means cluster analysis. The independent clusters (C1 and C2) identified by adiponectin levels and (C1 and C2) of cortisol levels were matched subject to subject for accuracy estimations. (C) Similarity of clusters based on questionnaire scores vs biochemical evaluations: two clusters were identified by independently using (1) SCQ and PHQ-9 questionnaire score as two variables together and (2) adiponectin and cortisol levels as two variables together. The independent clusters (C1 and C2) identified by questionnaire scores and of (C1 and C2) of biochemical evaluations were matched subject to subject for accuracy estimations. |
Similar clusters from the diabetic population were identified based on biochemical estimations of adiponectin and cortisol (Tables 4 and 5). First, individual cluster analysis was conducted where subjects were categorized into clusters based on cortisol (p-value <0.001) and adiponectin levels (p-value=0.001) followed by combined cluster analysis using both biochemical parameters (Table 5). Cluster similarity was found in 71% of subjects (Figure 3A and B).
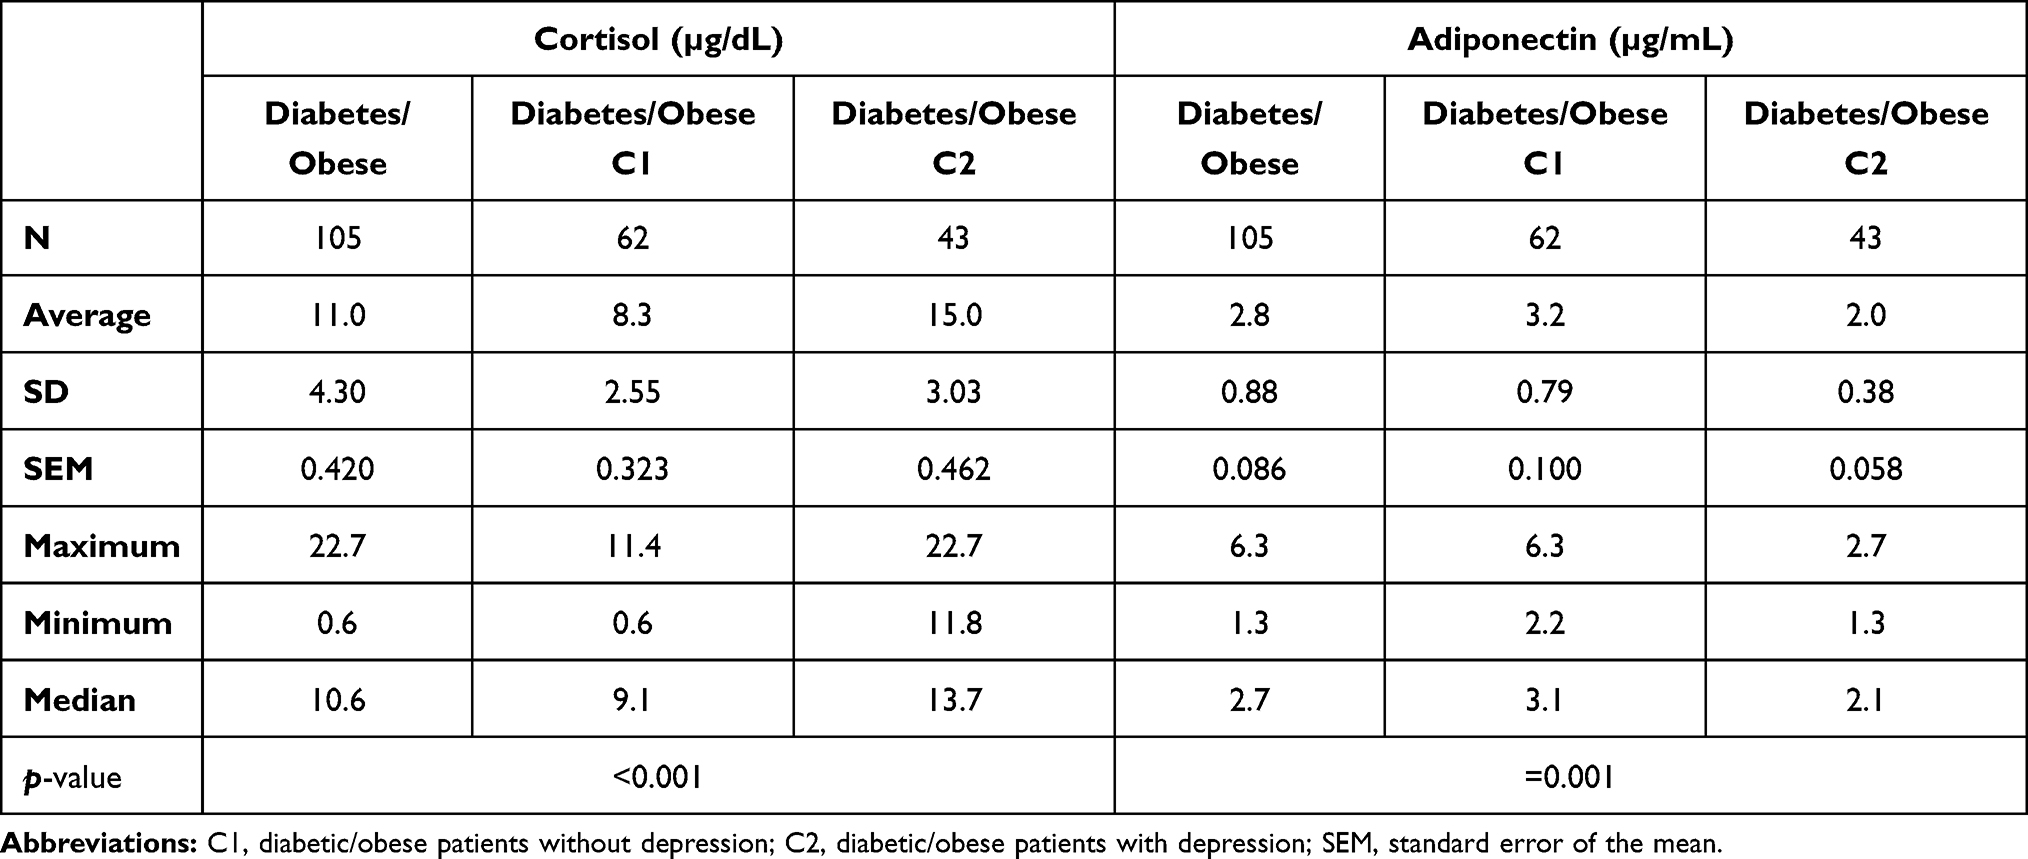 |
Table 4 Independent Cluster Analysis Based on Cortisol and Adiponectin Levels |
 |
Table 5 K-means Cluster Analysis: Identify Two Clusters Based on Cortisol and Adiponectin Levels |
Further, the cluster symmetry/similarity was assessed based on biochemical parameter analysis and was compared with questionnaire responses where, the accuracy of similar cluster formation by these two independent analyses was found as 85% (Figure 3C). Considering the same clusters (C1 and C2) identified, final clusters—diabetic obese without depression (diabetic/obese-C1) and diabetic obese with depression (diabetic/obese-C2)—were identified utilizing questionnaire response and biochemical parameter estimations together. Of 105 diabetic subjects, 61 (58%) belong to C1 and 44 (42%) to the C2 group.
The next question addressed in the study was how much these identified clusters in a diabetic population are (1) different from each other; (2) different from parent diabetic pool (2) and different from the control population in the study. The diabetic population group was different from control. When these clusters were tested for the percentage change in comparison to the control population and their parent diabetic population, for BMI, HbA1C, the clusters and parent diabetic pool were similar to each other; however, both the clusters and diabetic pool have significantly higher BMI, HbA1C values compared to control (Figure 4; Table 6). BMI values of diabetic parent pool (27%), diabetic/obese: C1 (26%), and diabetic/obese: C2 (27%) were significantly higher in comparison to control and (2) HbA1c values of diabetic parent pool (87%), diabetic/obese: C1 (87%), and diabetic/obese: C2 (87%) significantly higher in comparison to control. The similarity of BMI values and HbA1c values of the diabetic pool and the two clusters reinforces the homogeneity of the diabetic population across the standard markers of a diabetes diagnosis.
 |
Figure 4 Percent change from control of total diabetes populations and two identified clusters among diabetes population (C1: diabetic/obese patients without depression; C2: diabetic/obese patients with depression). |
 |
Table 6 Variations of Different Variables |
When these clusters were tested for percentage compared to control the population and their parent diabetic population, for cortisol and adiponectin levels, the clusters were different from each other and from the parent diabetic pool (Figure 4; Tables 6 and 7). Serum level of cortisol in the diabetic parent pool (7%) showed no change, diabetic/obese: C1 (−20%) showed significantly lower, and diabetes: C2 (45%) showed significantly higher values in comparison to control and serum level of adiponectin of diabetes parent pool (−61%), diabetic/obese-C1 (−56%), and diabetic/obese: C2 (−71%), all showed significantly lower values in comparison to control. A point to note for both clusters, and these changes were statistically different irrespective of the direction of change. Though serum cortisol levels of the diabetic pool were not different from the control population, in identified clusters, the marked differentiation of diabetic/obese: C1 showed lower values of cortisol and diabetic/obese: C2, showing higher values of cortisol, suggesting that diabetic/obese: C1 can be considered stress-resilient. The group diabetic/obese: C2 can be regarded as stress vulnerable owing to high values of cortisol linked to a higher degree of stress perception. The argument is further strengthened with adiponectin levels showing a lower reduction in diabetic/obese: C1 (−56%) compared to diabetic/obese: C2 (−71%) with an absolute 15% more reduction in diabetic/obese: C2 (stress vulnerable based on cortisol values) goes well with the literature wherein lower values of adiponectin are associated with stress perception. A point to note is that diabetes, being the background disease, is shown to have lower adiponectin values than control, which aligns with the available literature. The diabetic pools clusters reinforce that the stress vulnerable (diabetic/obese: C2) based on cortisol values have much lower adiponectin values than the stress-resilient group (diabetic/obese: C1).
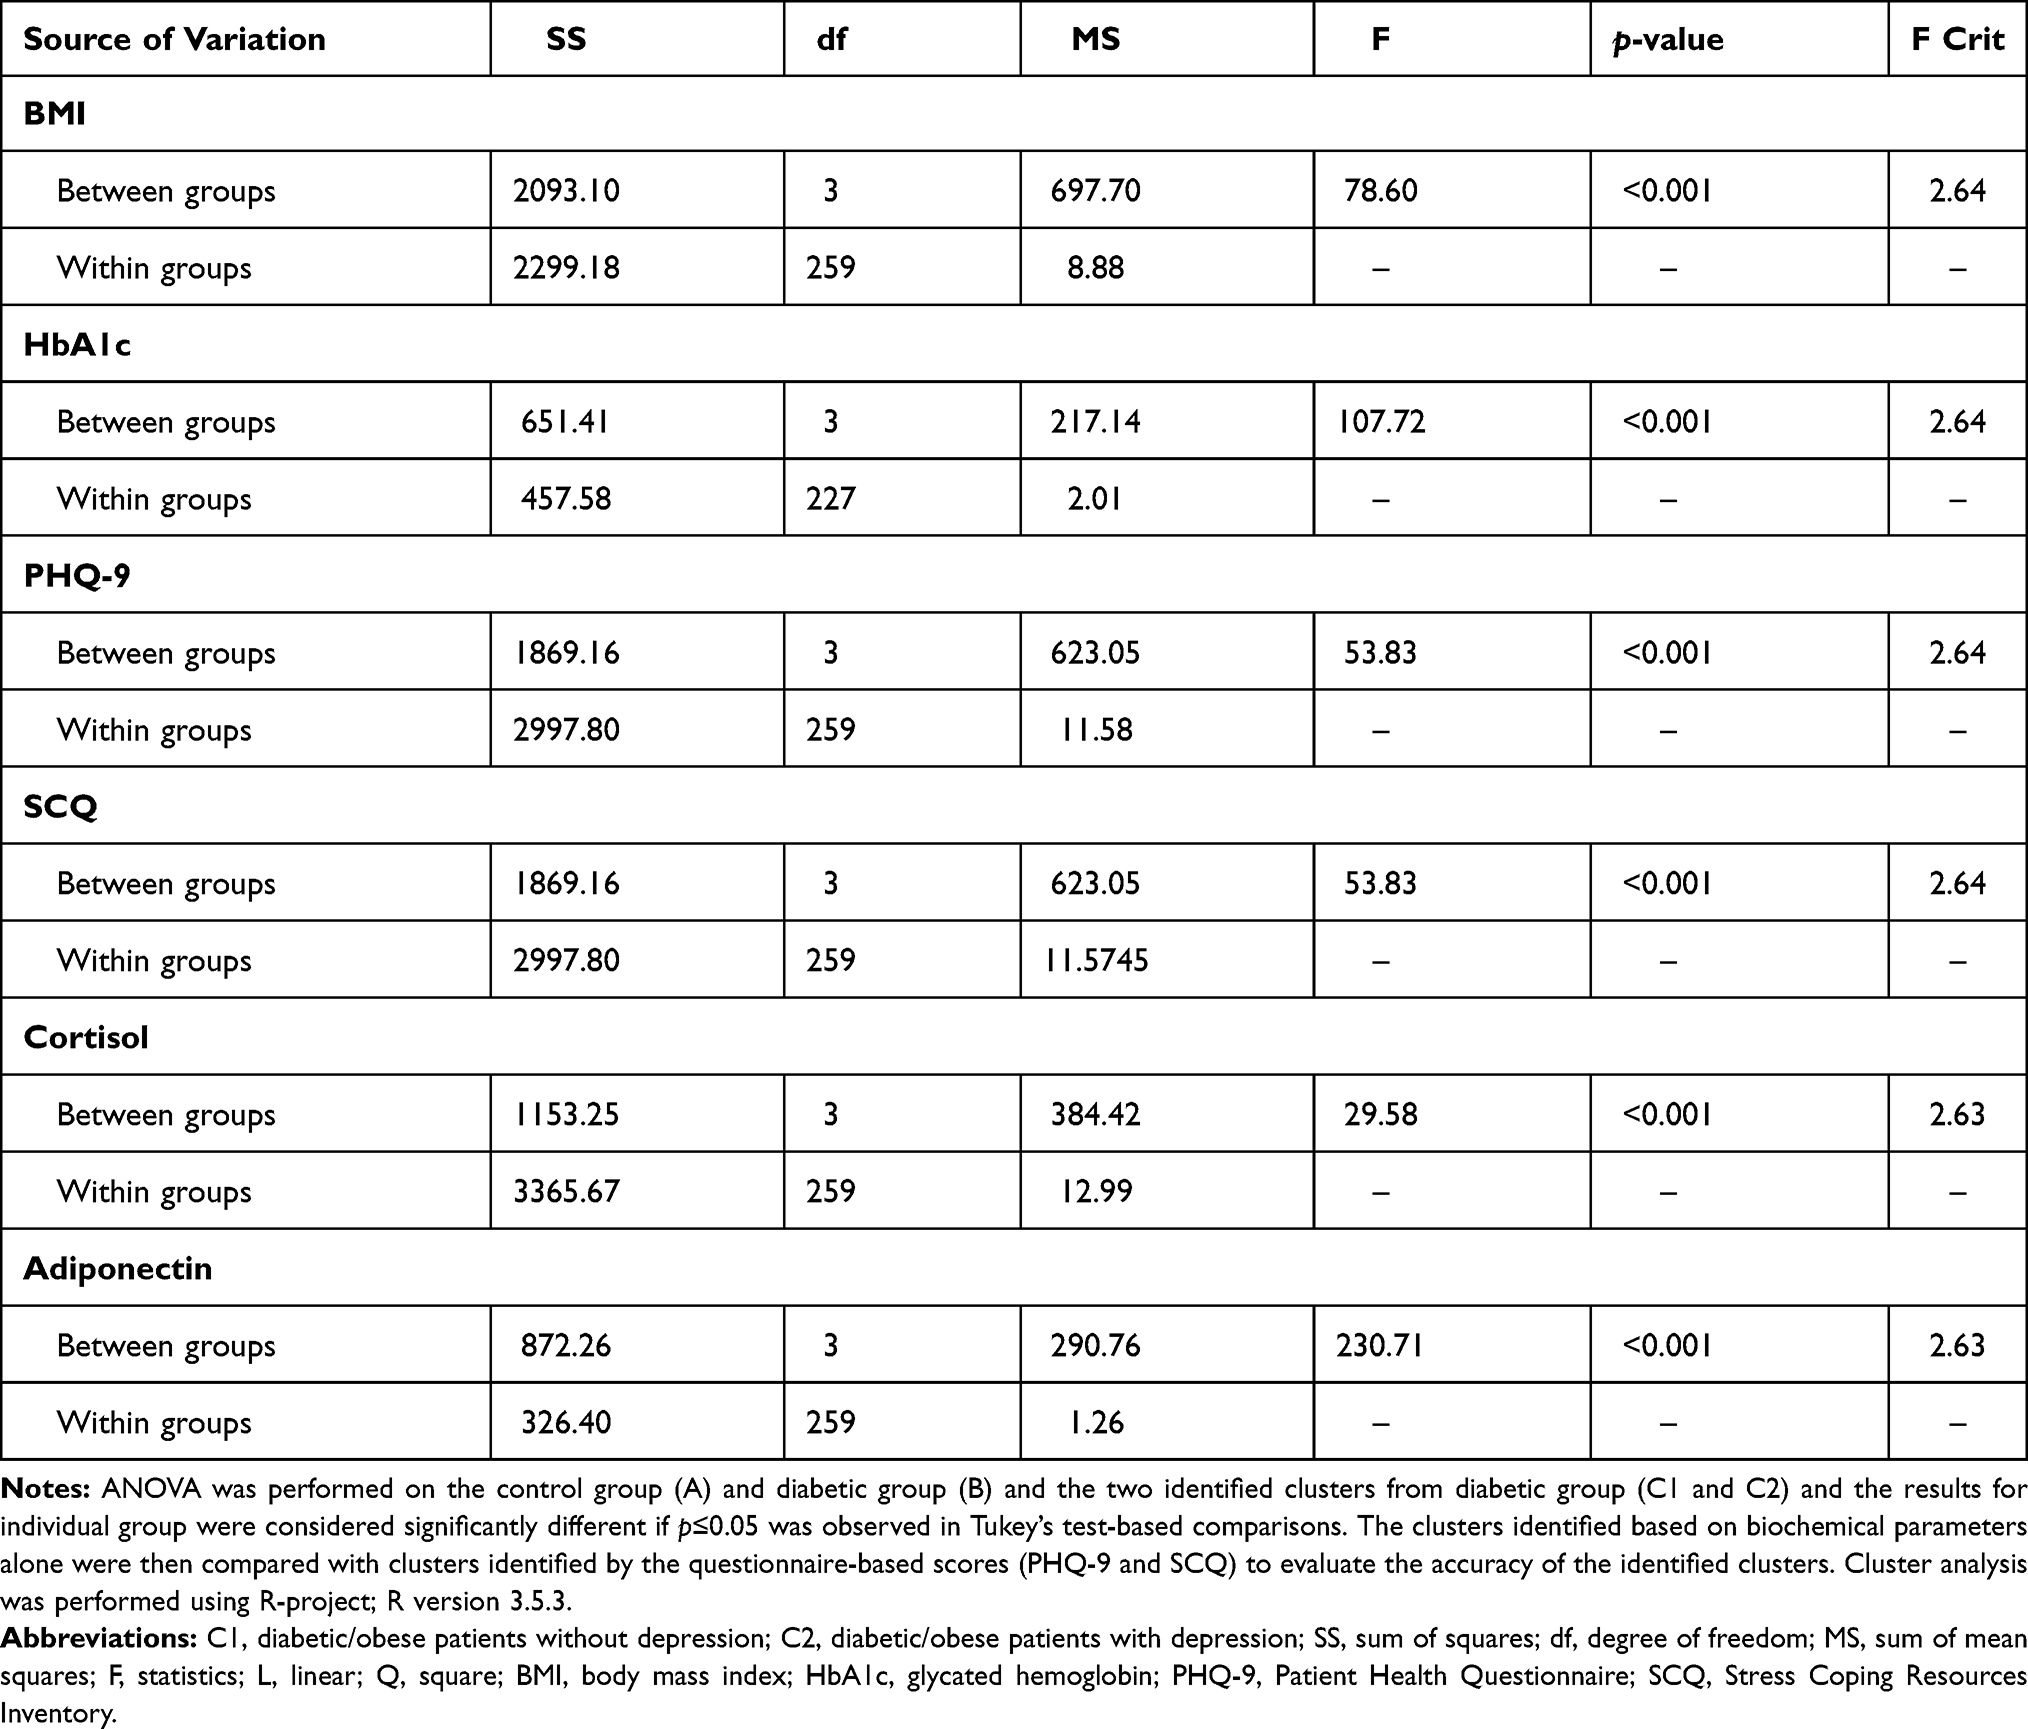 |
Table 7 ANOVA Variance Analysis Results for Different Variables |
When these clusters were tested for percent change compared to the control population and their parent diabetic population, for PHQ-9 and SCQ scores, the clusters were different from each other and the parent diabetic pool (Figure 4; Tables 6 and 7). PHQ-9 scores of the diabetic parent pool (50%) showed significantly higher, diabetic/obese: C1 (−3%) showed no change, and diabetic/obese: C2 (123%) showed significantly higher values in comparison to control and SCQ scores of the diabetic parent pool (−4%) showed no change, diabetic/obese: C1 (15%) showed significantly higher, and diabetic/obese: C2 (−33%) showed significantly lower values in comparison to control. A point to note for both clusters, is that the changes were statistically different irrespective of the direction of change. Though SCQ scores of the diabetic pool were not different from the control population, however, in identified clusters, the marked differentiation of diabetic/obese: C1 showing higher scores (representative of stress coping capacity) and diabetic/obese: C2 showing lower scores (suggestive of stress no-copers). This further highlights that diabetic/obese: C1 is a stress-resilient population which is in line with the observed cortisol (lower values than C2) and adiponectin response (higher values than C2) in this study. The differentiation of cluster is further strengthened with PHQ-9 scores showing the propensity of stress vulnerable population (diabetic/obese: C2) of the absolute average score of 13.4 (123% higher score than control) and stress-resilient population (diabetic/obese: C1) of the absolute average score of 5.8 (no change from control). The data further suggests that the diabetic population has a significantly higher PHQ-9 score (9.0; 50% higher score than control), which apparently is coming from the diabetes/obese-C2 cluster. The higher scores of diabetic/obese: C2 cluster are suggestive of moderately depressed phenotype, which goes well with complete data wherein this group has high cortisol values, comparatively lower adiponectin values, lower SCQ scores, and high PHQ-9 scores and diabetic/obese: C1 cluster with no markers (biochemical or questionnaire-based) indicating depression conferring to their strong stress-resilient mechanisms.
Discussion
Reduced levels of adiponectin in T2DM patients were seen in comparison to control group, which supports the fact that higher adiponectin levels are associated with a lower risk of T2DM. Adiponectin is one of the consistent biochemical predictors of T2DM which is under investigation worldwide. However, the studies have not yet established the scientific basis of the causality, the consistency of this association across large and diverse populations, any possible dose-response relationship, and the supportive findings in studies that may indicate that adiponectin might be a promising target for the reduction of risk of T2DM.15 A similar cross-sectional study demonstrated significantly lower adiponectin levels in diabetics than in nondiabetic participants.25 Similar findings were seen in a community-based research and a prospective longitudinal study with a follow-up of three years.26,27 Adiponectin has been suggested to activate the AMP-activated protein kinase pathway, resulting in reduced serum level of glucose. It also has anti-inflammatory and insulin-sensitizing properties. Insulin resistance and obesity have been linked to metabolic inflammation believed to trigger T2DM development.28
Multiple cross-sectional clinical studies have demonstrated high depression prevalence in T2DM patients.26,29 In similarity, the present study also observed that T2DM obese patients with depression had a lower adiponectin levels compared to T2DM obese patients without depression. Various meta-analyses and clinical studies have indicated that depressive patients have a decreased adiponectin level compared to healthy subjects.30–32 These findings are supported by preclinical evidence. In an animal study, activation of depressive-like behavior induced by stress was seen when neutralizing antibodies of adiponectin were injected. The depressive behavior was reversed once the exogenous adiponectin was injected in diabetic mice and it resulted in antidepressant-like behavioral changes.33
The present study also showed increased serum cortisol levels in T2DM obese patients with comorbid depression compared to the group without depression, which is in concurrence with the reported findings.34–36 Dysregulation in the hypothalamic-pituitary-adrenal (HPA) axis and release of cortisol plays a pivotal role in depression pathophysiology.37 Hypothalamus further secretes arginine, vasopressin, and corticotropin-releasing hormone in response to various stressors, both psychological and physical.38
It is extensively suggested that raised secretion of cortisol during chronic stress leads to depression.39
Metabolic disorder is linked with the fluctuating plasma level of cortisol, a key player that triggers a higher risk of insulin resistance, hyperglycemic state, upsurge in hypertension cases, reduced high-density lipoprotein cholesterol (HDL-C), elevated triglycerides, and abdominal obesity.40 T2DM also triggers differential cortisol levels during stress and depression, further increasing the risk of metabolic syndrome. It was also reported that adiponectin is involved in various physiological events including regulating deposition of visceral fats, triglyceride levels and acts as an anti-atherosclerotic and anti-inflammatory.41 Presence of T2DM also alters the plasma level of adiponectin and affects associated functions that might increase the likelihood of developing metabolic disorders. Stress and depression also have a distinct impact on adiponectin’s plasma level which triggers the risk of metabolic disease via a parallel mechanism.
The cross-sectional design of this study did not allow (1) longitudinal follow-up to assess the changes in adiponectin and cortisol along with glycemic control over a period of time. (2) The interference of concurrent medications on the questionnaire responses and biochemical levels cannot be ruled out. (3) Clinical studies involving the use of antidiabetics and antidepressants that may have effects on the other disease symptoms can add benefit to validate the data produced.
Conclusions
Evidence suggests that depression is present in about one-third of T2DM patients.42
Our study demonstrates that presence of depression increases from one-third to one-half in T2DM patients, if patient have additional comorbidity of obesity. Glycemic control in T2DM patients having obesity and depression is difficult to maintain by reaching their HbA1c goals. Factors including patient adherence to medication as a lever of good self-care practices is limited in depressive conditions, and they have twofold risk of missing doses compared with those without depression. Frequent monitoring of glycaemic control is considerably more important to T2DM/obese patients exhibiting clinical signs of depression.
The results accumulated in the study may not reflect the true burden of depression in T2DM/obese pool. The patients were screened and selected from a specialized tertiary hospital in a metropolitan area of Delhi. Doing dynamic real-world evidence studies in primary/secondary health care setting will be reflective of true the burden of depressive phenotype in the T2DM/obese pool. Our study did not include non-T2DM/obese controls having depression for comparison, limiting the inferences linking the triad of diabetes, obesity, depression and possible role of diabetes/obesity in depression and reciprocated effects on durability of glycemic control. Cross-sectional study by design only allowed to bring the associations between diabetes/obesity and depression, however, a longitudinal study design will be best suited to investigate the interdependencies of comorbidities.
Ethics
The study protocol and informed consent were approved by the Jamia Hamdard Institutional Ethics Committee.
Acknowledgments
The authors would like to thank Jamia Hamdard University, New Delhi and Hamdard Institute of Medical Sciences and Research, HAH Centenary Hospital for facilitating study conduct. The authors convey gratitude to various departments/centers for research support in this study.
Funding
The study was not sponsored by any grant.
Disclosure
The authors report no conflicts of interest in this work.
References
1. International Diabetes Federation. Diabetes Atlas.
2. Katon WJ. The comorbidity of Diabetes Mellitus and Depression. Am J Med. 2008;121(11):S8–15. doi:10.1016/j.amjmed.2008.09.008
3. Sullivan PW, Morrato EH, Ghushchyan V, Wyatt HR, Hill JO. Obesity, Inactivity, and the Prevalence of Diabetes and Diabetes-Related Cardiovascular Comorbidities in the U.S., 2000–2002. Diabetes Care. 2005;28(7):1599–1603. doi:10.2337/diacare.28.7.1599
4. Sharma HC, Fulton SE. Metabolic disturbances connecting obesity and depression. Front Neurosci. 2013;7:177.
5. González-Castro TB, Escobar-Chan YM, Fresan A, et al. Higher risk of depression in individuals with type 2 diabetes and obesity: results of a meta-analysis. J Health Psychol. 2019;18:1359105319876326. doi:10.1177/1359105319876326
6. Guo JLM, Zhang D, Cheng S, et al. Adiponectin is critical in determining susceptibility to depressive behaviors and has anti-depressant like activity. Proc Nat Acad Sci. 2012; 30:12248–12253.
7. Lloyd C, Smith J, Weinger WK. Stress and Diabetes: a Review of the Links. Diabetes Spectrum. 2005;18(2):121–127. doi:10.2337/diaspect.18.2.121
8. Charney DS, Nestler EJ. Neurobiology of Mental Illness.
9. Chaudhry R, Mishra P, Mishra J, Parminder S, Mishra BP. Psychiatric morbidity among diabetic patients: a hospital-based study. Industrial Psychiatry J. 2010;19(1):47–49. doi:10.4103/0972-6748.77637
10. Nowakowska M, Zghebi SS, Ashcroft DM, et al. The comorbidity burden of type 2 diabetes mellitus: patterns, clusters and predictions from a large English primary care cohort. BMC Med. 2019;17(1):145. doi:10.1186/s12916-019-1373-y
11. Chrousos GP. Stress and disorders of the stress system. Nat Rev Endocrinol. 2009;5(7):374–381. doi:10.1038/nrendo.2009.106
12. Kloet ER, Joels M, Holsboer F. Stress and the brain: from adaptation to disease. Nat Rev Neurosci. 2005;6(6):463–475. doi:10.1038/nrn1683
13. Marcovecchio ML, Chiarelli P. The Effects of Acute and Chronic Stress on Diabetes Control. Sci Signal. 2012;23(5):247.
14. Cooper CL, Dewe P. Stress: A Brief History. Blackwell Brief Histories of Psychology. Malden MA Oxford UK Blackwell Pub; 2004:144.
15. Björntorp P. Body fat distribution, insulin resistance, and metabolic diseases. Nutrition. 1997;13(9):795–803. doi:10.1016/S0899-9007(97)00191-3
16. Björntorp P. Visceral fat accumulation: the missing link between psychosocial factors and cardiovascular disease? J Intern Med. 1991;230(3):195–201. doi:10.1111/j.1365-2796.1991.tb00431.x
17. Schweizer MC, Henniger MSH, Sillaber I. Chronic mild stress (CMS) in mice: of anhedonia, ‘anomalous anxiolysis‘ and activity.. PLoS One. 2009;4(1):e4326. doi:10.1371/journal.pone.0004326
18. Achari AE, Jain SK. Adiponectin, a Therapeutic Target for Obesity, Diabetes, and Endothelial Dysfunction. Int J Mol Sci. 2017;18:1321.
19. Ghoshal K. Adiponectin: probe of the molecular paradigm associating diabetes and obesity. World J Diabetes. 2015;6(1):151–166. doi:10.4239/wjd.v6.i1.151
20. Taylor VH, MacQueen GM. The Role of Adipokines in Understanding the Associations between Obesity and Depression.. J Obes. 2010;2010:748048. doi:10.1155/2010/748048
21. Matheny KB, Aycock DW, Curlette WL, Junker GN. The Coping Resources Inventory for Stress: a measure of perceived resourcefulness. J Clin Psychol. 2003;59(12):1261–1277. doi:10.1002/jclp.10219
22. Kroenke K, Spitzer RL, Williams JBW. The PHQ-9. J Gen Intern Med. 2001;16(9):606–613. doi:10.1046/j.1525-1497.2001.016009606.x
23. Mitsuyoshi T, Katakami N, Kishida K, et al. Circulating adiponectin levels and their associated factors in young lean healthy Japanese women. J Atheroscler Thromb. 2012;19:87–90.
24. Rachit M, Saurin J, Devanshi PU, Ashutosh C, Halvadia S. Effect of examination stress on the plasma cortisol level. Nat J Med Res. 2012;2(4):435–438.
25. Diwan AG, Kuvalekar AA, Dharamsi S, et al. Correlation of serum adiponectin and leptin levels in obesity and Type 2 diabetes mellitus. Indian J Endocr Metab. 2018;22(1):93–99. doi:10.4103/ijem.IJEM_491_15
26. Derbel CH, Aribi L, Ben Naceur B, et al. Depression in Diabetic Patients: a Comparative Study of 100 Diabetic Patients and 100 Controls. Eur Psychiatry. 2015;30:724. doi:10.1016/S0924-9338(15)30574-5
27. Siddiqui S. Depression in type 2 diabetes mellitus - A brief review, Diabetes. Metab Syndr Clin Res Rev. 2014;8:62–65.
28. Duncan BB, Schmidt MI, Pankow JS, et al. Adiponectin and the Development of Type 2 Diabetes: the Atherosclerosis Risk in Communities Study. Diabetes. 2004;53(9):2473–2478. doi:10.2337/diabetes.53.9.2473
29. Lindberg S, Jensen JS, Pedersen SH, et al. Low adiponectin levels and increased risk of type 2 diabetes in patients with myocardial infarction. Diabetes Care. 2014;37(11):3003–3008. doi:10.2337/dc14-0932
30. Cao B, Chen Y, Brietzke E, et al. Leptin and adiponectin levels in major depressive disorder: a systematic review and meta-analysis. J Affect Disord. 2018;238:101‐110.
31. Lehto SM, Huotari A, Niskanen L, et al. Serum adiponectin and resistin levels in major depressive disorder. Acta Psychiatr Scand. 2010;121(3):
32. Leo R, Lorenzo DG, Tesauro M, et al. Decreased plasma adiponectin concentration in major depression. Neurosci Lett. 2006;407(3):211–213. doi:10.1016/j.neulet.2006.08.043
33. Siddiqui S. Depression in type 2 diabetes mellitus - A brief review, Diabetes. Metab Syndr Clin Res Rev. 2014;8:62–65. doi:10.1016/j.dsx.2013.06.010
34. Shabaan MAS, Shaaban I, Alatram AR, Gad EF. The relationship of serum cortisol levels with severity of depression and age in major depression. AAMJ. 2015;13(4):16–21.
35. Khan QU, Khan HA, Taiseef A, et al. Salivary Cortisol Levels in Severely Depressed Patients and Healthy Individuals. Int J Med Res Health Sci. 2019;8(5):21–25.
36. Ahmed S, Moussa F, Moustafa A, Ayoub DR. Cortisol level in depressed patients and its relation with suicidal risk and anhedonia. Egypt J Neurology. 2016;53(4):193–199. doi:10.4103/1110-1083.202375
37. Vreeburg SA, Hoogendijk WJG, Pelt VJ, et al. Major Depressive Disorder and Hypothalamic-Pituitary-Adrenal Axis Activity: results from a Large Cohort Study. Arch Gen Psychiatry. 2009;66(6):617–626. doi:10.1001/archgenpsychiatry.2009.50
38. Mackin P, Young AH. The Role of Cortisol and Depression: exploring New Opportunities for Treatments. Psychiatry Times. 2014;21(6):21–24.
39. Qin D, Rizak J, Feng X, et al. Prolonged secretion of cortisol as a possible mechanism underlying stress and depressive behaviour. Sci Rep. 2016;6(1):30187. doi:10.1038/srep30187
40. Jeong I-K. The role of cortisol in the pathogenesis of the metabolic syndrome. Diabetes Metab J. 2012;36(3):207–210. doi:10.4093/dmj.2012.36.3.207
41. Matsuzawa Y, Funahashi T, Kihara KS, Shimomura I. I. Adiponectin and metabolic syndrome. Arterioscler Thromb Vasc Biol. 2004;24(1):29–33. doi:10.1161/01.ATV.0000099786.99623.EF
42. Akpalu J, Yorke E, Ainuson-Quampah J, et al. Depression and glycaemic control among type 2 diabetes patients: a cross-sectional study in a tertiary healthcare facility in Ghana. BMC Psychiatry. 2018;18(1):357. doi:10.1186/s12888-018-1933-2
 © 2021 The Author(s). This work is published and licensed by Dove Medical Press Limited. The
full terms of this license are available at https://www.dovepress.com/terms
and incorporate the Creative Commons Attribution
- Non Commercial (unported, 3.0) License.
By accessing the work you hereby accept the Terms. Non-commercial uses of the work are permitted
without any further permission from Dove Medical Press Limited, provided the work is properly
attributed. For permission for commercial use of this work, please see paragraphs 4.2 and 5 of our Terms.
© 2021 The Author(s). This work is published and licensed by Dove Medical Press Limited. The
full terms of this license are available at https://www.dovepress.com/terms
and incorporate the Creative Commons Attribution
- Non Commercial (unported, 3.0) License.
By accessing the work you hereby accept the Terms. Non-commercial uses of the work are permitted
without any further permission from Dove Medical Press Limited, provided the work is properly
attributed. For permission for commercial use of this work, please see paragraphs 4.2 and 5 of our Terms.