Back to Journals » Infection and Drug Resistance » Volume 14
Evaluation of sTREM1 and suPAR Biomarkers as Diagnostic and Prognostic Predictors in Sepsis Patients
Authors Nasr El-Din A, Abdel-Gawad AR ![]() , Abdelgalil W, Fahmy NF
, Abdelgalil W, Fahmy NF ![]()
Received 14 May 2021
Accepted for publication 31 July 2021
Published 31 August 2021 Volume 2021:14 Pages 3495—3507
DOI https://doi.org/10.2147/IDR.S314237
Checked for plagiarism Yes
Review by Single anonymous peer review
Peer reviewer comments 3
Editor who approved publication: Prof. Dr. Héctor Mora-Montes
Asmaa Nasr El-Din,1 Abdelhady Ragab Abdel-Gawad,2 Wesam Abdelgalil,3 Nahed F Fahmy1
1Department of Microbiology and Immunology, Faculty of Medicine, Sohag University, Sohag, Egypt; 2Department of Clinical and Chemical Pathology, Faculty of Medicine, Sohag University, Sohag, Egypt; 3Departments of Anesthesia and Intensive Care, Faculty of Medicine, Sohag University, Sohag, Egypt
Correspondence: Asmaa Nasr El-Din Tel +20 10-2809-0703
Email [email protected]
Background: The purpose of this study was to explore the diagnostic role of sTREM1 in the diagnosis of sepsis and in differentiating between sepsis and systemic inflammatory response syndrome (SIRS). We also aimed to assess the prognostic value of suPAR in comparison to sequential organ-failure assessment (SOFA), acute physiology and chronic health evaluation (APACHE) II scores, and 28-day mortality.
Methods: This was a cross-sectional study conducted in the Medical Microbiology and Immunology Department and Central Research Laboratory, Faculty of Medicine, Sohag University from June 2019 to January 2021. The study population was classified into two groups: SIRS (no evidence of infection) and sepsis (with SIRS and evidence of infection). Patients were rated on the SOFA and APACHE II scoring systems at admission and after 7 days. Serum levels of sTREM1 and suPAR were measured by ELISA at the same time points.
Results: CRP and sTREM1 values were significantly higher in the sepsis group than the SIRS group on both days (P< 0.0001). The area under the curve (AUC) for CRP was 0.87 on the first day and 0.97 on the seventh, while the AUC for sTREM1 was 1.00 and 0.93 on the first and seventh days, respectively. The sensitivity of sTREM1 was 100% and specificity 84% at a cutoff of 49 pg/mL. There was a significantly positive correlation between CRP and sTREM1 values (P< 0.0001). On the seventh day, nonsurvivors had significantly higher serum levels of suPAR (median 4.9 ng/mL) than survivors (median 2.9 ng/mL; P< 0.0001). Nonsurvivors also had significantly higher SOFA and APACHE II scores than survivors (P< 0.0001 and P< 0.0001, respectively).
Conclusion: sTREM1 can be used as a good indicator for diagnosing sepsis in intensive care–unit patients. suPAR can also be used as a predictor of bad prognosis and poor survival at 7 days following admission.
Keywords: SIRS, sTREM, suPAR, sepsis
Introduction
Sepsis is caused by invasion of microorganisms from a local septic focus into the bloodstream, resulting in signs of systemic illness in distant organs.1 The innate immunoresponse to bacterial endotoxins stimulates the production of three proinflammatory cytokines from macrophages: TNF, IL1β, and IL6. These cytokines produce a syndrome characteristic of early sepsis called systemic inflammatory response syndrome (SIRS). In cases of severe sepsis, multiple-organ dysfunction occurs.2 In the late stages of severe sepsis, “septic shock,” patients develop cardiovascular collapse and become unresponsive to vasopressor therapy and fluid resuscitation, in addition to exhibiting cellular/metabolic abnormalities that increase mortality.3
Early diagnosis of sepsis is essential for prompt management, especially in high-risk patients with suspected infection, and to improve prognosis and prevent septic shock and severe sepsis, thereby reducing mortality. It is thus essential to find a valid rapid diagnostic method for sepsis. Microbiological diagnosis by blood culture is the gold standard for diagnosis of sepsis; however, it takes a long time to obtain positive results, as it depends on the growth of organisms. It is essential to focus on other sepsis biomarkers that allow rapid diagnosis of sepsis within minutes and can differentiate infection from uninfectious inflammation and predict prognosis in sepsis.4
Sepsis biomarkers are classified according to their pathophysiological nature: biomarkers of the proinflammatory phase,5 ie, acute‑phase mediators, such as CRP and procalcitonin, receptor biomarkers like suPAR and sTREM1, and cell‑surface biomarkers, such as presepsin and cytokine/chemokine biomarkers; biomarkers of the immunosuppressive phase, ie, cell‑surface and cytokine biomarkers; cell damage biomarkers, ie, micro‑RNAs; vasodilation biomarkers, ie, adrenomedullin and proadrenomedullin; and endothelial damage biomarkers, heparin‑binding protein, E‑selectin, and L‑selectin.6 Sepsis biomarkers are classified into three categories according to their use in diagnosis or evaluation of the prognosis of the disease: biomarkers of diagnostic and prognostic value, such as presepsin, calcitonin, sTREM1, pro‑ADM, and micro‑RNAs; biomarkers of diagnostic value, such as CRP, TNF, IL1β, IL6, IL8, IL11, and IL18; and biomarkers of prognostic value, such as highly sensitive cardiac troponin T and suPAR.7
TREM1 is a member of an immunoglobulin superfamily predominantly expressed on neutrophils, monocytes, and macrophages. It is a myeloid marker serving as a specific indicator of myeloid-leukocyte deployment in response to bacterial infection. It is poorly expressed in uninfectious inflammation, so it is effective in predicting sepsis severity.8 In the immunological response to bacterial and fungal infections, TREM1 is upregulated and expressed on the surface of monocytes and neutrophils, followed by activation of these cells with subsequent production of proinflammatory cytokines and oxidative burst.9 The soluble form of TREM1 (sTREM1) is shed from the surface of neutrophils and monocytes into body fluids, including plasma, pleural effusion, sputum, and urine, and can then be measured directly by immunosorbent assays. Therefore, sTREM1 could be used as a rapid tool to differentiate infection from uninfectious inflammation and in the diagnosis of sepsis.10
uPAR is important in the pathogenesis of sepsis, and is expressed on most leukocytes, including neutrophils, lymphocytes, monocytes, and macrophages. uPAR binds to its ligand, uPAR, resulting in several immunological events, such as cell migration, adhesion, and proliferation. uPAR is cleaved from the cell surface to the soluble form of the receptor — suPAR.11
The aim of this study was to evaluate the value of sTREM1 in diagnosis of sepsis and to assess the prognostic value of sTREM1 and suPAR in comparison to other prognostic predictors used in patients with sepsis, such as SOFA score, APACHE II score, and 28-day mortality.
Methods
This cross-sectional study was conducted at the Medical Microbiology and Immunology Department and Central Research Laboratory, Faculty of Medicine, Sohag University from June 2019 to January 2021. A total of 67 patients were included admitted to different intensive-care units (ICUs) in Sohag University Hospital. Theey were divided into two groups: patients meeting SIRS criteria (n=25) and patients with sepsis (n=42).
Inclusion criteria were admission to the ICU with signs of possible SIRS or sepsis exhibiting two or more of the following signs during their first 24 hours in the ICU: temperature >38°C, heart rate >90 beats/min, respiratory rate >20 breaths/min with partial pressure of arterial carbon dioxide <32 mmHg, and white blood–cell count >12,000 cells/mm3. Exclusion criteria were HIV infection, neutropenia<1,000 cells/mm3, and<18 years of age.
Data collected on patients admitted to the ICU were age, sex, diagnosis on admission, vital signs, site of infection, duration of stay in ICU, arterial blood gases, liver and kidney function, leukocyte count, and level of CRP. The APACHE II score12 was evaluated for all patients. The SOFA score12 was also used to determine the extent of organ dysfunction. This evaluates cardiovascular, respiratory, hepatic, coagulation, renal, and neurological function.
The study population was divided into two groups: SIRS (no evidence of infection) and sepsis (evidence of SIRS, with such signs as catheter-related bloodstream infection, urinary tract infection, chest infection, intra-abdominal infection, and surgical site infection. Blood samples were collected in plain tubes on the day of initial laboratory evaluation for sepsis and repeated on the seventh day. Blood samples were centrifuged for 15 minutes at 3,000 rpm/min for separation of serum. Sera were stored at −70°C until testing. Blood samples used for blood culture were aspirated after thorough disinfection of the aspiration site and added directly to the culture medium (5–10 mL whole blood in 50–100 mL brain–heart infusion broth).
Presence of infection was defined according to the clinical and microbiological criteria of the CDC. Blood culture–positive bacteremia was defined as growth of bacteria with recognized pathogenic capacity in one blood culture or growth of common skin pathogens (ie, coagulase-negative Staphylococcus spp., diphtheroids, Bacillus spp., Propionibacterium spp., or micrococci) in two blood cultures.
Blood samples were collected under completely aseptic conditions, put into two blood-culture bottles, and incubated at 37°C for 14 days. One blood culture bottle was incubated anaerobically. Subcultures were taken every 48 hours on mannitol salt agar, bile esculin azide agar, cetrimide agar, Sabouraud dextrose agar, and MacConkey agar. The organisms isolated were identified down to the species level with the Vitek II automated identification system according to the manufacturer’s instructions.
Quantitative Measurement of sTREM1 and suPAR by ELISA
Sera collected from patients were used for measurement of the two sepsis biomarkers sTREM1 and suPAR (ELISA kit, Glory Science) according to the manufacturer’s instructions.
Ethics
The study protocol was approved by the local Ethics Committee on Scientific Research of the Faculty of Medicine, Sohag University. Informed written consent was obtained from all patients or first-degree relatives for illiterate patients after oral commitment. The study was also registered (clinicaltrials.gov: NCT04767893) and it complied with the Declaration of Helsinki.
Statistical Analysis
Data were analyzed using Stata 14.2 (StataCorp). Quantitative data are represented as means ± SD, medians, and ranges. Student’s t-test was used to compare means of two groups. When data were not normally distributed, the Mann–Whitney U test was used. A receiver-operating characteristic (ROC) curve and area under the curve (AUC) were used to determine cutoffs for diagnosis of sepsis and prediction of mortality. Sensitivity, specificity, positive predictive value, and negative predictive value were also calculated. P<0.05 was considered significant.
Results
The mean age of patients in the SIRS group was 45±16 years, 51±19 years in the sepsis group with positive blood cultures, and 53±21 years in the sepsis group with negative blood cultures. Among patients with SIRS, there were 16 (64%) men and nine (36%) women, and among those with sepsis there were 26 (62%) women and 16 (38%) men. According to microbial culture results, sepsis patients were further classified into a blood culture–positive group (n=13) and a blood culture–negative group (n=29). Based on 28-day mortality, sepsis patients were further divided into survivors (n=33) and nonsurvivors (n=9) (Table 1).
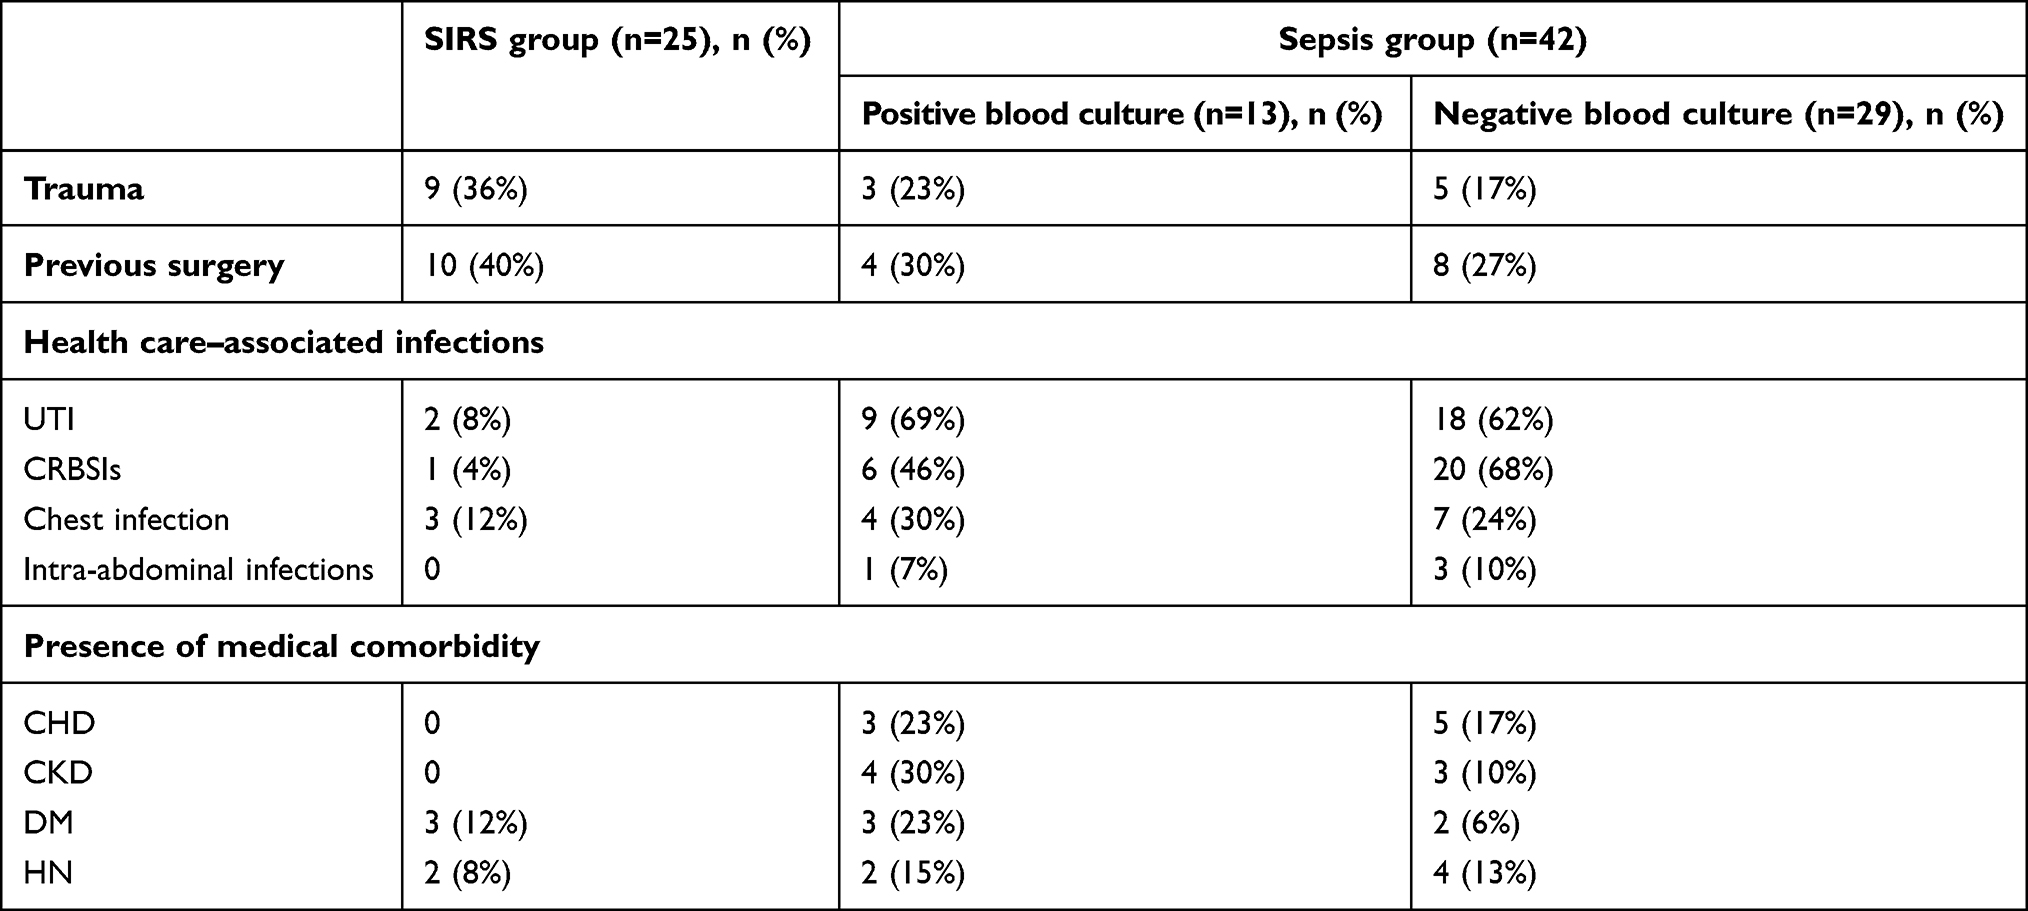 |
Table 1 Patient groups and clinical data |
sTREM1 as a Diagnostic and Prognostic Marker
CRP and sTREM1 values were significantly higher in the sepsis group than the SIRS group on both the first and seventh days, as shown in Table 2 and Figure 1. There was no statistically significant difference between sTREM1 values in patients with positive blood cultures and those with negative blood cultures, which means that sTREM1 is not suitable as a marker for positive blood cultures (Table 3, Figure 2).
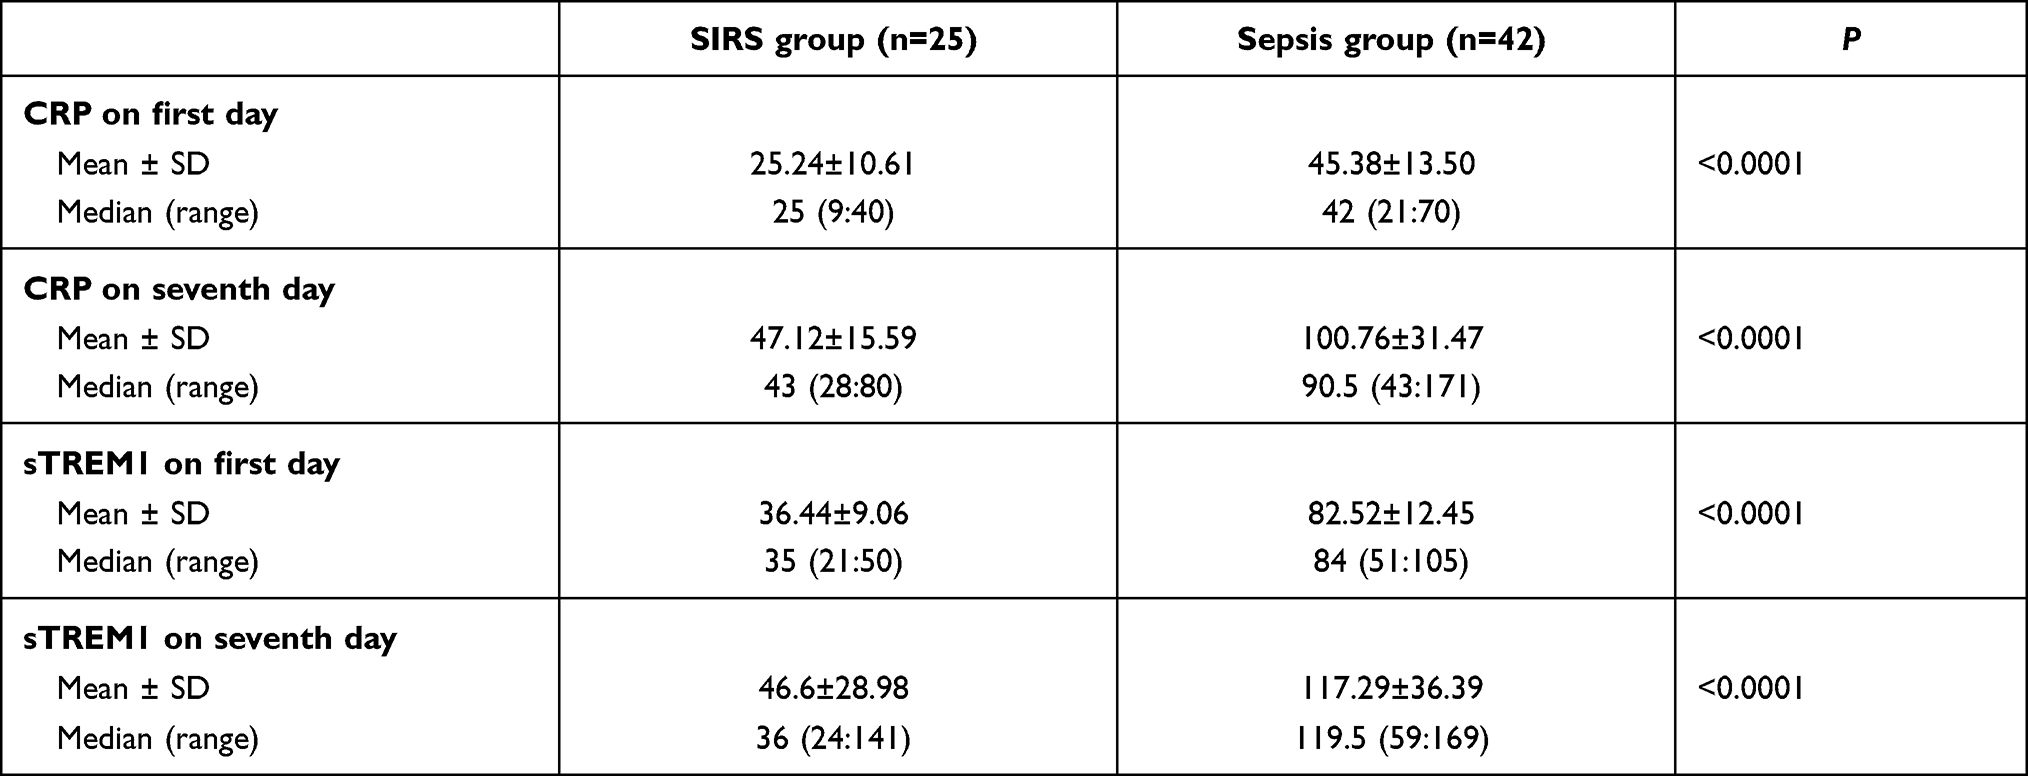 |
Table 2 Comparison between SIRS and sepsis group as regards CRP and sTREM1 |
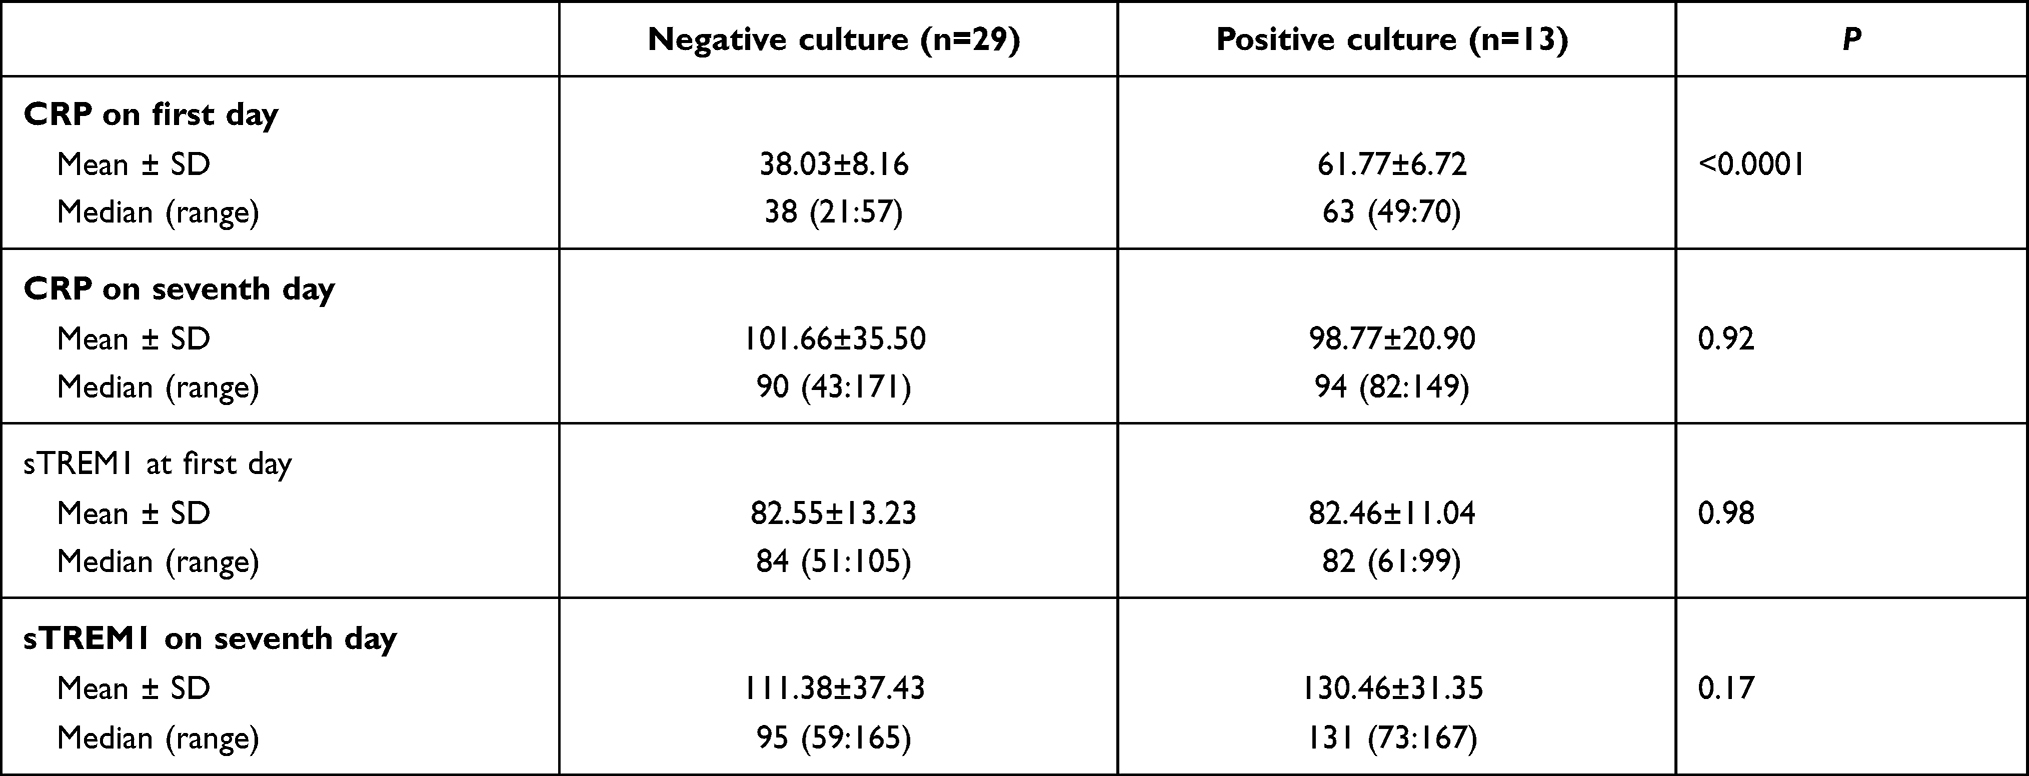 |
Table 3 Comparison between negative blood–culture and positive blood–culture groups as regards CRP and sTREM1 |
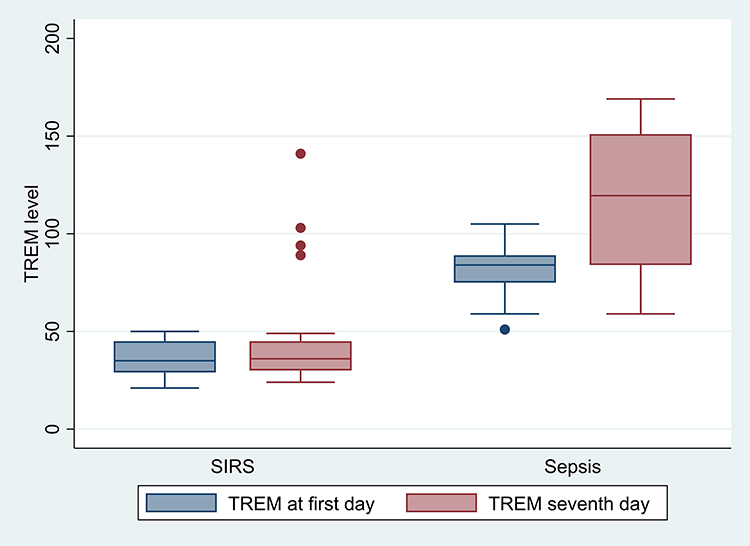 |
Figure 1 Comparison between SIRS and sepsis groups as regards sTREM1. |
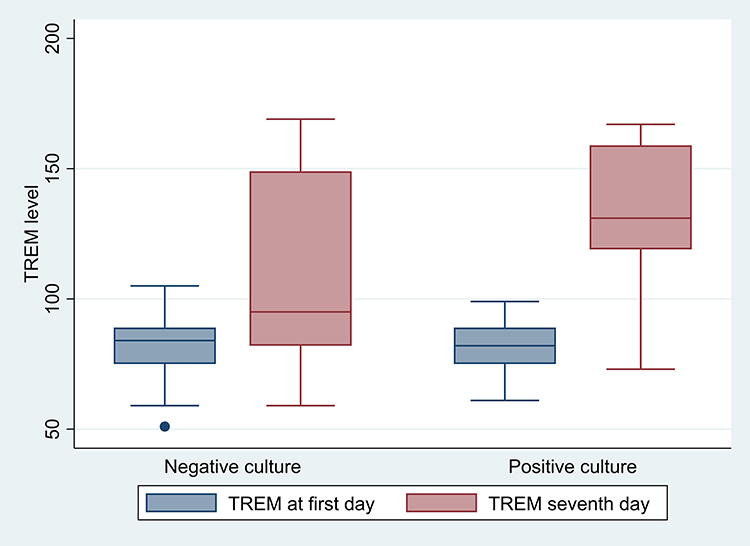 |
Figure 2 Comparison between negative blood–culture and positive blood–culture groups as regards sTREM1. |
ROC curves were calculated to compare CRP and sTREM1 for diagnosis of sepsis, and we found a significant difference between the SIRS and sepsis groups (Figure 3, Table 4). The AUC for CRP was 0.87 on the first day and 0.97 on the seventh day, while the AUC for sTREM1 was 1 and 0.93 on the first and seventh days, respectively. When the cutoff for sTREM1 was 49 pg/mL, its sensitivity was 100% and specificity 84%.
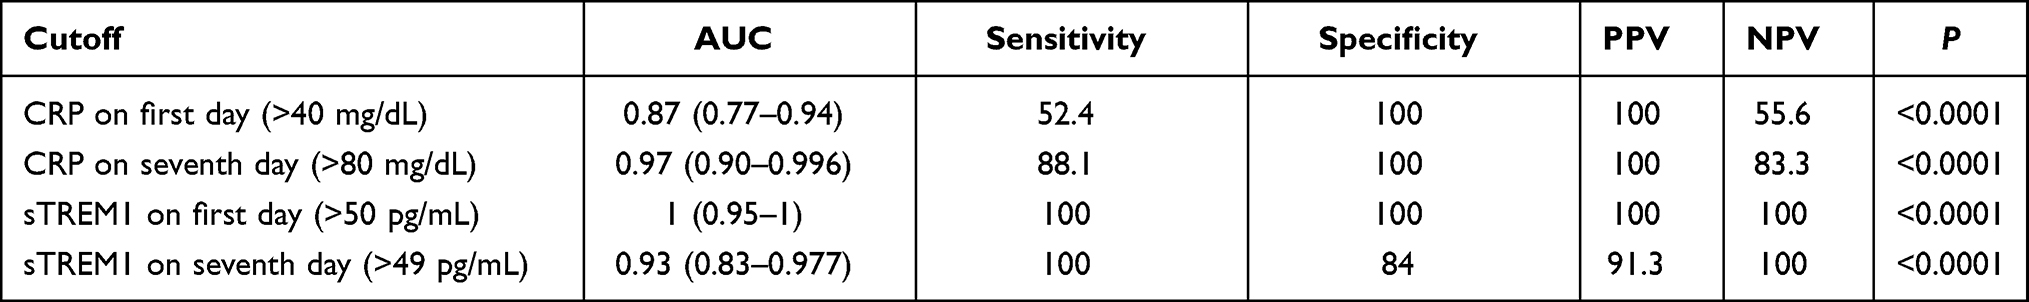 |
Table 4 Optimum diagnostic cutoff, AUC (95% CI), sensitivity, specificity, and positive and negative predictive values of CRP and sTREM1 for diagnosis of sepsis |
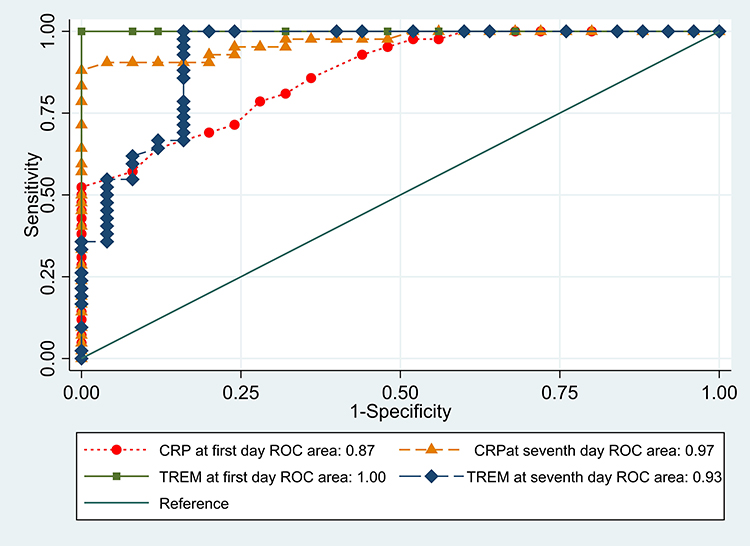 |
Figure 3 Receiver-operating characteristic (ROC) curves comparing CRP and sTREM1 for diagnosis of sepsis. |
Correlation coefficients were calculated to determine the relationship between serum levels of CRP and sTREM1, and there was significant positive correlation between them on the first day (r=0.52, P=0.0001) and the seventh day, (r=0.58, P=0.0001), as shown in Table 5.
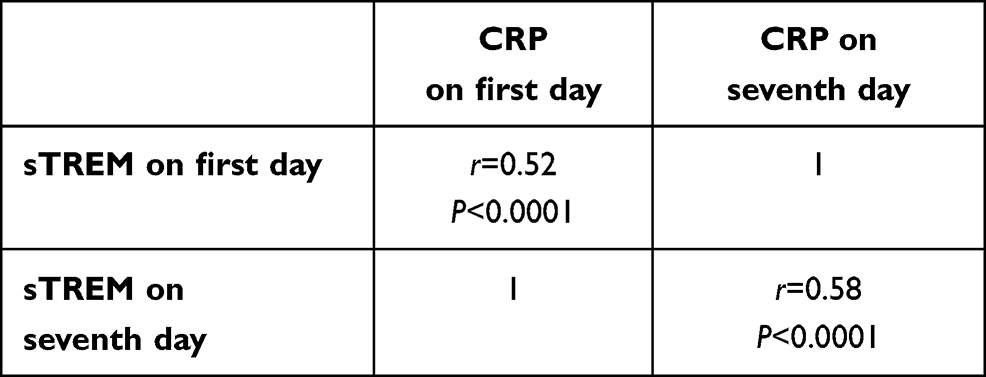 |
Table 5 Correlations between CRP and sTREM1 levels |
There was no statistically significant difference in median serum levels of sTREM1 between survivors 84 (51–105) and nonsurvivors 84 (61–103) on the first day (P=0.92) and between both groups on the seventh day (120, 59–169; 98, 73–167; P=0.94), respectively (Figure 4).
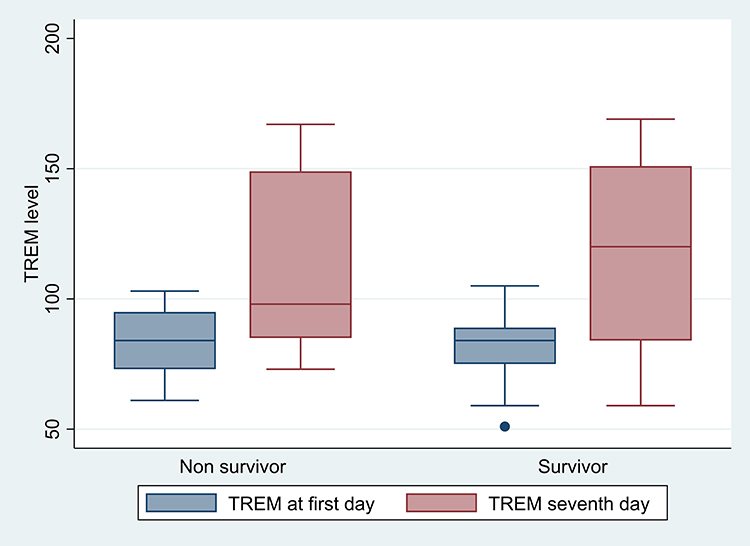 |
Figure 4 Comparison between nonsurvivor and survivors as regards TREM. |
suPAR as a Prognostic Marker
Clinical severity scores were used as predictors of poor prognosis. Sepsis patients had higher SOFA and APACHE II scores than SIRS patients (Tables 6 and 7). On the measure of 28-day mortality, 33 patients in the sepsis group survived and nine died. There was no significant difference in median suPAR levels between survivors and nonsurvivors on the first day (P=0.14). On the seventh day, nonsurvivors had significantly higher serum suPAR (median 4.9 ng/mL) than survivors (median 2.9 ng/mL; P<0.0001) as shown in Figure 5. Also, nonsurvivors had significantly higher SOFA and APACHE II scores than survivors (P<0.0001 and P<0.0001, respectively), as shown in Table 8.
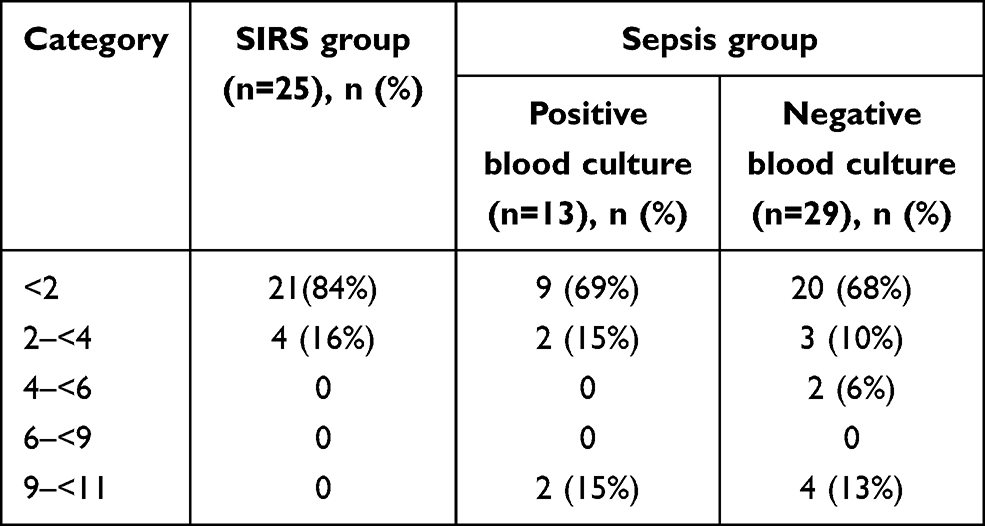 |
Table 6 Categories of SOFA ccore |
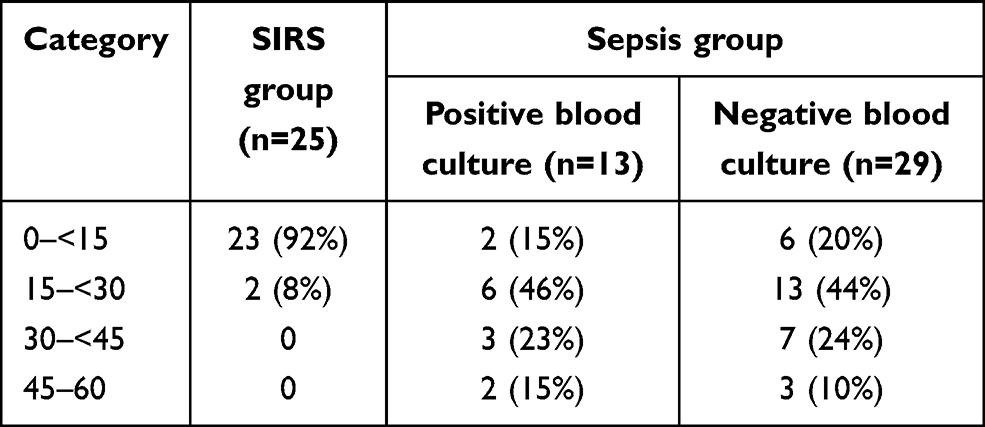 |
Table 7 Categories of APACHE II score |
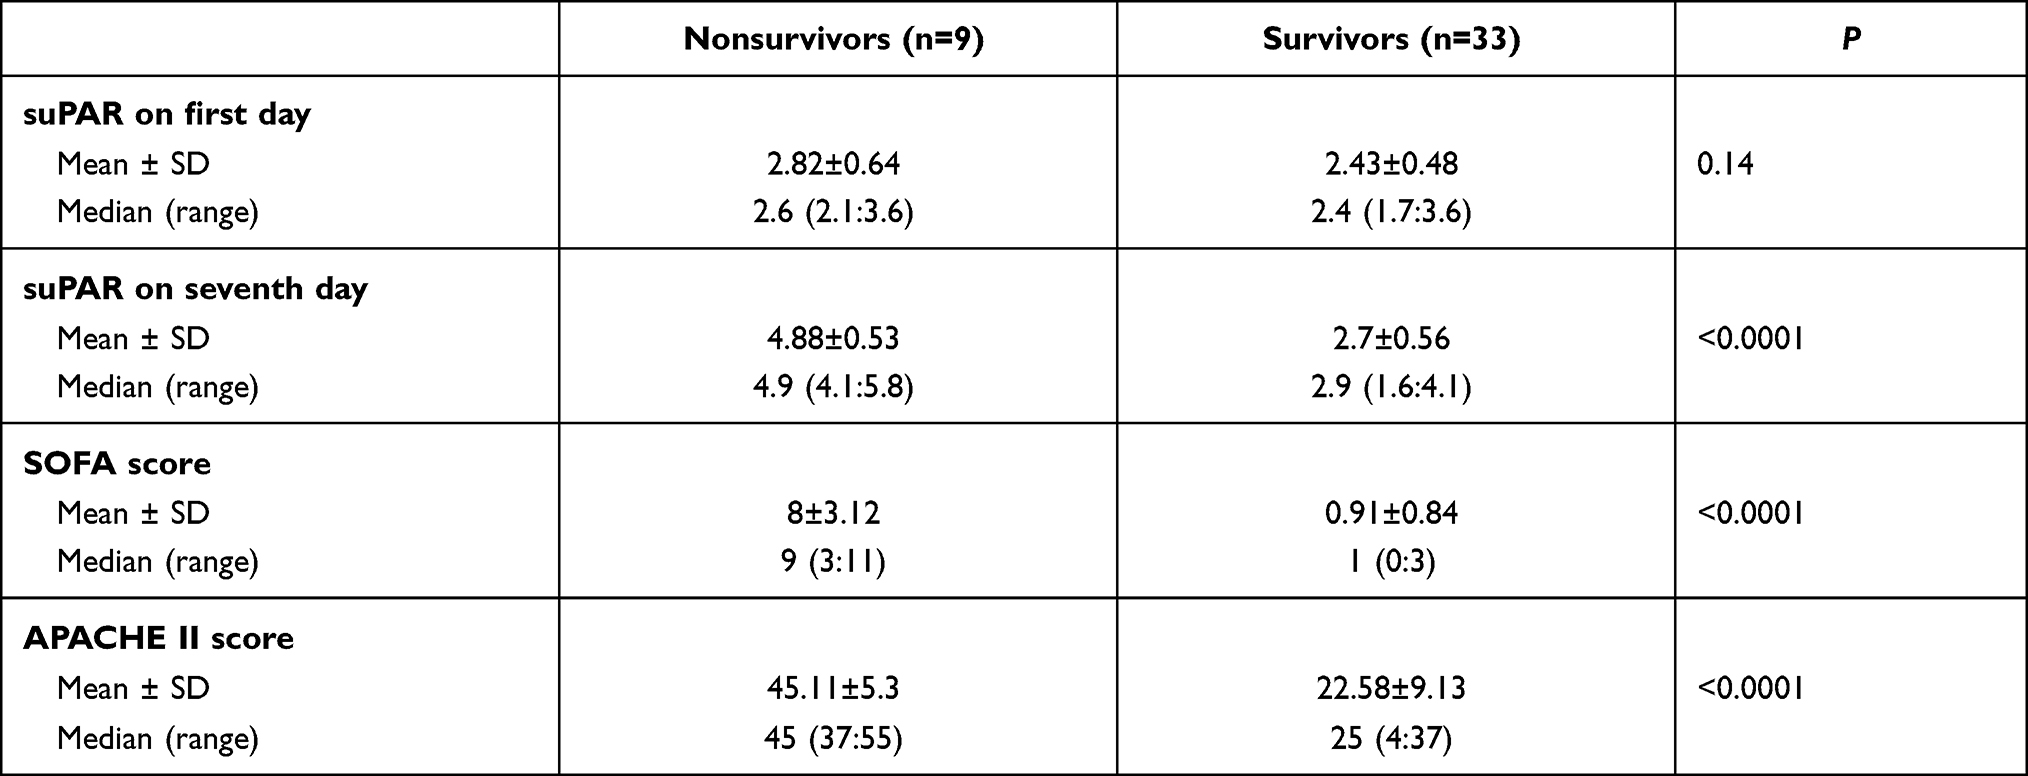 |
Table 8 Comparison between nonsurvivors and survivors as regards suPAR |
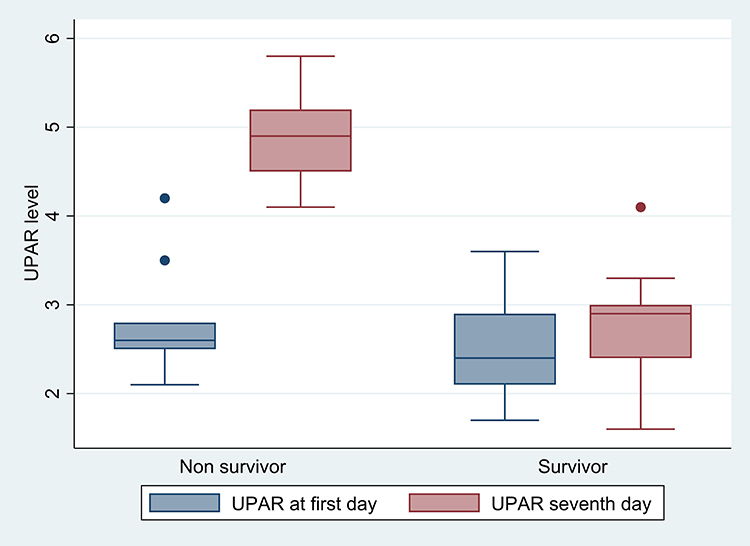 |
Figure 5 Comparison between nonsurvivor and survivors as regards suPAR. |
ROC analysis indicated that AUCs for APACHE II scores and serum levels of suPAR on the seventh day were equal 0.998 (0.92–1). Coordinate points of ROCs defined an APACHE II score of at least 36 as the cutoff and specificity of 97% in predicting death. Also, suPAR of at least 3.3 ng/mL had specificity of 96.7% in predicting death (Figure 6, Table 9).
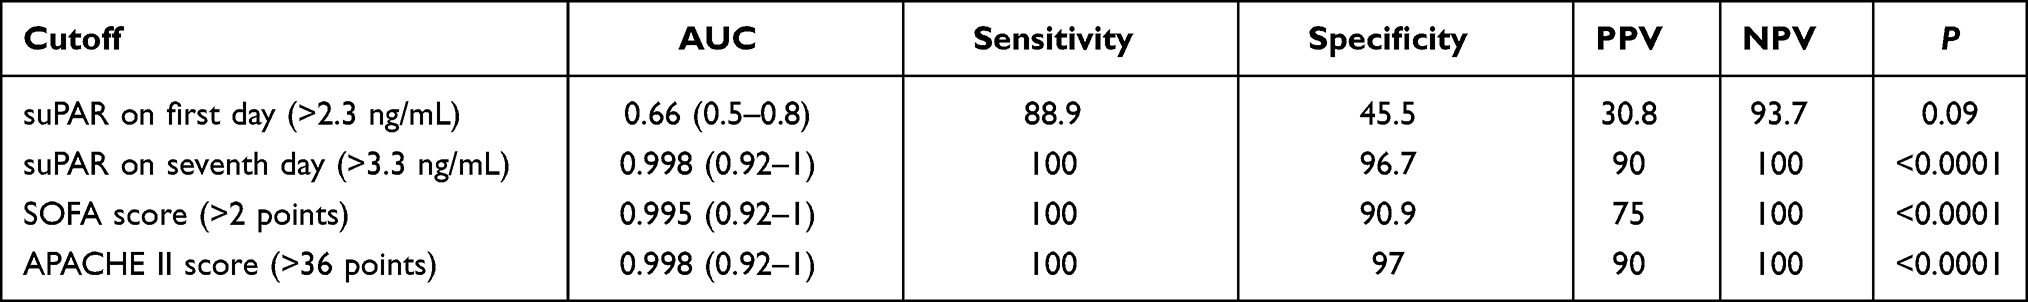 |
Table 9 Optimum diagnostic cutoff, AUC (95% CI), sensitivity, specificity, and positive and negative predictive values of suPAR and SOFA and APACHE II scores for prediction of mortality |
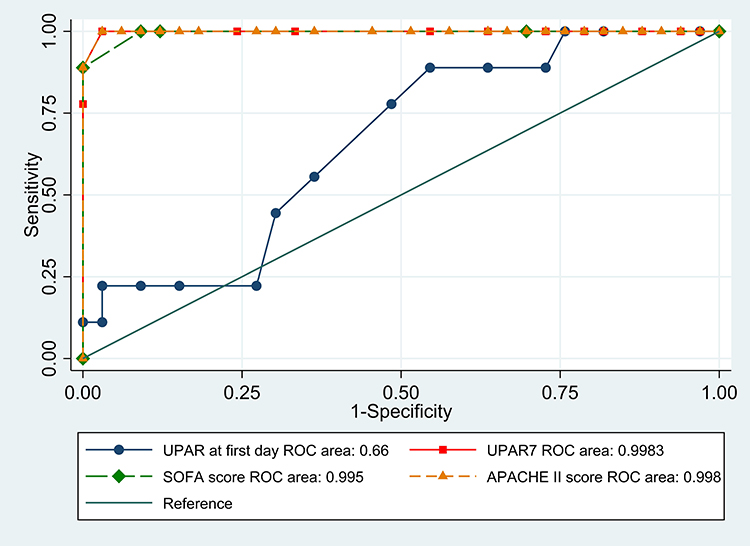 |
Figure 6 Receiver-operating characteristic (ROC) curves comparing suPAR. |
There was a nonsignificant positive correlation between SOFA scores and the suPAR levels on the first day (r=0.17, P=0.29). There was also a nonsignificant positive correlation between APACHE II scores and suPAR levels on the first day (r=0.05, P=0.77). There was a highly significant positive correlation between SOFA (Figure 7) and APACHE II (Figure 8) scores and suPAR levels on the seventh day (r=0.81, P<0.0001; r=0.97, P=0.0001, respectively; Table 10).
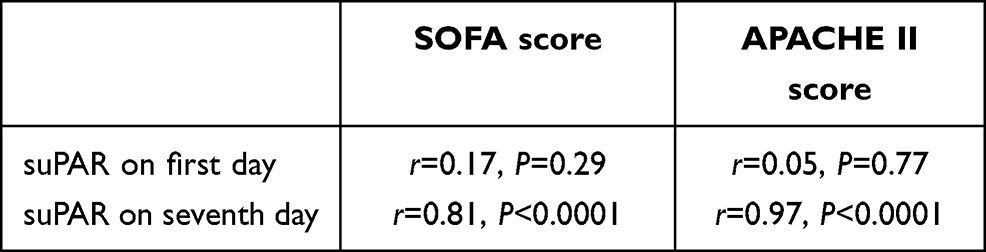 |
Table 10 Correlations between SOFA scores, APACHE II scores, and suPAR |
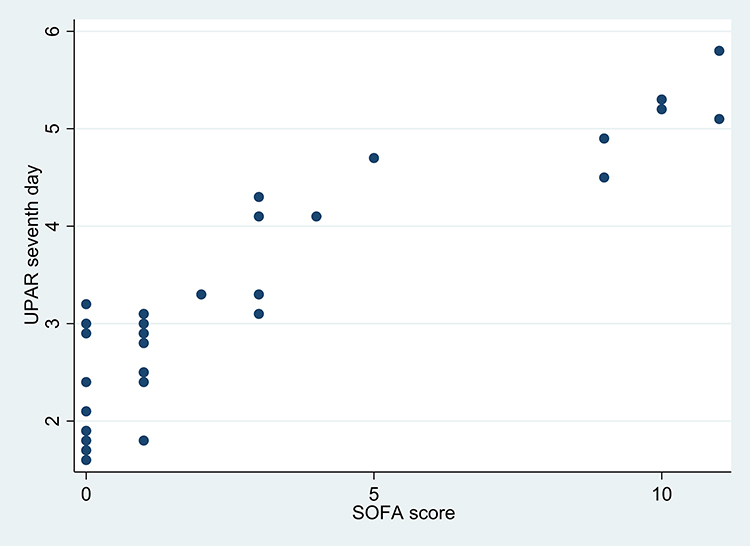 |
Figure 7 Scatter diagram showing the correlation between SOFA scores and suPAR on the seventh day. |
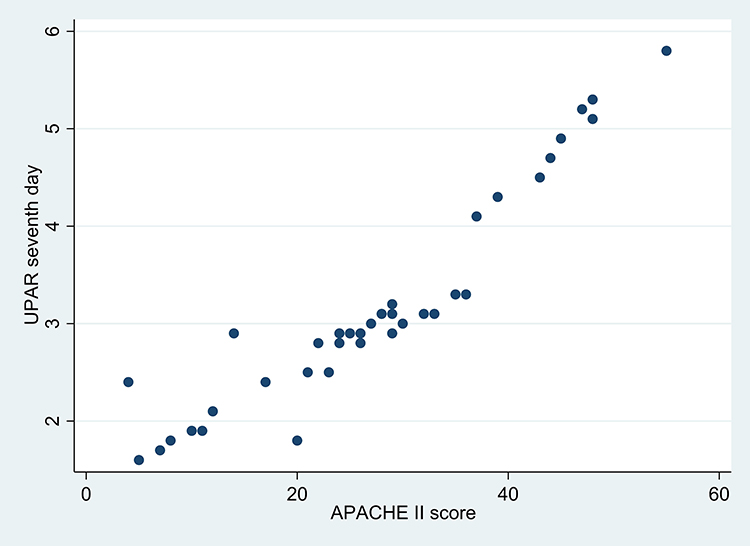 |
Figure 8 Scatter diagram showing the correlation between APACHE II scores and suPAR on the seventh day. |
Discussion
Sepsis is a complex process that involves inflammatory and anti-inflammatory cascade processes, humoral and cell-mediated immunoresponse, and circulatory disturbances. Clinical findings have limited value in assessing severity and determining prognosis in sepsis. Therefore, clinicians need reliable biomarkers for rapid early diagnosis and to establish an appropriate management strategy. Although some biomarkers are already in use, studies to identify more sensitive and specific biomarkers of sepsis are ongoing. Biomarkers have mainly been employed in sepsis management for four reasons: early diagnosis, determining the prognosis, staging, and monitoring the response to treatment.13
Serum CRP is a biomarker involved in a variety of inflammatory diseases, and is a widely studied biomarker in sepsis patients.1 Whether CRP is a good biomarker for early diagnosis of sepsis is still controversial, but a majority of hospitals can implement CRP analysis in sepsis diagnosis and prognosis.14
In the current study, CRP and sTREM1 values were significantly higher in the sepsis group than the SIRS group on both the first and seventh days. ROC curves were constructed to compare CRP and sTREM1 for diagnosis of sepsis and revealed that there was a significant difference between the SIRS and sepsis groups. The AUC for CRP was 0.87 and 0.97 and for sTREM1 1 and 0.93 on the first and seventh days, respectively. When the cutoff for sTREM1 was 49 pg/mL, its sensitivity was 100% and specificity 84%.
Consistently with our results, Rivera-Chavez et al15 found that sTREM1 levels were significantly higher in patients with sepsis than in patients with SIRS. sTREM1 accurately identified patients suffering from sepsis at a cutoff of 30 pg/mL with 96% sensitivity and 91% specificity. However, Su et al16 detected significant differences in sTREM1 and CRP between SIRS and sepsis groups. Their AUC for sTREM1 and CRP levels were 0.868 (0.798–0.938) and 0.679 (0.578–0.771), respectively. Also, when the cutoff for sTREM1 was 108.9 pg/mL, sensitivity was 0.83 and specificity 0.81.
Based on the present findings, sTREM1 was a mediator of infection rather than inflammation, because there was a significant difference in biomarker levels between the SIRS and sepsis groups. Consistently with the results of this study, Oku et al17 found that plasma sTREM1 levels in septic patients were significantly higher than in SIRS patients.
Inconsistently with this study’s results, Jedynak et al12 considered sTREM1 a mediator of inflammation, because there was no difference in sTREM levels between SIRS and sepsis groups.
However, a recent meta-analysis study by Chung et al18 of 19 trials found that sTREM1 was moderately accurate in diagnosis of sepsis in high-risk patients, with pooled sensitivity of 0.82 (95% CI 0.73–0.89), specificity of 0.81 (95% CI 0.74–0.86), and AUC of 0.88 (95% CI 0.85–0.91).
Correlation coefficients were calculated in this study to determine the relationship between serum levels of CRP and sTREM1, and there is a significant positive correlation between CRP and sTREM values on the first day (r=0.52) and the seventh day (r=0.58).
Although microbiological diagnosis of sepsis is the ultimate diagnostic method, it has delayed results and poor sensitivity. In this study, according to the blood-culture results, we divided sepsis patients into blood culture–positive and blood culture–negative groups. sTREM1 levels on the seventh day were higher in the blood culture–positive group, but not significantly (P=0.17). As such, sTREM1 is not suitable for use as a marker for positive blood cultures. However, CRP levels on the first day were significantly higher in the blood culture–positive group than the blood culture–negative group (P<0.0001). In contrast to our results, Su et al16 detected significantly higher CRP levels in a blood culture–negative group than a bacteremia group (P=0.033).
In this study, sTREM1 was not found to be a good prognostic biomarker, because there was no statistically significant difference between survivors and nonsurvivors regarding the median serum levels of sTREM1 on the first day (P=0.92) and the seventh day (P=0.94), so sTREM1 levels were not compared to clinical severity scores. Similar findings were reported by Zhang et al,19 who evaluated sepsis patients and found that sTREM1 serum levels were higher in nonsurvivors than survivors, but with no statistical significance. Inconsistently with our results, Li et al20 evaluated the prognostic value of sTREM1 in sepsis patients, and found that on day 1 the nonsurvivor group had significantly higher serum-sTREM1 levels than those in the survival group: serum sTREM1 decreased in the survival group and increased in the nonsurvivor group. Also, Zhang and Zhang21 found that serum TREM1 was elevated significantly in patients who died within 28 days. These results support the use of sTREM1 as a prognostic indicator for evaluating the death risk of patients with sepsis. Discrepancies among these results could be attributed to different sample sizes or the presence of different associated comorbidities in the sepsis group.
When used alone, the clinical scoring systems SOFA and APACHE II can give misleading scores, because they can be affected by a single deteriorated parameter, giving a false impression of overall clinical condition. For example, young patients with severe sepsis but without chronic organ failure may have relatively low APACHE II scores, despite the risk of an unfavorable outcome. In contrast, older septic patients with chronic organ failure may have high APACHE II scores,22 so the use of combined indicators to predict sepsis mortality can be effective in improving accuracy when the risk of dying from sepsis is low. We propose improving prognosis according to clinical severity scores using stratification by serum-suPAR biomarkers, whicht are easily measured and provide information rapidly within 1 hour.
Based on 28-day mortality, the sepsis group was classified into survivors (n=33) and nonsurvivors (n=9). There was no significant difference in median suPAR levels between survivors and nonsurvivors on the first day, while on the seventh day nonsurvivors had significantly higher serum levels of suPAR. Also, nonsurvivors had significantly higher SOFA and APACHE II scores than survivors. We found that APACHE II, SOFA, and suPAR level, on the seventh day were good independent prognostic variables for predicting 28-day mortality, with overall mortality of 21.4%. Koch et al23 found good correlations between high serum levels of suPAR in the first week of treatment and mortality in sepsis patients.
ROC analysis indicated that AUCs for APACHE II score and serum levels of suPAR on the seventh day were equal 0.998 (0.92–1). Also, there was a highly significant positive correlation between APACHE II scores and suPAR values on the seventh day (r=0.97). Coordinate points of ROCs defined an APACHE II score of at least 36 as a cutoff and specificity of 97% to predict mortality. Also, suPAR of at least 3.3 ng/mL yielded specificity of 96.7% in predicting mortality. This suggests that combining the APACHE II score with the serum suPAR level could be a measurement for predicting sepsis outcomes. These findings are consistent with those of Giamarellos-Bourboulis et al,22 in which serum suPAR was significantly higher in nonsurvivors than survivors. In contrast to our results, Gustafsson et al11 found that suPAR levels were significantly elevated in sepsis patients compared to controls, but not significantly higher in nonsurvivors than survivors in sepsis patients.
The strong point of our study is that it was conducted on a typical study population of patients who were admitted to different ICUs, and serum biomarkers were measured twice throughout 7 days. However, there are several limitations. First is the small study sample, especially nonsurvivors. Second, the majority of the samples were collected after antibiotic therapy had begun, and that may have affected the results of blood cultures. Third, the sepsis group had different associated comorbidities. This is the first study in our facility conducted to study the value of these biomarkers in diagnosis and prognosis of sepsis, and according to our results, we advise using serum levels of sTREM1 and suPAR in addition to traditional laboratory findings and microbiological and clinical methods to provide rapid diagnosis and treatment for patients with sepsis.
We recommend conducting further studies on larger samples, excluding patients with comorbidities, and concentrating on anti-TREM1 interventions that would be efficient therapeutic strategies for the treatment of sepsis through modulation of TREM1.
Conclusion
This study revealed that sTREM1 can be used as a good indicator for diagnosis of sepsis in ICU patients, but cannot predict prognosis. However, we can rely on it as a rapid diagnostic tool for prompt management in these patients. suPAR can also be used as a predictor of poor prognosis and poor survival if a patient develops higher serum levels with time, and it is not affected by clinical parameters that may affect SOFA and APACHE II scores, which could be misleading to health-care providers.
Data Sharing Statement
The authors have agreed not to publish the raw data of the patients in this study; however, the data sets collected and analyzed are available on request from the corresponding author.
Disclosure
The authors declare that they have no financial or nonfinancial conflicts of interest related to the work reported in the manuscript. Each author listed in the manuscript has seen and approved the submission of this version of the manuscript and takes full responsibility for it. This article has not been published anywhere, and is not currently under consideration by another journal or publisher.
References
1. Henriquez-Camacho C, Losa J. Biomarkers for sepsis. Bio Med Res Int. 2014;ID 547818:1–6.
2. Balk R. The evolving paradigms of sepsis. Contrib Microbiol. 2011;17:1–11.
3. Faix JD. Biomarkers of sepsis. Crit Rev Clin Lab Sci. 2013;50(1):23–36. doi:10.3109/10408363.2013.764490
4. Godnic M, Stubjar D, Skvarc M, Jukic T. Diagnostic and prognostic value of sCD14‑ST presepsin for patients admitted to hospital intensive care unit. Wien Klin Wochenschr. 2015;127:521–527. doi:10.1007/s00508-015-0719-5
5. Biron BM, Ayala A, Lomas-Neira JL. Biomarkers for sepsis: what is and what might be? Biomark Insights. 2015;10(4):7–17.
6. Atalla HA, Abdelaziz AA, Ragab AM. Biomarkers in sepsis: review article. Menoufia Med J. 2018;31(4):1110–1115.
7. Erickson SE, Martin GS. Effect of sepsis therapies on health‑related quality of life. Crit Care. 2008;12(1):109. doi:10.1186/cc6215
8. Wang B, Chen G, Zhang J, Xue J, Cao Y, Wu Y. Increased neutrophil gelatinase associated lipocalin is associated with mortality and multiple organ dysfunction syndrome in severe sepsis and septic shock. Shock. 2015;44(3):234–238. doi:10.1097/SHK.0000000000000408
9. Jedynak M, Siemiatkowski A, Mroczko B, Groblewska M, Milewski R, Szmitkowski M. Soluble TREM-1 serum level can early predict mortality of patients with sepsis, severe sepsis and septic shock. Arch Immunol Ther Exp. 2018;66(4):299–306. doi:10.1007/s00005-017-0499-x
10. Cao C, Gu J, Zhang J. Soluble triggering receptor expressed on myeloid cell-1 (sTREM-1): a potential biomarker for the diagnosis of infectious diseases. Front Med. 2017;11(2):169–177. doi:10.1007/s11684-017-0505-z
11. Gustafsson A, Ljunggren L, Bodelsson M, Berkestedt I. The prognostic value of suPAR compared to other inflammatory markers in patients with severe sepsis. Biomark Insights. 2012;7:39–44. doi:10.4137/BMI.S9460
12. Jedynak M, Siemiatkowski A, Milewski R, Mroczko B, Szmitkowski M. Diagnostic effectiveness of soluble triggering receptor expressed on myeloid cells-1 in sepsis, severe sepsis and septic shock. Arch Med Sci. 2019;15(3):713–721. doi:10.5114/aoms.2018.73090
13. Şen S, Kamit F, Işgüder R, et al. Surface TREM-1 as a prognostic biomarker in pediatric sepsis. Indian J Pediatr. 2021;88(2):134–140. doi:10.1007/s12098-020-03355-3
14. Lee CC, Hong MY, Lee NY, Chen PL, Chang CM, Ko WC. Pitfalls in using serum C-reactive protein to predict bacteremia in febrile adults in the ED. Am J Emerg Med. 2012;30(4):562–569. doi:10.1016/j.ajem.2011.02.012
15. Rivera-Chavez FA, Minei JP. Soluble triggering receptor expressed on myeloid cells-1 is an early marker of infection in the surgical intensive care unit. Surg Infect (Larchmt). 2009;10(5):435–439. doi:10.1089/sur.2009.030
16. Su L, Han B, Liu B, et al. Value of soluble TREM-1, procalcitonin, and C-reactive protein serum levels as biomarkers for detecting bacteremia among sepsis patients with new fever in intensive care units: a prospective cohort study. BMC Infect Dis. 2012;12:157. doi:10.1186/1471-2334-12-157
17. Oku R, Oda S, Nakada T, et al. Differential pattern of cell-surface and soluble TREM-1 between sepsis and SIRS. Cytokine. 2013;61(1):112–117. doi:10.1016/j.cyto.2012.09.003
18. Chang W, Peng F, Meng SS, Xu JY, Yang Y. Diagnostic value of serum soluble triggering expressed receptor on myeloid cells 1 (sTREM-1) in suspected sepsis: a meta-analysis. BMC Immunol. 2020;21(2):1–3. doi:10.1186/s12865-020-0332-x
19. Zhang J, She D, Feng D, Jia Y, Xie L. Dynamic changes of serum soluble triggering receptor expressed on myeloid cells-1 (sTREM-1) reflect sepsis severity and can predict prognosis: a prospective study. BMC Infect Dis. 2011;11:53. doi:10.1186/1471-2334-11-53
20. Li Z, Wang H, Liu J, Chen B, Li G. Serum soluble triggering receptor expressed on myeloid cells-1 and procalcitonin can reflect sepsis severity and predict prognosis: a prospective cohort study. Mediators Inflamm. 2014;ID 641039:7.
21. Zhang L, Zhang X. Serum sTREM-1, PCT, CRP, Lac as biomarkers for death risk within 28 days in patients with severe sepsis. Open Life Sci. 2018;13:42–47. doi:10.1515/biol-2018-0006
22. Giamarellos-Bourboulis EJ, Norrby-Teglund A, Mylona V, et al. Risk assessment in sepsis: a new prognostication rule by APACHE II score and serum soluble urokinase plasminogen activator receptor. Crit Care. 2012;16(4):149–159. doi:10.1186/cc11463
23. Koch A, Voigt S, Kruschinski C, et al. Circulating soluble urokinase plasminogen activator receptor is stably elevated during the first week of treatment in the intensive care unit and predicts mortality in critically ill patients. Crit Care. 2011;15(1):R63. doi:10.1186/cc10037
 © 2021 The Author(s). This work is published and licensed by Dove Medical Press Limited. The
full terms of this license are available at https://www.dovepress.com/terms
and incorporate the Creative Commons Attribution
- Non Commercial (unported, 3.0) License.
By accessing the work you hereby accept the Terms. Non-commercial uses of the work are permitted
without any further permission from Dove Medical Press Limited, provided the work is properly
attributed. For permission for commercial use of this work, please see paragraphs 4.2 and 5 of our Terms.
© 2021 The Author(s). This work is published and licensed by Dove Medical Press Limited. The
full terms of this license are available at https://www.dovepress.com/terms
and incorporate the Creative Commons Attribution
- Non Commercial (unported, 3.0) License.
By accessing the work you hereby accept the Terms. Non-commercial uses of the work are permitted
without any further permission from Dove Medical Press Limited, provided the work is properly
attributed. For permission for commercial use of this work, please see paragraphs 4.2 and 5 of our Terms.