Back to Journals » Nature and Science of Sleep » Volume 14
Evaluation of Sleep Parameters and Sleep Staging (Slow Wave Sleep) in Athletes by Fitbit Alta HR, a Consumer Sleep Tracking Device
Authors Kawasaki Y ![]() , Kasai T
, Kasai T ![]() , Sakurama Y, Sekiguchi A, Kitamura E
, Sakurama Y, Sekiguchi A, Kitamura E ![]() , Midorikawa I, Shiroshita N
, Midorikawa I, Shiroshita N ![]() , Kawana F
, Kawana F ![]() , Ogasawara E
, Ogasawara E ![]() , Kitade M, Koikawa N, Matsuda T
, Kitade M, Koikawa N, Matsuda T
Received 2 December 2021
Accepted for publication 25 March 2022
Published 26 April 2022 Volume 2022:14 Pages 819—827
DOI https://doi.org/10.2147/NSS.S351274
Checked for plagiarism Yes
Review by Single anonymous peer review
Peer reviewer comments 2
Editor who approved publication: Prof. Dr. Ahmed BaHammam
Yu Kawasaki,1 Takatoshi Kasai,2– 5 Yuko Sakurama,6 Akiko Sekiguchi,6 Eri Kitamura,1 Itsuki Midorikawa,7 Nanako Shiroshita,4 Fusae Kawana,3 Etsuko Ogasawara,6,8 Mari Kitade,1,6 Natsue Koikawa,6,8 Takao Matsuda9
1Department of Obstetrics and Gynecology, Juntendo University Graduate School of Medicine, Tokyo, Japan; 2Department of Cardiovascular Medicine, Juntendo University Graduate School of Medicine, Tokyo, Japan; 3Cardiovascular Respiratory Sleep Medicine, Juntendo University Graduate School of Medicine, Tokyo, Japan; 4Department of Cardiovascular Management and Remote Monitoring, Juntendo University Graduate School of Medicine, Tokyo, Japan; 5Sleep and Sleep-Disordered Breathing Center, Juntendo University Hospital, Tokyo, Japan; 6Japanese Center for Research on Women in Sport, Juntendo University, Tokyo, Japan; 7Akita Northern Happinets, Akita, Japan; 8School of Health and Sports Science, Juntendo University, Chiba, Japan; 9Department of Gynecology, National Hospital Organization Nishi-Beppu National Hospital, Oita, Japan
Correspondence: Takatoshi Kasai, Department of Cardiovascular Medicine, Juntendo University Graduate School of Medicine, 3-1-3 Hongo, Bunkyo-ku, Tokyo, Japan, Tel/fax +81 3-6873-2869, Email [email protected]
Purpose: Sleep is an essential factor for athletes, and it is important to intervene in sleep to manage it. We need a device that can evaluate sleep easily and constantly. Consumer wearable devices can be useful tools for athletes. In order to use consumer wearable devices in clinical research, it is essential to conduct a validation study. Thus, we conducted a validation study to assess the Fitbit Alta HRTM (FBA)- a consumer wearable device with an accelerometer and a heart rate monitor to detect sleep stages and quality against electroencephalographic (EEG) studies in athletes.
Patients and Methods: Forty college athletes participated in the study. EEG was applied to participants simultaneously while wearing FBA.
Results: Regarding sleep parameters, there was a strong correlation between the total sleep time (TST)-EEG and the TST-Fitbit (r = 0.83; p < 0.001). Regarding the sleep stages, there was a modest correlation between the N3 sleep-EEG and the N3 sleep-Fitbit (r = 0.68; p < 0.001). In addition, there was a strong correlation between the percentage of N3 sleep in between sleep onset and initial rapid eye movement sleep-EEG and those on Fitbit (r = 0.73; p < 0.001).
Conclusion: These results demonstrate that FBA facilitates sleep monitoring and exhibits acceptable agreement with EEG. Therefore, FBA is a useful tool in athletes’ sleep management.
Keywords: athletes, wearable technology, sleep monitoring, electroencephalogram
Introduction
Sleep plays an essential role in the physical and psychological recovery in athletes. When sleep is inadequate, negative physiological and psychological effects on athletic performance are observed.1,2 It has been reported that prolonged sleep improves athletic performance. Thus, sleep is an essential factor in athletes’ health management.3 However, few studies have examined sleep duration and quality in athletes in detail.4,5
The gold standard for sleep assessment is polysomnography (PSG), which is difficult to perform in busy athletes. According to a review by Purvis et al, 20–60% of athletes suffer from stress due to excessive exercise and inadequate recovery.6 In this situation, it is difficult to find time to assess athletes’ sleep. Therefore, as an alternative to PSG, we measured athletes’ sleep quality using a two-channel portable electroencephalograph (EEG) device,7 which can be easily performed at home.8 However, the common problem with both PSG and EEG is that they cannot evaluate sleep continuously but only evaluate sleep quality over a limited period. These inspection methods may not be feasible for evaluating the sleep of athletes whose sleep environment changes during expeditions. Therefore, we focused on wearable technology that continuously monitors physical activity as a sleep evaluation device in athletes. We thought that Fitbit Alta HRTM (FBA; Fitbit, Inc.; San Francisco, CA, USA), which can evaluate sleep quality by combining acceleration measurement and heart rate variability (photoplethysmography-based heart rate sensors) with a unique algorithm, could be used as a sleep evaluation device.
Earlier generations of Fitbit models only detected body movements to determine sleep parameters. However, subsequently, by using photoplethysmography-based heart rate sensors to detect heart rate variability and body movements, recent Fitbit models can estimate sleep parameters and stages and heart rate while awake and sleeping.9 The Fitbit Charge 2TM uses a proprietary algorithm to combine speed measurements and heart rate variability in sleep assessment, which has been reported to detect sleep-wake states in healthy adults accurately, but with limited detection of N3 sleep.10 FBA is the successor to the Fitbit charge 2 TM and is a downsized and minimized version of it. While the FBA has been reported to detect the sleep-wake state in healthy adults accurately,11 it has been reported to be insufficiently accurate in specific clinical populations12. In particular, detecting sleep stages is different among the target populations, and no consistent results have been obtained.11–15
Based on these reports, we believe that it is essential to conduct validation studies to qualify Fitbit as a clinical device in general consumers. However, there are no reports that have validated FBA in athletes’ sleep evaluation. Furthermore, given the wide range of current consumer sleep tracking devices, rapid technological innovation, promising findings from recent performance studies, and the vital interest of athletes and leaders in the use of consumer sleep tracking devices, it is important to evaluate the effectiveness and reliability of FBA in determining athletes’ sleep parameters and stages. There is no debate that PSG is the gold standard for sleep testing, but it cannot be used for athletes’ actual day-to-day sleep management. Therefore, we are using EEG,7 validated in comparison with PSG as a substitute for PSG to manage and study sleep in athletes.
However, although the device used is a two-channel portable EEG device and electroencephalography can be easily performed at home than PSG, it requires disposable electrodes and batteries, making each test costly. Furthermore, it is not possible to evaluate sleep simply by wearing the device without prior preparation such as FBA.
We compared the degree to which sleep evaluation using a commercially available FBA was equivalent to that using a two-channel portable electroencephalograph and evaluated whether FBA would be useful as an alternative sleep testing device to a two-channel portable electroencephalograph.
Materials and Methods
Participants were recruited from basketball and collegiate track-and-field teams at Juntendo University School of Health and Sports Science. Exclusion criteria were the use of hypnotics, psychotropic drugs, psychostimulants, and analgesics. In addition, athletes with any condition that might interfere with sleep patterns, shift in work, or meridian travel within the past three months and during the study period were excluded. The study was conducted in accordance with the Declaration of Helsinki, and the protocol was approved by the Juntendo University Research Ethics Committee. Informed consent was obtained from all participants.
Procedure
Participants received a portable EEG device and FBA. Participants were instructed on the method of using the portable EEG device and FBA. Participants were asked to undergo EEG monitoring over two nights, one for test to familiarize them with wearing and operating the machine and the other for validation. Sleep data from the second night of acclimation to wearing the portable EEG device and FBA were compared. Participants wore the FBA whilst simultaneously undergoing EEG monitoring during sleep. FBA and portable EEG devices were worn at bedtime and removed simultaneously upon waking. In addition, we screened for the sleep-disordered breathing using a portable polygraphy device16,17 (WatchPAT200; Itamar Medical, Caesarea, Israel) on a different occasion.
Measurement
Electroencephalography-Based Sleep Monitoring
A two-channel portable EEG device, ZA-9 (Pro Assist Co., Ltd., Osaka, Japan), was used as the reference method for comparison with FBA. This device consists of two electrodes connected to a transmitter and receiver, and provides EEG, an electrooculogram, and a submental electromyogram. The participants themselves set up the EEG monitoring at home. Sleep parameters obtained from this device were validated by PSG. Kanemura et al reported that the average agreement was 0.83 and the kappa coefficient was 0.75 for PSG in epoch-by-epoch comparison.7 All data were manually scored by an experienced sleep technician based on widely used criteria.18 Total sleep time (TST) was calculated as the total sleep period minus the time spent awake during sleep time. The sleep onset latency (SOL) was defined as the time between bedtime and sleep onset. Wake after sleep onset (WASO) was calculated as the total wakefulness time between the initial sleep onset and the final sleep offset. For sleep stages, the percentage of slow-wave sleep (ie, stage N3) per TST was assessed. Additionally, we assessed the percentage of N3 sleep during the interval from sleep onset to initial rapid eye movement (REM) sleep (ie, percentage of N3 sleep in initial non-REM sleep) because this is related to the secretion of growth hormone, which is essential for athletes.19 Arousal index (ArI) was calculated as the number of microarousals per hour of sleep.
Fitbit Measures
There are numerous generations of Fitbit models. We used FBA, released in 2017, which has a three-axis accelerometer and a heart rate monitor (photoplethysmography-based heart rate sensors). The measurements were taken using an application provided by Fitbit Inc (San Francisco, CA, USA). The sleep stages are recorded as awake, light sleep, deep sleep, and REM sleep. We interpreted those recorded as deep sleep as N3.13 In addition, the following sleep parameters were defined in the same way as in EEG: TST: total time spent in total sleep stages, WASO: time of awakening in each sleep episode occurring after sleep onset, and SOL: time from bedtime to the onset of the first sleep episode.
Although the exact algorithm used by the FBA to detect when a wearer has fallen asleep is undisclosed, in general, when the wearer has not moved for approximately an hour, FBA assumes that the wearer has fallen asleep.20 Consequently, there may be a gap between the actual start time of falling asleep and the time displayed on the Fitbit application. If the wearer falls asleep quickly but constantly tosses and turns during sleep, the FBA will not recognize it as the start of falling asleep. For this reason, the time of sleep onset was defined as the end of the first “awakening” of the time wave of sleep onset based on the waveform displayed by the application.
Since Fitbit cannot measure EEG, we defined Arl in Fitbit as the number of awakenings per hour of sleep time based on the number of awakenings detected by Fitbit and total sleep time.
Statistical Analysis
The data are expressed as the mean ± SD, and categorical variables are shown as percentages. The EEG data were compared with those derived from the Fitbit using pair sample t-test, the Pearson product-moment correlation coefficient and Bland and Altman plot.21 A p-value of less than 0.05 was considered statistically significant. All analyses were performed using SPSS v.27 software (IBM Corp., Armonk, NY, USA).
Results
Characteristics of the Participants
Overall, 40 collegiate track and field and basketball athletes (20 males and 20 females) were enrolled. Of these, the data of 4 athletes (3 males and 1 female) could not be used for analyses as they could not complete EEG monitoring occasions owing to their personal reasons. Thus, the data of 36 athletes (17 male and 19 female) were finally analyzed. Characteristics of these athletes are summarized in Table 1.
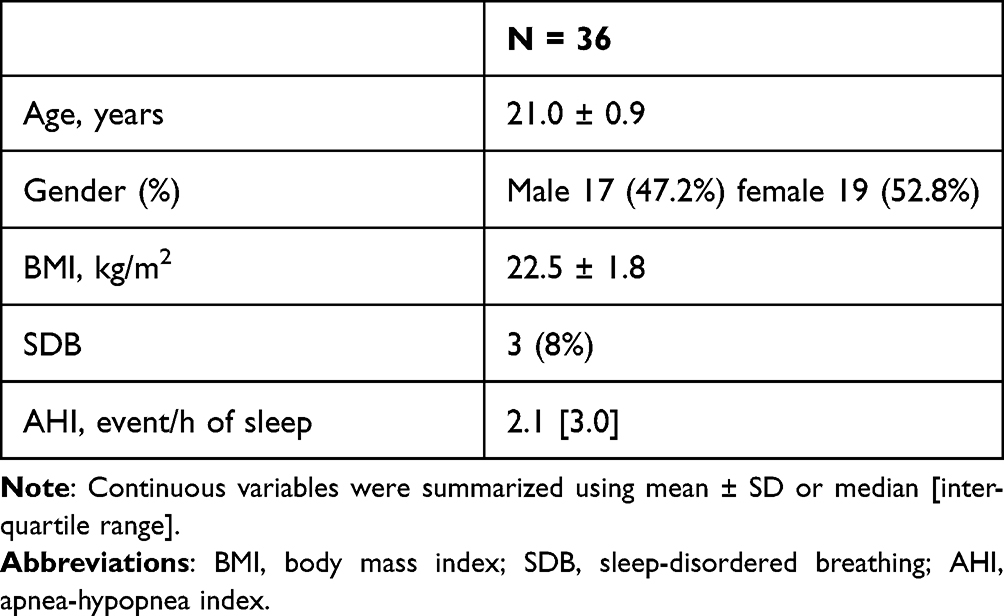 |
Table 1 Characteristics of the Participants |
Sleep Measure
Table 2 presents the sleep parameters from the EEG and FBA data, as well as the results of the paired sample t-test. The t-test results indicated significant differences between some sleep parameters of the EEG device and FBA. Fitbit underestimated SOL, Arl, and the percentage of N3 between sleep onset and initial REM sleep compared with EEG.
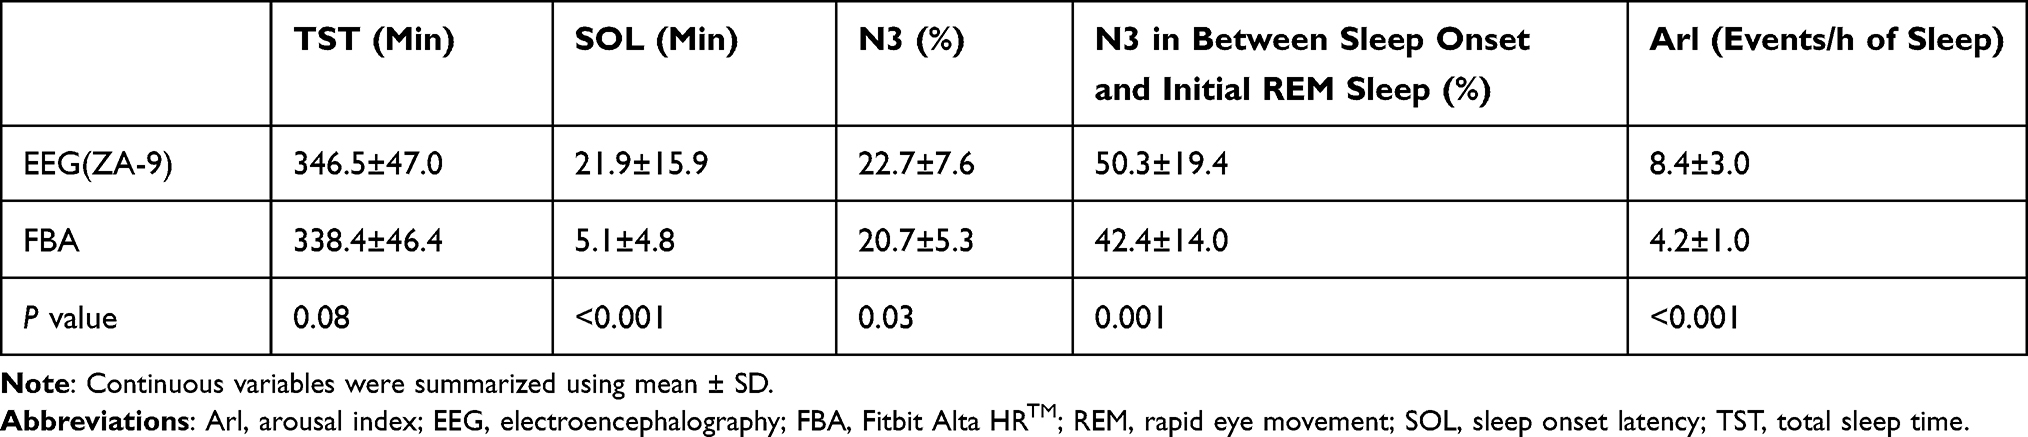 |
Table 2 Results of Paired t-Test Between Sleep Parameters of EEG and Those of FBA |
Figure 1A shows the correlation between the TST-EEG and the TST-Fitbit (r = 0.83; p < 0.001). Figure 1B shows a Bland and Altman plot, which showed mean TST differences of 8.0, and the limits of agreement for the TST were between 62.0 and - 46.0. The range of the limits of agreement included 34 of the 36 cases, and no proportional bias was observed. A weak correlation was observed between SOL-EEG and SOL-Fitbit (r = 0.37; p = 0.03 Figure 1C). Figure 1D shows a Bland and Altman plot, which showed mean SOL differences of 16.9, and the limits of agreement for the SOL were between 46.5 and −12.7. The range of the limits of agreement included 33 of the 36 cases, and proportional bias (r = 0.64, p < 0.001) was observed.
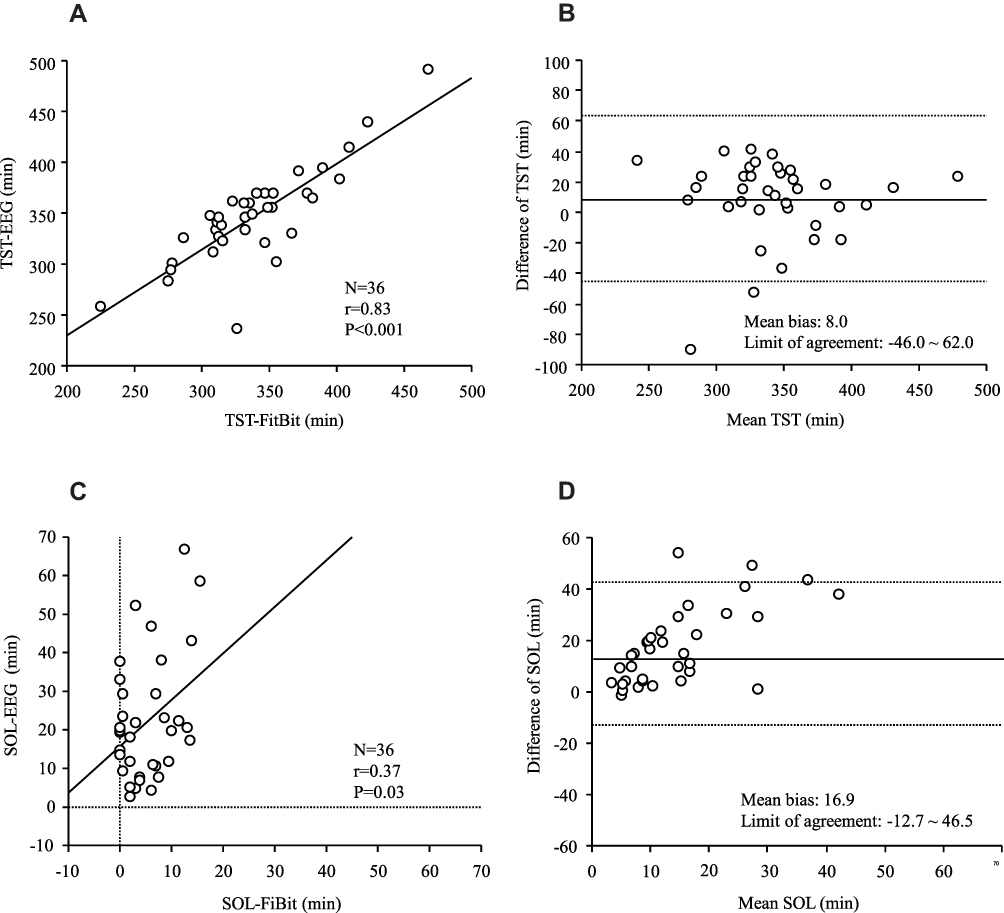 |
Figure 1 (A) Scatter plot of the total sleep time (TST) derived from the electroencephalograph (TST-EEG) and the TST from Fitbit Alta HR (TST-Fitbit) There is a strong correlation between the TST-EEG and the TST-FitBit. (B) Bland-Altman plots according to the TST The Y-axis indicates the difference between the TST-EEG and the TST-Fitbit [(TST-EEG)- ([TST-Fitbit)]. The X-axis indicates the mean values. The solid line represents the mean difference; the dashed lines represent the limit of agreement. (C) Scatter plot of the sleep onset latency (SOL) derived from the electroencephalograph (SOL-EEG) and the SOL from Fitbit Alta HR (SOL-Fitbit) There is a weak correlation between the SOL-EEG and the SOL-FitBit. (D) Bland-Altman plots according to the SOL The Y-axis indicates the difference between the SOL-EEG and the SOL-Fitbit [(SOL-EEG)- (SOL-Fitbit)]. The X-axis indicates the mean values. The solid line represents the mean difference; the dashed lines represent the limit of agreement. |
In terms of the sleep stages, there was a modest correlation between the N3-EEG and the N3-Fitbit (r = 0.68; p < 0.001, Figure 2A). Figure 2B shows a Bland and Altman plot, which showed mean N3 differences of 2.0; the limits of agreement for the N3 were between 13.0 and −9.0. The range of the limits of agreement included 35 of the 36 cases, and proportional bias (r = 0.44, p = 0.008) was observed.
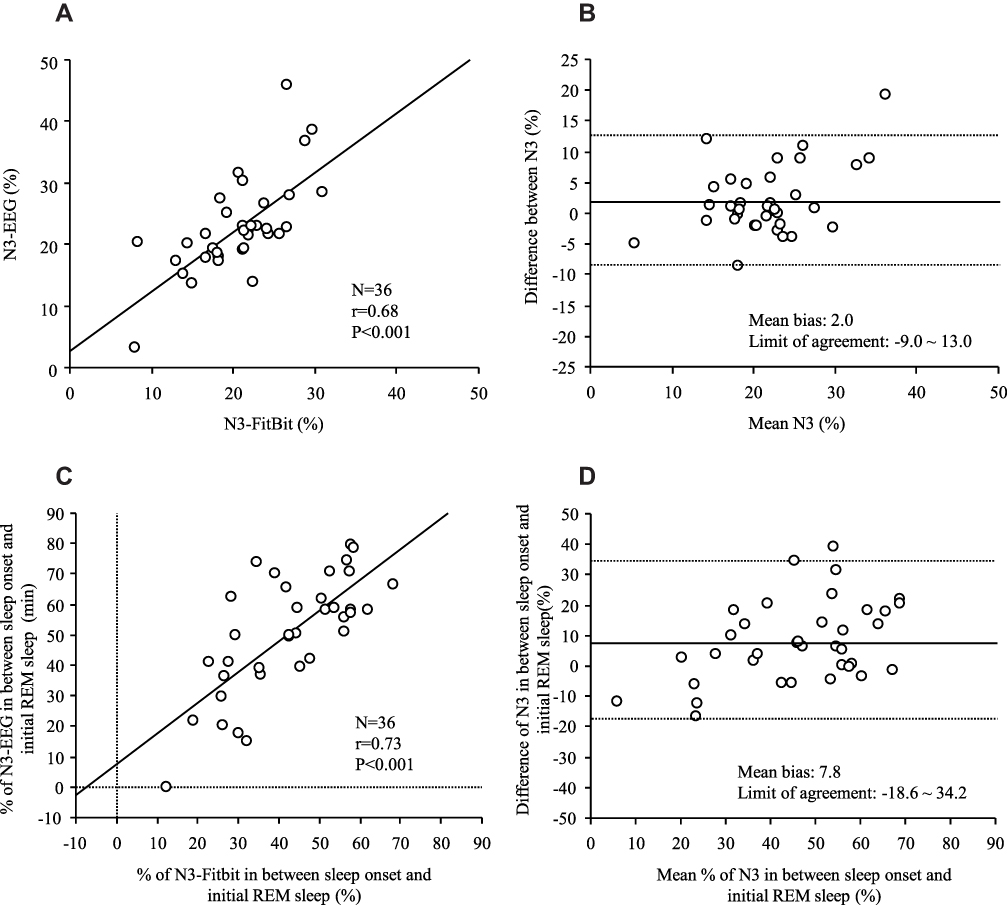 |
Figure 2 (A) Scatter plot of the N3 sleep derived from the electroencephalograph (N3-EEG) and the N3 from the Fitbit Alta HR (N3-Fitbit) There is a modest correlation between the N3-EEG and the N3-FitBit. (B) Bland-Altman plots according to N3. The Y-axis indicates the difference between the N3-EEG and the N3-Fitbit [(N3-EEG) - (N3-Fitbit)]. The X-axis indicates the mean values. The solid line represents the mean difference; the dashed lines represent the limit of agreement. (C) Scatter plot of the percentage of N3 in between sleep onset and initial REM derived from the electroencephalograph (the percentage of N3 in between sleep onset and initial REM sleep-EEG) and those from Fitbit Alta HR (the percentage of N3 in between sleep onset and initial REM sleep-Fitbit). There is a strong correlation between the percentage of N3 in between sleep onset and initial REM sleep-EEG and the percentage of N3 between sleep onset and initial REM sleep-FitBit. (D) Bland-Altman plots according to the percentage of N3 in between sleep onset and initial REM sleep The Y-axis indicates the difference between the percentage of N3 in between sleep onset and initial REM sleep-EEG and the percentage of N3 between sleep onset and initial REM sleep-FitBit. The X-axis indicates the mean values. The solid line represents the mean difference; the dashed lines represent the limit of agreement. |
Furthermore, there was a strong correlation between the percentage of N3 in between sleep onset and initial REM sleep-EEG and those on Fitbit (r = 0.73; p < 0.001, Figure 2C). Figure 2D shows a Bland and Altman plot, which showed a mean percentage of 7.8 N3 in between sleep onset and initial REM sleep difference; the limits of agreement for those were between 34.2 and −18.6. The range of the limits of agreement included 35 of the 36 cases, and a proportional bias was observed (r = 0.43, p = 0.009). There was a weak correlation between Arl-EEG and Arl-Fitbit (r = 0.42; p = 0.01, Figure 3A). Figure 3B shows a Bland and Altman plot, which showed a mean Arl difference of 4.2 and the limits of agreement were between 9.6 and −1.2. The range of the limits of agreement included 34 of the 36 cases, and a proportional bias was observed (r = 0.83, p < 0.001).
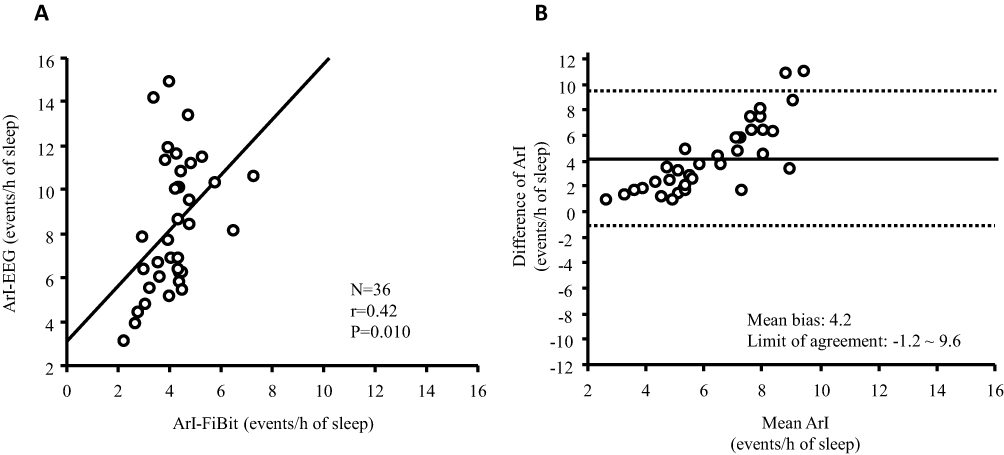 |
Figure 3 (A) Scatter plot of the arousal index (Arl) derived from the electroencephalograph (Arl-EEG) and the Arl from Fitbit Alta HR (Arl-Fitbit) There is a weak correlation between the Arl-EEG and the Arl-FitBit. (B) Bland-Altman plots according to Arl The Y-axis indicates the difference between the Arl-EEG and the Arl-Fitbit [(Arl-EEG)- (Arl-Fitbit)]. The X-axis indicates the mean values. The solid line represents the mean difference; the dashed lines represent the limit of agreement. |
Discussion
The present study provides novel insights into the clinical utility of FBA in determining the sleep parameter and stage in athletes.
We found a strong correlation between Fitbit and the EEG device in TST and between sleep onset and initial REM sleep, a moderate correlation in deep sleep, and a weak correlation in SOL and Arl. Fitbit tended to underestimate each item in the Bland-Altman plot, but the agreement was within the acceptable range. Proportional bias existed in all items except the TST, where the difference in N3 sleep parameters between FBA and simple EEG measurements increased as sleep improved. Regarding actual sleep management of athletes, it is more important to detect poor sleep as soon as possible rather than to judge the sleep quality. Additionally, the absolute values and the bias of the ArI are quite small and therefore not important in daily life. From this point of view, these biases are acceptable Nevertheless, caution should be raised when we see long SOL because the difference in SOL between the FBA and simple EEG measurements increased as these biases increased.
The FBA has been validated for accuracy in specific age groups and sleep state populations.11–15 According to a report comparing the quality and consistency of sleep measurements of FBA and research actigraphy with polysomnography (PSG) in adolescents, FBA was somewhat better at detecting stage N1 + N2 and REM sleep, but significantly underestimated stage N3 sleep compared to PSG.11 Another study in healthy young people similarly reported better sleep tracking performance of FBA than PSG but relatively more unsatisfactory performance in tracking sleep stages.12,15 On the other hand, in a study of participants with obstructive sleep apnea, the Fitbit wearable device showed acceptable sensitivity. However, low specificity tended to overestimate TST and underestimate SOL and WASO and had lower overall accuracy. This was attributed to the use of a clinical population as the target rather than healthy adults.13
Furthermore, in patients with suspected central disorders of hypersomnolence, sleep duration and early onset REM cannot be measured accurately or used as a diagnostic alternative to PSG.12 On the other hand, a different clinical population study-insomniacs-reported similar accuracy to actigraphy. However, while sleep stage measures show high specificity in discriminating between N3 and REM, sensitivity is marginal, and FBAs report a tendency to underestimate these sleep stages and overestimate light sleep.14 These findings show that Fitbit performance is generally good for sleep/wake classification but not for sleep stages, and the results may be influenced by different age groups and sleep and health conditions.
In this study, Fitbit showed an overall good correlation with TST, although it tended to underestimate to EEG in athletes. However, concerning SOL, there was a noticeable tendency to underestimate SOL compared with the EEG device when SOL-EEG was high. As mentioned above, the FBA’s algorithm for detecting when to start sleeping is undisclosed, but it is presumed to be a combination of heart rate detection using photoplethysmography-based heart rate sensors and body movement detection using an accelerometer. This trend most likely resulted from the detection algorithm. Fitbit may tend to underestimate SOL if the participant is trying to sleep, ie, taking a long time to fall asleep. Therefore, we need to pay attention to this aspect when conducting Fitbit’s sleep evaluations.
In terms of sleep stages, it has been reported that most consumer devices tend to incorrectly recognize 30–50% of both N3 and REM sleep as light sleep,15 while the FBA has been reported to have the same specificity than PSG for epoch-by-epoch agreement.11,14 This study showed that FBA is as accurate as EEG in detecting N3 sleep in athletes.
While actigraphy is considered the standard for mobile sleep assessment, the consumer device FBA has additional features that allow for near real-time data processing through Bluetooth connectivity at a lower price. Most consumer devices have accelerometers similar to actigraphy devices, but the FBA has a heart rate monitor as an additional input to its proprietary sleep algorithm. Consumer devices continually update their hardware and software systems to improve sleep tracking performance11,13,14. In particular, the ratio of N3 sleep per TST, which defines the quality of sleep, and the percentage of N3 in sleep onset and initial REM sleep, which is involved in the recovery of athlete’s physical strength,19 are essential in terms of condition management. FBA, which is equal to EEG in detecting this part, is a handy tool for athletes to manage their condition.
In the future, sleep data obtained from Fitbit could be used to determine current fatigue and mental state, and the data obtained could be used to intervene in sleep to improve performance in athletes. Reportedly, by combining Fitbit data on steps (physical activity) and sleep (insomnia and hypersomnia) with smartphone usage, location information, and call records, the system detected post-semester depression in 138 college students with 85.7% accuracy as well as changes in symptoms with 85.4% accuracy.22
Many people worldwide are now using Fitbit and other consumer wearable devices, large-scale data collection on an enterprise basis is possible, and the machines themselves are undergoing rapid technological innovations. The promising efficacy and usefulness of Fitbit, one of the consumer wearable devices in this study, is expected to become more accurate with further population evaluations and algorithm settings. Clinically, it may be possible to immediately detect individual sleep patterns and its sudden changes to predict sleep disorders and deteriorating health conditions that may require intervention.
This study has several limitations. First, although the study was conducted on college athletes in the Department of Physical Education who had an almost uniform lifestyle, training schedule, and diet, it was an evaluation of sleep at a habitual time, and bedtime and time in bed were not strictly controlled. However, this limitation may also be an advantage, as the study evaluated whether FBA can be used in daily life.
Second, since there may be an inherent bias in the two-channel EEG used in the experiment itself and the sleep accuracy may be lower than PSG, it is necessary to discuss the accuracy compared to PSG. However, the purpose of this study is to investigate whether Fitbit Alta HR, with its convenience and developmental potential, can be used as an alternative testing device to EEG, which was validated in comparison with PSG. Third, in terms of sleep stages, comparisons were not made on an epoch-by-epoch basis but rather as a percentage of the total. Although it is possible to obtain raw data with the Fitbit API,23 it is not easy to accurately synchronize the time with the EEG epochs; therefore, epoch-by-epoch analysis could not be reliably performed with publicly available tools.
Forth, the Arl of Fitbit is the number of “awakenings” per hour of sleep, which is different from the original definition. This comparison was for reference only. Finally, only N3 sleep, which is important for athletes’ sleep, was evaluated. In many consumer devices, the sleep stage that could not be recognized precisely is often categorized as light sleep.15 Therefore, we judged that light sleep did not essentially represent N1 and N2 sleep, and excluded them from the evaluation. Finally, Fitbit Inc claims to have improved the Fitbit Alta HR and later products to have better sleep detection accuracy than the Fitbit Alta HR, but they do not disclose whether the algorithm used in the Fitbit Alta HR and later products is the same or not.
Conclusion
FBA was shown to be as good as EEG in detecting N3 sleep, which is considered necessary in athletes’ sleep management. In particular, it is difficult for athletes to manage sleep conditions using PSG or EEG. The ability to evaluate sleep using a wearable device will enable sleep interventions to be tailored to the changing environment unique to athletes, which may ultimately lead to improved athletic performance.
Abbreviations
AHI, apnea-hypopnea index; Arl, arousal index; BMI, body mass index; EEG, electroencephalography; FBA, Fitbit Alta HRTM; PSG, polysomnography; REM, rapid eye movement; SDB, sleep-disordered breathing; SOL, sleep onset latency; TST, total sleep time; WASO wake after sleep onset.
Funding
This study was supported by the MEXT*-Supported Program for the Strategic Research Foundation at Private Universities, 2014–2018 (*Ministry of Education, Culture, Sports, Science and Technology), Japanese Center for Research on Women in Sport, Juntendo University, Project for Fostering, Survey research for the strategic strengthening of female athletes 2018–2019 by the Japan Sports Agency. These funding sources do not have any other roles in this study.
Disclosure
Takatoshi Kasai and Fusae Kawana are affiliated with a department endowed by Philips Respironics, ResMed, and Fukuda Denshi. Takatoshi Kasai and Nanako Shiroshita are affiliated with a department endowed by Paramount Bed. Nanako Shiroshita reports belonging to collaborative research programs for Paramount Bed Co. Ltd. during the study and outside the submitted work. The other authors report no other potential conflicts of interest for this work.
References
1. Myllymaki T, Rusko H, Syvaoja H, Juuti T, Kinnunen ML, Kyrolainen H. Effects of exercise intensity and duration on nocturnal heart rate variability and sleep quality. Eur J Appl Physiol. 2012;112(3):801–809. doi:10.1007/s00421-011-2034-9
2. Samuels C. Sleep, recovery, and performance: the new frontier in high-performance athletics. Neurol Clin. 2008;26(1):169–180. doi:10.1016/j.ncl.2007.11.012
3. Mah CD, Mah KE, Kezirian EJ, Dement WC. The effects of sleep extension on the athletic performance of collegiate basketball players. Sleep. 2011;34(7):943–950. doi:10.5665/SLEEP.1132
4. Simpson NS, Gibbs EL, Matheson GO. Optimizing sleep to maximize performance: implications and recommendations for elite athletes. Scand J Med Sci Sports. 2017;27(3):266–274. doi:10.1111/sms.12703
5. Leeder J, Glaister M, Pizzoferro K, Dawson J, Pedlar C. Sleep duration and quality in elite athletes measured using wristwatch actigraphy. J Sports Sci. 2012;30(6):541–545. doi:10.1080/02640414.2012.660188
6. Purvis D, Gonsalves S, Deuster PA. Physiological and psychological fatigue in extreme conditions: overtraining and elite athletes. Pm r. 2010;2(5):442–450. doi:10.1016/j.pmrj.2010.03.025
7. Kanemura T, Kadotani H, Matsuo M, et al. Evaluation of a portable two-channel electroencephalogram monitoring system to analyze sleep stages. J Oral Sleep Medi. 2016;2:101–108.
8. Koikawa N, Takami Y, Kawasaki Y, et al. Changes in the objective measures of sleep between the initial nights of menses and the nights during the mid-follicular phase of the menstrual cycle in collegiate female athletes. J Clin Sleep Med. 2020;16(10):1745–1751. doi:10.5664/jcsm.8692
9. Haghayegh S, Khoshnevis S, Smolensky MH, Diller KR. Accuracy of purepulse photoplethysmography technology of fitbit charge 2 for assessment of heart rate during sleep. Chronobiol Int. 2019;36(7):927–933. doi:10.1080/07420528.2019.1596947
10. de Zambotti M, Goldstone A, Claudatos S, Colrain IM, Baker FC. A validation study of Fitbit charge 2™ compared with polysomnography in adults. Chronobiol Int. 2018;35(4):465–476. doi:10.1080/07420528.2017.1413578
11. Lee XK, Chee N, Ong JL, et al. Validation of a consumer sleep wearable device with actigraphy and polysomnography in adolescents across sleep opportunity manipulations. J Clin Sleep Med. 2019;15(9):1337–1346. doi:10.5664/jcsm.7932
12. Cook JD, Eftekari SC, Dallmann E, Sippy M, Plante DT. Ability of the fitbit alta HR to quantify and classify sleep in patients with suspected central disorders of hypersomnolence: a comparison against polysomnography. J Sleep Res. 2019;28(4):e12789. doi:10.1111/jsr.12789
13. Moreno-Pino F, Porras-Segovia A, López-Esteban P, Artés A, Baca-García E. validation of fitbit charge 2 and fitbit alta hr against polysomnography for assessing sleep in adults with obstructive sleep apnea. J Clin Sleep Med. 2019;15(11):1645–1653. doi:10.5664/jcsm.8032
14. Kahawage P, Jumabhoy R, Hamill K, de Zambotti M, Drummond SPA. Validity, potential clinical utility, and comparison of consumer and research-grade activity trackers in Insomnia Disorder I: in-lab validation against polysomnography. J Sleep Res. 2020;29(1):e12931. doi:10.1111/jsr.12931
15. Chinoy ED, Cuellar JA, Huwa KE, et al. Performance of seven consumer sleep-tracking devices compared with polysomnography. Sleep. 2021;44(5). doi:10.1093/sleep/zsaa291
16. Yalamanchali S, Farajian V, Hamilton C, Pott TR, Samuelson CG, Friedman M. Diagnosis of obstructive sleep apnea by peripheral arterial tonometry: meta-analysis. JAMA Otolaryngol Head Neck Surg. 2013;139(12):1343–1350. doi:10.1001/jamaoto.2013.5338
17. Kasai T, Takata Y, Yoshihisa A, et al. Comparison of the apnea-hypopnea index determined by a peripheral arterial tonometry-based device with that determined by polysomnography ― results from a multicenter study. Circ Rep. 2020;2(11):674–681. doi:10.1253/circrep.CR-20-0097
18. Berry RB, Brooks R, Gamaldo C, et al. AASM scoring manual updates for 2017 (Version 2.4). J Clin Sleep Med. 2017;13(5):665–666. doi:10.5664/jcsm.6576
19. Ho KKY. The promise of growth hormone in sport: doped or duped. Arch Endocrinol Metab. 2019;63(6):576–581. doi:10.20945/2359-3997000000187
20. Fitbit Inc. What should I know about Fitbit sleep stages? Available from: https://help.fitbit.com/articles/en_US/Help_article/2163.htm.
21. Bland JM, Altman DG. Statistical methods for assessing agreement between two methods of clinical measurement. Lancet. 1986;1(8476):307–310. doi:10.1016/S0140-6736(86)90837-8
22. Chikersal P, Doryab A, Tumminia M, et al. Detecting depression and predicting its onset using longitudinal symptoms captured by passive sensing: a machine learning approach with robust feature selection. ACM Trans Comput-Hum Int. 2021;28(1):Article3. doi:10.1145/3422821
23. Fitbit Inc. Web API reference. Available from: https://dev.fitbit.com/build/reference/web-api.
 © 2022 The Author(s). This work is published and licensed by Dove Medical Press Limited. The
full terms of this license are available at https://www.dovepress.com/terms
and incorporate the Creative Commons Attribution
- Non Commercial (unported, 3.0) License.
By accessing the work you hereby accept the Terms. Non-commercial uses of the work are permitted
without any further permission from Dove Medical Press Limited, provided the work is properly
attributed. For permission for commercial use of this work, please see paragraphs 4.2 and 5 of our Terms.
© 2022 The Author(s). This work is published and licensed by Dove Medical Press Limited. The
full terms of this license are available at https://www.dovepress.com/terms
and incorporate the Creative Commons Attribution
- Non Commercial (unported, 3.0) License.
By accessing the work you hereby accept the Terms. Non-commercial uses of the work are permitted
without any further permission from Dove Medical Press Limited, provided the work is properly
attributed. For permission for commercial use of this work, please see paragraphs 4.2 and 5 of our Terms.