Back to Journals » Clinical Ophthalmology » Volume 14
Evaluation of Retinal Nerve Fiber Layer and Ganglion Cell Layer Thickness in Alzheimer’s Disease Using Optical Coherence Tomography
Authors Jindahra P ![]() , Hengsiri N, Witoonpanich P, Poonyathalang A
, Hengsiri N, Witoonpanich P, Poonyathalang A ![]() , Pulkes T
, Pulkes T ![]() , Tunlayadechanont S, Thadanipon K
, Tunlayadechanont S, Thadanipon K ![]() , Vanikieti K
, Vanikieti K
Received 11 August 2020
Accepted for publication 9 September 2020
Published 2 October 2020 Volume 2020:14 Pages 2995—3000
DOI https://doi.org/10.2147/OPTH.S276625
Checked for plagiarism Yes
Review by Single anonymous peer review
Peer reviewer comments 3
Editor who approved publication: Dr Scott Fraser
Panitha Jindahra,1 Nitchanan Hengsiri,1 Pirada Witoonpanich,1 Anuchit Poonyathalang,2 Teeratorn Pulkes,1 Supoch Tunlayadechanont,1 Kunlawat Thadanipon,3 Kavin Vanikieti2
1Department of Medicine, Faculty of Medicine Ramathibodi Hospital, Mahidol University, Bangkok, Thailand; 2Department of Ophthalmology, Faculty of Medicine Ramathibodi Hospital, Mahidol University, Bangkok, Thailand; 3Department of Clinical Epidemiology and Biostatistics, Faculty of Medicine Ramathibodi Hospital, Mahidol University, Bangkok, Thailand
Correspondence: Kavin Vanikieti Department of Ophthalmology, Faculty of Medicine Ramathibodi Hospital
Mahidol University, 270 Rama VI Road, Bangkok 10400, Thailand
Tel +662 201 1526
Fax +662 201 2729
Email [email protected]
Objective: To evaluate the feasibility of using optical coherence tomography (OCT) for the detection of Alzheimer’s disease (AD), by measuring the thickness of the retinal nerve fiber layer (RNFL) and the ganglion cell layer and inner plexiform layer (GCL-IPL).
Material and Methods: This was a single-center, cross-sectional study. The study included 29 patients with AD (mean age ± standard deviation: 75.61 ± 6.24 years) and 29 healthy age- and sex-matched controls. All participants underwent cognitive evaluations using the Montreal Cognitive Assessment test. Measurements of the RNFL thickness, as well as GCL-IPL thickness, were obtained for all participants using OCT. Both RNFL and GCL-IPL parameters were adjusted for best-corrected visual acuity, hypertension, diabetes and dyslipidemia.
Results: The mean RNFL thickness was significantly thinner in the AD group than in the control group (85.24 and 90.68 μm, respectively, adjusted P=0.014). The superior quadrant was thinner in the AD group (adjusted P=0.033). The thicknesses did not differ significantly between groups for the other quadrants. The mean GCL-IPL thickness in the AD (68.81 μm) was significantly thinner than that in the controls (76.42 μm) (adjusted P=0.014). Overall, there was a negative correlation between age and mean RNFL; and between age and GCL-IPL thickness (r=− 0.338, P=0.010 and r=− 0.346, P=0.008, respectively).
Conclusion: The mean RNFL and GCL-IPL thicknesses were thinner in the AD group than in the control group. These findings suggest that RNFL and GCL-IPL thickness may be biological markers for AD.
Keywords: Alzheimer’s disease, optical coherence tomography, retinal nerve fiber layer, ganglion cell layer, dementia
Introduction
Alzheimer’s disease (AD) is the most common type of degenerative dementia, accounting for 60–70% of all cases.1 Alzheimer’s disease, which has a significant impact on patients, their families and society, is characterized by a progressive decline in cognitive function. Pathological hallmarks are the accumulation of amyloid-beta (Aβ) and intracellular neurofibrillary tangles.2
Alzheimer’s disease patients develop visual symptoms and retinal changes.2 The retina, an extension of the brain, is derived from the neural tube. It shares physiological and anatomical features with the brain. Hinton et al provided histopathological evidence of axonal degeneration of the retinal ganglion cells (RGCs) in patients with AD.3 The retinal nerve fiber layer (RNFL) consists primarily of RGC axons, which progressively degenerate in AD, according to Paquet et al.4
The diagnosis of AD is currently based on clinical history, cognitive assessments and biomarkers. Positron emission tomographic amyloid imaging, cerebrospinal fluid tau and Aβ levels have high specificity in the diagnosis of AD.5 However, they are expensive and time-consuming.
Optical coherence tomography (OCT) provides high-resolution cross-sectional images of the retina, with biopsy-like precision. It is non-invasive and inexpensive. Optical coherence tomography provides measures of the thickness of the RNFL and ganglion cell layer (GCL) in microns. It is widely used in multiple ophthalmic conditions, such as glaucoma and retinopathy. There is increasing evidence of its utility in neurological disorders, including multiple sclerosis, Parkinson’s disease and AD.6,7 Many studies have found that the thickness of the peripapillary RNFL and GCL was reduced in patients with AD.8–11 However, some studies have shown different results in terms of quadrant affected in peripapillary RNFL scan.
This study aimed to evaluate the feasibility of using OCT for the detection of AD in Thai patients. We measured the thickness of the peripapillary RNFL, and the macular GCL with the inner plexiform layer (GCL-IPL) in AD patients and healthy controls. The thicknesses were then compared between the groups.
Materials and Methods
The study was approved by the Ethics committee of Ramathibodi Hospital, Mahidol University (COA. MURA2019/539), and written informed consent was obtained from all participants or their caregivers.
This single-center, cross-sectional study was conducted in Ramathibodi Hospital, from August 2019 to November 2019. The 58 participants in the study were divided into two groups: AD and age- and sex-matched controls. The diagnosis of AD was made based on the National Institute of Neurologic and Communicative Disorders and Stroke–Alzheimer’s Disease and Related Disorders Association (NINCDS-ADRDA) and the Diagnostic and Statistical Manual of Mental Disorders (DSM IV) criteria. All participants underwent cognitive assessments, based on the Montreal Cognitive Assessment (MoCA). All participants were >59 years of age.
Exclusion criteria were: any optic neuropathy, including glaucoma; retinal diseases; and other neurologic diseases, such as dementia other than AD, Parkinsonian diseases, multiple sclerosis or stroke. These were excluded via self-reported and/or ophthalmic examinations. Uncooperative or bedridden patients were also excluded.
All participants underwent ophthalmic examinations, including measurement of best-corrected visual acuity (BCVA), intraocular pressure (IOP) and dilated fundus examination. Best-corrected visual acuity was measured using Snellen charts, with values then converted to the logarithm of the minimum angle of resolution (logMAR) for statistical analysis.
All participants underwent OCT examination of both eyes, using a Cirrus HD-OCT Model 4000 (Carl Zeiss Meditec, Dublin, CA). Optic nerve head cube 200 x 200 and macular cube 512 x 128 scan protocols were used for optic disc and macular scans, respectively. Optical coherence tomography images of poor quality (signal strength less than 7/10) and OCT images with segmentation error on inspection were excluded from the analyses. We measured the mean thickness of the peripapillary RNFL in all four quadrants: superior, inferior, nasal and temporal. We also measured the mean thickness of the GCL-IPL in six sectors: superonasal, inferonasal, superotemporal, inferotemporal, superior and inferior.
Statistical Analysis
The necessary sample size was calculated based on power analysis before the study. It was determined that 26 participants were required in each group. The power of each group was 0.80.
Categorical data are presented herein as frequencies (percentages). Continuous variables are presented as means with the standard deviation or medians with the interquartile range. Statistical analyses were performed using paired t-tests for two dependent continuous variables, marginal homogeneity tests for ordinal categorical variables and McNemar’s test for two dependent dichotomous variables. Associations of IOP, BCVA and OCT parameters between the AD and control groups were calculated using mixed-effects linear regression models. Both RNFL and GCL-IPL models were adjusted for BCVA, hypertension, diabetes and dyslipidemia. Pearson’s correlation was used for analyzing the correlation between OCT parameters and MoCA scores, and between OCT parameters and age.
All statistical analyses were performed using Stata version 16.1 (Stata Corp, College Station, TX). P values of < 0.05 were considered statistically significant.
Results
A total of 58 participants (111 eyes) were recruited. There were 29 patients in the AD group (20 females [68.97%], ages 60.67–85.25 years, MoCA scores 3–24 [mean 14.52]). There were 29 participants in the control group (20 females [68.97%], ages 60.67–85.33 years, MoCA scores 25–29 [mean 26.62]). The two groups were age- and sex-matched. Four eyes (6.89%) in the AD group and one eye (1.72%) in the control group were excluded from the study due to significant cataract, which resulted in poor-quality RNFL and GCL-IPL images (signal strength less than 7/10). No significant differences were found in age, sex, education level, coexisting diseases or IOP between the two groups. Best-corrected visual acuity and MoCA were significantly better in the controls than in the AD group. A summary of demographic and clinical characteristics is provided in Table 1.
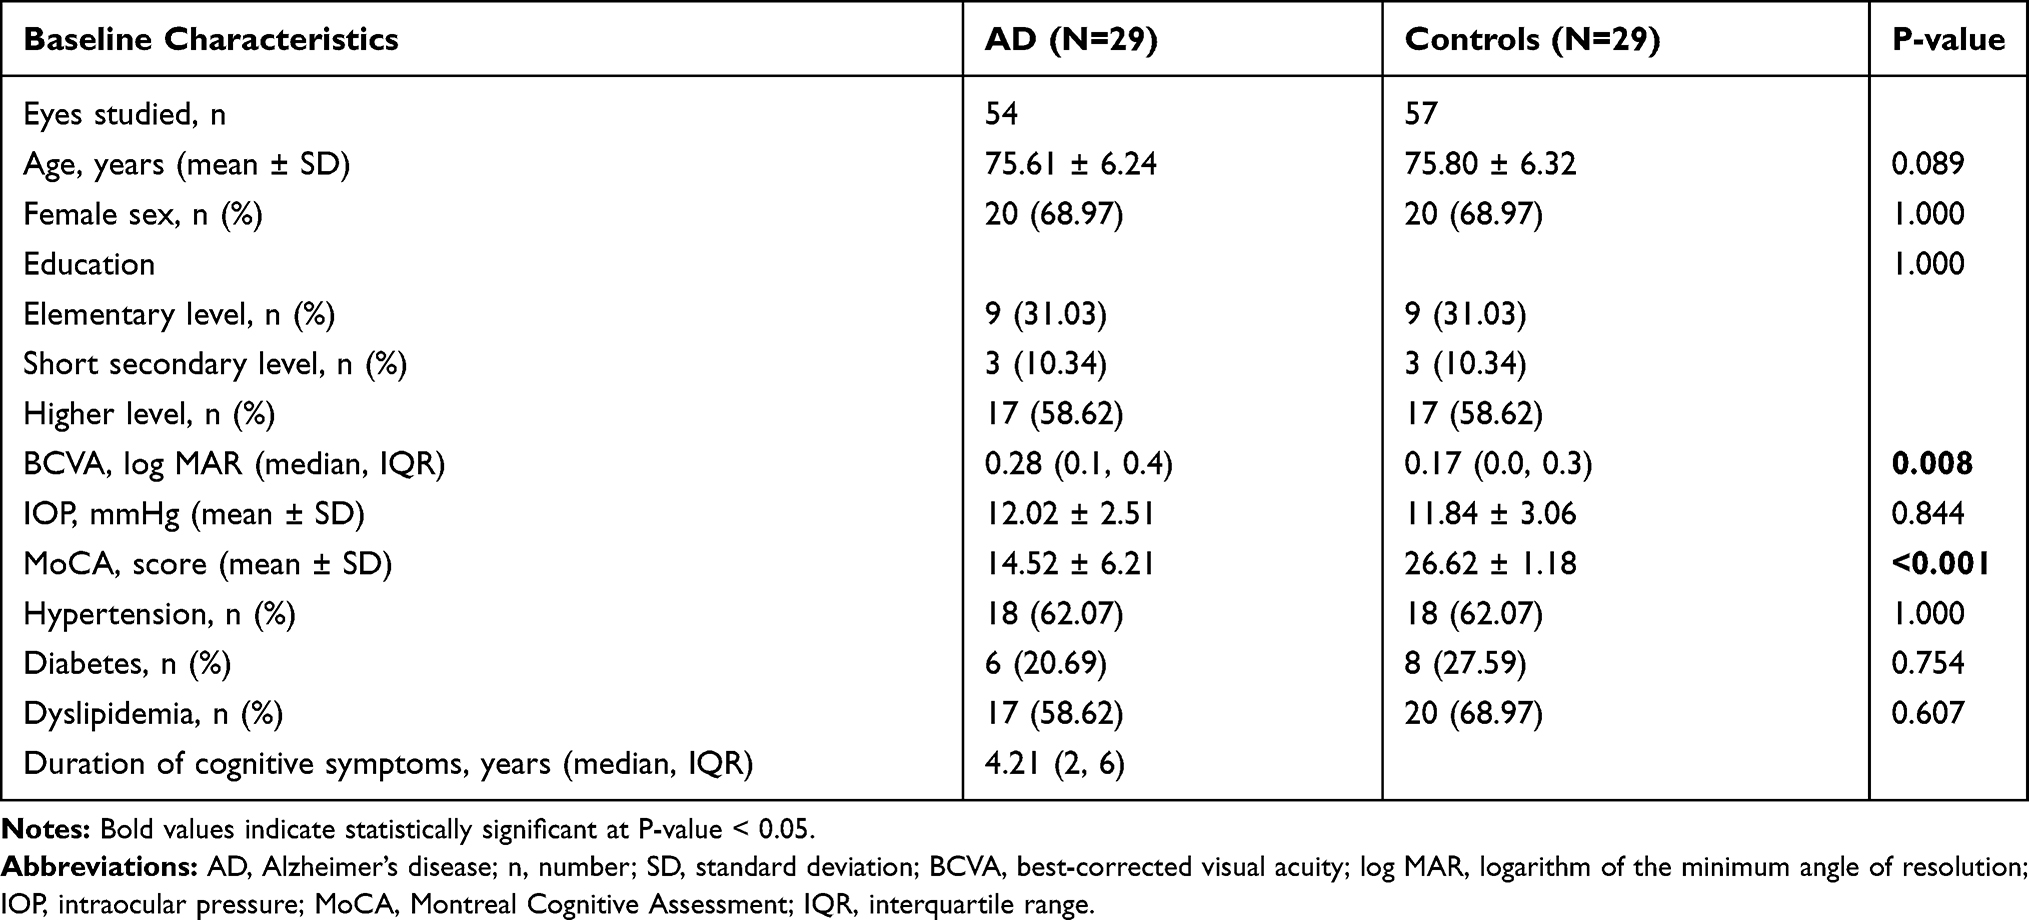 |
Table 1 Demographic and Clinical Characteristics |
The peripapillary RNFL thicknesses, for the combination of the two groups, produced a plot with two peaks (Figure 1). The mean RNFL thickness was significantly thinner in the AD group than in the controls (85.24 and 90.68 µm, respectively, adjusted P=0.014). Of the four RNFL quadrants, the superior quadrant in the AD group was thinner than that in the controls (adjusted P=0.033); no significant differences were found between the two groups in the nasal, inferior and temporal quadrants (adjusted P=0.063, 0.117 and 0.075, respectively).
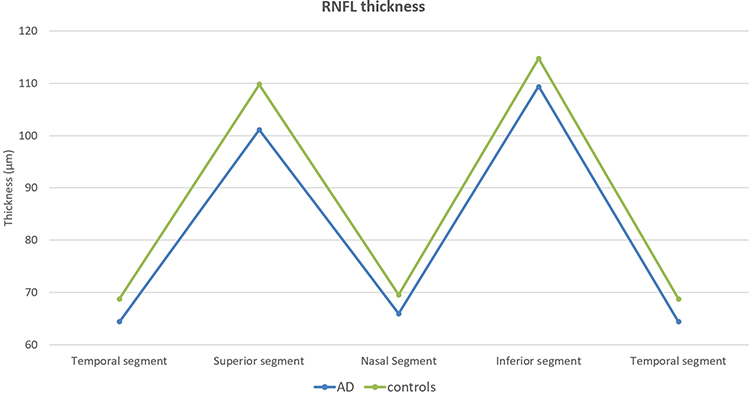 |
Figure 1 Line chart showing a comparison of RNFL thickness based on each quadrant between the two groups. |
The mean GCL-IPL thickness was significantly thinner in the AD group than in the controls (adjusted P=0.014). Of the six GCL-IPL sectors, the measurement was significantly thinner in the AD group than in the controls in every sector except for the superotemporal sector. Detailed comparisons of the OCT parameters (RNFL and GCL-IPL) between the groups are shown in Table 2.
 |
Table 2 Comparison of Optical Coherence Tomography (OCT) Parameters Between Alzheimer’s Disease (AD) Patients and Healthy Controls |
Overall, there was a negative correlation between age and mean RNFL thickness (r= −0.338, P=0.010), and between age and mean GCL-IPL thickness (r= −0.346, P=0.008) (Figures 2 and 3). However, there was no significant correlation between the MoCA scores and OCT parameters across the 58 participants (P>0.05).
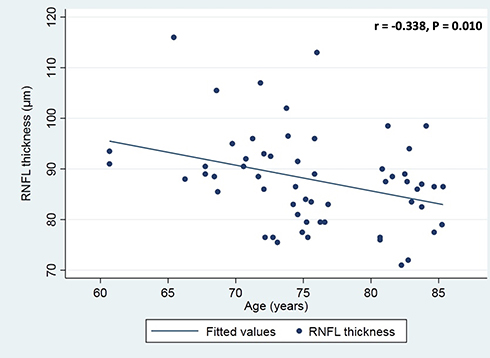 |
Figure 2 Scatterplot of the association between age and RNFL thickness in the full set of participants. |
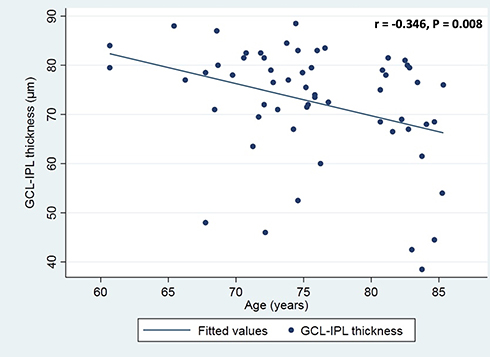 |
Figure 3 Scatterplot of the association between age and GCL-IPL thickness in the full set of participants. |
Discussion
Our study found that the mean RNFL thickness was significantly thinner in the AD group than the controls. Likewise, the GCL-IPL thickness was significantly thinner in almost all sectors in the AD group, compared with those in the controls. Overall, there was no correlation between OCT parameters and MoCA scores. However, there was a significant negative correlation between age and OCT parameters.
The loss of RGCs in AD might have resulted from amyloid deposition, which was previously reported in a postmortem mouse model and also in retinal tissue in vivo. Therefore, amyloid accumulation in the retina may result in the degeneration of RGCs in parallel to the neurodegeneration in the brain.12
Many studies have reported significant thinning in the overall RNFL in patients with AD.13 Most studies showed significant thinning in the superior and inferior quadrants of the RNFL in AD,14,15 whereas some studies found thinning only in the superior quadrant, as in our results.16,17 The prominent loss of RNFL in the superior and inferior regions may occur because of a higher number of neurons in those regions. Liu et al and Armstrong et al provided a possible explanation for the dominant defect in superior RNFL, in that axons from the superior retina anatomically project to the cuneal gyrus of the primary visual cortex, where a higher density of senile plaques and neurofibrillary tangles are deposited.14,18
Cheung et al demonstrated that GCL-IPL thickness in all six sectors and only the superior quadrant of RNFL thickness were significantly reduced in AD patients compared with normal controls.11 They suggested that the sensitivity of GCL-IPL measurements is higher than that of RNFL measurements for distinguishing patients with AD from controls.11 These were fairly similar to our results. Our AD group showed significant thinning of the GCL-IPL in almost every sector, compared with only the superior quadrant for the RNFL. Further studies are needed to confirm the concept that the GCL-IPL is a more sensitive biomarker than is the RNFL.
A significant difference was found in BCVA between the two groups in our study. Recent studies have shown that AD patients have significantly more-reduced accuracy in low luminance compared with age-matched controls.19 The increased prevalence of cataracts in AD patients may also affect BCVA.20 We were aware of this confounding factor for OCT parameters between the AD and control groups and, therefore, both the RNFL and GCL-IPL models were adjusted for BCVA.
Moreover, although there were no statistical differences in the systemic vascular conditions such as hypertension, diabetes and dyslipidemia between the AD and control groups. There may be residual confounders. Therefore, such systemic characteristics were also adjusted in OCT parameter comparison.
A previous study that performed OCT analysis of age-related thinning of the RNFL found a significant correlation between age and OCT parameters, consistent with our study.21 However, AD patients had thinner RNFL and GCL measures than did non-AD patients of the same age.8–11 When adjusted for age, BCVA, and systemic vascular conditions, there was still significant thinning of the RNFL in the AD group compared with controls. Therefore, AD may be an independent factor for RNFL thinning.
A previous study showed a significant correlation between OCT parameters and cognitive function.22 However, we found no correlation between MoCA scores and OCT parameters. Cognitive function is influenced by multiple factors, such as education, economic level, occupation and social activity.23 Thus, the MoCA may not accurately reflect the severity of disease.
This study had some limitations. First, it was conducted in a cross-sectional manner, so there was no follow-up. Second, patients with severely impaired cognition could not be recruited because they had poor attention and did not follow instructions. Conversely, the strengths of our study are as follows. 1) The AD and control groups were age-and-sex matched. 2) The sample size of each group was slightly larger than number required based on the calculation prior to the study. 3) In addition to RNFL thickness, GCL-IPL thickness was evaluated in our study.
Conclusions
In summary, the mean RNFL thickness and mean GCL-IPL thickness showed significant thinning in AD patients, specifically in the superior quadrant of the RNFL and almost every sector of the GCL-IPL. Overall, a significant negative correlation between age and RNFL thinning was noted. However, no correlation between the degree of cognitive impairment and RNFL thinning was found in this study.
Optical coherence tomography may be a feasible tool for detecting AD. However, a longitudinal study is needed to determine whether OCT parameters can serve as surrogate markers in patients with AD.
Consent for Publication
Not applicable.
Abbreviations
AD, Alzheimer’s disease; Aβ, amyloid-beta; RGC, retinal ganglion cell; RNFL, retinal nerve fiber layer; OCT, optical coherence tomography; GCL, ganglion cell layer; GCL-IPL, ganglion cell layer and inner plexiform layer; NINCDS-ADRDA, National Institute of Neurologic and Communicative Disorders and Stroke–Alzheimer’s Disease and Related Disorders Association; DSM IV, Diagnostic and Statistical Manual of Mental Disorders; MoCA, Montreal Cognitive Assessment; BCVA, best-corrected visual acuity; IOP, intraocular pressure; LogMAR, logarithm of the minimum angle of resolution; SD, standard deviation.
Acknowledgments
We thank Claire Barnes, PhD, from Edanz Group (https://en-author services.edanzgroup.com/) for editing a draft of this manuscript.
Funding
There is no funding to report.
Disclosure
The authors declare that they have no competing interests for this work.
References
1. Fratiglioni L, De Ronchi D, Aguero-Torres H. Worldwide prevalence and incidence of dementia. Drugs Aging. 1999;15:365–375. doi:10.2165/00002512-199915050-00004
2. Small BJ, Gagnon E, Robinson B. Early identification of cognitive deficits: preclinical Alzheimer’s disease and mild cognitive impairment. Geriatrics. 2007;62(4):19–23.
3. Hinton DR, Sadun AA, Blanks JC, Miller CA. Optic-nerve degeneration in Alzheimer’s disease. N Engl J Med. 1986;315:485–487. doi:10.1056/NEJM198608213150804
4. Paquet C, Boissonnot M, Roger F, Dighiero P, Gil R, Hugon J. Abnormal retinal thickness in patients with mild cognitive impairment and Alzheimer’s disease. Neurosci Lett. 2007;420(2):97–99. doi:10.1016/j.neulet.2007.02.090
5. Han X, Zhang T, Liu H, Mi Y, Gou X. Astrocyte senescence and Alzheimer’s disease: a review. Front Aging Neurosci. 2020;12:148. doi:10.3389/fnagi.2020.00148
6. Ratchford JN, Quigg ME, Conger A, et al. Optical coherence tomography helps differentiate neuromyelitis optica and MS optic neuropathies. Neurology. 2009;73:302–308. doi:10.1212/WNL.0b013e3181af78b8
7. Hajee ME, March WF, Lazzaro DR, et al. Inner retinal layer thinning in Parkinson’s disease. Arch Ophthalmol. 2009;127:737–741. doi:10.1001/archophthalmol.2009.106
8. Trebbastoni A, D’Antonio F, Bruscolini A, et al. Retinal nerve fiber layer thickness changes in Alzheimer’s disease: results from a 12-month prospective case series. Neurosci Lett. 2016;629:165–170. doi:10.1016/j.neulet.2016.07.006
9. Kesler A, Vakhapova V, Korczyn AD, Naftaliev E, Neudorfer M. Retinal thickness in patients with mild cognitive impairment and Alzheimer’s disease. Clin Neurol Neurosurg. 2011;113:523–526. doi:10.1016/j.clineuro.2011.02.014
10. Pillai JA, Bermel R, Bonner-Jackson A, et al. Retinal nerve fiber layer thinning in Alzheimer’s disease: a case-control study in comparison to normal aging, Parkinson’s disease, and non-Alzheimer’s dementia. Am J Alzheimers Dis Other Demen. 2016;31:430–436. doi:10.1177/1533317515628053
11. Cheung CY, Ong YT, Hilal S, et al. Retinal ganglion cell analysis using high-definition optical coherence tomography in patients with mild cognitive impairment and Alzheimer’s disease. J Alzheimers Dis. 2015;45:45–56. doi:10.3233/JAD-141659
12. Koronyo Y, Salumbides BC, Black KL, Koronyo-Hamaoui M. Alzheimer’s disease in the retina: imaging retinal Aß plaques for early diagnosis and therapy assessment. Neurodegener Dis. 2012;10(1–4):285–293. doi:10.1159/000335154
13. Thompson KL, Yeo JM, Waddell B, et al. A systematic review and meta-analysis of retinal nerve fiber layer change in dementia, using optical coherence tomography. Alzheimers Dement Diagn Asses Dis Moni. 2015;1(2):136–143.
14. Liu D, Zhang L, Li Z, et al. Thinner changes of the retinal nerve fiber layer in patients with mild cognitive impairment and Alzheimer’s disease. BMC Neurol. 2015;15:14. doi:10.1186/s12883-015-0268-6
15. Bambo MP, Garcia-Martin E, Pinilla J, et al. Detection of retinal nerve fiber layer degeneration in patients with Alzheimer’s disease using optical coherence tomography: searching new biomarkers. Acta Ophthalmol. 2014;92:e581–2. doi:10.1111/aos.12374
16. Berisha F, Feke GT, Trempe CL, et al. Retinal abnormalities in early Alzheimer’s disease. Invest Ophthalmol Vis Sci. 2007;48:2285–2289. doi:10.1167/iovs.06-1029
17. Chi Y, Wang YH, Yang L. The investigation of retinal nerve fiber loss in Alzheimer’s disease. Zhonghua Yan Ke Za Zhi. 2010;46:134–139.
18. Armstrong RA. Visual field defects in Alzheimer’s disease patients may reflect differential pathology in the primary visual cortex. Optom Vis Sci. 1996;73(11):677–682. doi:10.1097/00006324-199611000-00001
19. Sadun AA, Bassi CJ. Optic nerve damage in Alzheimer’s disease. Ophthalmology. 1990;97:9–17. doi:10.1016/S0161-6420(90)32621-0
20. Jefferis JM, Mosimann UP, Clarke MP. Cataract and cognitive impairment: a review of the literature. Br J Ophthalmol. 2011;95:17–23. doi:10.1136/bjo.2009.165902
21. Parikh RS, Parikh SR, Sekhar GC, Prabakaran S, Babu JG, Thomas R. Normal age-related decay of retinal nerve fiber layer thickness. Ophthalmology. 2007;114:921–926. doi:10.1016/j.ophtha.2007.01.023
22. Cunha LP, Lopes LC, Costa-Cunha LV, et al. Macular thickness measurements with frequency domain-OCT for quantification of retinal neural loss and its correlation with cognitive impairment in Alzheimer’s disease. PLoS One. 2016;11:e0153830. doi:10.1371/journal.pone.0153830
23. Kim M, Park J. Factors affecting cognitive function according to gender in community-dwelling elderly individuals. Epidemiol Health. 2017;39:e2017054. doi:10.4178/epih.e2017054
 © 2020 The Author(s). This work is published and licensed by Dove Medical Press Limited. The
full terms of this license are available at https://www.dovepress.com/terms
and incorporate the Creative Commons Attribution
- Non Commercial (unported, 3.0) License.
By accessing the work you hereby accept the Terms. Non-commercial uses of the work are permitted
without any further permission from Dove Medical Press Limited, provided the work is properly
attributed. For permission for commercial use of this work, please see paragraphs 4.2 and 5 of our Terms.
© 2020 The Author(s). This work is published and licensed by Dove Medical Press Limited. The
full terms of this license are available at https://www.dovepress.com/terms
and incorporate the Creative Commons Attribution
- Non Commercial (unported, 3.0) License.
By accessing the work you hereby accept the Terms. Non-commercial uses of the work are permitted
without any further permission from Dove Medical Press Limited, provided the work is properly
attributed. For permission for commercial use of this work, please see paragraphs 4.2 and 5 of our Terms.