")
Back to Journals » International Journal of Nanomedicine » Volume 9 » Issue 1
Evaluation of renal quantitative T2* changes on MRI following administration of ferumoxytol as a T2* contrast agent
Authors Hedgire S, McDermott S, Wojtkiewicz G, Abtahi SM, Harisinghani M, Gaglia J
Received 28 January 2014
Accepted for publication 15 March 2014
Published 28 April 2014 Volume 2014:9(1) Pages 2101—2107
DOI https://doi.org/10.2147/IJN.S61460
Checked for plagiarism Yes
Review by Single anonymous peer review
Peer reviewer comments 3
Sandeep S Hedgire,1 Shaunagh McDermott,1 Gregory R Wojtkiewicz,1 Seyed Mahdi Abtahi,1 Mukesh Harisinghani,1 Jason L Gaglia2
1Center for Systems Biology, Massachusetts General Hospital, Richard B Simches Research Center, 2Joslin Diabetes Center, Boston, MA, USA
Purpose: To evaluate the time-dependent changes in regional quantitative T2* maps of the kidney following intravenous administration of ferumoxytol.
Materials and methods: Twenty-four individuals with normal kidney function underwent T2*-weighted MRI of the kidney before, immediately after, and 48 hours after intravenous administration of ferumoxytol at a dose of 4 mg/kg (group A, n=12) or 6 mg/kg (group B, n=12). T2* values were statistically analyzed using two-tailed paired t-tests.
Results: In group A, the percentage changes from baseline to immediate post and baseline to 48 hours were 85.3% and 64.2% for the cortex and 90.8% and 64.6% for the medulla, respectively. In group B, the percentage changes from baseline to immediate post and baseline to 48 hours were 85.2% and 73.4% for the cortex and 94.5% and 74% for the medulla, respectively. This difference was significant for both groups (P<0.0001).
Conclusion: There is significant and differential uptake of ferumoxytol in the cortex and medulla of physiologically normal kidneys. This differential uptake may offer the ability to interrogate renal cortex and medulla with possible clinical applications in medical renal disease and transplant organ assessment. We propose an organ of interest based dose titration of ferumoxytol to better differentiate circulating from intracellular ferumoxytol particles.
Keywords: USPIO, ferumoxytol, renal MRI, T2* weighted imaging
Introduction
Ferumoxytol is an ultrasmall paramagnetic iron oxide (USPIO) nanoparticle that can be used as a negative contrast agent on T2*-weighted imaging. It is currently approved in North America and Europe as an iron replacement therapy in adults with chronic kidney disease. The use of this drug as a kidney blood pool agent and for imaging renal inflammatory conditions has been previously proposed, but baseline human data is lacking.
Although kidney disease may result in changes in glomerular filtration rate that can be easily detected by monitoring alterations in creatinine, specific diagnosis of the underlying pathologic process often requires percutaneous biopsy to obtain tissue for histologic evaluation. With the exception of gross structural abnormalities such as hydronephrosis or polycystic kidney disease, current renal imaging techniques including ultrasound, computed tomography, and magnetic resonance imaging (MRI) are simply not able to accurately identify many kidney diseases, necessitating biopsy for accurate diagnosis. The development of a noninvasive test that better differentiates underlying disease states would have tremendous impact on the management of kidney disease, facilitating diagnosis and treatment. Since ferumoxytol is neither filtered nor renally excreted, it offers advantages over classical MRI contrast agents, which may have renal toxicity, particularly in individuals with low glomerular filtration rates.
A number of nephropathies have associated inflammatory changes at the tissue level with macrophage infiltration commonly identified on kidney biopsy specimens, and for some nephropathies, there is a correlation between the stage of disease and the amount of macrophage infiltration.1 Since cells such as tissue macrophages and circulating monocytes have phagocytic activity and readily take up USPIO nanoparticles, several groups have proposed the utilization of USPIOs for the noninvasive detection of macrophages in the kidney associated with these nephropathies.2–4 The uptake of USPIO can be noninvasively monitored on T2- and T2*-weighted imaging.5 In animal models, distinct patterns have been identified on such imaging with a cortical pattern in anti-glomerular basement membrane glomerulonephritis,2 a medullary pattern in ischemia-reperfusion injury,6 and a diffuse pattern in renal graft rejection.3,4 The purpose of our study is to provide baseline human data demonstrating evolution of the quantitative T2* changes in the renal cortex and medulla following administration of ferumoxytol in individuals without nephropathy at 4 mg/kg and 6 mg/kg dosages.
Materials and methods
Population
The present study is a single-center study of individuals without known kidney disease and estimated glomerular filtration rate (eGFR) >60 mL/min/1.73 m2. The participants (n=24), fourteen men and ten women, were drawn from two separate prospective studies. Nine were from a study staging lymph nodes in pancreatic cancer and fifteen were from a study evaluating changes in the pancreas with the development of type 1 diabetes which included both those with recent onset diabetes and normal controls. Participants had a mean age of 41.21 years (range 21–92 years, average age in group A: 27.3 years, in group B: 55.0 years). Primary power calculations were performed for the two studies from which these participants were derived.
The status of the renal function in these patients was assessed by eGFR which was calculated using the formula GFR =186 × (plasma creatinine)−1.154 × (age in years)−0.203 × 0.742 (for female patients). Informed consent was obtained from all study participants after the nature of the procedures had been fully explained. The studies (clinicaltrials.gov identifiers NCT00920023 and NCT01521520) were approved by the Dana Farber Cancer Institute Institutional Review Board and Partners Human Research Committee respectively.
Characteristics and administration of the contrast agent
Ferumoxytol (AMAG Pharmaceuticals, Lexington, MA, USA) is an USPIO with an average colloidal particle size of 30 nm by light scattering and a molecular weight of 750 kDa. It is comprised of a nonstoichiometric magnetite core covered by a semisynthetic carbohydrate coating of polyglucose sorbitol carboxymethyl ether designed to minimize immunological sensitivity. Ferumoxytol is available as a sterile neutral pH liquid containing 30 mg of elemental iron per mL. The blood half-life is dose-dependent and is approximately 14.5 hours at a dose of 4 mg/kg.7 All subjects received ferumoxytol intravenously at a dose of 4 mg/kg (group A, n=12) or 6 mg/kg (group B, n=12) to a maximum dose of 510 mg of elemental iron.
MRI and analysis
MRI of the upper abdomen (T1, T2, and T2*-weighted imaging) was performed on a 3T system (Siemens, Erlangen, Germany) using 8-channel phased array body coil, before, immediately after, and 48 hours after the intravenous administration of ferumoxytol. Imaging times ranged from 30 to 45 minutes. Quantitative T2* sequences were performed as breath-hold, mono-polar, multi-echo, gradient echo sequences with six in-phase, equally spaced echoes (echo time [TE] =2.5–14.8 milliseconds, repetition time [TR] =169 milliseconds, thickness =4 mm, 6-point log linear fit algorithm) in all patients. These scans were reviewed by two radiologists on dedicated image-viewing software (v.3.8.1; OsiriX, Pixmeo Sarl, Bernex, Switzerland) and the quantitative T2* value of the renal cortex and medulla were measured bilaterally as consensus at the upper and lower poles by drawing six (for cortex and medulla each) equal-sized, non-overlapping operator-dependent regions of interest (ROI) at all three time points to calculate average quantitative T2* values. These values were normalized to the paraspinal muscles by drawing equal-sized ROI bilaterally at all three time points. We decided to normalize the T2* values and use muscle T2* as a reference standard and internal control to avoid variability in each sample and to improve the efficacy and standardize the data. Normalization allowed comparison over time and across subjects and groups. The normalized ratios were then statistically analyzed using two-tailed paired t-tests using GraphPad Prism (v6; GraphPad Software Inc., La Jolla, CA, USA). A P-value <0.05 was considered statistically significant.
Results
Following intravenous administration, ferumoxytol can be noted in several body compartments. Initially, there is a short arterial enhancement that could be used for perfusion imaging, this is followed by blood pool enhancement that could be used for angiography, and finally, ferumoxytol is cleared from the intravascular space and is metabolized within macrophages. In group A, the average quantitative T2* values of the renal cortex and medulla at baseline were 52.9 milliseconds and 34.7 milliseconds, respectively. Immediately following intravenous administration of ferumoxytol, these values decreased to 7.7 milliseconds for the cortex and 3.1 milliseconds for the medulla, representing an 85.3% decrease for the cortex and 90.8% decrease for the medulla. At 48 hours post-ferumoxytol injection, these values increased to 18.9 milliseconds for the cortex and 12.2 milliseconds for the medulla (Figures 1–4), representing a 64.2% decrease for the cortex and 64.6% decrease for the medulla compared to baseline quantitative T2* values.
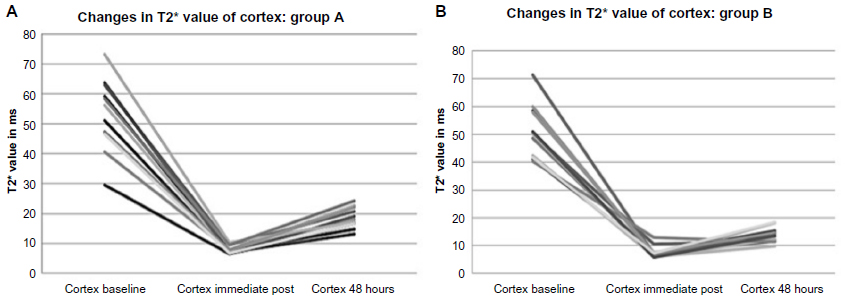 | Figure 1 Evolution of quantitative T2* values in the renal cortex before, immediately after, and at 48 hours following administration of ferumoxytol in (A) group A and (B) group B. |
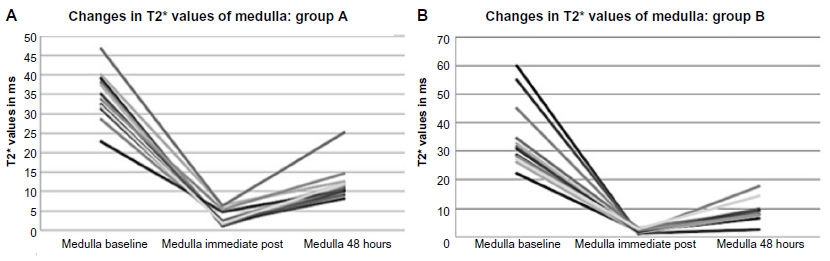 | Figure 2 Evolution of quantitative T2* values in the renal medulla before, immediately after, and at 48 hours following administration of ferumoxytol in (A) group A and (B) group B. |
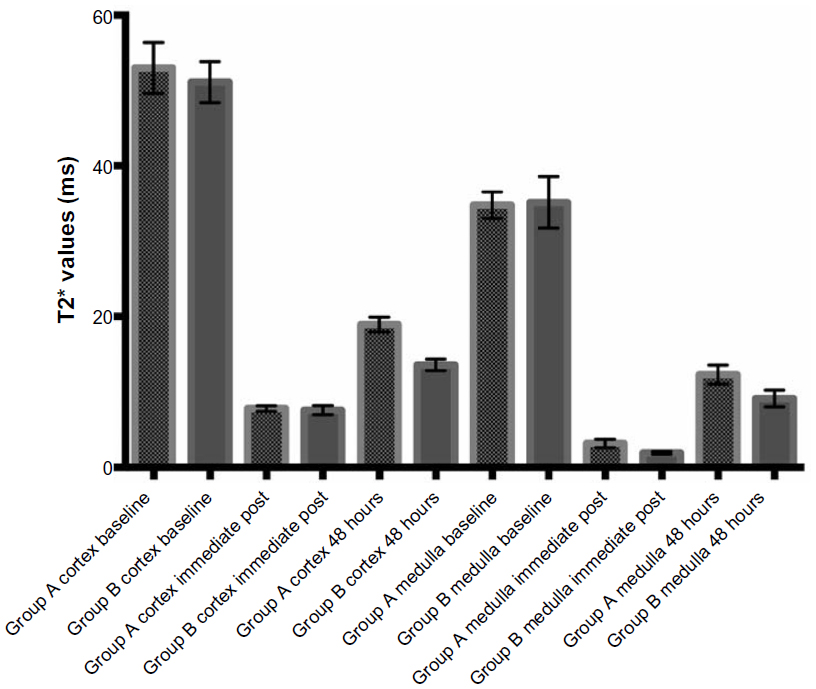 | Figure 3 Comparison of quantitative T2* values of the renal cortex and medulla at all three time points. |
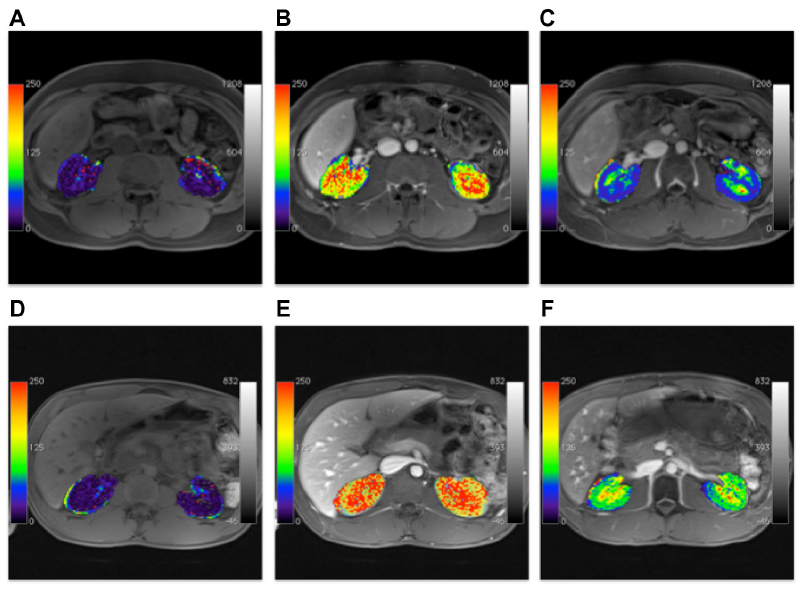 | Figure 4 Pseudocolored maps derived from the T2* images and T1-weighted images (TR: 2.9 ms, TE: 0.8 ms, matrix 256×179, flip angle: 12°, fat-saturated, slice thickness 3.5 mm) showing renal uptake of ferumoxytol at baseline (A), immediate post-injection (B), and at 48 hours (C) post-injection in group A, which received the dose of 4 mg/kg compared to group B (D: baseline, E: immediate post-injection, F: at 48 hours) which received a dose of 6 mg/kg. Visual evaluation of these color maps show comparison of baseline (blue in A and D) quantitative T2* values with changes (seen in yellow–red on B and E) on immediate post-ferumoxytol injection and at 48 hours (seen as green–blue on C and F). |
In group B, the average quantitative T2* values of the renal cortex and medulla at baseline were 51.0 milliseconds and 35.1 milliseconds, respectively. Immediately following intravenous administration of ferumoxytol, these values decreased to 7.5 milliseconds for the cortex and 1.9 milliseconds for the medulla, representing an 85.2% decrease for the cortex and 94.5% decrease for the medulla. At 48 hours post-ferumoxytol injection, these values increased to 13.5 milliseconds for the cortex and 9.1 milliseconds for the medulla, representing a 73.4% decrease for the cortex and a 74% decrease for the medulla compared to baseline quantitative T2* values. At 48 hours, the quantitative T2* values for the cortex and medulla did not return to the observed baseline quantitative T2* values. For group A, the average normalized values for the cortex at baseline, immediately after, and at 48 hours were 2.0, 0.36, and 0.80; for the medulla, these values were 1.31, 0.14, and 0.51, respectively. For group B, the average normalized values for the cortex at baseline, immediately after, and at 48 hours were 2.31, 0.48, and 0.69; for the medulla, these values were 1.6, 0.12, and 0.46, respectively.
The differences between the normalized quantitative T2* values between baseline and immediate post and between immediate post and 48 hours were statistically significant for the cortex and medulla in both groups (P<0.0001). Comparing the normalized quantitative T2* at baseline and at 48 hours also showed a statistically significant change for both the cortex and medulla (P≤0.0001) in both groups (Figure 5). Comparing groups A and B showed a significant difference at the 48 hour time point for the cortex (P=0.0056) but not the medulla (P=0.06).
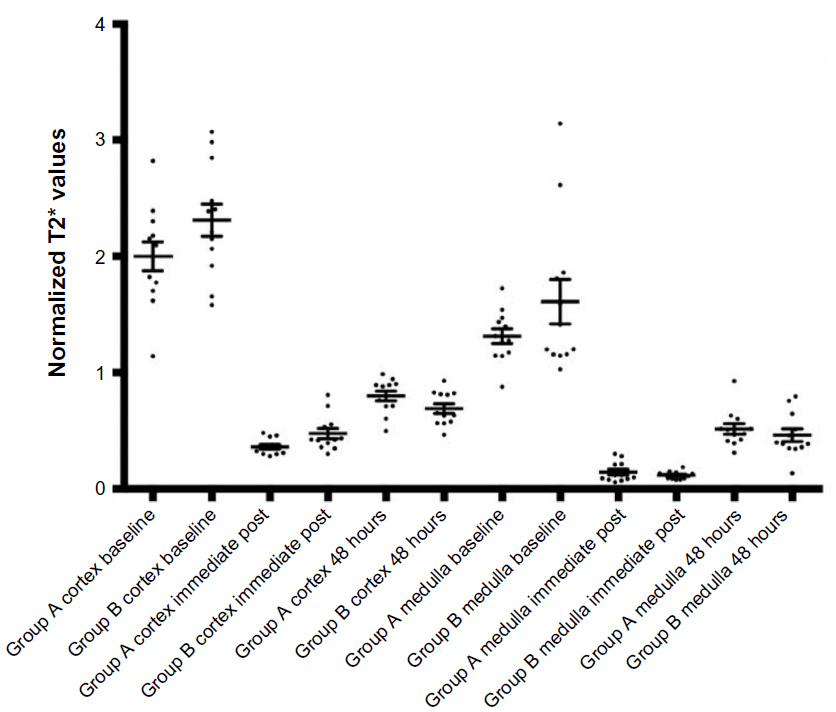 | Figure 5 Scatter plot with mean and standard error showing distribution of normalized quantitative T2* values of the renal cortex and medulla at all three time points in both groups. |
Discussion
Recent developments in MRI have facilitated a move toward functional imaging. USPIOs have previously been used as negative T2 and T2* contrast agents in a number of clinical trials of various disease states. Several USPIOs have been studied in animal models of kidney disease,2–4,6 with at least one having been studied in humans.8
Ferumoxytol is approved in North America and Europe for the treatment of anemia in chronic renal disease. The clinical availability of this agent and the susceptibility effects induced by this agent on MRI have led to interest in its use in clinical imaging. Its presumed safety in renal disease has peaked interest in the use of ferumoxytol as an MRI contrast agent for vascular imaging in patients with renal failure.9 Studies done in the past have highlighted the use of other USPIOs in functional renal imaging but with limited data in humans.10–12 Our study reveals the evolution of the quantitative T2* changes in the renal cortex and medulla following administration of ferumoxytol in normal individuals without nephropathy at 4 mg/kg and 6 mg/kg dosages.
Large magnetic dipole moments of ferumoxytol decrease both T2 and T2*. In this study, we focused on quantitative T2* as it is governed by larger vessels. Within the kidneys, the cortex and medulla are perfused at different rates and also differ in their water content, which explains the differences in their baseline quantitative T2* values (Figure 3).
During the arterial phase, a ferumoxytol bolus would be expected to transit the aorta, renal artery, outer cortex, juxtamedullary cortex, medulla, and then the inferior vena cava. In our study, the quantitative T2* values immediately dropped for both the cortex and medulla following intravenous bolus administration of ferumoxytol. This selective compartmentalization could be used to assess renal perfusion independent of renal excretory function. Consistent with the medulla having a greater vascular volume than the cortex,13–16 the percentage change in quantitative T2* was greater in the renal medulla at both doses studied.
Ferumoxytol is not filtered by the glomeruli and generally stays in the circulation until cleared via the reticuloendothelial system. Surprisingly, at 48 hours, the quantitative T2* values for the cortex and medulla did not return to baseline, signifying the persistent effect of ferumoxytol. Although the intravascular half-life of ferumoxytol had previously been reported to be 14.5 hours,7 this half-life is dose-dependent. In our study, we saw evidence of residual ferumoxytol in the intravascular compartment based on continued depression of quantitative T2* values at 48 hours. The depressive effects of this residual probe on quantitative T2* remained after normalizing with the skeletal muscle values. Interestingly, at 48 hours, the quantitative T2* gradient between the cortex and medulla was wider than at the immediate post-ferumoxytol time point (Figure 3). It is possible that this difference could be used to interrogate the renal cortex and medulla in a variety of renal diseases. The trend in the normalized values was parallel to the quantitative T2* values alone (Figure 5). It is unlikely that this finding was due to heterogeneity in vasculature as quantitative T2* measures within regions in the upper and lower pole of a given anatomic region or between similar anatomic regions of the left and right kidney were fairly uniform, as would be expected in individuals without known kidney disease. Hence, lower doses and/or a further delayed time point may be needed to image the third phase of ferumoxytol after it has cleared the intravascular space. Our study is aimed at establishing the baseline quantitative T2* values following administration of ferumoxytol. We hope it will generate interest in researchers to perform more studies with kidney injury models or in persons with known renal disease and to compare the newer data with our baseline values.
Although not directly addressed in this study, another potential use of ferumoxytol-based renal imaging could be the evaluation of ischemic kidney disease. Ischemic renal injury affecting native and transplant kidneys can lead to acute renal failure, which is a life-threatening illness with mortality ranging from 30% to 50%.17 At present, no imaging tool detects, localizes, and characterizes ischemic changes in the kidneys. This coupled with ambiguity in the pathogenesis of acute renal failure, often leaves the final diagnosis to invasive methods like biopsy. Following ischemia, monocytes/macrophages accumulate in the renal medulla. Imaging of the third phase of ferumoxytol distribution, after it has cleared from the intravascular space could be used to visualize such cellular changes within the renal medulla. Anecdotal data supports renal macrophage uptake of ferumoxytol with at least one case report demonstrating iron-laden macrophages in the kidney of a patient with an inflammatory nephropathy several days after ferumoxytol infusion.18 In a study by Jo et al, renal ischemic changes were visualized on iron oxide particle-enhanced MRI in rats as a black line in the outer medulla on day 5 after induced ischemia.6 Matsushita et al demonstrated a linear relationship between the USPIO and R2* (1/T2*) and imaged inflammatory changes in mice.19 Hauger and colleagues were amongst the first to publish data in humans on MR imaging in cases of acute or subacute renal failure by measuring changes in the signal intensity that correlated with the amount of infiltrating macrophages.8 They used a similar USPIO at a lower dose of a maximum of 2.6 mg/kg and proposed use of USPIO-enhanced MR imaging in differentiating inflammatory from non-inflammatory renal disease. To our knowledge, the evolution of quantitative T2* changes in physiologically normal kidneys following intravenous administration of ferumoxytol at high doses (4 and 6 mg/kg) have not been reported previously. Here we confirm that T2* changes post ferumoxytol, as imaged by a robust multiecho gradient echo sequence, offer quantitative measurements of the renal cortex and medulla.
These observations may lead to many possible applications of quantitative imaging with ferumoxytol in ischemic and inflammatory disease of native and transplant kidneys, potentially avoiding the need for biopsy in the diagnosis and monitoring of disease in these settings.
In addition to potential diagnostic applications, ferumoxytol-enhanced MRI may also have applications in predicting disease course. For example, in immunoglobulin A nephropathy, tubulointerstitial inflammation, including the degree of macrophage infiltration on biopsy is predictive of disease progression.20 MR imaging could yield this same information without biopsy. Such information would be extremely useful in determining the aggressiveness of therapy.
In this study, we examined only small numbers of individuals with normal renal function at two doses of ferumoxytol. One of the limitations of our study was a lack of slice-by-slice comparison in the analysis of temporal changes in quantitative T2* values. While the doses of ferumoxytol studied could be used to image the perfusion and blood pool phases of ferumoxytol distribution, conditions for imaging macrophage uptake after clearance of the probe from the intravascular space were not identified in this study.
Acknowledgments
This research was made possible by grants from the US National Institutes of Health P50CA127003 via the Dana Farber/Harvard Cancer Center Specialized Program of Research Excellence in Gastrointestinal Cancers and P01AI054904.
Disclosure
The authors report no conflicts of interest in this work.
References
Furness PN, Rogers-Wheatley L, Harris KP. Semiautomatic quantitation of macrophages in human renal biopsy specimens in proteinuric states. J Clin Pathol. 1997;50(2):118–122. | |
Hauger O, Delalande C, Deminière C, et al. Nephrotoxic nephritis and obstructive nephropathy: evaluation with MR imaging enhanced with ultrasmall superparamagnetic iron oxide-preliminary findings in a rat model. Radiology. 2000;217(3):819–826. | |
Ye Q, Yang D, Williams M, et al. In vivo detection of acute rat renal allograft rejection by MRI with USPIO particles. Kidney Int. 2002;61(3):1124–1135. | |
Beckmann N, Cannet C, Fringeli-Tanner M, et al. Macrophage labeling by SPIO as an early marker of allograft chronic rejection in a rat model of kidney transplantation. Magn Reson Med. 2003;49(3):459–467. | |
Grenier N, Basseau F, Ries M, Tyndal B, Jones R, Moonen C. Functional MRI of the kidney. Abdom Imaging. 2003;28(2):164–175. | |
Jo S-K, Hu X, Kobayashi H, et al. Detection of inflammation following renal ischemia by magnetic resonance imaging. Kidney Int. 2003;64(1):43–51. | |
Landry R, Jacobs PM, Davis R, Shenouda M, Bolton WK. Pharmacokinetic study of ferumoxytol: a new iron replacement therapy in normal subjects and hemodialysis patients. Am J Nephrol. 2005;25(4):400–410. | |
Hauger O, Grenier N, Deminère C, et al. USPIO-enhanced MR imaging of macrophage infiltration in native and transplanted kidneys: initial results in humans. Eur Radiol. 2007;17(11):2898–2907. | |
Sigovan M, Gasper W, Alley HF, Owens CD, Saloner D. USPIO-enhanced MR angiography of arteriovenous fistulas in patients with renal failure. Radiology. 2012;265(2):584–590. | |
Ersoy H, Jacobs P, Kent CK, Prince MR. Blood pool MR angiography of aortic stent-graft endoleak. AJR Am J Roentgenol. 2004;182(5):1181–1186. | |
Anzai Y, Prince MR, Chenevert TL, et al. MR angiography with an ultrasmall superparamagnetic iron oxide blood pool agent. J Magn Reson Imaging. 1997;7(1):209–214. | |
Kobayashi H, Jo S-K, Kawamoto S, et al. Polyamine dendrimer-based MRI contrast agents for functional kidney imaging to diagnose acute renal failure. J Magn Reson Imaging. 2004;20(3):512–518. | |
Garcia-Sanz A, Rodriguez-Barbero A, Bentley MD, Ritman EL, Romero JC. Three-dimensional microcomputed tomography of renal vasculature in rats. Hypertension. 1998;31(1 Pt 2):440–444. | |
Boxerman JL, Hamberg LM, Rosen BR, Weisskoff RM. MR contrast due to intravascular magnetic susceptibility perturbations. Magn Reson Med. 1995;34(4):555–566. | |
Rasmussen SN. Intrarenal red cell and plasma volumes in the non-diuretic rat. Determination by means of 51Cr labelled red cells and 125I-gamma-M-immunoglobulin. Pflugers Arch. 1973;342(1):61–72. | |
Pallone TL, Robertson CR, Jamison RL. Renal medullary microcirculation. Physiol Rev. 1990;70(3):885–920. | |
Patschan D, Patschan S, Müller GA. Microvasculopathy in ischemic acute kidney injury: consequences and therapeutic implications. Panminerva Med. 2012;54(1):45–52. | |
Tolouian R, Rajabi B, Boman D, Bilbao J, Gupta A. Iron infusion and deposition in the kidney. Clin Nephrol. 2013;79(3):237–240. | |
Matsushita T, Kusakabe Y, Fujii H, Murase K, Yamazaki Y, Murase K. Inflammatory imaging with ultrasmall superparamagnetic iron oxide. Magn Reson Imaging. 2011;29(2):173–178. | |
Myllymäki JM, Honkanen TT, Syrjänen JT, et al. Severity of tubulointerstitial inflammation and prognosis in immunoglobulin A nephropathy. Kidney Int. 2007;71(4):343–348. |
 © 2014 The Author(s). This work is published and licensed by Dove Medical Press Limited. The full terms of this license are available at https://www.dovepress.com/terms.php and incorporate the Creative Commons Attribution - Non Commercial (unported, v3.0) License.
By accessing the work you hereby accept the Terms. Non-commercial uses of the work are permitted without any further permission from Dove Medical Press Limited, provided the work is properly attributed. For permission for commercial use of this work, please see paragraphs 4.2 and 5 of our Terms.
© 2014 The Author(s). This work is published and licensed by Dove Medical Press Limited. The full terms of this license are available at https://www.dovepress.com/terms.php and incorporate the Creative Commons Attribution - Non Commercial (unported, v3.0) License.
By accessing the work you hereby accept the Terms. Non-commercial uses of the work are permitted without any further permission from Dove Medical Press Limited, provided the work is properly attributed. For permission for commercial use of this work, please see paragraphs 4.2 and 5 of our Terms.