Back to Journals » Diabetes, Metabolic Syndrome and Obesity » Volume 14
Evaluation of Red Blood Cell Parameters as a Biomarker for Long-Term Glycemic Control Monitoring Among Type 2 Diabetic Patients in Southwest Ethiopia: A Cross-Sectional Study
Authors Asmamaw M ![]() , Sime T
, Sime T ![]() , Kene K
, Kene K ![]() , Fekadie Baye M
, Fekadie Baye M ![]() , Teshome M, Zawdie B
, Teshome M, Zawdie B ![]()
Received 11 November 2021
Accepted for publication 23 December 2021
Published 30 December 2021 Volume 2021:14 Pages 4993—5000
DOI https://doi.org/10.2147/DMSO.S348907
Checked for plagiarism Yes
Review by Single anonymous peer review
Peer reviewer comments 4
Editor who approved publication: Professor Ming-Hui Zou
Misganaw Asmamaw,1 Tariku Sime,2 Kumsa Kene,2 Minale Fekadie Baye,2 Muluken Teshome,3 Belay Zawdie2
1Division of Biochemistry, Department of Biomedical Sciences, College of Medicine and Health Sciences, Debre Tabor University, Debre Tabor, Ethiopia; 2Division of Biochemistry, Department of Biomedical Sciences, Institute of Health, Jimma University, Jimma, Ethiopia; 3Division of Physiology, Department of Biomedical Sciences, College of Medicine and Health Sciences, Debre Tabor University, Debre Tabor, Ethiopia
Correspondence: Misganaw Asmamaw
Division of Biochemistry, Department of Biomedical Sciences, College of Medicine and Health Sciences, Debre Tabor University, Debre Tabor, Ethiopia
Tel +251967153508
Email [email protected]
Objective: The main aim of this study was to assess red blood cell parameters as a biomarker for long-term glycemic monitoring among T2 DM patients.
Methods: Facility-based cross-sectional study through a consecutive sampling technique was conducted among 124 T2 DM patients at the chronic illness follow-up clinic of Jimma Medical Center (JMC) from July 27 to August 31, 2020. A structured questionnaire was used to collect socio-demographic and clinical-related data. Five milliliters of the blood specimen were collected from each eligible T2 DM patient. Glycated hemoglobin (HbA1c) and red blood cell parameters were determined by Cobas 6000 and DxH 800 fully automated analyzers, respectively. Data were entered into EpiData software version 3.1 and exported to SPSS 25 version for analysis. Independent t-test and Pearson’s correlation coefficient were used to address the research questions. A P-value < 0.05 was considered statistically significant.
Results: The mean age of study participants was 51.84± 11.6 years. Moreover, 60.5% of T2 DM patients were in poor glycemic control. There was a significant mean difference between good and poor glycemic controlled T2 DM patients in red blood cell count (4.79± 0.5 vs 4.38± 0.8), hemoglobin (14.13± 1.4 vs 13.60± 1.6), mean corpuscular volume (89.52± 4.7 vs 92.62± 7.5), mean corpuscular hemoglobin (29.63± 1.6 vs 30.77± 2.9), and red cell distribution width (13.68± 1.1 vs 14.63± 1.2) respectively. Red blood cell count was inversely correlated (r=− 0.280, p=0.002) with HbA1c while mean corpuscular volume (r=0.267, p=0.003), mean corpuscular hemoglobin (r=0.231, p=0.010), and red cell distribution width (r= 0.496, p=0.000) were positively correlated with level of HbA1c.
Conclusion: Red cell count, mean corpuscular volume, mean corpuscular hemoglobin, and red cell distribution width could be useful indicators to monitor the glycemic status of T2 DM patients instead of HbA1c, though large prospective studies should be considered.
Keywords: T2 DM, hyperglycemia, HbA1c, red blood cell parameters
Background
Type 2 diabetes mellitus (T2 DM) is a common type of DM characterized by hyperglycemia, due to insulin resistance and relative impairment in insulin secretion.1 Although the pathogenesis of T2 DM is multifactorial, chronic hyperglycemia is the major factor for the development of both micro- and macro-vascular complications.2,3 Thus, strict control of hyperglycemia is the main therapeutic objective to prevent or delay complications associated with DM.4
The most common laboratory tests used for screening and monitoring of glycemic status in the clinical management of DM comprise fasting blood sugar (FBS), random blood sugar (RBS), oral glucose tolerance test (OGTT), and glycated hemoglobin (HbA1c) test.5 The HbA1c is a hemoglobin variant, formed by condensation of a glucose molecule with N-terminal residue in the β-chain of hemoglobin. Analysis of HbA1c in the blood provides the average blood glucose levels of diabetic patients during the past 2–3 months, which is the expected life span of red blood cells (RBCs).6 HbA1c is the most effective biomarker of long-term glycemic monitoring than other glucose-based tests because it is less influenced by factors like food ingestion, stress, exercise, and immediate therapeutic responses.7
RBC parameters are components of complete blood count (CBC), which comprises a panel of analytic tests usually used to differentiate different types of anemia.8 RBC parameters include red blood cell (RBC) count, hematocrit (HCT), hemoglobin (HGB), mean corpuscular volume (MCV), mean corpuscular hemoglobin (MCH), mean corpuscular hemoglobin concentration (MCHC), and red cell distribution width (RDW).9
Continual exposure of hyperglycemia in RBCs results in persistent glycation of hemoglobin protein, which causes the structural and functional change of hemoglobin molecule.10 Besides the glycation of proteins, hyperglycemia has several other effects on RBCs like change in the mechanical properties and internal viscosity of RBCs, increased aggregation, and osmotic fragility, consequently leading to changes in erythrocyte structure and hemodynamic characteristics.11,12 These changes may be reflected by any one or all of red blood cell analytical parameters such as RBC count, HGB, HCT, MCV, MCH, MCHC, and RDW. A few recent pieces of evidence also showed that red blood cell-related parameters can be used to monitor diabetes control and the progression of its complication.13,14 A retrospective study conducted in Libya among diabetic and non-diabetic patients also concluded that the values of RBC parameters are parallel with HbA1c and blood sugar level, so are important tools for the assessment of diabetic patients.15
Although the HbA1c test continues to be the gold standard for the assessment of long-term glycemic control, accessibility and affordability of the test in routine diagnosing service are still limited in developing countries especially in rural Africa.16 Lack of HbA1c tests in health care facilities is one of the hindrances for clinicians to make long-term management decisions about DM patients.17 Reports also showed that the absence of HbA1c measurement was an important indicator of frequent hospital readmission in T2 DM patients.18,19 Moreover, it has been reported that limited access to the HbA1c test appeared to be a key predictor of poor glycemic control and is a significant obstacle to improving glycemic control in T2 DM patients.20 In Ethiopia, HbA1c assay is not readily available in public health facilities even at referral hospitals, and is a relatively expensive test in some private sectors.21 Therefore, there is a need to find easily available means of monitoring glycemic status for resource-restricted countries. Hence, this study was aimed to evaluate red blood cell parameters as a biomarker for long-term glycemic monitoring among T2 DM patients in southwest Ethiopia.
Methods
Study Setting, Design and Period
A facility-based cross-sectional study design was carried out on type 2 DM patients at the chronic illness follow-up clinic of Jimma Medical Center (JMC). JMC is located in Jimma town at 353 km to the Southwestern of Addis Ababa, the capital of Ethiopia. It has different units and clinics that provide specialized services for clients. Among these, there is a separate chronic illness follow-up clinic in which diabetes mellitus patients are regularly monitored every Monday and Tuesday of the week. The study was conducted from July 27 to August 31, 2020.
Inclusion and Exclusion Criteria
Confirmed Type 2 diabetic patients ≥18 years of age on follow-up care in JMC were included in the study. T2 DM patients with the following criteria were excluded from the study after verified by checking their medical records:
- Critically ill T2 DM patients to the extent unable to communicate
- T2 DM patients with known anemia and/any hematologic disorder
- T2 DM patients with confirmed chronic liver and kidney disease
- Patients with known human immune HIV, tuberculosis, and/any type of malignancy
- Patients who transfused blood in the last 3 months prior to data collection
- T2 DM patients with a history of recurrent malaria and
- T2 DM patients who are pregnant.
Sample Size Determination and Sampling Technique
The minimum sample size required for the study was estimated using a single population proportion formula as follows: 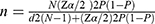
where
n = Minimum sample size required for the study
N = Number of T2 DM patients on follow-up care in JMC, which is 2700
Zα/2 = Confidence interval (CI) at 95%, which is 1.96 (where α = 0.05)
d = Margin of error tolerated which is 4%
P = Assumed the highest proportion of DM in the Ethiopian adult population 5.2%.22
By substituting to the above formula, 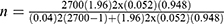 ,
,
The minimum sample size n becomes ~113, adding 10% of non-response rate, a total of 124 study participants were enrolled in the study using a consecutive sampling technique.
Data Collection and Blood Sample Analysis
An interviewer-administered structured questionnaire, adapted from the WHO STEPS instrument,23 was used to collect socio-demographic profiles, behavioral related factors, and clinical data of eligible participants.
After the interview and detailed review of the medical record, 5mL of the venous blood sample was collected from each eligible study participant using 5-cc sterile syringes, through the aseptic technique. About 2.5 mL of blood was dispensed into a labeled test tube containing ethylene-diamine-tetra acetic acid (EDTA) anticoagulant for testing of RBC parameters. The remaining 2.5 mL of blood was collected in a separate EDTA test tube for the analysis of HbA1c. The specimen was then transported to JMC laboratory unit for analysis on the same date of specimen collection to prevent whole blood hemolysis. RBC parameters were analyzed by a fully automated hematology analyzer, UniCel DxH 800 (Beckman Coulter, USA). HbA1c was determined by a fully automated Cobas® 6000 chemistry analyzer (Roche Diagnostics, Germany).
Operational Definitions
Red blood cell parameters are defined by a panel of tests, which comprises (RBC count, HCT, HGB, MCV, MCH, MCHC, and RDW).8
Glycemic control was categorized into two groups in T2 DM patients based on the ADA Standards of Medical Care in Diabetes 2020 recommendation.24
Good glycemic control: HbA1c <7%; Poor glycemic control: HbA1c ≥7%.
Statistical Analysis
Data were checked for completeness and entered into EpiData software version 3.1 and exported to Statistical Package for Social Science (SPSS) software version 25 for statistical analysis. All variables were cleaned through missing data analysis to avoid missing values and checked for the fulfillment of assumptions using histograms, boxplots and, scatter plots before analysis. To determine the level of glycemic status, study participants were grouped into two groups (poor and good glycemic control) according to their HbA1c value. Then, an independent t-test analysis was used to compare the mean of RBC parameters between the two groups. Pearson’s bivariate correlation coefficient (r) was used to determine the strength of association between each RBC parameter and HbA1c level. In all cases, P values less than 0.05 were considered to be statistically significant.
Data Quality Management
To ensure data quality, training, and adequate orientation were given for all data collectors. Accuracy, clarity, and completeness of data were reviewed and checked daily by the principal investigator. Sample collection, handling, processing, and analysis were performed by strictly following Standard Operational Procedures (SOPs) to address the quality issues in each analytical phase to guarantee accurate test results. Moreover, all reagents used were checked for their expiry date and both instruments were calibrated every day before the actual sample test according to the manufacturer's recommendation.
Results
Socio-Demographic Characteristics of Study Participants
A total of 124 eligible T2 DM patients had participated in this study. Out of which 63.7% and 36.3% were males and females, respectively. The overall average age of the study participants was 51.84 ± 11.6 years ranging between 30 and 83 years. The majority of the study participants (85.5%) were married, 58.1% were residing in urban areas (Table 1).
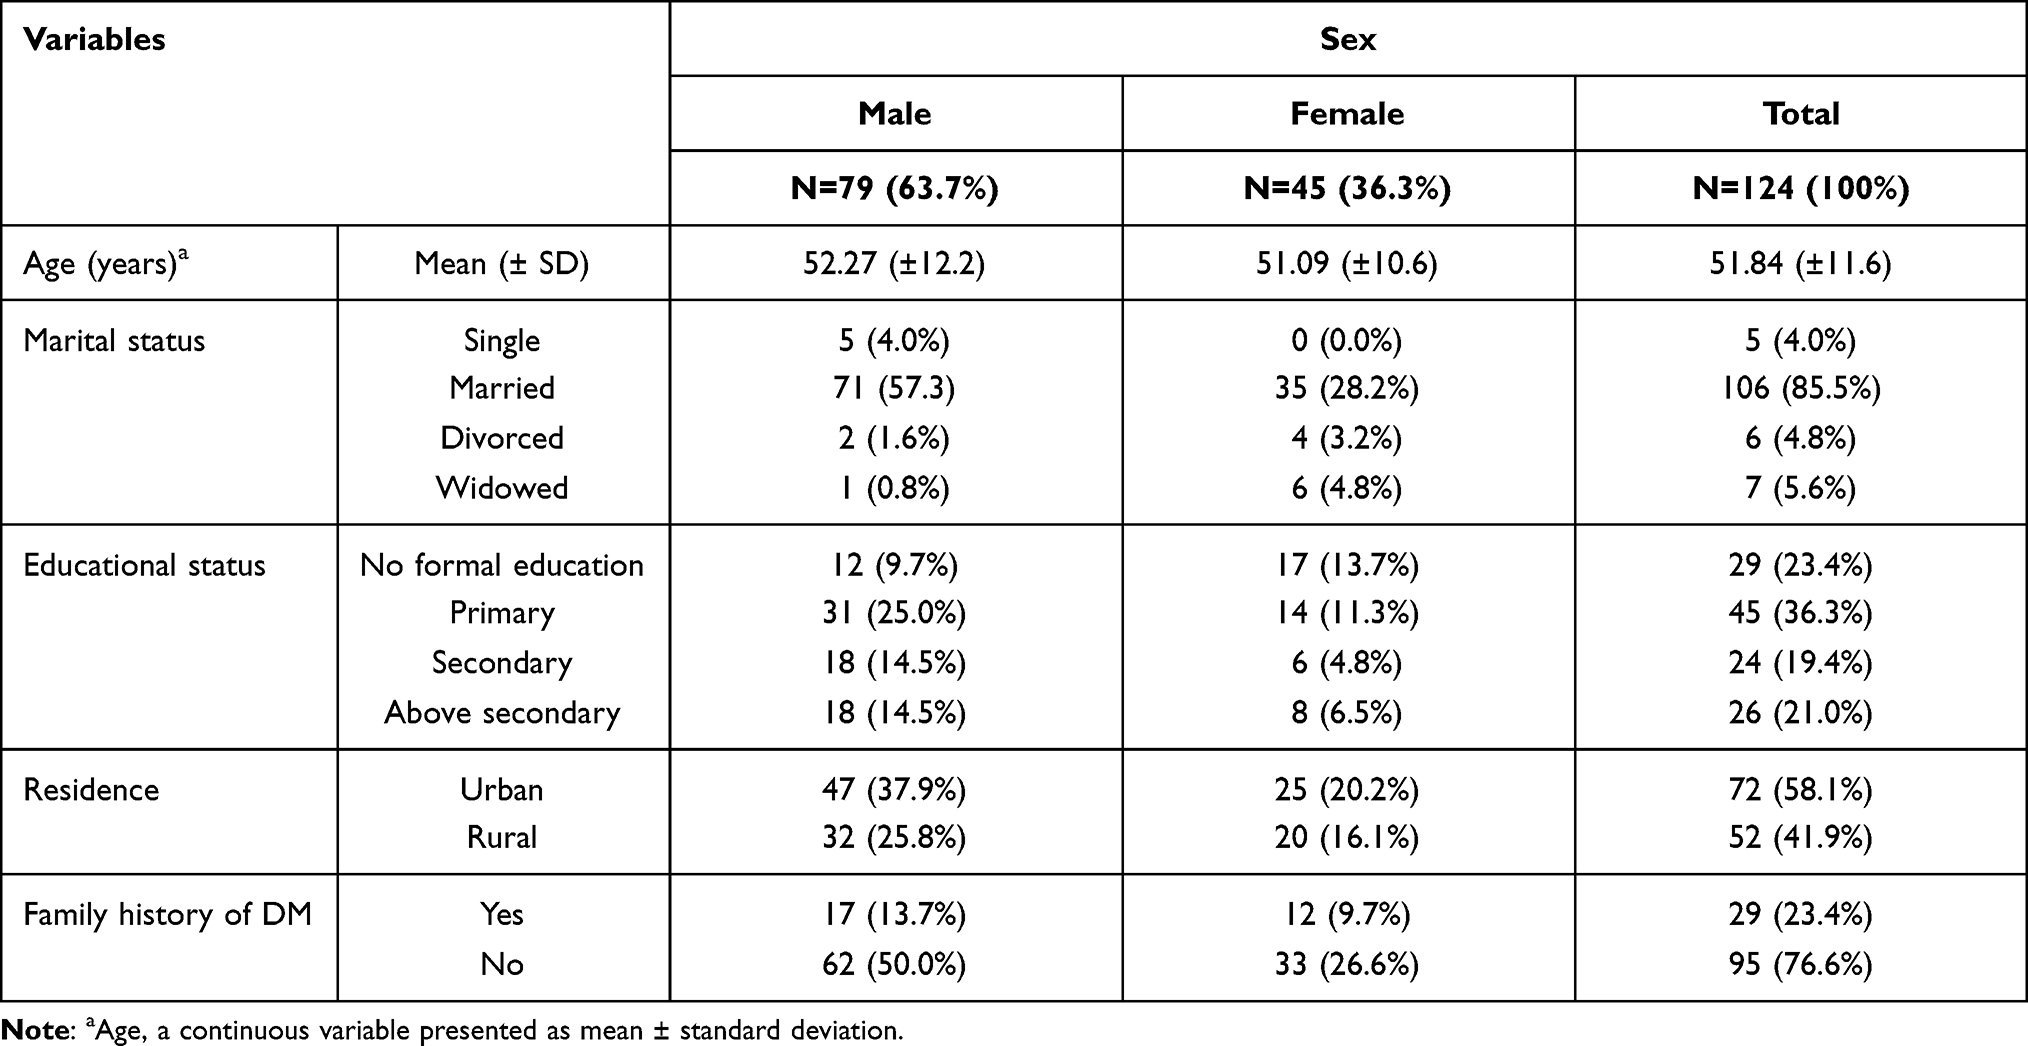 |
Table 1 Socio-Demographic Characteristics of T2 DM Patients on Follow-Up Care in JMC, Southwest Ethiopia, 2020 (N=124) |
RBC Parameters in T2 DM Patients
The total number of T2 DM patients was categorized into good glycemic control (GGC) and poor glycemic control (PGC). Moreover, 60.5% of T2 DM patients were in PGC. An independent t-test analysis was used to compare the mean values of RBC parameters between the two groups. RBC count and HGB were significantly (p<0.05) reduced in patients with HbA1c ≥7% compared to patients with HbA1c <7%. Meanwhile, MCV, MCH, and RDW were significantly (p<0.05) elevated in T2 DM patients with HbA1c ≥7% (Table 2).
 |
Table 2 Mean of RBC Parameters Among T2 DM Patients on Follow-Up Care in JMC, Southwest Ethiopia, 2020 (N=124) |
Correlation of RBC Parameters and HbA1c in T2 DM Patients
Bivariate Pearson’s product-moment correlation analysis was used to examine the relationship between red blood cell parameters and the HbA1c level in T2 DM patients. A statistically significant correlation was detected between RBC count, MCV, MCH, and RDW parameters with HbA1c level in T2 DM patients (Table 3).
 |
Table 3 Pearson’s Correlation Analysis Between RBC Parameters and HbA1c in T2 DM Patients on Follow-Up Care in JMC, Southwest Ethiopia, 2020 (N=124) |
Discussion
In the current study, RBC count was lowered in patients with HbA1c ≥7% than HbA1c <7%, groups, and the difference was statistically significant (Table 2). This is because chronic exposure to high glucose results in non-enzymatic glycation of hemoglobin and membrane proteins, leading to accelerated aging of RBCs that ultimately might decrease RBC count in patients with persistent hyperglycemia.25 The other possible mechanism could be due to altered fluid–electrolyte balance. It has been reported that the activity of erythrocytes’ membrane cat-ion pump proteins (Na+/K+-ATPase and Ca2+-ATPase) was significantly reduced in T2 DM patients with elevated blood glucose levels and a significant negative correlation with the level of FBS was observed.26,27 A significant negative correlation was also observed between RBC count and HbA1c level (Table 3). The finding is consistent with the previous studies conducted in Saudi28 and Serbia,29 which reported decreased RBC count in poor glycemic controlled T2 DM patients. However, in contrast to our finding, a study conducted in Bangladesh reported no significant mean difference of RBC count between poor and good glycemic controlled T2 DM patients (p=0.608), and no correlation to HbA1c level.30 The possible hypothesis for this difference might be due to the relatively small sample size used in the previous study. In the present study, the HGB level was significantly reduced in T2 DM patients with PGC (Table 2). This finding is in accordance with the previous study (r=0.148, p=0.56) conducted in India.31 However, contrary to our finding, there was a statistically significant inverse correlation between HGB and HbA1c in T2 DM patients from the study of Rashid et al (r=−0.979, p<0.05).32 The discrepancy might be due to differences in the study population, and T2 DM patients with known diabetic nephropathy were included in the previous study.
Regarding RDW, our data revealed that it was significantly elevated in patients with PGC (Table 2). Chronic inflammation and oxidative stress due to hyperglycemia could be the possible mechanism to elevate the value of RDW in PGC T2 DM patients.33 The result is in harmony with the study conducted in Egypt that reported a significantly (p=0.035) elevated level of RDW in T2 DM patients with uncontrolled glycemia.34 However, in contrast to the current finding, a study conducted in Bangladesh reported no significant (p=0.2) mean difference of RDW was observed between poor and good glycemic control T2 DM patients, although a positive correlation was detected between RDW and HbA1c level.30 The discrepancy might be due to differences in the glycemic status of the study population, relatively well-controlled T2 DM patients were enrolled in the previous study.
A significant positive correlation was also found between RDW and HbA1c levels in our study (Table 3). This is consistent with the previous studies conducted in Pakistan35 and India.36 However, our finding is contrary to another study conducted in India reported that no significant correlation (r=0.04, p>0.05) between RDW and HbA1c levels in T2 DM patients.37 The difference might be due to the small number (only 50 T2 DM) of patients involved in the previous study.
This study also found that MCV and MCH were significantly increased in T2 DM patients of HbA1c ≥7%, but no significant difference of MCHC among the two groups (Table 2). Besides, both MCV and MCH were significantly correlated with the level of HbA1c (Table 3). Increased MCV in patients with poor glycemic control could be due to an influx of glucose to erythrocytes via insulin-independent glucose transporter (GLUT-1) causing high intracellular glucose concentration, which results in the rapid diffusion of water into the cell then flattens the biconcave disk and bloats the cell.38 The possible hypothesis for the elevation of MCH in hyperglycemic T2 DM patients might be due to increased cytoplasmic viscosity. A recent study reported that the secondary structure of hemoglobin was altered (increased β-pleated sheet and decreased α-helix content) in T2 DM patients at an elevated level of HbA1c.39 However, our finding is in contrast to an earlier report in Pakistan, which stated that no significant correlation was found between the level of HbA1c with MCV (r=−0.127, p=0.167), MCH (r=−0.109, p=0.238), and MCHC (r=0.051, p=0.583) of T2 DM patients.35 The possible reason for the difference might be due to variation in the glycemic status of the study population.
However, the findings of this study have to be interpreted in light of some limitations. First, this was a cross-sectional study design and therefore cannot infer a causal-effect relationship between studied variables. Second, the sample size enrolled in the study was not large enough and it was a single-centered study, so maybe difficult to generalize the result to the whole T2 DM patients in the population. Finally, some potential confounding factors closely associated with RBC parameters like the nutritional status of iron, folate, and vitamin B12 in the study participants were not determined/absent.
Conclusions
RBC count and HGB were decreased, while MCV, MCH, and RDW were increased in PGC than GGC T2 DM patients. RBC count was inversely correlated, whereas MCV, MCH, and RDW were directly correlated with the level of HbA1c. Red blood cell parameters such as RBC count, MCV, MCH, and RDW could be useful indicators to monitor the glycemic status of patients with T2 DM instead of the HbA1c test. But more multicentered, prospective studies with a large sample size are required to clearly examine the relationship between RBC parameters with HbA1c then to verify their role in glycemic monitoring in patients with T2 DM.
Abbreviations
CBC, complete blood count; FBS, fasting blood sugar; HbA1c, glycated hemoglobin; JMC, Jimma Medical Center; MCH, mean corpuscular hemoglobin; MCV, mean corpuscular volume; MCHC, mean corpuscular hemoglobin concentration; RBCs, red blood cells; RDW, red cell distribution width; T2 DM, type 2 diabetes mellitus.
Data Sharing Statement
The datasets used and/or analyzed during the current study are available from the corresponding author on reasonable request.
Ethics Approval and Consent to Participate
Ethical clearance and approval was obtained from the Institutional Review Board (IRB) of Jimma University, Institute of Health Sciences (approval number: IHRPG1/716/20). Written informed consent was also obtained from each study participant after a clear orientation of the study objective, benefits, and procedures. Confidentiality of participants’ information was kept using unique codes rather than personal identification. The specimen collected from each study participant was used solely for the intended purpose. The study was conducted per the declaration of Helsinki. Furthermore, prevention approaches to COVID-19 transmission were strictly followed in every procedure of data collection according to the recommendations set by the WHO.
Acknowledgments
We would like to acknowledge Jimma University for funding this research and the staff of JMC for their valuable contribution during data collection. We also express our deep sense of gratitude and immense respect to the study participants for their unlimited cooperation and participation in the study.
Author Contributions
All authors made a significant contribution to the work reported, whether that is in the conception, study design, execution, acquisition of data, analysis and interpretation, or in all these areas; took part in drafting, revising or critically reviewing the article; gave final approval of the version to be published; have agreed on the journal to which the article has been submitted; and agree to be accountable for all aspects of the work.
Funding
This work was supported by Jimma University, Institute of Health.
Disclosure
The authors declare that they have no competing interests.
References
1. Yab D, Seino Y, Fukushima M, Seino S. β cell dysfunction versus insulin resistance in the pathogenesis of type 2 diabetes. Curr Diab Rep. 2015;15(6):1–36. doi:10.1007/s11892-015-0602-9
2. Marcovecchio L. Complications of acute and chronic hyperglycemia. US Endocrinol. 2017;13(1):17–21. doi:10.17925/use.2017.13.01.17
3. Punthakee Z, Goldenberg R, Katz P. Definition, classification and diagnosis of diabetes, prediabetes and metabolic syndrome. Can J Diabetes. 2018;42:10–15. doi:10.1016/j.jcjd.2017.10.003
4. Imran A, Agarwal G, Bajaj H, Ross S. Targets for glycemic control. Can J Diabetes. 2018;42:42–46. doi:10.1016/j.jcjd.2017.10.030
5. Gribovschi M. The methodology of glucose monitoring in type 2 diabetes mellitus. Nutr Metab Dis. 2013;86(2):93–96.
6. Leow MKS. Glycated hemoglobin (HbA1c): clinical applications of a mathematical concept. Acta Inform Med. 2016;24(4):233–238. doi:10.5455/aim.2016.24.233-238
7. Saudek CD, Kalyani RR, Derr RL. Assessment of glycemia in diabetes mellitus: hemoglobin A1c. J Assoc Physicians India. 2015;53:299–305.
8. Doig K, Zhang B. A methodical approach to interpreting the red blood cell parameters of the complete blood count. Am Soc Clin Lab Sci. 2017;30(3):173–185. doi:10.29074/ascls.30.3.173
9. Vinupritha P, Hariharan M, Kathirvelu D, Chinnadurai S. Estimation of hemoglobin A1C using the complete blood count measures in the diagnosis of diabetes. Asian J Pharm Clin Res. 2017;10(9):214–218. doi:10.22159/ajpcr.2017.v10i9.19407
10. Turpin C, Catan A, Guerin-Dubourg A, et al. Enhanced oxidative stress and damage in glycated erythrocytes. PLoS One. 2020;15(7):1–19. doi:10.1371/journal.pone.0235335
11. Juhi A. Comparative study of erythrocyte fragility in diabetes mellitus and non-diabetes Mellitus. Int J Med Res Health Sci. 2015;4(1):183–185. doi:10.5958/2319-5886.2015.00029.6
12. Li Q, Yang LZ. Hemoglobin A1c level higher than 9.05% causes a significant impairment of erythrocyte deformability in diabetes mellitus. Acta Endocrinol. 2018;14(1):66–75. doi:10.4183/aeb.2018.66
13. Wang Y, Yang P, Yan Z, et al. The relationship between erythrocytes and diabetes mellitus. J Diabetes Res. 2021;2021:1–9. doi:10.1155/2021/6656062
14. Van Ta T, Bich H, Nguyen T, Tran HT, Pham HT. Evaluating the association of red blood cell parameters and glycemic control in type 2 diabetic patients at Tien Giang general hospital. Arch Pharm Pract. 2019;10(4):153–159.
15. Esraa RR, Abhishek Y, Abhishek A, Radhey Shyam C, Aradhana S. The effects of red blood cells parameters on hba1c and random blood sugar levels in diabetics diagnosis. Int J Diabetes Clin Res. 2020;7(3). doi:10.23937/2377-3634/1410128
16. Park P. Access to hemoglobin A1c in rural Africa: a difficult reality with severe consequences. J Diabetes Res. 2018;8(2):111–116. doi:10.1155/2018/6093595
17. Birabwa C, Bwambale MF, Waiswa P, Mayega R. Quality and barriers of outpatient diabetes care in rural health facilities in Uganda – a mixed-methods study. BMC Health Serv Res. 2019;19(706):1–10. doi:10.1186/s12913-019-4535-x
18. Strack B, Deshazo J, Gennings C, Olmo JL. Impact of HbA1c measurement on hospital readmission rates: analysis of 70, 000 clinical database patient records. Biomed Res Int. 2014;14(78):1–11. doi:10.1155/2014/781670
19. Bakeri H, Wakefield D, Dulipsingh L. Is there a role of HbA1C in predicting hospital re-admission rates for patients with diabetes? Endocrinol Diabetes Obes. 2018;2(3):1–6. doi:10.31532/endocrinoldiabetesobes.1.2.003
20. Camara A, Baldé NM, Sobngwi-tambekou J, et al. Poor glycemic control in type 2 diabetes in the South of the Sahara: the issue of limited access to an HbA1c test. Diabetes Res Clin Pract. 2015;108(1):187–192. doi:10.1016/j.diabres.2014.08.025
21. Bekele A, Getachew T, Amenu K, et al. Service availability and readiness for diabetes care at health facilities in Ethiopia. Ethiop J Heal Dev. 2017;31(2):110–119.
22. International Diabetes Federation. Diabetes Atlas.
23. World Health Organization. STEPS Surveillance Manual. Geneva: WHO; 2017:472.
24. ADA. Glycemic targets: standards of medical care in diabetes 2020. Am Diabetes Assoc. 2020;43(1):66–76. doi:10.2337/dc20-s006.
25. Viskupicova J, Blaskovic D, Galiniak S, Bartosz G, Horakova L, Sadowska-bartosz I. Effect of high glucose concentrations on human erythrocytes in vitro. Redox Biol. 2015;5:381–387. doi:10.1016/j.redox.2015.06.011
26. Gabreanu GR, Angelescu S. Erythrocyte membrane in type 2 diabetes mellitus. Discoveries. 2016;4(2):1–12. doi:10.15190/d.2016.7
27. Kumar S. The study of ATPase activity in the erythrocyte membrane of diabetes mellitus-type 2 subjects. Int J Pharm Bio Sci. 2013;4(4):1319–1326.
28. Alamri BN, Bahabri A, Aldereihim AA, et al. Hyperglycemia effect on red blood cells indices. Eur Rev Med Pharmacol Sci. 2019;23(5):2139–2150. doi:10.26355/eurrev_201903_17259
29. Milosevic D, Panin VL. Relationship between hematological parameters and glycemic control in type 2 diabetes mellitus patients. J Med Biochem. 2019;38(2):164–171. doi:10.2478/jomb-2018-0021
30. Jaman S, Rahman S, Swarna RR, Mahato J, Miah M, Ayshasiddeka M. Diabetes and red blood cell parameters. Ann Clin Endocrinol Metab. 2017;2(1):001–9. doi:10.29328/journal.acem.1001004
31. Narayanan S, Prakruti Dash PM, Mahajan P. Effect of total hemoglobin level on HbA1c value in type 2 diabetes mellitus patients. Bangladesh J Med Sci. 2019;19(1):110–113. doi:10.3329/bjms.v19i1.43882
32. Rashid M, Bkg VB, Gupta A, Rashid Z. High HBA1C level is associated with low hemoglobin level. Int J Innov Res Med Sci. 2018;3(2):1757–1759. doi:10.23958/ijirms/vol03-i02/15
33. Yin Y, Ye S, Wang H, Li B, Wang A. Red blood cell distribution width and the risk of being in poor glycemic control among patients with established type 2 diabetes. Ther Clin Risk Manag. 2018;14:265–273. doi:10.2147/tcrm.s155753
34. Nada AM. Red cell distribution width in type 2 diabetic patients. Diabetes Metab Syndr Obes Targets Ther. 2015;8:525–533. doi:10.2147/dmso.s85318
35. Bhutto AR, Abbasi A, Abro AH. Correlation of hemoglobin A1c with red cell width distribution and other parameters of red blood cells in type II diabetes mellitus. Cureus. 2019;11(8):1–7. doi:10.7759/cureus.5533
36. Biswas A, Srinivasan C. Correlation of red blood cell distribution width (RDW) and hemoglobin a1c (HbA1c) levels, in patients with type 2 diabetes mellitus. Int J Res Pharm Sci. 2020;11(1):1160–1164. doi:10.26452/ijrps.v11i1.1951
37. Hasan A, Anil H. Correlation of Red Blood Cell Distribution Width (RDW) and Haemoglobin A1C (HbA1C) levels in diabetic individuals. IJIRSET. 2017;6(5):8227–8239.
38. Cho YI, Mooney MP, Cho DJ. Hemorheological disorders in diabetes mellitus. J Diabetes Sci Technol. 2008;2(6):1130–1138. doi:10.1177/193229680800200622
39. Andleeb F, Atiq A, Atiq M. Hemoglobin structure at higher levels of hemoglobin A 1 C in type 2 diabetes and associated complications. Chin Med J. 2020;133(10):9–11. doi:10.1097/cm9.0000000000000801
 © 2021 The Author(s). This work is published and licensed by Dove Medical Press Limited. The
full terms of this license are available at https://www.dovepress.com/terms
and incorporate the Creative Commons Attribution
- Non Commercial (unported, 3.0) License.
By accessing the work you hereby accept the Terms. Non-commercial uses of the work are permitted
without any further permission from Dove Medical Press Limited, provided the work is properly
attributed. For permission for commercial use of this work, please see paragraphs 4.2 and 5 of our Terms.
© 2021 The Author(s). This work is published and licensed by Dove Medical Press Limited. The
full terms of this license are available at https://www.dovepress.com/terms
and incorporate the Creative Commons Attribution
- Non Commercial (unported, 3.0) License.
By accessing the work you hereby accept the Terms. Non-commercial uses of the work are permitted
without any further permission from Dove Medical Press Limited, provided the work is properly
attributed. For permission for commercial use of this work, please see paragraphs 4.2 and 5 of our Terms.