Back to Journals » Clinical Ophthalmology » Volume 16
Evaluation of Microvascular and Visual Acuity Changes in Patients with Early Diabetic Retinopathy: Optical Coherence Tomography Angiography Study
Authors Attia Ali Ahmed M ![]() , Shawkat Abdelhaleem A
, Shawkat Abdelhaleem A
Received 17 December 2021
Accepted for publication 2 February 2022
Published 17 February 2022 Volume 2022:16 Pages 429—440
DOI https://doi.org/10.2147/OPTH.S353426
Checked for plagiarism Yes
Review by Single anonymous peer review
Peer reviewer comments 3
Editor who approved publication: Dr Scott Fraser
Mohamed Attia Ali Ahmed, Ahmed Shawkat Abdelhaleem
Ophthalmology Department, Faculty of Medicine, Minia University, Minia, Egypt
Correspondence: Mohamed Attia Ali Ahmed, Email [email protected]; [email protected]
Purpose: Comparison of early microvascular changes detected by optical coherence tomography angiography (OCTA) in patients with mild non-proliferative diabetic retinopathy (NPDR) with healthy volunteers.
Patients and Methods: Forty-four eyes of 44 type-2 diabetic patients with mild non-proliferative diabetic retinopathy and 30 eyes of 30 age-matched healthy controls were imaged using OCTA to quantify microvascular changes and the FAZ quantitative parameters (area, perimeter, and circularity index); the values of patients and controls were then compared.
Results: Macular vessel density, perfusion index, and circularity index values were reduced and positively correlated with visual acuity in patients (15.4 ± 2.6, 38.0 ± 6.7, 0.6 ± 0.06 and p = 0.003, 0.001, and 0.003, respectively). However, FAZ area and perimeter were found to be larger in patients than controls (0.30 ± 0.08, 2.5 ± 0.3 and p < 0.001).
Conclusion: OCTA quantified vessel density and perfusion density were found to be correlated with visual acuity and FAZ parameters in patients with early NPDR; this could help in detecting early disease progression and modifying treatment decisions.
Keywords: diabetic retinopathy, foveal avascular zone, optical coherence tomography angiography, vessel density, perfusion density
Introduction
Patients with poorly controlled diabetes mellitus are vulnerable to developing diabetic retinopathy (DR), with the retinopathic changes being presented by retinal microvascular pathological changes. Visual impairment due to retinopathic changes badly affects patients’ life quality, disease management, overall life expectancy, and incidence of other diabetic complications.1,2 Basic microvascular pathological changes occurring in DR are basement membrane thickening, damaged endothelium and selective pericyte loss.3
Patients with type-2 diabetes mellitus and early NPDR changes have decreased retinal blood flow, suggesting that retinal microvasculature becomes impaired even earlier than any clinically detectable signs of DR.4
Fundus fluorescein angiography (FFA) has been the cornerstone for fundus imaging, providing two-dimensional images of the superficial retinal vessels located in the nerve fiber and ganglion cell layers. Deeper retinal vessels and capillaries remain invisible and hence could not be conclusive to detect early pathological changes.5
Optical coherence tomography angiography OCTA, an intensity-based technique, enables visualization of the choroidal and retinal microvascular using the split-spectrum amplitude-decorrelation angiography (SSADA) algorithm.6,7
Unlike FFA, OCTA simultaneously visualizes retinal vasculature and microstructure in a three-dimensional, depth-resolved fashion without dye injection.8 It provides high resolution volumetric angiograms of individually segmented retinal vascular plexuses separately.9
The current study evaluated the OCTA-documented quantitative FAZ changes and their correlation with macular microvascular changes and visual acuity in diabetic patients with early/mild non-proliferative retinopathic changes who were compared to healthy volunteers.
Patients and Methods
Study Design
Cross-sectional case control study conducted in a tertiary eye center.
Study Population
The current study included 74 eyes of 74 participants. Study subjects were allocated into two groups: 44 eyes of 44 treatment-naïve patients having mild diabetic retinopathy, defined as having microaneurysms, few retinal dot-hemorrhages or hard exudates, in accordance with the severity scale used in the Early Treatment Diabetic Retinopathy Study;10 and 30 eyes of 30 age-and gender-matched healthy controls. Patients included were of both genders, having early/mild non-proliferative DR and excluding those having clinically significant DME or defined in OCT B-scans; age range was 30–60 years. Exclusion criteria were those with opaque ocular media, refractive error ≥ 5 diopters, co-existent age-related macular degeneration (AMD), inflammatory retinal disorder, macular scarring, cases with history of anti-VEGF injection and previous laser photocoagulation to the macula, retinal vascular occlusion, or previous ocular surgery.
Control subjects enrolled were defined as having no history of previous ocular trauma, intraocular surgery, or systemic diseases that could produce microvascular changes mimicking diabetic retinal changes such as ischemic heart disease and hypertension; controls had clear ocular media, normal ophthalmic examination, and refraction ≤ 2 D. In the current study only one eye of each participant was selected to avoid false-positive results; if both eyes were enrolled as 2 separate data points, results may be attributed to retinal vasculature characteristics and structural similarities in each participant. If both eyes of a participant fitted inclusion criteria, the dominant eye with better scan quality was selected for subsequent analysis.
Methods
All study participants underwent a comprehensive ophthalmic examination including detailed history taking, best corrected visual acuity (BCVA) assessment using Snellen’s chart, anterior segment examination using slit lamp biomicroscopy, dilated fundus examination using a 78D Volk lens, intraocular pressure measured by Goldmann applanation tonometry (GAT: Haag-Streit AG, Bern, Switzerland), and automated refraction using the Nidek autoref/keratometer (LS 900, Haag Streit Diagnostics, Switzerland).
AngioPlex OCT-Angiography
Macular 6×6 mm2 scans were captured using the commercially available Zeiss Cirrus 5000 HD-OCT (Zeiss Meditec. Inc., Jena, Germany), that uses a wavelength of 840 nm with a scanning rate of 68,000 A-scans per second. For all acquisitions, the FastTrac retinal-tracking technology was used to reduce motion artifacts. The captured angiography cube contains 245 B-scan slices with each B-scan consisting of 245 A-scans, and each A-scan is 1024 pixels deep. Scanned images with a signal strength of ≥ 7 (out of 10) were used for subsequent processing and analysis. Poor-quality images with low signal strength and evident segmentation errors or artifacts were excluded from subsequent processing and analysis.
The measured quantitative FAZ parameters included the central vessel-free area (FAZ); the fovea; the central 1 mm diameter ring, and the parafovea; the annulus centered on the fovea with inner and outer ring diameters of 1 mm and 3 mm, respectively.
The built-in angio-analytics software quantitatively analyzed the retinal microcirculation parameters as mean values evaluated within an area 1.5 mm radius from the center for the parafovea, 3 mm for the perifovea, excluding the central foveal 0.5 mm radius area. Quantitative parameters were expressed as vessel density defined as the total length of the perfused vessels per unit area within a measured area that was calculated after skeletonization of the binarized image; the perfusion index (parafovea and perifovea) described the total area of perfused vasculature per unit area within a region of measurement, as well as FAZ area, perimeter, and circularity index. FAZ boundaries were automatically outlined along the innermost capillaries after which the area and perimeter of this zone were calculated. FAZ circularity was measured using the equation: circularity = 4πA/P2, where A is the area and P is the perimeter. Using this equation, as the circularity value approaches 1 it indicates a smooth regular shape and if it becomes closer to zero it indicates more irregular FAZ.
This angio-analytics software was updated to utilize the projection artifact removal (PAR) algorithm and improved FAZ delineation. Using these new parameters, the device automatically outlines the FAZ boundaries along the centermost capillaries, allowing the area and perimeter of this zone to be calculated.11
Macular angiographic changes and FAZ quantitative parameters were processed and analyzed in 6×6 mm2 macular scans. Differential retinal capillary vessel density and perfusion density values were calculated using the OCTA angio-analytics software in the central, inner, full, and outer regions.
Statistical Analysis
The Statistical Package for the Social Sciences (version 24.0; SPSS Inc., IBM, Chicago, IL) was adopted for tabulation and analysis of the obtained data. Quantitative data were presented as mean ± standard deviation while qualitative data were expressed as number (n) and percentage (%). Kolmogorov–Smirnov for normality test was used to differentiate between parametric data and non-parametric data.
Independent sample t-test was adopted for analysis of quantitative data and Chi-square test and Fisher exact test were adopted for the analysis of the qualitative data. Correlation between two quantitative variables was done by using Pearson’s correlation coefficient. Correlation coefficient ranges from 0 to 1: weak (r = 0 0.24), fair (r = 0.25–0.49), moderate (r = 0.5–0.74), strong (r = 0.75–1.0).
P-value < 0.05 is considered significant and < 0.001 is highly significant.
Results
Baseline Characteristics
Data of 44 eyes of 44 patients having early/mild non-proliferative diabetic retinopathy and 30 eyes of 30 age- and gender-matched healthy controls were quantitatively evaluated and compared for the quantitative FAZ parameters, microvascular changes, and visual acuity. There was no significant difference between groups regarding age and gender (p = 0.17 and 0.26, respectively). Best-corrected visual acuity was significantly less in patients (p = 0.01). Central macular thickness was increased in patients compared to controls (p = 0.002).
Demographic criteria and clinical findings of the study participants are listed in Table 1.
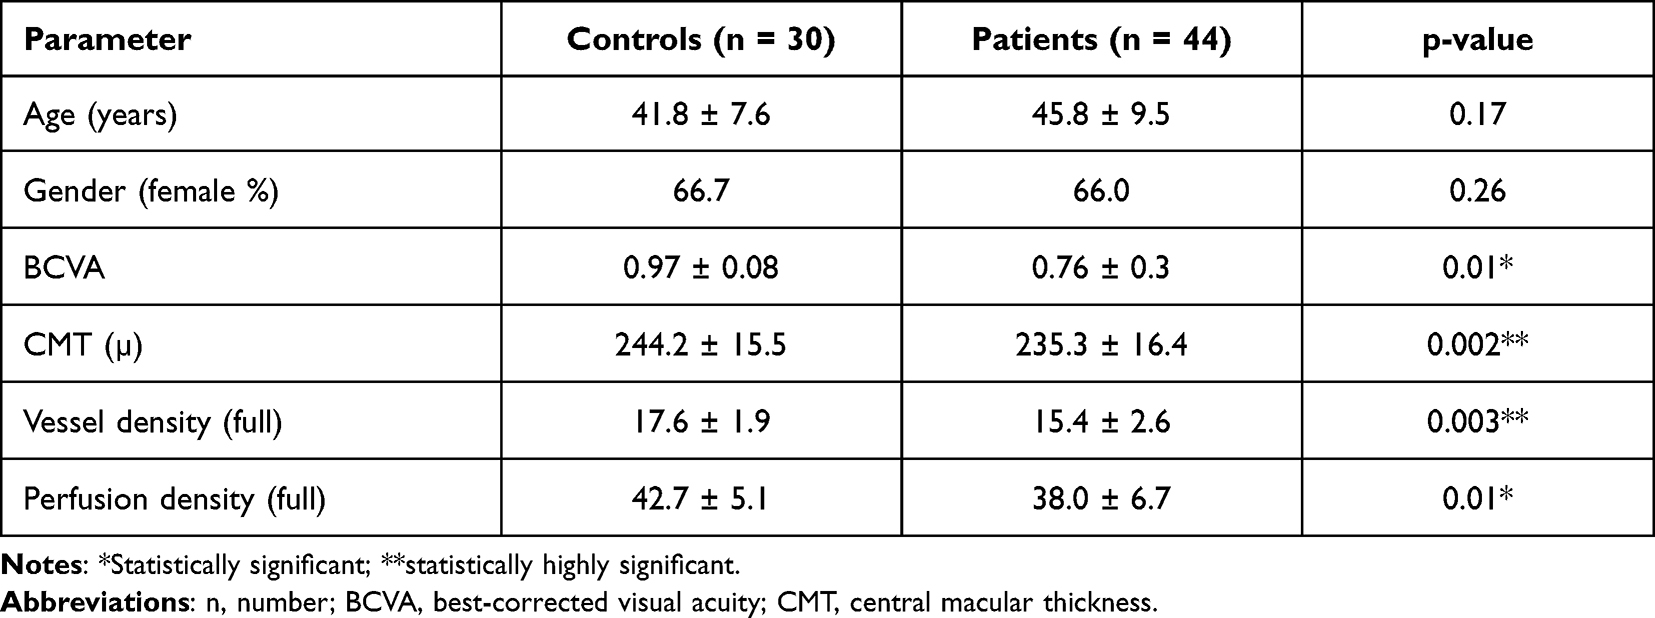 |
Table 1 Demographic Criteria Among Study Participants |
OCTA Findings
Quantified microvascular changes in terms of vessel density and perfusion density values were extracted from the superficial retinal plexus and compared between groups. Both full vessel density and perfusion density values were significantly more reduced in patients than in controls (p = 0.003, p = 0.014, respectively).
Regarding FAZ quantitative parameters, both area and perimeter values were significantly larger in patients (p < 0.001); however, circularity index showed to be significantly less (p = 0.003) denoting irregular, less uniform FAZ outlines in patients.
Differences between study groups regarding differential vessel density, perfusion density, and FAZ quantitative parameters are listed in Table 2 and Figure 1.
 |
Figure 1 Vessel density, perfusion density, and FAZ metric values compared between a healthy control (A, C, E) and a patient with non-proliferative diabetic retinopathy (B, D, F). |
Correlations
According to the current study, FAZ circularity index was found to be positively correlated with both vessel density and perfusion density; this correlation was found to be statistically significant in both outer and full regions of macular scans (p = 0.006, 0.013, 0.017, and 0.019, respectively). On the other hand, FAZ perimeter was found to be negatively correlated with both VD and PI but without statistical significance.
Correlations between vessel and perfusion densities with FAZ quantitative parameters among patients are shown in Table 3.
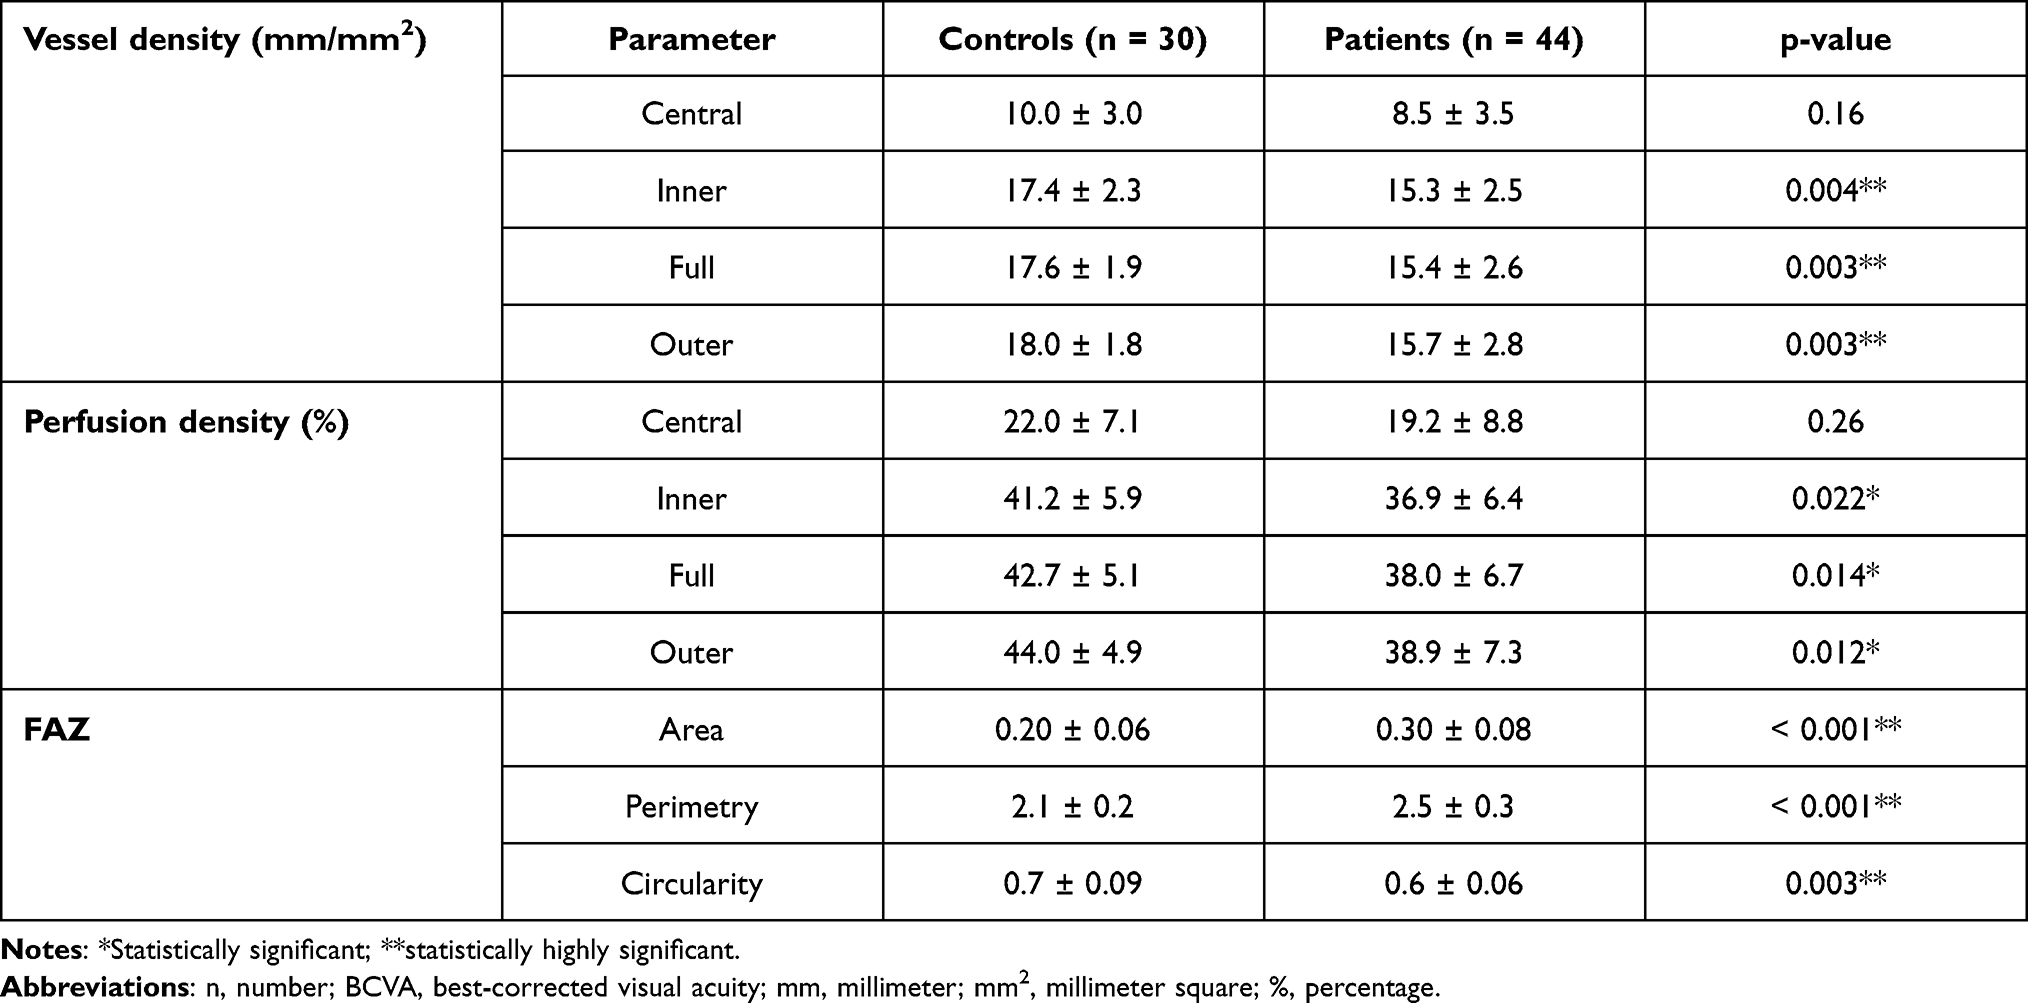 |
Table 2 Angiographic Values and FAZ Quantitative Parameters of Study Participants in Macula Scans |
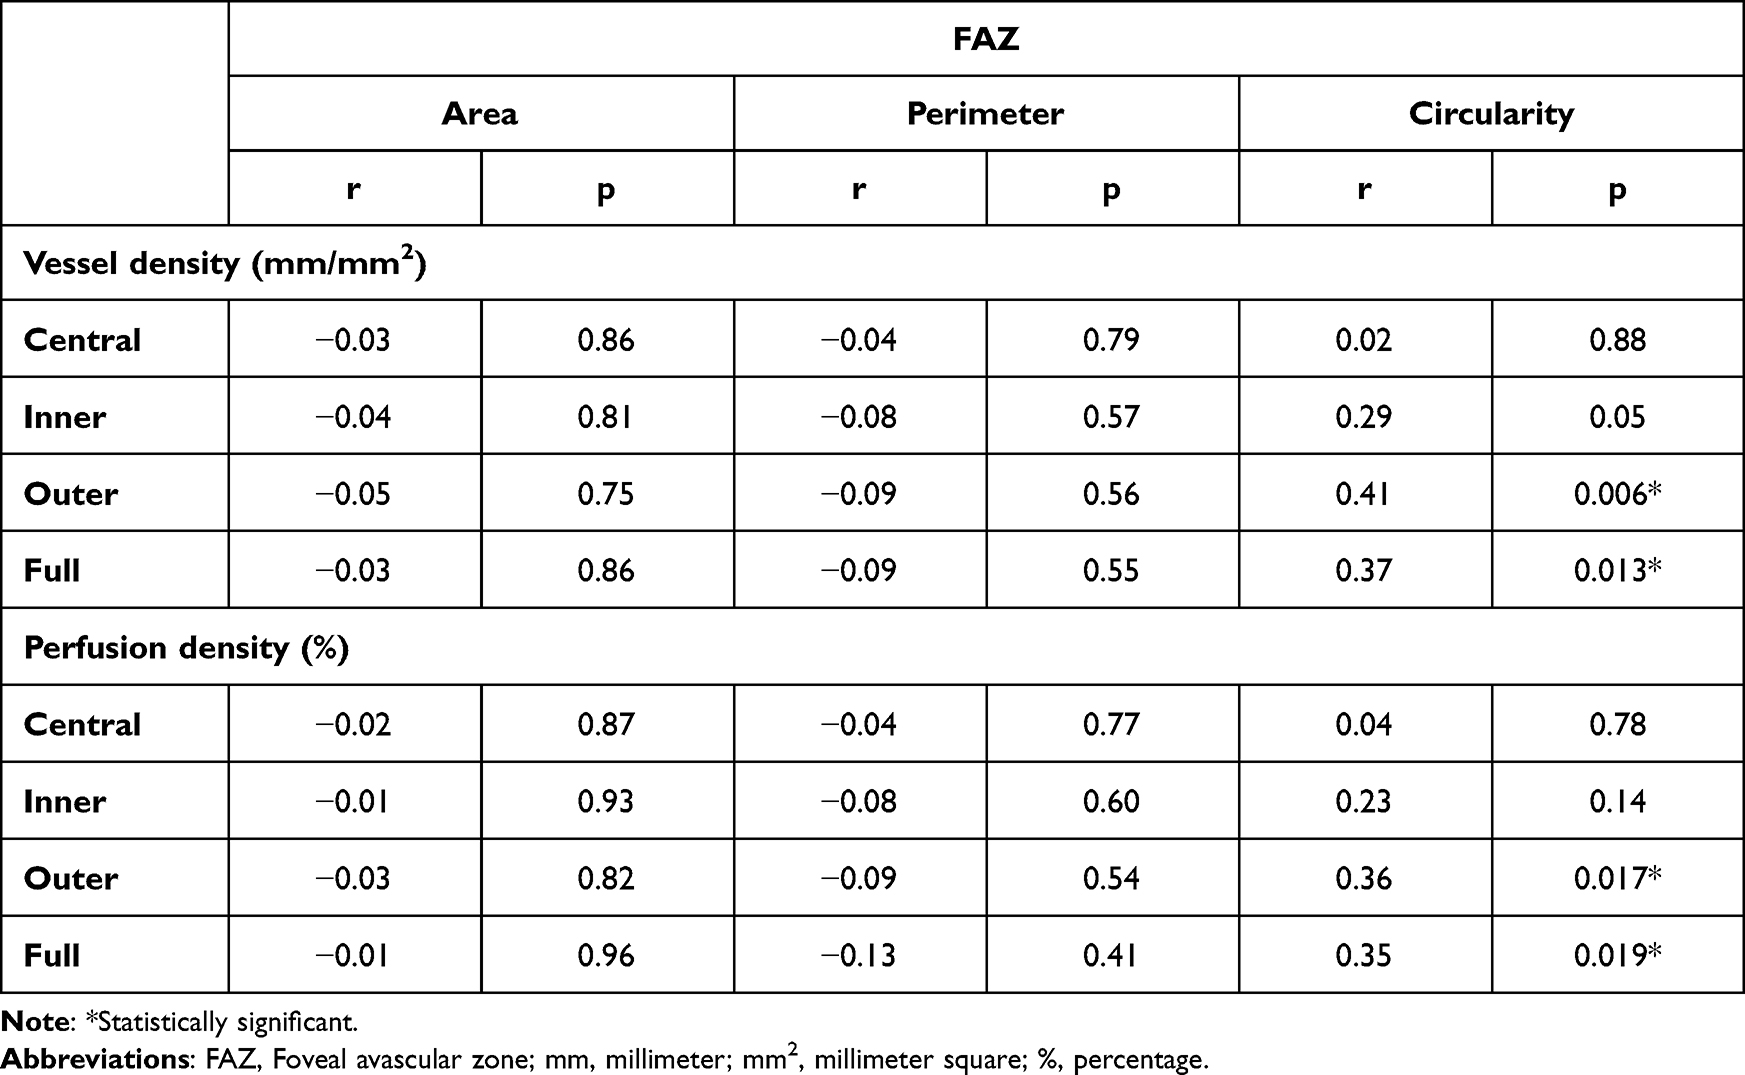 |
Table 3 Correlation Between Vessel Density and Perfusion Density and FAZ Parameters Among Patients |
The inner vessel density was found to have a significant positive correlation with BCVA (r = 0.3, p = 0.01) (Figure 2).
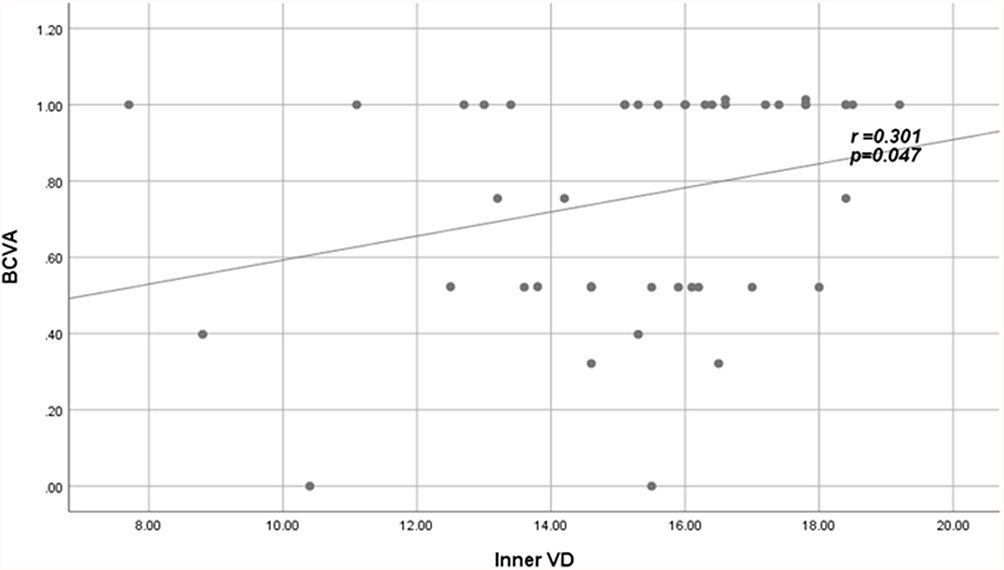 |
Figure 2 Positive fair correlation between inner VD and BCVA in patients. Abbreviations: VD, vessel density; BCVA, best-corrected visual acuity. |
Correlations between vessel density, perfusion index, and FAZ quantitative parameters with BCVA among patients are shown in Table 4.
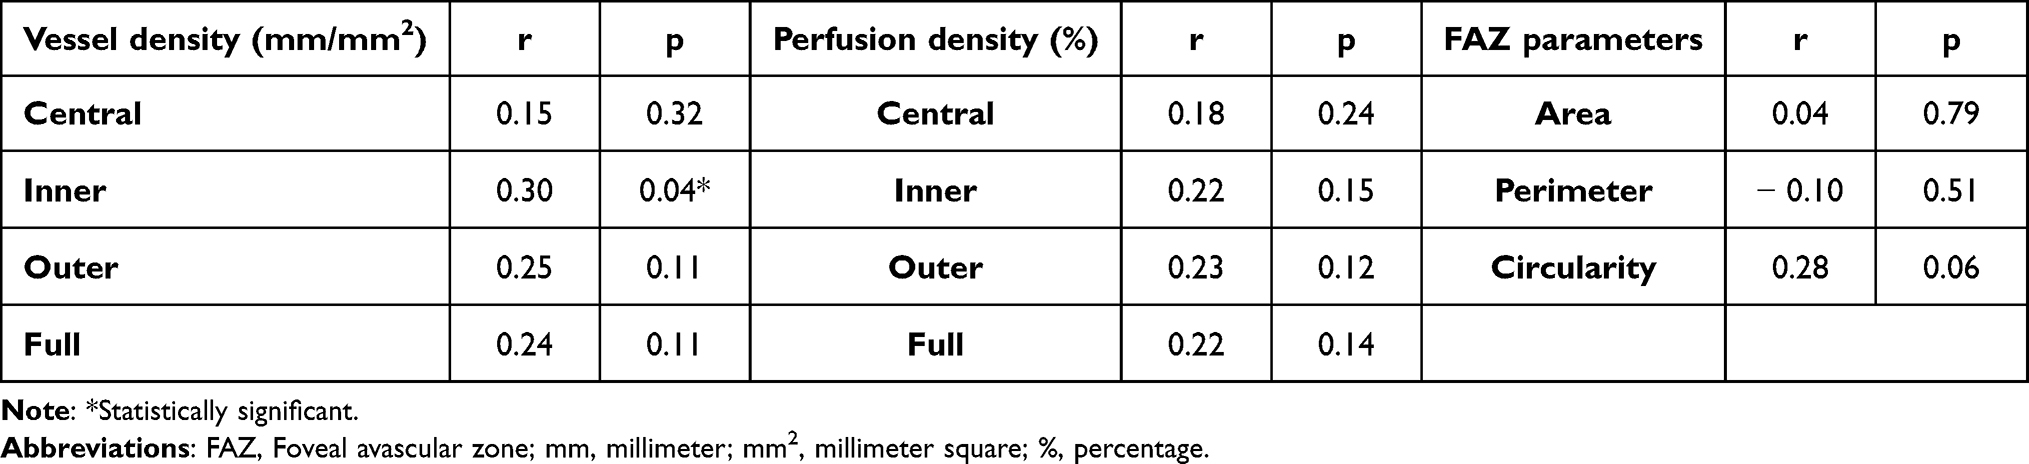 |
Table 4 Correlations Between Macular Vessel Density, Perfusion Density, and FAZ Parameters with BCVA Among Patients |
Significant correlations between VD and PD with FAZ quantitative parameters among patients are shown in Figures 3–Figure 6.
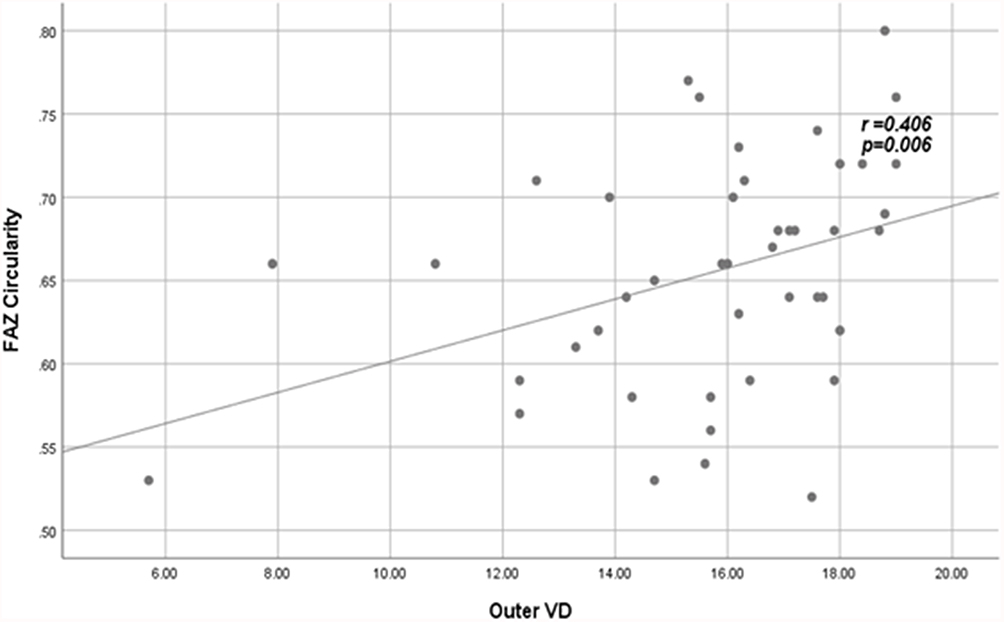 |
Figure 3 Positive fair correlation between outer VD and FAZ circularity index in patients. Abbreviations: VD, vessel density; FAZ, foveal avascular zone. |
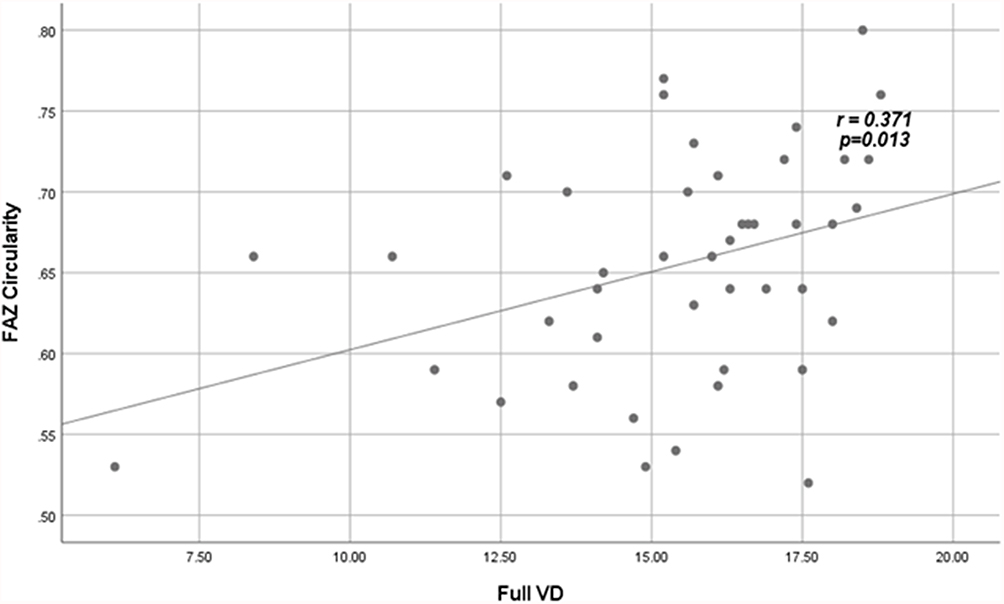 |
Figure 4 Positive fair correlation between full VD and FAZ circularity index in patients. Abbreviations: VD, vessel density; FAZ, foveal avascular zone. |
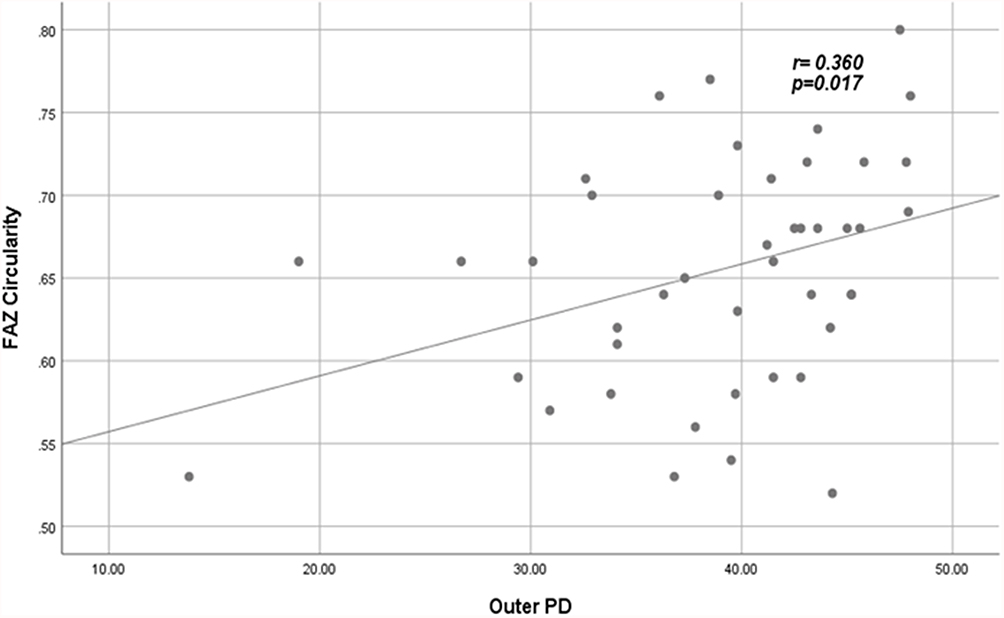 |
Figure 5 Positive fair correlation between outer PD and FAZ circularity index in patients. Abbreviations: PD, perfusion density; FAZ, foveal avascular zone. |
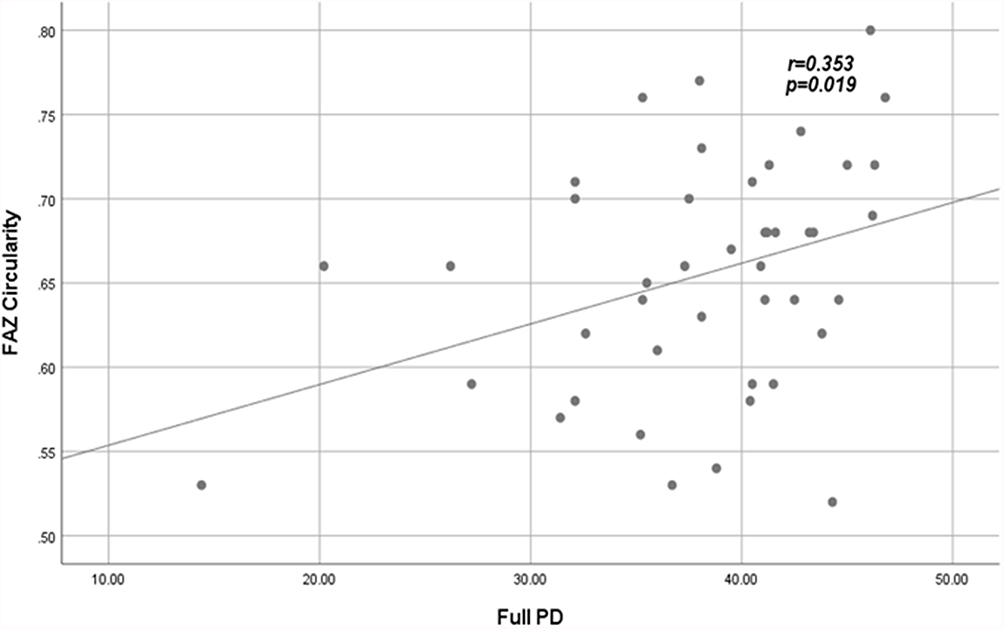 |
Figure 6 Positive fair correlation between full PD and FAZ circularity index in patients. Abbreviations: PD, perfusion density; FAZ, foveal avascular zone. |
Discussion
The aim of the present study is to report the usefulness of OCTA, as a non-invasive dynamic imaging technique, to evaluate the early microvascular quantitative changes in diabetic patients with early/mild non-proliferative diabetic retinopathy that could precede the clinical findings.
Using OCTA, FAZ was found to be larger and more irregular in diabetic patients compared to controls; findings were comparable to those detected by fluorescein angiography.12–15 FAZ metrics could even be measured more easily with OCTA than fluorescein angiography as there is no masking effect by dye leakage.16 Several studies have demonstrated significant quantitative differences in the FAZ in DR patients compared to normal controls. Notably, the FAZ becomes enlarged as a result of lost integrity of blood vessels.6,17,18
Furthermore, the outline of FAZ becomes more irregular due to widened inter-capillary gaps; these vascular abnormalities are more evident in the deep than the superficial capillary plexus.6
The above-mentioned FAZ changes become more evident and worsen with progressing DR severity, suggesting that serial quantitative assessment of the FAZ area would help as a potential biomarker for macular ischemia in DR and to detect progression.19
Quantitative OCTA measurements of vessel density and perfusion density were found to have close correlation with DR severity grading based on clinical features and worsening of visual acuity as well. FAZ area becomes larger and vessel density gets reduced significantly in all retinal plexuses as the DR progresses and becomes more severe, suggesting that OCTA, as a non-invasive relatively easy imaging modality, could provide an objective tool for disease classification and monitoring progression.19–25
In some studies, the OCTA-quantified FAZ area enlargement was associated with worse visual acuity,24,26 which agrees with our results, whereas others did not observe such a relationship.27
Retinal VD reduction in both the superficial and deep plexuses has been strongly correlated to BCVA in diabetic patients (p < 0.001), which agrees with the results of the current study.24
Vessel density measured at the deep capillary plexus had the strongest correlation with DR severity21,28 and visual acuity29 than when measured at the superficial capillary plexus. This could be explained by the fact that deep capillary plexus is located in a watershed zone, and hence it is more susceptible to ischemic damage.30
In diabetic eyes with macular edema (DME), OCTA revealed significantly lower superficial and deep VD values when compared to diabetic eyes without edema and control eyes as well. Also, the FAZ area was significantly larger in eyes with or without DME than control eyes, at the level of both superficial and deep capillary plexuses.31
In the current study we evaluated vessel density, perfusion density, and FAZ quantitative parameters in treatment-naïve diabetic eyes with mild NPDR changes without DME using OCTA quantitative analysis. Values were compared and correlated with visual acuity in both patients and healthy controls. We found significantly reduced vessel and perfusion density values quantified at the superficial retinal capillary plexus. Regarding FAZ quantitative parameters, we also reported increased FAZ area and perimeter in patients; however, circularity index was less than in controls denoting distorted and more irregular FAZ outlines. Correlating the study parameters, we found positive correlation between VD, PD, FAZ circularity index and visual acuity. Angiographic findings are explained by ischemic changes that occur early in course of DR and may even precede clinical findings. Differential VD, PD, FAZ circularity index, and perimeter were found to be more sensitive early predictors for the ongoing ischemic changes. FAZ area did not have such significance as an early disease status predictor, which could be explained by lack of quantitative data extracted from the deep retinal plexus, also including only early cases of mild NPDR without DME.
In a comparative OCTA study of diabetic eyes having DME, the parafoveal vessel density was found to be significantly lower in patients at the SCP and DCP compared to controls (p < 0.001). The FAZ area was significantly positively correlated with LogMAR BCVA at the SCP and DCP levels (r = 0.70, p = 0.001 and r = 0.58, = 0.003, respectively), whereas it was significantly negatively correlated with parafoveal VD at the DCP level (r = −0.52, p = 0.006) and with whole image VD at the SCP level (r = −0.61, p = 0.001). There was a negative significant correlation between LogMAR VA and VD in patients with DME at the SCP level (r = −0.58, p = 0.002) and the deep retinal plexus (r = −0.70, p < 0.001).32
In a study by Kim et al, FAZ area was found to be larger in both superficial and deep retinal capillary layers in diabetic patients without retinopathic changes (0.38 mm2, 0.49 mm2) and with patients with non-proliferative changes (0.38 mm2, 0.48 mm2) than in the control group (0.33 mm2, 0.43 mm2). Also, they reported that the FAZ circularity index, vessel density and perfusion index were more reduced in diabetic patients without retinopathic changes (0.63, 17.8/mm, 0.32) and patients with non-proliferative changes (0.63, 17.5/mm, 0.32) than in controls (0.69, 19.6/ mm, 0.39). It was concluded that both diabetic patients with or without retinopathic changes had a significantly lower mean vascular density and perfusion index in parafoveal and perifoveal areas than the healthy controls; however, OCTA-quantified FAZ parameters were not different between NDR and NPDR.33
Previous studies have demonstrated that FAZ becomes wider and more irregular in DR patients, together with quantitative changes in the FAZ perimeter and circularity index.29,34 Thus, distorted/lost FAZ circularity could be considered a good indicator of vascular dropout and is associated with disease progression in vascular maculopathy.35 FAZ margin changes are largely attributed to capillary non-perfusion, as well as macular vascular remodeling that lead to decreased vascular density and perfusion index.36
Di et al have studied diabetic patients with macular edema (DME) and demonstrated a larger FAZ area in patients than controls (0.41 ± 14 mm2, 0.36 ± 0.06 mm2, p = 0.01, respectively).37
In a previous study, it was found that the parafoveal vessel density analyzed in both superficial and deep retinal plexuses was significantly reduced in diabetic patients with moderate to severe non-proliferative changes (42.48 ± 3.06 and 42.34 ± 2.35) in comparison to controls (52.91 ± 5.19 and 50.38 ± 5.42) (p < 0.001). In the same study, the LogMAR BCVA of patients was significantly reduced (p < 0.001).32
One study showed significantly worse visual acuity in diabetic patients with DME compared to both diabetic patients not having macular edema and the healthy control group as well (p < 0.001), which we also reported in the current study; however, we did not include eyes with DME.18
Limitations for the current study are the relatively small sample size, being a cross-sectional study with lack of long-term follow-up of the reported changes over time and not including quantitative data from the deep retinal plexus. Future longitudinal studies including larger sample sizes are recommended to more precisely quantify the early microvascular changes in diabetic patients and establish reliable biomarkers to monitor disease status. Associating microvascular changes together with structural FAZ quantitative parameters could be valuable biomarkers to accurately identify the disease staging and guide and monitor treatment strategies.
In conclusion, OCTA proved to be a helpful non-invasive imaging tool that helps greatly in detecting early retinopathic changes even before they become clinically evident. The underlying early microvascular changes in subclinical cases or in established cases could be easily masked and overlooked by dye leakage in FFA. Clear visualization of these changes helps accurate disease severity staging and assists appropriate treatment decisions as well. Serial OCTA quantitative measurements are highly recommended in terms of clinical settings, being easy to obtain, non-invasive and not time-consuming, particularly to avoid the hazardous side effects of dye injection or when it is contraindicated.
Abbreviations
DR, Diabetic retinopathy; NPDR, Non-proliferative diabetic retinopathy; DME, Diabetic macular edema; FAZ, Foveal avascular zone; OCTA, Optical coherence tomography angiography; VD, Vessel density (VD); PD, Perfusion density; LogMAR, Logarithm minimum angle of resolution; BCVA, Best-corrected visual acuity; SCP, Superficial capillary plexus; DCP, Deep capillary plexus.
Data Sharing Statement
The datasets analyzed during the current study are available from the corresponding author on reasonable request.
Ethics Approval and Informed Consent
The institutional review board at Minia Faculty of Medicine Research Ethics Committee (FMREC), Minia University, Egypt, approved the research protocols. All procedures performed in the study were in accordance with the ethical standards of the institutional research committee and with the 1964 Declaration of Helsinki and its later amendments or comparable ethical standards. Informed consent was obtained from all participants included in the study.
Acknowledgments
Authors thank all participants who kindly agreed to be included in the current study.
Author Contributions
All authors made a significant contribution to the work reported, whether that is in the conception, study design, execution, acquisition of data, analysis and interpretation, or in all these areas; took part in drafting, revising or critically reviewing the article; gave final approval of the version to be published; have agreed on the journal to which the article has been submitted; and agree to be accountable for all aspects of the work.
Disclosure
The authors declare that they have no competing interests in this work.
References
1. Zheng Y, He M, Congdon N. The worldwide epidemic of diabetic retinopathy. Indian J Ophthalmol. 2012;60(5):428–431. doi:10.4103/0301-4738.100542
2. Simó R, Sundstrom JM, Antonetti DA. Ocular anti-VEGF therapy for diabetic retinopathy: the role of VEGF in the pathogenesis of diabetic retinopathy. Diabetes Care. 2014;37(4):893–899. doi:10.2337/dc13-2002
3. Durham JT, Herman IM. Microvascular modifications in diabetic retinopathy. Curr Diab Rep. 2011;11(4):253–264. doi:10.1007/s11892-011-0204-0
4. Nagaoka T, Sato E, Takahashi A, et al. Impaired retinal circulation in patients with type 2 diabetes mellitus: retinal laser Doppler velocimetry study. Invest Ophthalmol Vis Sci. 2010;51:6729–6734. doi:10.1167/iovs.10-5364
5. Xu J, Han S, Balaratnasingam C, et al. Retinal angiography with real-time speckle variance optical coherence tomography. Br J Ophthalmol. 2015;99(10):1315–1319. doi:10.1136/bjophthalmol-2014-306010
6. Freiberg FJ, Pfau M, Wons J, Wirth MA, Becker MD, Michels S. Optical coherence tomography angiography of the foveal avascular zone in diabetic retinopathy. Graefes Arch Clin Exp Ophthalmol. 2016;254(6):1051–1058. doi:10.1007/s00417-015-3148-2
7. Spaide RF, Klancnik JM
8. Hagag AM, Gao SS, Jia Y, Huang D. Optical coherence tomography angiography: technical principles and clinical applications in ophthalmology. Taiwan J Ophthalmol. 2017;7(3):115–129. doi:10.4103/tjo.tjo_31_17
9. Jia Y, Tan O, Tokayer J, et al. Split-spectrum amplitude-decorrelation angiography with optical coherence tomography. Opt Express. 2012;20(4):4710–4725. doi:10.1364/OE.20.004710
10. Early Treatment Diabetic Retinopathy Study Research Group. Grading diabetic retinopathy from stereoscopic color fundus photographs–an extension of the modified Airlie House classification: ETDRS report number 10. Ophthalmology. 1991;98(5 Suppl):786–806. doi:10.1016/S0161-6420(13)38012-9
11. Liu L, Gao J, Bao W, et al. Analysis of foveal microvascular abnormalities in diabetic retinopathy using optical coherence tomography angiography with projection artifact removal. J Ophthalmol. 2018;2018:3926745. doi:10.1155/2018/3926745
12. Soares M, Neves C, Marques IP, et al. Comparison of diabetic retinopathy classification using fluorescein angiography and optical coherence tomography angiography. Br J Ophthalmol. 2016;101:62–68. doi:10.1136/bjophthalmol-2016-309424
13. Mansour AM, Schachat A, Bodiford G, Haymond R. Foveal avascular zone in diabetes mellitus. Retina. 1993;13:125–128. doi:10.1097/00006982-199313020-00006
14. Conrath J, Giorgi R, Raccah D, Ridings B. Foveal avascular zone in diabetic retinopathy: quantitative vs qualitative assessment. Eye. 2004;19:322–326. doi:10.1038/sj.eye.6701456
15. Bresnick GH, Condit R, Syrjala S, Palta M, Groo A, Korth K. Abnormalities of the foveal avascular zone in diabetic retinopathy. Arch Ophthalmol. 1984;102:1286–1293. doi:10.1001/archopht.1984.01040031036019
16. Yu S, Lu J, Cao D, et al. The role of optical coherence tomography angiography in fundus vascular abnormalities. BMC Ophthalmol. 2016;16(1):1–7. doi:10.1186/s12886-016-0277-2
17. Al-Sheikh M, Akil H, Pfau M, Sadda SR. Swept-source OCT angiography imaging of the foveal avascular zone and macular capillary network density in diabetic retinopathy. Invest Ophthalmol Vis Sci. 2016;57(8):3907–3913. doi:10.1167/iovs.16-19570
18. Takase N, Nozaki M, Kato A, Ozeki H, Yoshida M, Ogura Y. Enlargement of foveal avascular zone in diabetic eyes evaluated by en face optical coherence tomography angiography. Retina. 2015;35:2377–2383. doi:10.1097/IAE.0000000000000849
19. Kim AY, Chu Z, Shahidzadeh A, Wang RK, Puliafito CA, Kashani AH. Quantifying microvascular density and morphology in diabetic retinopathy using spectral-domain optical coherence tomography angiography. Investig Ophthalmol Vis Sci. 2016;57:OCT362–OCT370. doi:10.1167/iovs.15-18904
20. Nesper PL, Roberts PK, Onishi AC, et al. Quantifying microvascular abnormalities with increasing severity of diabetic retinopathy using optical coherence tomography angiography. Investig Ophthalmol Vis Sci. 2017;58:BIO307–BIO315. doi:10.1167/iovs.17-21787
21. Onishi AC, Nesper PL, Roberts PK, et al. Importance of considering the middle capillary plexus on OCT angiography in diabetic retinopathy. Investig Ophthalmol Vis Sci. 2018;59:2167–2176. doi:10.1167/iovs.17-23304
22. Hirano T, Kitahara J, Toriyama Y, Kasamatsu H, Murata T, Sadda SR. Quantifying vascular density and morphology using different swept-source optical coherence tomography angiographic scan patterns in diabetic retinopathy. Br J Ophthalmol. 2018;103:216–221. doi:10.1136/bjophthalmol-2018-311942
23. Samara WA, Shahlaee A, Adam MK, et al. Quantification of diabetic macular ischemia using optical coherence tomography angiography and its relationship with visual acuity. Ophthalmology. 2017;124(2):235–244. doi:10.1016/j.ophtha.2016.10.008
24. Lu Y, Simonett JM, Wang J, et al. Evaluation of automatically quantified foveal avascular zone metrics for diagnosis of diabetic retinopathy using optical coherence tomography angiography. Investig Ophthalmol Vis Sci. 2018;59:2212–2221. doi:10.1167/iovs.17-23498
25. Lei J, Yi E, Suo Y, et al. Distinctive analysis of macular superficial capillaries and large vessels using optical coherence tomographic angiography in healthy and diabetic eyes. Investig Ophthalmol Vis Sci. 2018;59:1937–1943. doi:10.1167/iovs.17-23676
26. Balaratnasingam C, Inoue M, Ahn S, et al. Visual acuity is correlated with the area of the foveal avascular zone in diabetic retinopathy and retinal vein occlusion. Ophthalmology. 2016;123(11):2352–2367. doi:10.1016/j.ophtha.2016.07.008
27. Rabiolo A, Cicinelli MV, Corbelli E, et al. Correlation analysis between foveal avascular zone and peripheral ischemic index in diabetic retinopathy: a pilot study. Ophthalmol Retin. 2017;2:46–52. doi:10.1016/j.oret.2017.05.007
28. Agemy SA, Scripsema NK, Shah CM, et al. Retinal vascular perfusion density mapping using optical coherence tomography angiography in normals and diabetic retinopathy patients. Retina. 2015;35:2353–2363. doi:10.1097/IAE.0000000000000862
29. Tan TE, Nguyen Q, Chua J, et al. Global assessment of retinal arteriolar, venular and capillary microcirculations using fundus photographs and optical coherence tomography angiography in diabetic retinopathy. Sci Rep. 2019;9:11751–11759. doi:10.1038/s41598-019-47770-9
30. Yu DY, Cringle SJ, Su EN, et al. Pathogenesis and intervention strategies in diabetic retinopathy. Clin Exp Ophthalmol. 2001;29:164–166. doi:10.1046/j.1442-9071.2001.00409.x
31. AttaAllah HR, Mohamed AAM, Ali MA. Macular vessels density in diabetic retinopathy: quantitative assessment using optical coherence tomography angiography. Int Ophthalmol. 2019;39(8):1845–1859. doi:10.1007/s10792-018-1013-0
32. Gadallah MI, Moharram HM, Mourad KM, Ahmed MA. Foveal evaluation in diabetic patients with macular edema using optical coherence tomography angiography. Delta J Ophthalmol. 2020;21:43–48.
33. Kim K, Kim ES, Yu S. Optical coherence tomography angiography analysis of foveal microvascular changes and inner retinal layer thinning in patients with diabetes. Br J Ophthalmol. 2018;102:1226–1231. doi:10.1136/bjophthalmol-2017-311149
34. Krawitz BD, Mo S, Geyman LS, et al. Acircularity index and axis ratio of the foveal avascular zone in diabetic eyes and healthy controls measured by optical coherence tomography angiography. Vision Res. 2017;139:177–186. doi:10.1016/j.visres.2016.09.019
35. Mo S, Krawitz B, Efstathiadis E, et al. Imaging foveal microvasculature: optical coherence tomography angiography versus adaptive optics scanning light ophthalmoscope fluorescein angiography. Invest Ophthalmol Vis Sci. 2016;57:130–140. doi:10.1167/iovs.15-18932
36. Sasongko MB, Wong TY, Nguyen TT, Cheung CY, Shaw JE, Wang JJ. Retinal vascular tortuosity in persons with diabetes and diabetic retinopathy. Diabetologia. 2011;54:2409–2416. doi:10.1007/s00125-011-2200-y
37. Di G, Weihong Y, Xiao Z, et al. A morphological study of the foveal avascular zone in patients with diabetes mellitus using optical coherence tomography angiography. Graefes Arch Clin Exp Ophthalmol. 2016;254(5):873–879. doi:10.1007/s00417-015-3143-7
 © 2022 The Author(s). This work is published and licensed by Dove Medical Press Limited. The
full terms of this license are available at https://www.dovepress.com/terms
and incorporate the Creative Commons Attribution
- Non Commercial (unported, 3.0) License.
By accessing the work you hereby accept the Terms. Non-commercial uses of the work are permitted
without any further permission from Dove Medical Press Limited, provided the work is properly
attributed. For permission for commercial use of this work, please see paragraphs 4.2 and 5 of our Terms.
© 2022 The Author(s). This work is published and licensed by Dove Medical Press Limited. The
full terms of this license are available at https://www.dovepress.com/terms
and incorporate the Creative Commons Attribution
- Non Commercial (unported, 3.0) License.
By accessing the work you hereby accept the Terms. Non-commercial uses of the work are permitted
without any further permission from Dove Medical Press Limited, provided the work is properly
attributed. For permission for commercial use of this work, please see paragraphs 4.2 and 5 of our Terms.