Back to Journals » Integrated Pharmacy Research and Practice » Volume 9
Evaluation of Medicine-Use Pattern Using World Health Organization’s Core Drug-Use Indicators and Completeness of Prescription at University of Gondar Comprehensive Specialized Hospital, Gondar, Ethiopia: Cross-Sectional Study
Authors Ayalew Getahun K ![]() , Sitotie Redia A
, Sitotie Redia A ![]() , Jemere Aragaw T
, Jemere Aragaw T ![]()
Received 25 May 2020
Accepted for publication 15 August 2020
Published 23 October 2020 Volume 2020:9 Pages 219—227
DOI https://doi.org/10.2147/IPRP.S261320
Checked for plagiarism Yes
Review by Single anonymous peer review
Peer reviewer comments 2
Editor who approved publication: Professor Jonathan Ling
Kefyalew Ayalew Getahun,1 Adugnaw Sitotie Redia,2 Tezera Jemere Aragaw1
1Department of Pharmacology, School of Pharmacy, College of Medicine and Health Sciences, University of Gondar, Gondar, Ethiopia; 2Department of Clinical Pharmacy, School of Pharmacy, College of Medicine and Health Sciences, University of Gondar, Gondar, Ethiopia
Correspondence: Kefyalew Ayalew Getahun Tel +251 94-697-0462
Email [email protected]
Background: Rational use of medicines is patients receiving medicines appropriate to their diagnosis in doses that meet their requirements for an adequate period of time at an affordable price. Irrational prescribing practices result in ineffective, unsafe treatment, prolong prognosis, and increase health-care costs, and this is a common phenomenon in Ethiopia. The aim of this study was to evaluate medicine-use pattern using World Health Organization core drug-use indicators and completeness of prescription at the University of Gondar Comprehensive Specialized Hospital.
Methods: A retrospective and prospective cross-sectional descriptive study was conducted at the dispensing pharmacy units of the health facility from March 2019 to May 2019 using a systematic random sampling technique. Data were analyzed using SPSS version 24.0, and results are presented using tables.
Results: A total of 1,128 medicines were covered in the analyzed sample. The response rate, using standard prescription paper was found to be 100%. Mean number of medicines per prescription was 1.88. The proportion of medicines actually dispensed was 74.56%, and 91.4% medicines were prescribed by their generic names. Among prescribed medicines, antibiotics accounted for 37.5%, and 20% of the prescribed medicines were injectable. Prescriptions containing patient name, identification number, age, and sex comprised 99.8%, 99.5%, 91.8%, and 94.5%, respectively of the total. Prescriptions signed by prescribers accounted for 96.2%, however, only 75.8% of prescribers wrote their name. Moreover, only 4.8% of dispensers printed their name, and 32.7% of prescriptions were signed by pharmacists. Patient-care indicators were found to be below standard.
Conclusion: Most prescriptions were incomplete, and prescribers by far completed their role than dispensers. The health facility has standard prescription paper and updated pharmaceuticals list. Percentages for encounters with antibiotics, prescribing by generic name, and patient-care indicators deviated from the standard. The dispensing and counseling time also far from the standard, and most medicines were not labeled.
Keywords: prescribing indicators, patient-care indicators, health-facility indicators, completeness of prescription, World Health Organization, Ethiopia
Background
Medicine play a pivotal role in rendering health-care services across the globe. Modern health care would be a nightmare without medicines. Rational use of medicines is when patients receive medicines appropriate to their clinical needs in doses that meet their requirements for an adequate period of time at an affordable price.1,2 The fundamental goal of rational medicine use is to enhance the quality of pharmaceutical care, minimize the cost of drug therapy, avoid preventable adverse drug reactions and drug interactions, and maximize therapeutic outcomes while promoting patient adherence. Despite this, about one third of the world’s population lacks access to essential medicines and more than 50% use medicines irrationally. Irrational use of medicines encompasses use of too many medicines, employing antibiotics for abacterial infections, inadequate dosages, and use of injections while oral medicines are available for mild illness.1–3 Inappropriately used medicines pose the threat of increased morbidity and mortality rates and incur unnecessary costs to patients.
Furthermore, inappropriate use of antibiotics increases the danger of resistant strains of infectious microorganisms arising, increased risk of unwanted drug reactions and interactions, and nonadherence of patients.1–3 The most common problems associated with irrational use of medicines include selection of medicines without consideration of cost-effectiveness or efficacy, inefficient procurement, failure to prescribe medicines in accordance with standard treatment protocols, poor dispensing practices resulting in medication errors, improper patient adherence to dosing schedules and treatment regimens, lack of adequate information about prescribed drugs, faulty and inadequate training of prescribers, poor communication between health-care providers and patients, lack of diagnostic facilities, demands of patients (assuming that “every ill has a pill”), and inappropriate self-medication. Irrational medicine use results in a number of complicated problems during the process of prescribing, dispensing, and patient use.1–5 To study such worsened circumstances the International Network for the Rational Use of Drugs (INRUD) and World Health Organization (WHO) generated three core drug-use indicators in medicine-use areas:
- prescribing indicators (measure the performance of prescribers in five key areas: average number of medicines per prescription, percentage of medicines prescribed by generic name, percentage of prescriptions containing antibiotics, percentage of prescriptions containing injectable medicines, and percentage of medicines prescribed from the latest edition of national essential drug lists or formulary)
- patient-care indicators (average counseling time in minutes, average dispensing time in minutes, percentage of medicines actually dispensed, percentage of medicines adequately labeled, and patient knowledge of prescribed medicines)
- facility indicators (availability of updated facility-specific pharmaceutical lists and key medicines.1–3,5,6
Therefore, we used the WHO/INRUD indicators to study medicine-use practices, because these indicators are a validated standard tool and measurements are reproducible.1–3,5,6 Despite this WHO recommendation, practical observation revealed that pharmaceutical care is far from the standards as supported by a number of studies conducted worldwide, particularly in developing countries. For instance, in a study conducted in selected public hospitals of eastern Ethiopia, the mean number of medicines per prescription was 2.34 and overuse of antibiotics accounted for 57.87%.5 A study done in a tertiary referral hospital in northeast Ethiopia found a median of 2.5 drugs per encounter were prescribed, with 34.64% and 13.80% of prescriptions being antibiotics and injections, respectively.7 At Jos University Teaching Hospital, Nigeria, 85.3% of prescribed drugs were dispensed and medicines per prescription were 3.00. Medicines prescribed by generic names comprised 70.2%. Medicines prescribed from the hospital formulary comprised 88%. Antibiotics prescribed comprised 35.3% and injection encounters 9%.8
On assessment conducted on prescribing practices in southern India, only 2.5% of medicine was prescribed by generic name, mean number of medicines per encounter was 3.7 and use of antibiotics 22%.9 In a study conducted in two tertiary-care hospitals of Bahawalpur, Punjab, Pakistan, mean number of medicines per prescription was 2.8, drugs prescribed by generic name 56.6%, encounters with an antibiotic prescribed 51.5%, no injections were prescribed, and 98.8% of the drugs prescribed were from the essential drug list.10 From a study done in the United Arab Emirate, the mean number of medicines per prescription was 2.2. The most prescribed medicines were brand, and about 19.4% generic.11 In a study carried out in primary health-care centers of Kuwait the mean number of medicines in a single prescription was 2.9 and prescribing an antibiotic was 39.1%. Mean consultation and dispensing times were 2.8±1.9 minutes and 54.6±33.5 seconds, respectively. An other study done in Kuwait indicates patient knowledge was only 26.9%.12 A study conducted in 21 primary healthcare facilities in northern Jordan found mean patient knowledge of prescribed drug dose was 77.7%.13
Prescribing errors are the other major source of irrational medicine use. Medicines should be prescribed with a written medicolegal document by an authorized person for the treatment of the patient, which is a reflection of the quality of health-care service being delivered to the patient,14 but studies have revealed that prescriptions were not completed appropriately of all its parts, namely superscription, inscription, and subscription, and about 45.6% of prescriptions contained irrational combinations of medicines.15,16 Even though a study was conducted at University of Gondar (UoG) to assess medicine-use practices and completeness of prescriptions, the sample used was small and not as recommended by the WHO core-drug indicators.15 Moreover, the objectives of the WHO indicators are to evaluate drug-use practices across different time intervals, measure interventions taken, and supervision, prescription audit, and feedback purposes. Periodic evaluation of medicine-prescribing practices in a health facility is very important in identifying specific medicine-use problems, sensitizing practitioners on rational medicines prescription, and providing policy-makers with relevant information that could be useful in reviewing medicine-related policies.1–3,6 Furthermore, the complex pharmaceutical-management system and high expenditure, accounting for up to 70%–75% of total health-care expenditure in low- and middle-income countries, mandates periodic reviews of current practices for potential interventions.5 Therefore, the main objective of this study was to assess medicine-use patterns, current practices, impact of interventions as a result of previous study recommendations using WHO core drug-use indicators as a tool, and completeness of prescriptions at UoG Comprehensive Specialized Hospital (CSH), Gondar, Ethiopia.
Methods
Study Setting and Design
The study was conducted at UoG CSH, in Gondar, Amhara national regional state. The town is 750 km from the capital of Ethiopia, in north-west Ethiopia, providing services for more than 7 million people in the catchment area. The hospital has about 700 beds in 27 wards for emergency, inpatient, and outpatient departments. A health facility–based quantitative cross-sectional retrospective study design was used to evaluate prescribing indicators based on the WHO core drug-use indicators, and a prospective study design was employed for patient care indicators, facility indicators, and completeness of prescriptions from March 21 to May 30, 2019 at UoG CSH.
Data Source and Study Population
Data sources were all patient prescriptions dispensed from September 10, 2018 to September 10, 2019 (prescribing indicators) and patients and their prescriptions in main dispensaries from March 21 to May 30, 2019 for patient care indicators, facility indicators, and completeness of prescriptions and medicines under the pharmaceutical list of UoG CSH of 2019.
Inclusion and Exclusion Criteria
Patients with legible prescriptions and patients attending pharmacy during working hours were included; however, patients aged <18 years old, mentally ill patients who couldn't give appropriate information, those unwillingness to participate, illegible prescriptions, prescriptions containing only medical supplies, such as gloves and syringes were excluded.
Sample-Size Determination and Sampling Technique
Prescribing Indicators
Based on WHO recommendations, 600 prescriptions were sampled using systematic random sampling from 192,600 prescriptions stored from September 10, 2018 to September 10, 2019 in three main dispensing pharmacy outlets for prescribing indicators.6
Patient-Care Indicators and Completeness of Prescriptions
For patient-care indicators, a total of 600 patients, 200 from each dispensary were used while medicines were dispensed, dispensing and counseling times recorded, and interviews using checklist and prescriptions were evaluated for completeness .6
Health-Facility Indicators
For health facility indicators, five participants holding posts and five who are working at different dispensaries, procurement unit and drug informatin services, a total of ten staff were interviewed and physical observation performed to check the availability of essentials/pharmaceuticals list and key-medicine list.6
Dependent Variables
Rational drug-use practice was assessed using standard indicators:
- Prescribing indicators include the average number of medicines per encounter, percentage of medicines prescribed by generic name, percentage of encounters with an antibiotic prescribed, percentage of encounters with an injection prescribed, and percentage of medicines prescribed from the essential drug list or formulary.6
- Patient-care indicators encompass average consultation time, average dispensing time, percentage of medicines dispensed, percentage of medicines adequately labeled, and patient knowledge of correct dosage.6
- Health facility indicators included availability lists of essential drugs and key drugs within the facility.6
Operational Definitions
Completeness of prescription meant filled superscription (containing the name of the patient, date of prescription, card number, sex, and age), inscription (drug name, strength, route, frequency, and duration of treatment), and subscription (with prescriber and dispenser name, qualification of the latter, signature, and date).
Dispensing time: is the duration between the patient giving the prescription to the dispenser and the patient receiving the medicine(s).
Counseling time: is the duration between the pharmacist giving the medicine(s) to the patient and the patient leaving the dispensary with adequate information about the prescribed medicine(s).
Patient knowledge: respondents were regarded as having adequate drug knowledge if they knew the proper dose, frequency of administration, length of therapy, and reason for prescription for the medicines at the interview.
Generic name: is known generic globally and a few commonly used brand names of known drug combinations like cotrimoxazole and coartem were considered generic names for this particular study.
Labeling: is considered adequate if it contained, generic name, strength, dose, quantity dispensed, frequency of administration, directions for use, expiry date, name of the patient, storage conditions, and special precautions.
Number of medicines per prescription: known combination therapies like triple therapy for H. pylori were not counted as three and medical supplies like gloves and syringes not being counted.
Prescription: referred to an order for a drug is written and signed by a duly licensed or authorized caregiver issued to a patient to gather drugs from the dispensing unit.14
Data-Collection Procedures
Data collectors were briefed on the target and relevance of the study and how to gather information using face-to-face interviews and how to use the structured checklist for prescribing, patient care, health-facility indicators and completeness of prescriptions, then the information was collected using WHO drug use–evaluation indicators in an abstract format.
Data Quality-Control Measures
Collected data were checked for completeness during collection by data collectors and supervisor, rechecked for appropriateness by a principal investigator, coded, and processed.
Data Management and Analysis
Data were cleaned by investigators, entered into SPSS version 24.0, and analyzed. Then, using descriptive statistics, results were tabulated. The values of indicators were compared with WHO standards and results of other similar studies.
Ethical Clearance and Consent to Participate
Ethical clearance was requested and obtained from the UoG College of Medicine and Health Sciences School of Pharmacy with approval letter number SoP 38/2011. Permission was formally requested and obtained from the UoG College of Medicine and Health Sciences and CSH. In this study, consent could not be expressed in written form but according to the Declaration Helsinki 64th WMA General Assembly, Fortaleza, Brazil in October 2013, the unwritten consent is acceptable; therefore, oral consent was obtained from each participant, who had been informed that they could discontinue at any stage of the interview. All participants who declared their willingness to participate were included in the study. Furthermore, this study has important social value and posed no more than minimal risks to participants. Confidentiality of data was maintained by omitting names and chart numbers and coded anonymously.
Results
Completeness of Prescriptions
A total of 1,128 medicines were prescribed in the sample analyzed. The prescribers used standard prescription, and medicines prescribed from the facility-specific pharmaceutical list of CSH was 1,031 (91.4%). Sex of patients was written on about 95% of the prescriptions. Of the sampled prescriptions, only 29 (4.8%) of the prescriptions contained the name of the dispenser, and 196 (32.7%) of prescriptions were signed by pharmacists, as depicted in Table 1.
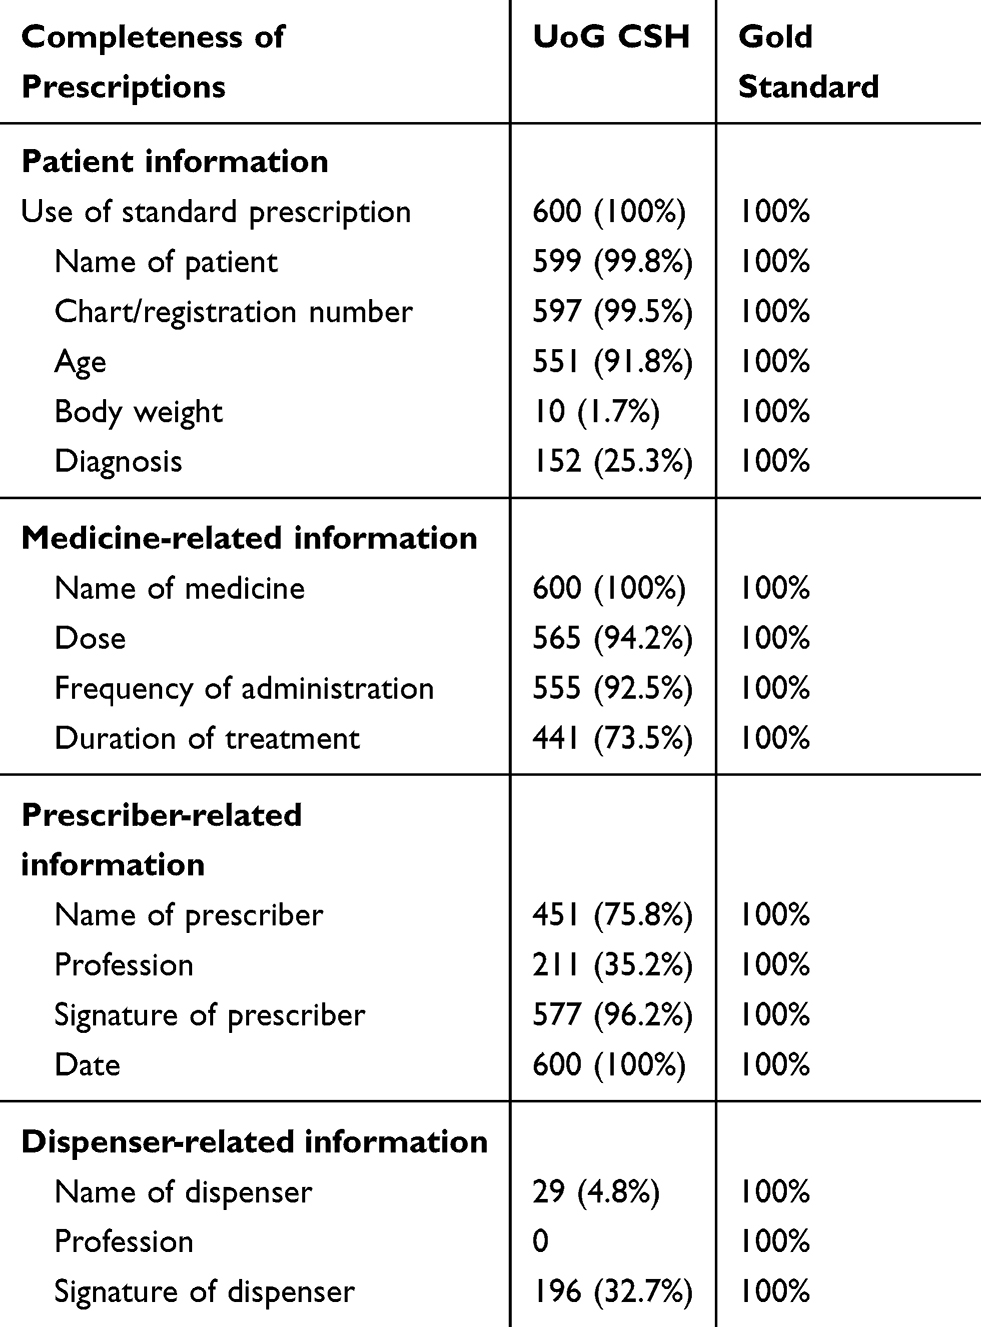 |
Table 1 Completeness of Prescriptions at UoG CSH, 2019 (n=600) |
Prescribing Indicators
The average number of medicines per prescription was found to be 1.88. Medicines prescribed by generic names, antibiotics, and percentage of encounters with injections were found to be 1,031 (91.4%), 37.5%, and 20%, respectively (Table 2).
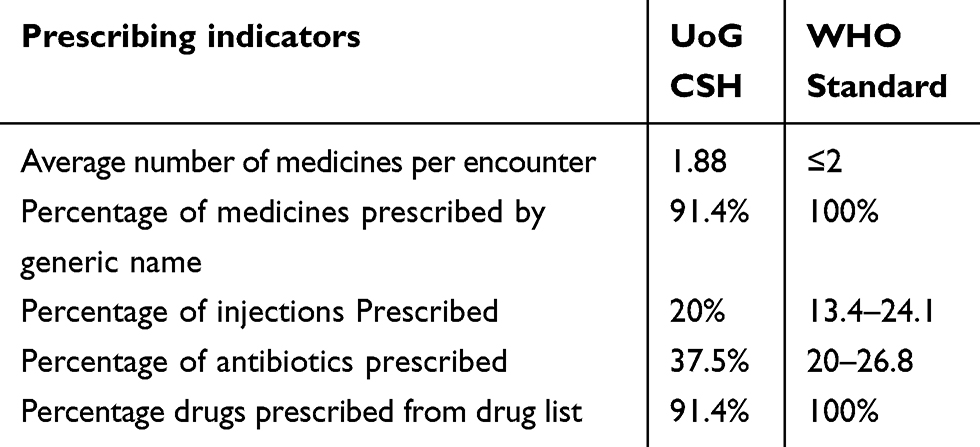 |
Table 2 Results for Prescribing Indicators at UoG CSH, 2019 (n=600) |
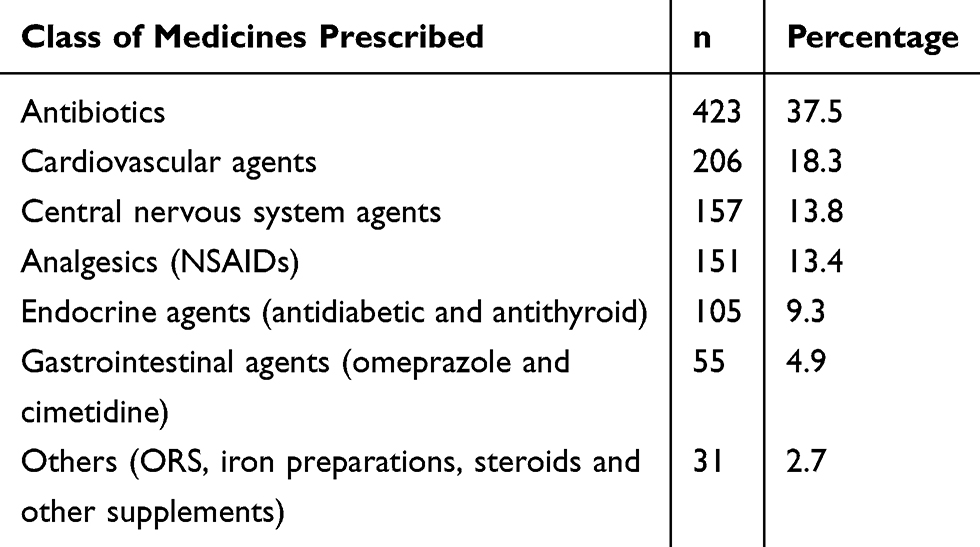 |
Table 3 Classes of Prescribed Medicines at UoG CSH, 2019 (n=1,128) |
Patient-Care Indicators
Average dispensing time was 65±54 seconds and average counseling time 15.4 seconds. Of the total prescribed medicines, 74.56% were actually dispensed and 18.5% adequately labeled. Regarding patient knowledge, 444 (74%) of patients knew about correct dose, frequency, duration, and reasons for prescribed medicines (Table 4).
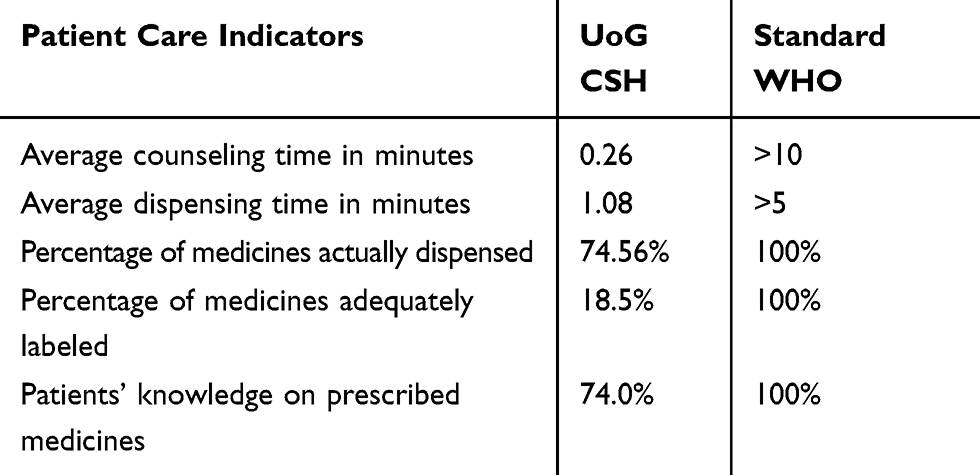 |
Table 4 Patient-care Indicators at UoG CSH, 2019 (n=600) |
Facility-Specific Indicators
UoG CSH has an updated facility-specific pharmaceutical list, but a key-medicine list was not available during this study was conducted.
Discussion
Completeness of Prescriptions
Irrational prescribing practices exist all over the world, particularly in developing countries, adversely affecting treatment outcomes.14 Findings on completeness of prescription have revealed that prescribers information is by far completed better than dispensers’ information. Nearly all prescriptions (99.8%) contained the name of the patient and 99.5% the card number, which is higher than earlier study at the UoG teaching referral hospital (73.54%),15 and lower than than the United Arab Emirates (100%).17 The age of the patient was written on 91.8% of prescriptions, higher than the study at UoG (86.64%), but lower than the United Arab Emirates (100%).15,17 Sex of the patient was written for 94.5% of prescriptions, indicating better improvement than earlier study findings at the same institution (67.93%).15 Only 1.7% weight of patients’ mentioned on prescriptions, mandating improvement. A total of 152(25.3%) prescriptions contained a diagnosis for treatment, higher than an earlier study (0.01%) and the one in the United Arab Emirates (0).15,17 Diagnosis and weight recorded were lower than the standard, even though diagnoses are crucial for pharmacists in identifying the consistency of diagnosis with medicines prescribed, potential drug interaction with diseases, contraindications, and better treatment outcomes.18 Poor prescribing practices promote irrational use of medicines, lower patient compliance, and increase costs and duration of treatment, emergence of drug interactions, drug resistance, and adverse drug reactions unnecessarily. It ultimately increases mortality, morbidity, and financial burden on patients.14
About 94.2% of prescriptions contained doses of each medicine, higher than an earlier study, at UoG, which was 81.38%.15 In sum, 555 (92.5%) of prescriptions contained frequency of administration, higher than the United Arab Emirates, but the duration of treatment was 76.07% lower than the United Arab Emirates (100%).17 Prescriptions containing the name of the prescribers were 451 (75.8%), higher than a previous study conducted at the same institution, which was 33.42% and 96.2% were signed by prescribers, similar to an earlier study. In contrast, from 600 analyzed samples, only 29 (4.8%) of dispensers had written their name on prescriptions and 196 (32.7%) prescriptions had been signed by pharmacists, indicating an area for intervention.15
Prescribing Indicators
Prescriptions are a clue for rational medicines use for a given health facility and type of health-care system of a country. The average number of medicines per prescription in the current study was 1.88, near to the range of the WHO standard (1.6–1.8)6,15 and better than some other studies, such as in Pakistan (3.4),10 Saudi Arabia (2.4),11 Nigeria (3.0),8 east Ethiopia (2.34),5 southern India (3.7),9 and northeast Ethiopia (2.5).7
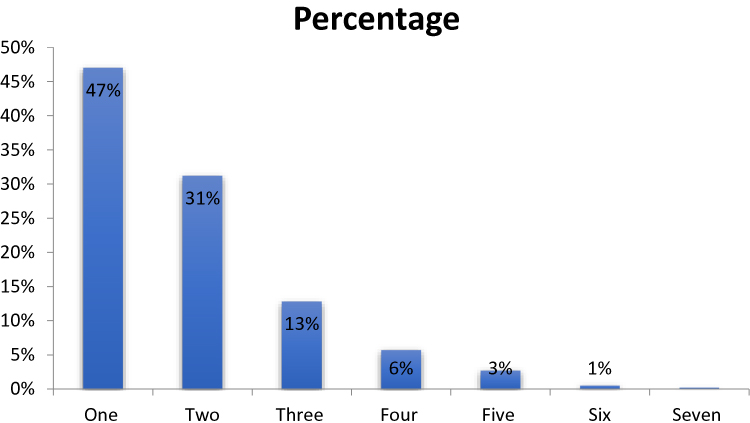 |
Figure 1 Distribution of medicines prescribed per encounter at UoG CSH pharmacy from March 21 to May 30, 2019. |
The proportion of medicines prescribed by generic name was 91.4%, lower than the standard6 and results from Hawassa (98.75%),18 Arba Minch (100%),16 West Shoa Zone (96.67),19 and Gondar University Teaching Referral Hospital (99.16%),15 but better than studies conducted in Pakistan (71.6%),10 Saudi Arabia (61.2%),11 Palestine, (5.5%),20 Kuwait (17.7%),12 Nigeria (70.2%),8 and the United Arab Emirates (19.4%).17 The lower percentage of prescribing by generic name compared to the standard might be attributed to preferences of prescribers and other influential factors, which might result in increased costs of treatment, customer dissatisfaction, and confusion.
In the current study, the proportion of prescribed antibiotics was 37.5%, higher than the standard (WHO optimal value ≤30%)6 and higher than studies conducted in Saudi Arabia (32.2%),11 southern India (22%),9 and Gondar (29.14%),15 but much lower than in Pakistan (48.9%),10 different parts of Ethiopia, such as Arba Minch (48.67%–60.2%),16 West Shoa Zone (38.3%–53.7%),19 Hawassa (58.1%),18 and eastern Ethiopia (57.87%).5 The study revealed that amoxicillin was most frequently prescribed (5.9%), followed by enalapril. The proportion of prescriptions with injectables was 20%, within the WHO standard (13.4-24.1)6 and far from similar studies in Saudi Arabia (2%),11 Nigeria (4%),21 West Shoa Zone (10.5%–15.5%),19 Kuwait (9.1%),12 eastern Ethiopia (10.9%),5 and southern India (7.2%),9 but lower than studies done in Pakistan (27.1%), Hawassa (38.1%),18 and an earlier conducted study (28.50%).15 The proportion of drugs prescribed from the essential drug list was 91.4%, lower than the WHO recommendations6 and a previous study conducted in the same health facility.15 6
Patient-Care Indicators
Medicines dispensed were 74.56%, less than the standard and studies done in Kuwait (97.9%)12 and Pakistan (97.3%).10 The proportion of medicines adequately labeled was 18.5%, lower than the WHO standard (100%) and Pakistan (100%), and much lower than studies in various parts of Ethiopia, southern Ethiopia (45.4%),22 and eastern Ethiopia public hospitals (63.3%).5 This inadequate labeling of medicines may lead to therapeutic failure and drug toxicity. Average counseling time was 15.4 seconds, lower than studies in Arba Minch (3.66–3.82 minutes), southern Ethiopia (4.2–4.9 minutes),22 eastern Ethiopia (4.6 minutes),5 northeast Ethiopia (1.57 minutes), Pakistan (2.2 minutes), Kuwait (2.8 minutes), and Nigeria (11.33 minutes). The average dispensing time was 65 seconds higher than Pakistan (38 seconds), Kuwait (54.6 seconds),12 and northeast Ethiopia (47 seconds),7 but lower than Arba Minch (1.18–1.33 minutes), southern Ethiopia (96.1–152 seconds),22 Nigeria (3.53 minutes), and eastern Ethiopia (1.02 minutes).5 These lower counseling and dispensing times than the standard and numerous studies are contributing factors to poor adherence, treatment failure, dissatisfaction of patients, and subsequent adverse events, so efforts have to be made for further improvement. Despite this fact, patient knowledge of the correct dose, frequency, duration, and reasons for prescription was 74%, higher than in Pakistan (62.1%),10 Arba Minch (52%–60%),16 and Kuwait (26.9%),10 but lower than southern Ethiopia (78.8%) and eastern Ethiopia (75.7%).5 Patient knowledge of medicine dose, frequency, duration, and reasons for prescribed medications is important to avoid underuse, overuse, and abuse of medicines, prevent adverse events, and limited medicine knowledge resulting in poor treatment outcomes.22
Health Facility–Specific Indicators
The facility has an updated pharmaceutical list, but the key-medicine list was not available during our study, and as a result we were unable to assess key-medicine availability. However, the medicines dispensed from the pharmaceutical list comprised 74.56%, higher than southern Ethiopia (65.7%),23 northeastern Ethiopia (66.7%),5 and an earlier study done at UoG CSH (66%).15 Most WHO drug-use indicators, specifically patient-care indicators, and percentage of prescribed antibiotics had not improved compared to a study conducted in the same facility about 7 years back.
Limitations
The study only measured the percentage of the core indicators, but did not assess the prevalence of the disease, stock of key medicines, or antibiotic correlations, whether correctly prescribed or not, nor did it determine factors contributing to standard and a number of similar studies conducted so far practices deviations.
Conclusion
The current study revealed that availability of standard prescriptions, pharmaceutical list, and prescribing from this facility-specific pharmaceutical list near to the standard of the WHO. On the contrary, several indicators, such as percentage of encounters with an antibiotic, medicine prescribed by generic name, and patient-care indicators deviated from the standards recommended by the WHO. Other patient-care indicators were also lower than the standards, including patient knowledge of dispensed medicines, dispensing time, counseling time, and labeling of medicines, mandating improvement. The key-medicine list was not available, so the key-medicine stock was not known. Finally, prescriptions lack completeness of patient information, medication information, prescribers and dispenser information, highlighting areas for intervention.
Recommendations
Based on our findings, we made the following recommendations to the hospital’s pharmacy, Drug and Therapeutic Committee, and the management.
- Improve the completeness of prescriptions.
- Implement system for monitoring of antibiotics and programs to promote rational medicine use.
- Dispensary personnel should improve counseling and dispensing times to explain about prescribed medicines thoroughly to patients, as this improves treatment outcomes.
- There should be a system for developing basic information labeling of dispensed medicines.
- Prepare key-medicine list to ensure stocks for the treatment of the most common diseases of the area.
- Future study to investigate the reasons behind incomplete writing of prescriptions and reasons for deviations from standards.
Data-Sharing Statement
All generated and analyzed data during this study are already in the manuscript.
Acknowledgments
The authors would like to thank the University of Gondar College of Medicine and Health Sciences School of Pharmacy for ethical approval and other support. Our acknowledgment also goes to the University of Gondar Comprehensive Specialized Hospital chief clinical director for permission to conduct the study. Lastly, we would like to thank the University of Gondar Comprehensive Specialized Hospital Pharmacy key informants, participants of the study, and data collectors.
Author Contributions
All authors made substantial contributions to conception and design, acquisition of data, or analysis and interpretation of data, took part in drafting the article or revising it critically for important intellectual content, agreed to submit to the current journal, gave final approval to the version to be published, and agree to be accountable for all aspects of the work.
Funding
No source of funding.
Disclosure
The authors declare that they have no competing interest to disclose for this work.
References
1. World Health Organization. Promoting Rational Use of Medicines: Core Components. Geneva: World Health Organization; 2002.
2. World Health Organization. The world medicines situation 2011, rational use of medicines. WHO/EMP/MIE/. 2011;2:2.
3. Bilal AI, Osman ED, Mulugeta A. Assessment of medicines use pattern using World Health Organization’s prescribing, patient care and health facility indicators in selected health facilities in eastern Ethiopia. BMC Health Serv Res. 2016;16(1):144. doi:10.1186/s12913-016-1414-6
4. Mao W, Vu H, Xie Z, Chen W, Tang S. Systematic review on irrational use of medicines in China and Vietnam. PLoS One. 2015;10(3):e0117710. doi:10.1371/journal.pone.0117710
5. Sisay M, Mengistu G, Molla B, Amare F, Gabriel T. Evaluation of rational drug use based on World Health Organization core drug use indicators in selected public hospitals of eastern Ethiopia: a cross sectional study. BMC Health Serv Res. 2017;17(1):161. doi:10.1186/s12913-017-2097-3
6. World Health Organization. How to Investigate Drug Use in Health Facilities: Selected Drug Use Indicators. Geneva: World Health Organization; 1993.
7. Mamo DB, Alemu BK. Rational drug-use evaluation based on world health organization core drug-use indicators in a tertiary referral hospital, northeast ethiopia: a cross-sectional study. Drug Healthc Patient Saf. 2020;12:15. doi:10.2147/DHPS.S237021
8. Ndukwe HC, Ogaji IJ, Sariem CN. Drug use pattern with standard indicators in Jos University Teaching Hospital Nigeria.
9. Aravamuthan A, Arputhavanan M, Subramaniam K, Udaya Chander J SJ. Assessment of current prescribing practices using World Health Organization core drug use and complementary indicators in selected rural community pharmacies in Southern India. J Pharmaceutical Policy Pract. 2017;10(1):1. doi:10.1186/s40545-016-0074-6
10. Atif M, Sarwar MR, Azeem M, Naz M, Amir S, Nazir K. Assessment of core drug use indicators using WHO/INRUD methodology at primary healthcare centers in Bahawalpur, Pakistan. BMC Health Serv Res. 2016;16(1):684. doi:10.1186/s12913-016-1932-2
11. El Mahalli AA. WHO/INRUD drug prescribing indicators at primary health care centres in Eastern province, Saudi Arabia. EMHJ East Mediterranean Health J. 2012;18(11):1091–1096. doi:10.26719/2012.18.11.1091
12. Awad A, Al-Saffar N. Evaluation of drug use practices at primary healthcare centers of Kuwait. Eur J Clin Pharmacol. 2010;66(12):12. doi:10.1007/s00228-010-0872-8
13. Otoom S, Batieha A, Hadidi H, Hasan M, Al Saudi K. Evaluation of drug use in Jordan using WHO patient care and health facility indicators. EMHJ East Mediterranean Health J. 2002;8(4–5):544–549.
14. Singh T, Banerjee B, Garg S, Sharma S. A prescription audit using the World Health Organization-recommended core drug use indicators in a rural hospital of Delhi. J Educ Health Promot. 2019;8.
15. Admassie E, Begashaw B, Hailu W. Assessment of drug use practices and completeness of prescriptions in Gondar University Teaching Referral Hospital. Int j Pharmaceutical Sci Res. 2013;4(1):265.
16. Mensa M, Tadesse T, Ayele A. Assessment of drug use pattern by using WHO Core drug use indicators at public hospitals in Ethiopia. J Community Med Health Educ. 2017;7(559):2161–2711. doi:10.4172/2161-0711.1000559
17. Sharif SI, Alabdouli AH, Sharif RS. Drug prescribing trends in a general hospital in Sharjah, United Arab Emirates. Am J Pharmacol Sci. 2013;1(1):6–9. doi:10.12691/ajps-1-1-2
18. Desalegn AA. Assessment of drug use pattern using WHO prescribing indicators at Hawassa University teaching and referral hospital, south Ethiopia: a cross-sectional study. BMC Health Serv Res. 2013;13(1):170. doi:10.1186/1472-6963-13-170
19. Gebramariam ET, Ahmed M. Evaluation of Rational Medicine Use Based on WHO Core Drug Use Indicators in Public Hospitals in West Shoa Zone, Oromia, Ethiopia. Adv Pharmacoepidemiol Drug Saf. 2019;8(1):2167. doi:10.35248/2167-1052.19.8.225
20. Fattouh R, Abu Hamad B. Impact of using essential drug list: analysis of drug use indicators in Gaza Strip. Eastern Mediterranean Health Journal. 2010;16(08):886–892. doi:10.26719/2010.16.8.886
21. Tamuno I, Fadare JO. Drug prescription pattern in a Nigerian tertiary hospital. Trop J Pharmaceutical Res. 2012;11(1):146–152. doi:10.4314/tjpr.v11i1.19
22. Gashaw T, Sisay M, Mengistu G, Amare F. Investigation of prescribing behavior at outpatient settings of governmental hospitals in eastern Ethiopia: an overall evaluation beyond World Health Organization core prescribing indicators. J Pharmaceutical Policy Pract. 2018;11(1):26. doi:10.1186/s40545-018-0152-z
23. Gidebo KD, Summoro TS, Kanche ZZ, Woticha EW. Assessment of drug use patterns in terms of the WHO patient-care and facility indicators at four hospitals in Southern Ethiopia: a cross-sectional study. BMC Health Serv Res. 2016;16(1):643. doi:10.1186/s12913-016-1882-8
 © 2020 The Author(s). This work is published and licensed by Dove Medical Press Limited. The
full terms of this license are available at https://www.dovepress.com/terms
and incorporate the Creative Commons Attribution
- Non Commercial (unported, 3.0) License.
By accessing the work you hereby accept the Terms. Non-commercial uses of the work are permitted
without any further permission from Dove Medical Press Limited, provided the work is properly
attributed. For permission for commercial use of this work, please see paragraphs 4.2 and 5 of our Terms.
© 2020 The Author(s). This work is published and licensed by Dove Medical Press Limited. The
full terms of this license are available at https://www.dovepress.com/terms
and incorporate the Creative Commons Attribution
- Non Commercial (unported, 3.0) License.
By accessing the work you hereby accept the Terms. Non-commercial uses of the work are permitted
without any further permission from Dove Medical Press Limited, provided the work is properly
attributed. For permission for commercial use of this work, please see paragraphs 4.2 and 5 of our Terms.