Back to Journals » Diabetes, Metabolic Syndrome and Obesity » Volume 13
Evaluation of Hypoglycemic Therapy Through Physical Exercise in n5STZ-Induced Diabetes Rats
Authors Ribeiro JKC, Nascimento TV ![]() , Agostinho AG
, Agostinho AG ![]() , Freitas RM, Santos LHP, Machado LMQ, Leal-Cardoso JH
, Freitas RM, Santos LHP, Machado LMQ, Leal-Cardoso JH ![]() , Moreira-Gomes MD, Ceccatto VM
, Moreira-Gomes MD, Ceccatto VM ![]()
Received 29 July 2019
Accepted for publication 17 December 2019
Published 1 April 2020 Volume 2020:13 Pages 991—1004
DOI https://doi.org/10.2147/DMSO.S225160
Checked for plagiarism Yes
Review by Single anonymous peer review
Peer reviewer comments 2
Editor who approved publication: Prof. Dr. Antonio Brunetti
JKC Ribeiro, TV Nascimento, AG Agostinho, RM Freitas, LHP Santos, LMQ Machado, JH Leal-Cardoso, MD Moreira-Gomes, VM Ceccatto
Instituto Superior de Ciências Biomédicas, Universidade Estadual do Ceará, Fortaleza, CE, Brazil
Correspondence: VM Ceccatto
Instituto de Ciências Biomédicas, Universidade Estadual do Ceará, Av Paranjana, 1700, Fortaleza, Ceará 60740-000, Brazil
Tel +55 85 3101 9814
Fax +55 85 3101 9796
Email [email protected]
Background: Diabetes mellitus is a syndrome with multiple etiologies involving insulin, in which there is a lack of production and/or loss of sensitivity to this hormone resulting in insulin resistance. Treatment and control of this disease requires changes in diet, use of medication, and lifestyle, such as physical activity. These modifications may compromise quality-of-life if there is no proper guidance for the treatment or alert to possible complications caused by the disease.
Methods: This study aimed to evaluate biochemical and hematological parameters, and to assess brain derived neurotrophic factor levels in diabetic Wistar rats submitted to chronic physical exercise.
Results: The results demonstrated an increase in plasma concentration of brain-derived neurotrophic factor (BDNF) in association with hyperglycemia reduction in diabetic animals.
Discussion: The results obtained suggest that there is a regulation of glucose homeostasis between peripheral tissues and the central nervous system. Exercise-induced BDNF also improved levels of glycemia, body weight, and dyslipidemia. In hematological evaluation, BDNF increase was positively correlated with an improvement in leukocyte parameters. Electrophoresis analyses demonstrated a reduction in levels of pro-inflammatory proteins, lipoprotein fractions, and albumin preservation in diabetic animals trained with elevated concentration of plasma BDNF.
Conclusion: In conclusion, this study demonstrated that chronic exercise was able to elevate BDNF levels in plasma, which resulted directly in positive hypoglycemic activity in diabetic animals and a reduction of the metabolic syndrome associated with diabetes mellitus.
Keywords: diabetes mellitus, dyslipidemia, exercise, n5-STZ, BDNF
Introduction
Diabetes mellitus (DM) is a public health issue worldwide. Current estimations suggest that the prevalence in the world is 425 million cases and one of every two individuals may remain undiagnosed. Approximately 80% of DM cases are distributed among developing countries, in which there are elevated incidence rates with an increased proportion of cases in young aged groups.1 In 2017, 4 million deaths occurred due to diabetes in the world. DM is a multiple etiology syndrome that occurs due to the lack of insulin and/or failure in sensitization to its effects, resulting in insulin resistance. Chronic hyperglycemia characterizes the disease, accompanied by dyslipidemia, arterial hypertension, and endothelial disfunction.2,3 Treatment is based in diet control, ingestion of oral hypoglycemic drugs, and insulin therapy, in association with regular physical exercise.4
The exercise-induced hypoglycemic effect may last for hours and even days after it ends. This normal metabolic response may be altered during states of extreme insulin deficiency or excess, which generates greater risk of hypo and/or hyperglycemia. Improvement in values of hematological parameters and biochemical profile, such as cholesterol, triglycerides, kidney, and hepatic markers are also observed in diabetic patients that perform regular or chronic physical exercise. For this reason, recommendations of physical activities by specialists have demonstrated a decrease in diabetes-associated complications and systemic effects that compose the metabolic syndrome.4,5
Metabolic syndrome or insulin resistance syndrome causes simultaneous deterioration of glucose metabolism, increases in LDL-C and VLDL-C, a decrease in HDL-C, pathological alterations in hematological profile, obesity, and arterial hypertension.4 In muscle metabolism, diabetes-promoted alterations result in increased oxidative stress with unbalanced levels of reactive oxygen species (ROS), cytosolic antioxidant enzymes, mitochondrial superoxide dismutase (SOD1 and SOD2), catalase (CAT), and glutathione peroxidase (GPX), which leads to muscle atrophy. These deleterious effects occur via signaling pathways activated by transmembrane receptors, such as GLUT-4, IRS-I, and Trkb. The latter is the receptor for brain-derived neurotropic factor (BDNF) that presents synergic action with the insulin glycopeptide.6
BDNF is a growth factor abundant in the brain and responsible for maturation, development, synaptic plasticity, and survival of cells. In this manner, studies have demonstrated the important role it plays in glucose metabolism and insulin resistance in peripheric tissues. This occurs through the activation of PI3K/AKT pathways that result in a decrease of ROS production and increase in fatty acid intake by mitochondria.7 Studies demonstrate that regular physical exercise is capable of elevating levels of this neurotrophic factor in blood plasma promoting a hypoglycemic effect and decreasing systemic complications caused by diabetes mellitus.8
Researchers suggest that chronic physical exercise may have a positive impact in diabetes-associated metabolic syndrome through the regulation of PI3K/AKT initiated by the BDNF/Trkb activation. This may result in a decrease of ROS production and cell proteolysis, increased fatty acid intake by mitochondria, and general improvement of glycemia, weight, biochemical, and hematological markers.9 Therefore, this study aimed to evaluate the beneficial effects of BDNF plasma increase stimulated by an experimental model of chronic exercise in diabetic n5-STZ Wistar rats against glycemia, body weight, serum proteinogram, biochemical and hematological markers. The n5-STZ model, neonatal diabetes induce, has been developed to better simulate the symptoms of human diabetes type 2 with a slower evolution, minimizing the large incidence and debilitating characteristics of this pathology. Our hypothesis is that chronic physical exercise acts as a non-pharmacological hypoglycemic therapy that reduces metabolic syndrome effects, with emphasis on intertissue liberation and regulation of BDNF.
Materials and Methods
Ethical Committee
The project was approved by Ethics Committee for the Use of Animals from State University of Ceará with protocol number 0721784/2016.
Animals
Forty Wistar rats, both sexes, provided by the Animal Facility of the State University of Ceara, were used in these experiments. The animals were maintained on a 12:12 hour light–dark cycle, at a controlled room temperature, and were provided food (rat chow) and water ad libitum throughout the experimental period, and ammonia exhaustion was managed. The principles of laboratory animal care were followed, and all of the experiments were approved by the Institutional Animal Care and Use Committee of Ceara State University, Brazil. All experiments were performed according to ARRIVE 2010 (Animal Research: Reporting of in vivo Experiments). The animals were randomly assigned to one of the four experimental groups (n=10/group): Sedentary control group (SCG), Exercise control group (ECG), Sedentary diabetes group (SDG), and Exercise diabetes group (EDG).
Experimental Procedure for Induction of Diabetes
After 5 weeks, analyses were performed to confirm the diabetic induction evaluating plasma levels of glucose, weight, water ingestion, and urinary volume.
The methodology described by Ferreira-da-Silva et al8 was used with modifications in this experiment. At 4 weeks, animals were submitted to an adapted running machine for the physical activity protocol.
The induction of Diabetes mellitus (DM) was performed on animals at 5 days old distributed in 10 per group weighting between 8 and 10 g. Initially rats were immobilized to receive a single dose of intraperitoneal injection of Streptozotocin (STZ) (60 mg/kg, s.c., Sigma Chemical Co., St Louis, MO) diluted on citrate buffer (0.1 M, pH 4.5). As control, 10 rats with the same conditions received an intraperitoneal injection with only citrate buffer as a vehicle.
DM was confirmed after 5 weeks by glucose tolerance test. After confirmation of the diabetic state, physical exercise on a running machine was performed until the end of the experiment, which lasted for 9 weeks.
Glucose Tolerance Test (GTT)
To determine the glycemic curve after oral glucose overload, animals stayed fasted overnight (12 hour period) and received 75 mg glucose/100 g body weight by oral gavage. Glucose levels were measured with capillary blood from the tail vein using a glucometer (OneTouch Ultra, Johnson & Johnson, New Brunswick, NJ) at the moment of glucose administration, named 0 (basal), and at time intervals of 5, 15, 30, 45, and 60 minutes.
Incremental Load Test
The exercise training protocol was based on the animal’s physical capacity, as assessed by periodic incremental load tests (ILTs). The incremental load test was performed to evaluate the animal’s maximum physical capacity by running on a treadmill to exhaustion.10 The ILT consisted of a series of 3 minute running steps at a constant speed, with increments of 0.2 km/h between the subsequent steps (Figure 1). The protocol was completed when the animal reached exhaustion, when it refused to run even under manual stimulation, and when the coordination between the anterior and posterior paws became difficult. The ILT was applied before the training period, at 3 and 6 weeks of training, and at the end of the experimental period. This period was used to adapt animals to physical training conditions and to minimize possible stress caused by this exercise.10
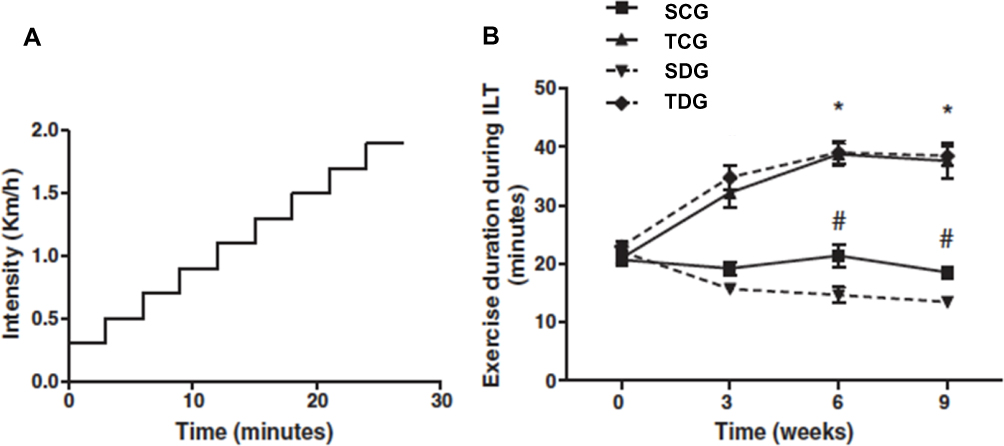 |
Figure 1 Exercise training improves exercise tolerance in an incremental load test. (A) A schematic representation of the incremental load test. (B) The exercise training improves exercise capacity in healthy rats with 3, 6, and 9 weeks of training. Data are expressed as mean±SE (n=10). *P=0.01 relative to control. Exercise training improves the exercise capacity in diabetic rats with 6 and 9 weeks of training. #P=0.001 relative to the diabetic rats. (adapted from Lima et al9). |
Training Protocol
The animals assigned to the ECG and EDG groups were trained by running on a non-graded motorized treadmill (Athletic Speed, Athletic, Brazil) 5 days weekly for a period of 9 weeks. The speed of the treadmill and duration of the training sessions are indicated in Table 1. The training intensity was determined as 60% of the maximum intensity reached at the ILT, which is considered a moderate intensity exercise. Therefore, the training intensity was changed over time as the physical capacity of the rats increased. Because there was no significant difference in the maximum exercise capacity between the non-diabetic and diabetic trained rats, all of the trained rats were subjected to the same intensity and duration throughout the exercise training protocol. To attenuate the physiological impact from the intensity increments during the training period, the rats were submitted to gradual increases of the exercise durations described in Table 1. All of the experimental procedures were performed in the dark cycle. The treadmill used was not equipped with electric grids at the rear of the treadmill lanes to provide an aversive stimulus to keep the animals exercising. A non-painful manual stimulus was sufficient to motivate the rats to continue running on the treadmill.
Premortem Evaluations and Sacrifice
Forty-eight hours after the last ILT, all of the animals, at the feed and rest conditions, were anesthetized with Ketamine 60 mg/kg + Xylazine 8 mg/kg followed by decapitation.
The serum was obtained after centrifugation (15 minutes, 3,500 rpm) and immediately analyzed.
The body weight was registered once a week for all animals (initiated at 5 weeks and continued until euthanasia). Other data were recorded, such as glucose levels, performed in all animals after 5 weeks, and a glucose tolerance test that was performed from 5 to 15 weeks with 12 hours of fasting.
Hematological Analysis
According to Facundo et al,11 animals were sedated with diazepam (5 mg/kg, i.p.) and anesthetized with sodium pentobarbital (20 mg/kg i.p.), which is a protocol sufficient to maintain 1 hour of anesthetic time. Experiments lasted for approximately 8 minutes.
Following surgical positioning, 5 mL of blood was collected from the inferior vena cava, which was distributed in tubes containing 10% sodium EDTA and in dry tubes to perform, respectively, hematological and biochemical evaluations.
Evaluated parameters included total leukocyte, neutrophils, lymphocytes, eosinophils, monocytes, red blood cells, hemoglobin, hematocrit, mean corpuscular volume (MCV), mean corpuscular hemoglobin (MCH), mean corpuscular hemoglobin concentration (MCHC), and mean platelet volume (MPV).
Hematological analyses were performed with a BC-2800Vet model, Mindray, and slides were evaluated with light microscope submitted to May Grunwald Giemsa staining protocol.
Biochemical Analysis
Serum was obtained by centrifugation of the blood in microtubes without anticoagulant at 3,500 rpm for 15 minute. Commercial kits (Labtest®) were used to perform spectrophotometric evaluations of the following biochemical parameters: low density lipoprotein (LDL-C), high density lipoprotein (HDL-C), triglycerides, total cholesterol, GOT (Glutamic oxaloacetic transaminase) and GPT (Glutamic Pyruvic transaminase), total protein, albumin, and total bilirubin. Readings were performed in a Mindray spectrophotometer, BA-88 model.12
Analysis of Protein Expression – Western Blotting/BDNF
Serum samples were previously collected and stored at −20ºC. Total protein count was performed with the Biuret method. From each stored microtube that contained 100 μg, a sample of 20 μg was collected and pooled in groups (CT, CS, DT, and DS).
Before electrophoresis, samples with buffer (10 mM Tris-HCl, 1 mM EDTA, 0.5% SDS, 1% 2-Betamercaptoetanol, 0.25% bromophenol blue) were heated to 100ºC for 5 minutes and cooled in ice for 5 minutes. Then, electrophoresis was performed in polyacrylamide gel (12% SDS-PAGE) (Biorad Mini Prothean). A low-range molecular weight marker of 6,600 kDa to 66,000 kDa (Sigma Aldrich) was used.
After migration, gel was incubated with the PLVD transference membrane (Sigma Aldrich) and buffer. Then, the membrane was incubated with antibodies and anti-BDNF (1:1,000) overnight in a dark room at 4ºC. Samples were then incubated with 5% casein with constant agitation for 5 minutes to block unspecific ligations. After this period, samples were incubated with Tween-20 with constant agitation and then membranes were conjugated with secondary antibody horseradish peroxidase (1:10,000) for 60 minutes with constant agitation. Transferrin was used as a control. Sample revelation was performed with chemiluminescence. Contrast comparisons were evaluated with IMAGE J software.
Proteinogram Analysis
After electrophoresis, Coomassie Brilliant Blue R-250 (CBB) was added to the polyacrylamide gel in agitation for 1 hour. This stain was prepared with Coomassie blue, methanol, glacial acetic acid, and distilled water. Then, a decolorizer solution was prepared with methanol, glacial acetic acid, and distilled water, which was used in the gel. This step was performed to remove the stain that did not react with the gel, which promoted a visualization of the protein bands stained in blue in the transparent gel. Contrast comparisons were evaluated with IMAGE J software (ImageJ, U. S. National Institutes of Health).
Determination of Total Protein Concentration
The Biuret method was used, where peptide ligations of proteins (-HN-CO-) react with cupric ions in alkaline medium (Biuret reagent) forming a violet colored complex. In the technique, the absorbance measured with a spectrophotometer at 545 nm is directly proportional to the concentration of proteins in the sample.
Statistical Analysis
The t-test was used to calculate standard deviation in samples. Significance was considered when protein values obtained in the experiment presented probability of occurrence of null hypothesis lower than 5% (P<0.05%). In addition, analysis of variance was performed with the one-way ANOVA method.
Results
Western Blot Quantification of Plasma BDNF
Figure 2 illustrates protein levels of BDNF revealed by Western blotting, which was performed with specific anti-BDNF antibody. The image of the autoradiography after incubation of PVDF membrane with chemiluminescence solution demonstrate a significant reduction of BDNF levels in diabetic rats in comparison to control (P<0.01). The increase in BDNF levels of trained diabetic rats in comparison to sedentary was statistically significant (P<0.01). There was a significant difference in expression of this protein (P<0.01) between sedentary and trained controls.
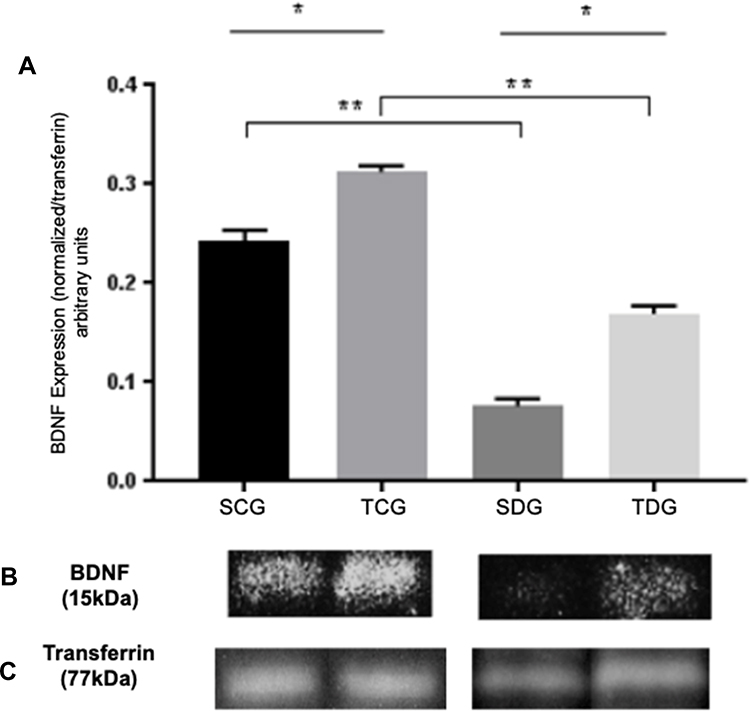 |
Figure 2 Analysis of BDNF levels of serum samples from trained and sedentary diabetic rats in comparison to controlled healthy groups. (A) Mean (M), standard deviation (SD), and significance of BDNF expression in diabetic and healthy groups, trained and sedentary. Values were obtained from PVDF membrane and expressed as a BDNF/transferrin relation (arbitrary units). * Significant statistical differences (P<0.05) between the same groups are and ** amongst control and diabetes group. (B) Expression of BDNF (15 )kDa in sedentary and trained groups, diabetic and healthy. (C) Normalization with transferrin protein stained with Coomassie blue (77kDa). |
Biochemical Evaluation
Lipidic Profile
Post-mortem evaluation of lipidic profile of Wistar rats (Table 2) demonstrated significance (P<0.05) for all analyses between diabetic and control groups. Total cholesterol results revealed mean values of 68.38±1.461 and 54.63±4.865 mg/dL in SDG and TDG groups, respectively. HDL mean values were 31.22±1.938 and 42.23±2.435 mg/dL in TDG and TCG groups, respectively. Significance was identified in triglyceride values between trained and sedentary diabetic groups in relation to their respective control groups.
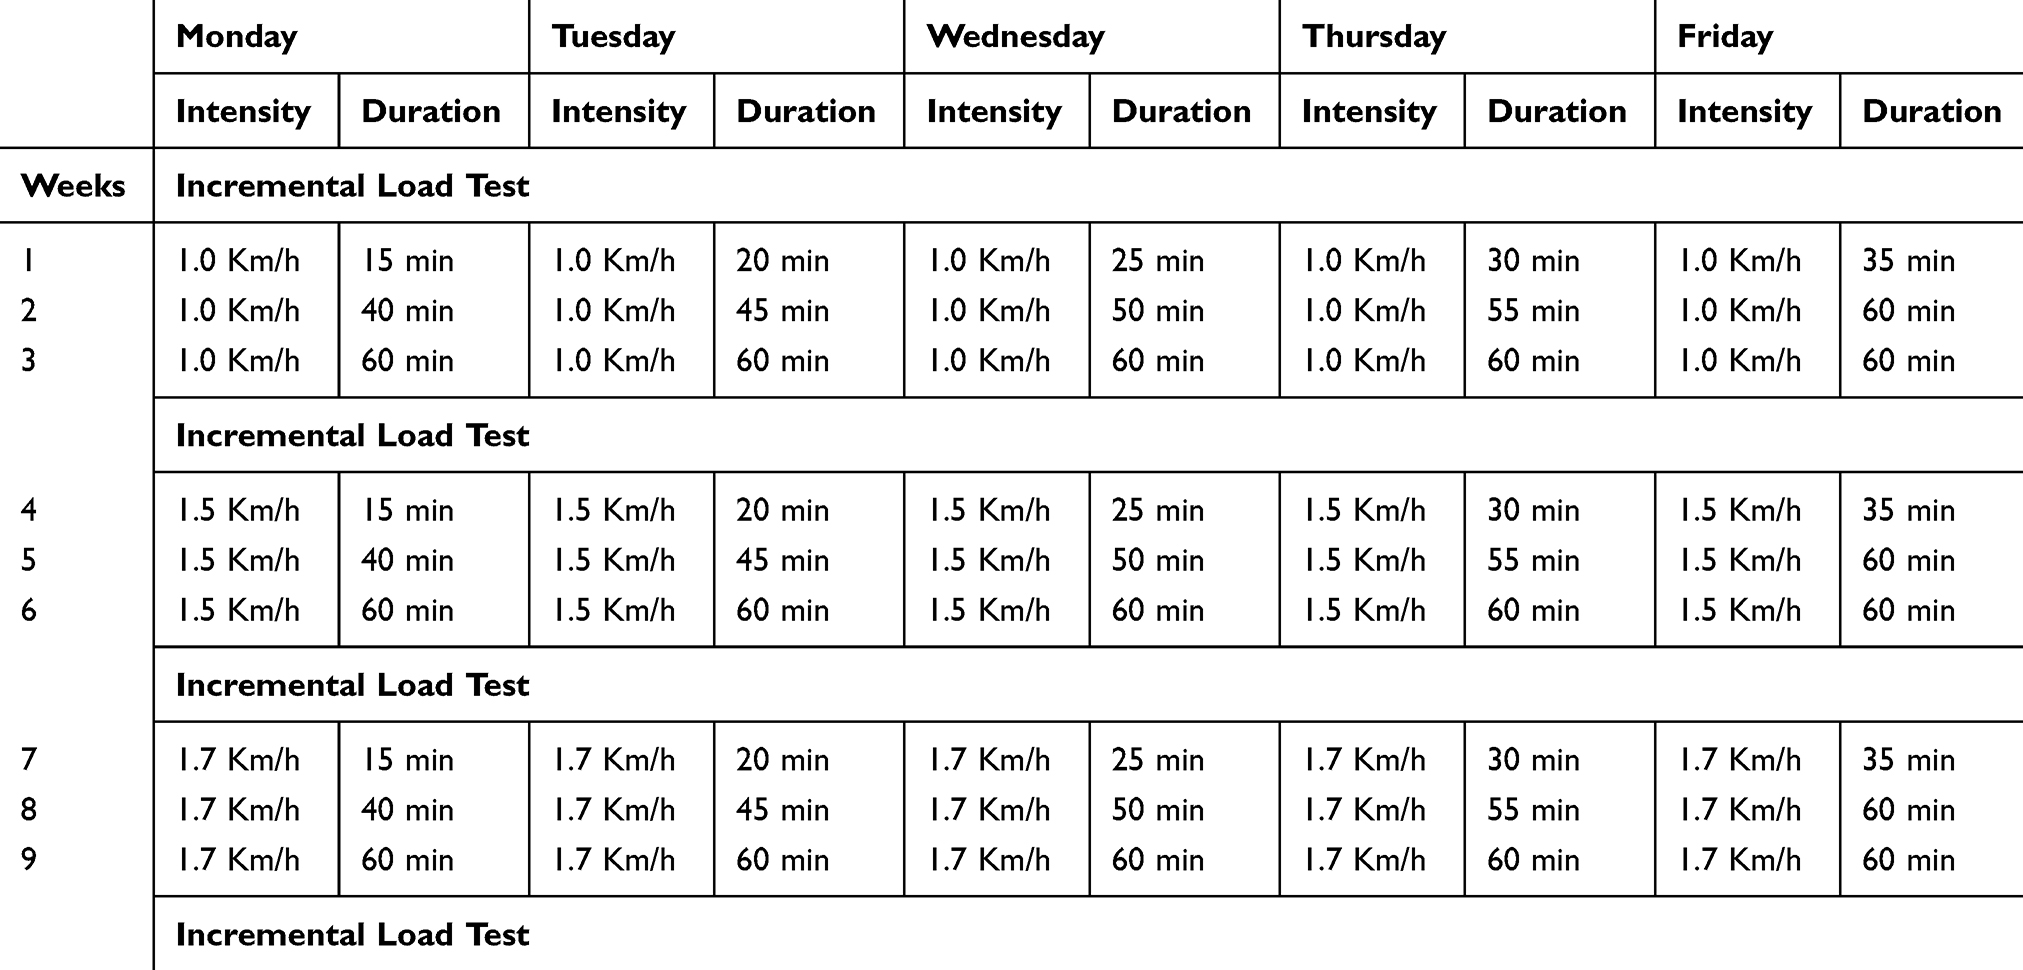 |
Table 1 Exercise Training Protocol. The Intensity Is Expressed in Kilometers per Hour (Km/h) and the Duration in Minutes (Min). The Values Correspond to a Single Exercise Session. Both the Healthy and the Diabetic Animals Underwent This Exercise Training Protocol |
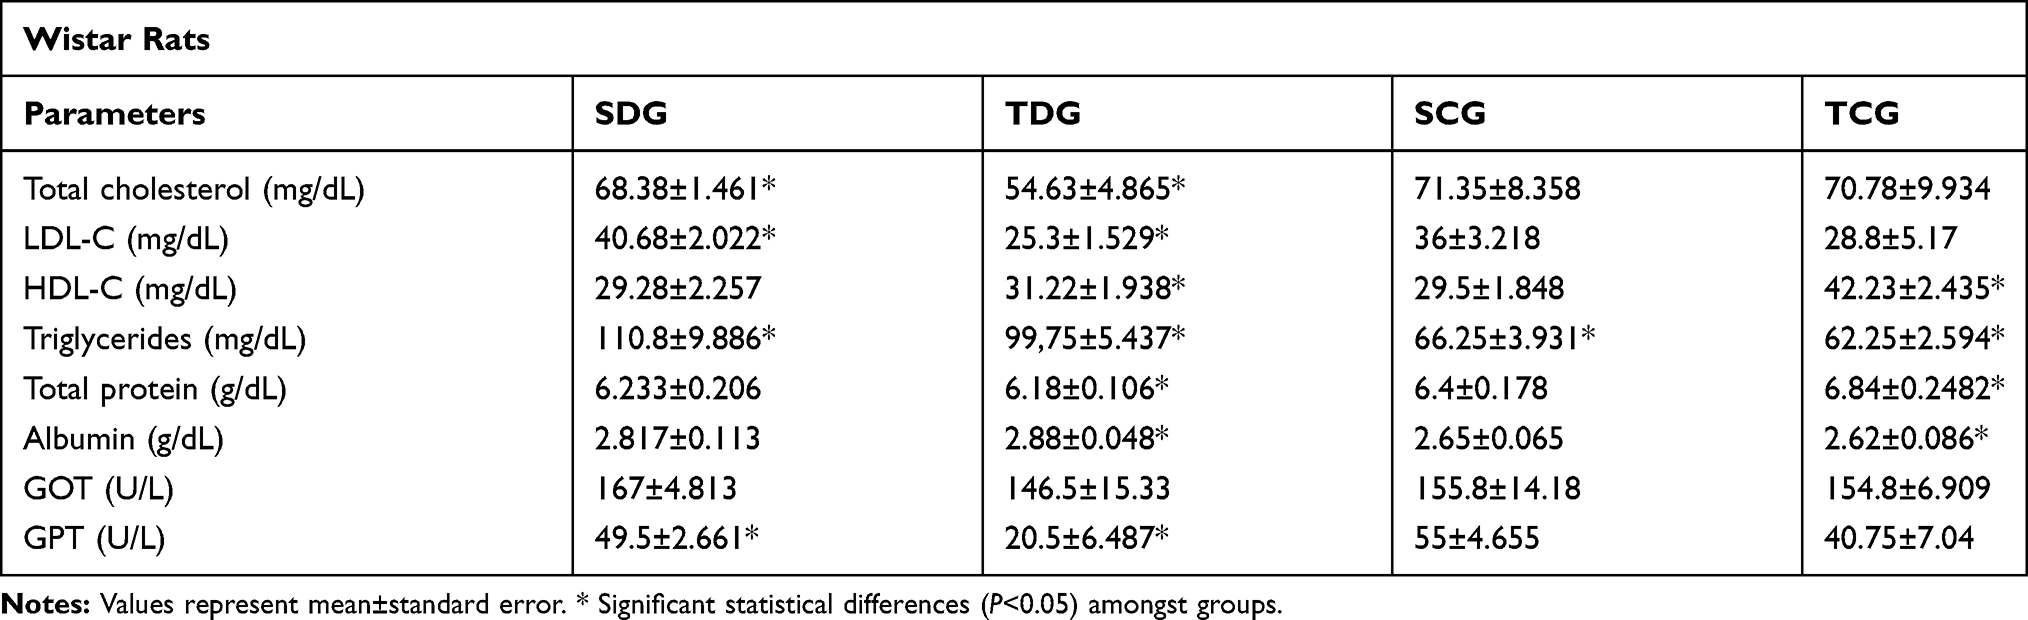 |
Table 2 Postmortem Biochemical Parameters |
Total Protein and Albumin Results
Total protein and albumin concentrations in serum of Wistar rats examined post-mortem (Table 2) presented a significant difference (P<0.05) between trained groups. Mean values of total protein were 6.18±0.178 and 6.84±0.248 g/dL in TDG and TCG groups, respectively. Meanwhile, mean values of albumin fraction were 2.88±0.048 and 2.62±0.086 g/dL in TDG and TCG groups, respectively.
Liver Enzyme Profile
After euthanasia, the concentrations of glutamic oxaloacetic transaminase (GOT) and glutamic pyruvic transaminase (GPT) were assessed. Significant difference (P<0.05) was observed only in GPT values between SDG and TDG groups with mean values of 49.5±2.661 and 20.5±6.487.
Proteinogram
To determine concentrations of protein fractions in serum samples from groups, electrophoresis was performed under denaturing conditions. Figure 3 displays values of mean (M), standard deviation, and significance of globulin fraction results obtained in polyacrylamide gel electrophoresis (SDS-PAGE) performed with serum samples of rats submitted to chronic physical exercise. Protein concentrations of albumin fraction identified in polyacrylamide gel electrophoresis are displayed in Figure 4.
 |
Figure 3 Means (M), standard deviation (SD), and significance of serum protein fractions in polyacrylamide gel electrophoresis (SDS-PAGE) of rats submitted to physical activity. * Significant statistical differences with two-way ANOVA (P<0.05). |
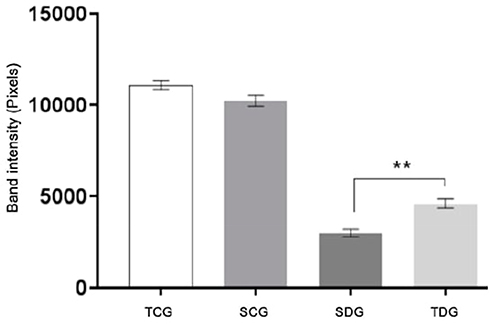 |
Figure 4 Means (M), standard deviation (SD) and significance of albumin serum concentrations identified in polyacrylamide gel electrophoresis (SDS-PAGE) from rats submitted to physical activity. Values represent mean±standard error. ** Significant statistical differences (P<0.05). |
Globulin Fraction
The pixel intensity of bands identified in electrophoresis of γ-globulins and β2-globulin fractions are represented in Figure 3. Significant difference was (P<0.01) observed between diabetic groups and their respective controls, SCG and TCG. Only in β1-globulin fraction significant difference was observed between diabetic groups and their controls. In α2-globulin fraction, significant difference was observed between diabetic groups. Meanwhile, statistical difference (P<0.01) was observed between groups SDG and TDG, and their respective controls, SCG and TCG, in α1-globulin fraction.
Albumin Fraction
Albumin fraction results of samples of Wistar rats collected post-mortem are displayed in Figure 4. Significant difference in serum concentrations of between diabetic groups and their respective controls, SCG and TCG, was observed (P<0.05).
Weight and Glycemia
In the post-mortem evaluation, significant difference was observed in body weight (Figure 5) of TDG and SDG diabetic rats. In addition, these groups also had statistically different serum glucose results between themselves and in relation to their respective controls (P<0.05), in which trained groups presented best mean values (Figure 6).
 |
Figure 5 Body weight in grams (g) of rats submitted to physical activity. Values represent mean±standard error. * Significant statistical differences (P<0.05). |
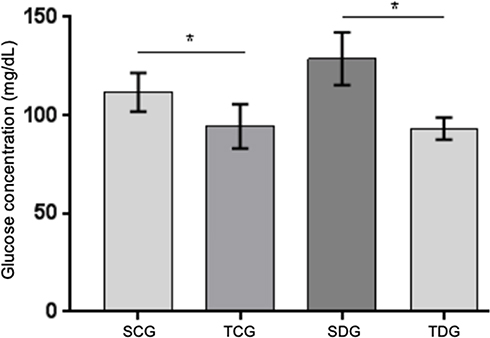 |
Figure 6 Postmortem serum glucose levels (mg/dL) of diabetic and control rats fasted for 12 hours submitted to physical activity. Values represent mean±standard error. * Significant statistical differences (P<0.05). |
Hematological Evaluations
Hematological values were investigated, including erythrogram, leukogram, and platelet count, which were performed post-mortem. Results show comparisons between sedentary diabetic group (SDG), trained diabetic group (TDG), sedentary control group (SCG), and trained control group (TCG) (Table 3).
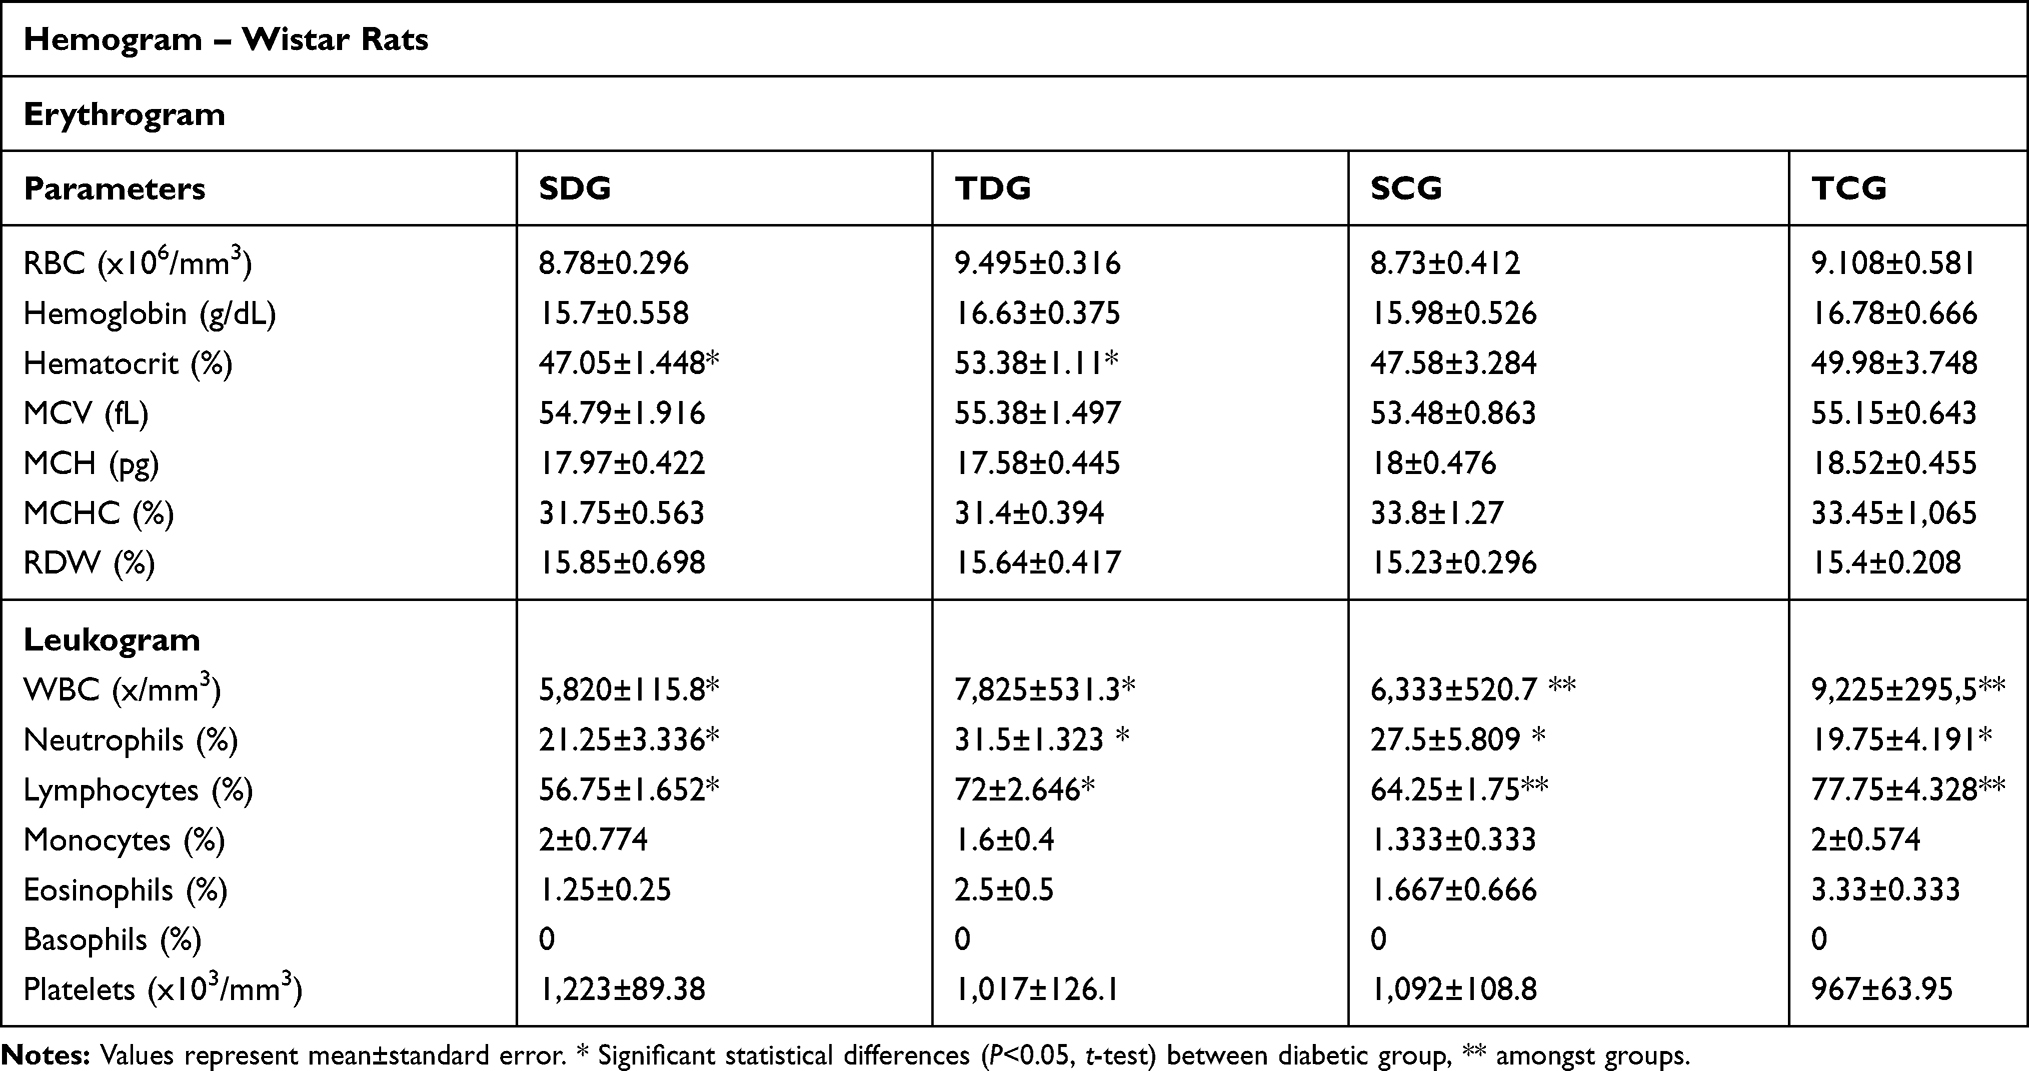 |
Table 3 Postmortem Hematological Parameters, Erythrogram, Leukogram, and Platelet Count of Animals |
Erythrogram
No significant alterations for P<0.05 were observed in any parameter of the red cell analysis with the exception of hematocrit levels between TDG (53.28±1.11%) and SDG (47.05±1.44%).
Leukogram
Post-mortem leukogram of rats revealed an increase in leukometry values between SDG (5,820±115.8/mm3) and TDG (7,825±531.3/mm3). In addition, significance was observed between TDG and the respective trained group (P<0.05). Differential leukogram results revealed neutrophilia and lymphocytosis in TDG in relation to SDG. Results for monocyte and eosinophil counts did not show statistic difference (P<0.05) or discrepancy between values.
Thrombocytometry
Total platelet count results did not demonstrate a significant difference between diabetic groups or in relation to their controls (P<0.05). In addition, there was no discrepancy in values.
Discussion
BDNF Effect on Glucose Homeostasis
In this study, diabetic rats submitted to chronic physical exercise presented a significant elevation of plasmatic BDNF levels in comparison to sedentary diabetic rats. Levels of this factor in non-diabetic animals also had a significant increase in results obtained from the trained group in comparison to the sedentary group, which indicates a direct effect of the physical activity in its production (Figure 2). In addition to this important result, glucose plasmatic levels of diabetic animals were inversely correlated with BDNF expression suggesting an important hypoglycemic effect of this protein to be explained (Figure 6).
Results obtained by Li et al13 with ELISA demonstrated that patients with systemic inflammatory diseases, such as type 2 diabetes mellitus, presented BDNF plasma levels approximately 45% lower than healthy individuals, and the same correlation with glycemia was also observed. In addition, Meek et al14 demonstrated for the first time that intracerebroventricular injection of BDNF was capable of decreasing hyperglycemia in type 2 diabetic rats induced by STZ, which suggests a neuronal-based mechanism capable of regulating plasma glucose levels.
Although BDNF has been extensively studied in neurodegenerative diseases, a direct intertissue relation of this protein has been approached by researchers, with a possible hypoglycemic effect in diabetes mellitus.15,17 Such a mechanism may be observed in experiments with STZ-induced diabetic Wistar rats that demonstrated the ligation of BDNF and its cell surface receptor, trkb, activating IP3K/AKT/m-TOR pathways, which are responsible for cell survival and glucose homeostasis regulation.7,17
Recent studies demonstrated that skeletal muscle tissue produces a protein that acts in synergy with BDNF after muscle contraction stimulus and presents a local hypoglycemic effect. Such a result suggests a new hypothesis related to the increase in BDNF expression with muscle origin associated to its plasmatic fraction in glycemia control in diabetic animals submitted to chronic exercise.18
Evaluation of Biochemical Profile
Lipidic Profile
Exercise aids in glycemia control in diabetic individuals and improves lipid levels.19,21 Such findings corroborate with the results obtained and demonstrated in Table 2. Despite the dyslipidemia observed in diabetic rats in comparison to control, lipid profiles of trained groups presented better results. A decrease in triglyceride and LDL-C levels was observed with an increase in HDL-C values. These results suggest that physical training was able to increase muscle capacity of fatty acid oxidation in diabetic rats, which contributed to lower risks of cardiac diseases, arterial hypertension, and atherosclerosis.
There was a significant decrease in total cholesterol values in diabetic groups, which is often increased in the metabolic syndrome associated with diabetes. A possible explanation is that the intertissue regulation promoted by neurotrophin factors and peripheral tissues is not restricted to glycemia. In 2016, Zembron-Lacny22 demonstrated, in a study with elder and teenager humans submitted to chronic physical exercise, that there was a significant increase in plasma BDNF in comparison to VO2max in addition to an improved profile of plasma lipoproteins and a decrease in oxidative stress. In that study, BDNF production during exercise was also able to decrease C-reactive protein (CRP) and the oxidized fraction of LDL cholesterol (oxLDL-C). This suggests a possible pharmacological bioactive role of this molecule in the prevention of inflammatory and cardiovascular diseases, which are frequently present in diabetic individuals.
In this study, a correlation between the elevation of plasmatic BDNF levels (Figure 2) and the improvement of lipidogram in trained diabetic animals (Table 2) was observed, which corroborated with other reports. A hypothesis associated with this finding could be the BDNF liberation derived from skeletal muscle cells, which would be lower than the production by the brain. In addition, it could present an autocrine and/or paracrine effect that promotes lipid oxidation through an AMPK-dependent pathway.18
Evaluation of Liver Transaminases
During biochemical evaluation, two important enzymatic biomarkers were investigated, GOT (glutamic oxaloacetic transaminase) and GPT (glutamic pyruvic transaminase). This step was performed to evaluate hepatotoxicity associated with the diabetes metabolic syndrome, especially hypertriacylglycerolemia and ketogenesis.23
Lipid concentration in liver predisposes several alterations related to the resistance to insulin in normal weight and moderately overweight individuals, independent of parameters, such as BMI and intra-abdominal or general obesity.24 A significant increase was observed in GPT values from diabetic groups in comparison to trained diabetic groups. This result presupposes that the liver condition, which could be steatosis and elevated ketogenesis, was attenuated. This corroborates with the reduction in bodyweight of animals submitted to training (Figure 5) and the improvement in triglyceride levels (Table 2). No significance was observed between groups for GOT enzyme, which demonstrated that the chronic exercise on a running machine was not capable of causing lesions in skeletal or cardiac muscle tissues of the animals.
Total Protein Evaluation
In diabetes, increased proteolysis and consumption of plasma proteins promoted by muscle metabolism abnormalities are expected. Uncontrolled insulin deficiency and diabetes lead to a catabolic state with decreased muscle strength and mass, which contributes to mortality related to the disease. Studies demonstrate that FoxO transcription factors play a critical role in the regulation of muscle atrophy associated with diabetes and reduction in plasma proteins.25 A decrease in total plasma protein of diabetic animals may be observed in the results displayed In Table 2. However, an increase in serum protein levels can be observed in animals that were submitted to exercise. Despite the contribution of muscle protein catabolism, liver conditions caused by diabetes mellitus, such as steatosis, ketogenesis and dyslipidemia, result in decreased synthesis of serum proteins by hepatocytes.25,26 As an additional proof of liver function, this result corroborated findings obtained for the GPT enzyme in Table 2.
Proteinogram of Blood Plasma
Albumin Fraction and Nutritional Evaluation
Complications related to the metabolic syndrome caused by diabetes have been extensively reported in studies, such as an increase in proteolysis, oxidative stress, liver conditions, and kidney dysfunction. These alterations directly affect the protein nutritional status of a patient, which is reflected in plasma albumin concentration.8 Electrophoresis results (Figure 4) indicate that the plasma albumin concentration of diabetic groups presented high significance in comparison to control. Meanwhile, there was no significant difference between concentrations of this serum fraction in relation to exercise. No factor that contributed to albumin level variation was observed in control animals.
Several clinical signs demonstrate that previously described comorbidities associated with diabetes relate directly to the results observed in Figure 4 for SDG and TDG groups. Then, as a deduction, even with a marked reduction in albumin concentration, physical training promoted a significant improvement in plasma protein levels in trained diabetic animals. Possible explanations for this protein nutritional profile observed in diabetic animals often associated with the disease include low liver synthesis, increased muscle proteolysis, increased loss from kidney, and intestinal lesions. According to Perry et al,26 diabetes mellitus pathogenesis activates neoglucogenesis and intense proteolysis with loss of muscle mass activated by Akt/IgF-1, ubiquitin-proteosome, and Caspase-3 pathways. These mechanisms can result in a decreased concentration of plasma proteins, specially hypoalbuminemia, corroborating with the obtained result.
Alpha Globulin Fractions
Previous studies have demonstrated that alterations of alpha-1-globulin and alpha-2-globulin protein concentrations are directly related to metabolic complications in insulin resistance. Both variations, increase and decrease, presented clinical significance and importance in the evaluation of evolution and prognosis of diabetes mellitus. In Figure 3, a decrease of both alpha-globulin protein regions may be observed. Results were lower in alpha-1-globulins in association with the reduction of approximately one third of the albumin fraction in diabetic animals. The profile of electrophoresis results observed in SDG and TDG were suggestive of a classic case of selective protein loss. Moreover, these could be caused by either enteropathies or chronic kidney lesions and inflammatory processes, both of which may occur in diabetic patients.27
Although physical exercise presented similar a profile in diabetic animals, it was capable of significantly improving plasma retention for these proteins and attenuating protein loss or uninvestigated kidney lesions. Reports in medical science point to an alternative hypothesis of interpretation of alpha protein decrease that occurs in cases of liver lesions and insufficiency, which corroborate with GOT levels observed in Table 2. There was no increase in alpha globulin fractions in diabetic groups. However, some reports demonstrate that, in similar models, there is an association of the concentration increase and chronic inflammatory processes caused by the oxidative stress generated by the metabolic syndrome.28
Beta Globulin Fractions
Beta globulin fractions have important markers in clinical diagnosis, such as transferrin (beta1) and C3 from the complement system (beta2). Transferrin is synthesized in liver cells and is responsible for iron plasma transport. Hence, the increase of concentration of this protein and beta globulin fraction is an indication of iron deficiency. In cases of iron-deficiency anemia, these levels are also elevated. However, there is less saturation. Decreased interzone alpha2/beta1 may occur in diabetes mellitus, inflammatory processes, and pancreatitis.29 There were no significant levels of beta1 in animals from this study. Nevertheless, experimental studies that induce disease often fail to produce all the pathologies (Figure 3).
The role of the C3 component in the complement system is well understood, acting as a moderator in numerous immune reactions. Hence, a C3 increase induces beta-globulin rise in chronic infectious processes. Nonetheless, elevated beta globulin fraction may also indicate hyperlipidemia due to the beta lipoprotein or LDL-cholesterol, which may increase in biliary obstruction. Although genetic deficiencies may occur, acquired deficiencies, secondary to its consumption, are more common in infectious and inflammatory diseases with an acute or chronic nature.30 In Figure 5, significance can be observed between diabetic and control groups, where trained animals presented a decrease in relation to sedentary rats, despite that levels in diabetic patients are relatively higher than healthy ones. This contributed to the LDL-cholesterol increase observed in the biochemical results (Table 2).
Gamma Globulin Fraction
Despite the absence of a direct correlation between diabetes mellitus and acquired mono or polyvalent immunity, this study demonstrated increased levels of gamma fraction in serum protein of trained groups (Figure 3). A possible explanation for such a protein profile is the inflammatory effect associated with chronic physical exercise that results in elevation of proinflammatory mediators. These have molecular masses compatible with gammaglobulin fraction and interfaces with b2 globulins or their conjugates. In diabetic groups, an albumin decrease is highlighted in situations of hypergammaglobulinemia, when there is an intense unbalance of albumin/globulin relation.31
Weight and Glycemia Control
Regular physical training reduces general and local adaptative alterations in several organic systems. These changes aim to maintain glycolytic homeostasis that physical exercise promotes. Several studies demonstrate how body weight influences the evolution of DM and insulin resistance.21,22
Physical exercise is important in the treatment of diabetes for controlling glycemia and other comorbidity factors, such as hypertension, obesity, and dyslipidemia. Hence, it also aids in reducing cardiovascular risks.32 Corroborating with reports, 9 weeks of physical exercise on a running machine was capable of significantly reducing body weight and glycemia of trained diabetic rats, which demonstrated a direct mitigation of alterations caused by metabolic syndrome (Figures 5 and 6). Two explanations could be attributed to this finding in trained diabetic rats. The increase in liver gluconeogenesis and greater intracellular intake of glucose by an alternative pathway, PI3K/Akt/mTOR, induced by BDNF/Trkb ligation, considering that animals presented hyposecretion or absence of serum insulin. The final product of this pathway would be protein expression of glucose and lactate transporters, such as GLUT-3 and MCT2, respectively. The caloric expend in the weight loss of trained diabetic animals contributes to this finding. In addition, a relation between plasmatic BDNF increase and appetite decrease have also been reported.33
Evaluation of Hematological Parameters
Leukometry and Leukocyte Differential Count
Studies demonstrate that physical exercise may promote alterations in concentration, proportion, and function of leukocytes, especially in polymorphonuclear cells and lymphocytes, affecting immunoglobulins and other factors.34,35
In this study, physical exercise resulted in a significant increase of total leukocyte values (Table 3). Several authors suggest that the increase of immune response after a session of training may occur in a 4–24 hour period after the session. In this period, the organism is vulnerable to opportunistic infections.36 Moreover, the increase in total number of leukocytes may occur due to the training protocol and not only an acute session of physical activity, which may be interpreted as a positive adaptation by the organism.
The results corroborate with several studies that have demonstrated the increase in leukocytes of animals submitted to training. Leukocytosis may increase in a linear manner according to the intensity of the exercise. During training, leukocytes are recruited to the body periphery, resulting in an increased concentration of neutrophils. The increase in lymphocyte percentage (lymphocytosis) resulting from the exercise occurs as a consequence of stress, especially adrenaline, which increases cell liberation from the storages to the blood stream. Lymphocytosis is caused by recruitment of NK, T, and B lymphocytes.37,39
Results may suggest that the chronic effect of exercise was the most expressive stimulus in the induction of white blood cell increase in leukometry, which is fundamental in innate and acquired immune responses. The increase in leukometry was related to a plasma BDNF increase in trained diabetic animals, which corroborates with the study by Azoulay et al.40 Their results demonstrated that these factors have the ability of promoting chemotaxis and myeloproliferative increase and effect in animals through the interaction with CXCR4 receptors.
There were no significant alterations in eosinophils or basophils, since variation in these cells are related to parasitosis and allergies, respectively.41
Erythrogram Evaluation
Hematocrit, hemoglobin concentration, and red cell count have decreased values in practitioners of resistance physical exercise, mostly due to the expansion of plasma volume that this activity promotes. This expansion is mediated by the increase of body fluid retention, resulting in diminished values of hemoglobin and hematocrit in individuals that practice chronic physical exercise.42
Hematocrit results displayed in Table 3 demonstrate that there was a significant difference between diabetic animals, which indicates a greater number of red cells in their blood volume. In some situations, a hematocrit increase may cause a chronic myeloproliferative disturbance due to the abnormal clonal multiplication of pluripotent hematopoietic progenitor cells in the absence of recognizable physiological stimuli, in which super production of erythrocytes occur.43 However, no signs of this disturbance were identified in the animals, even with significance in hematocrit values. A possible explanation for erythroid hemoconcentration in diabetic animals would be associated with water and electrolyte mobilization in the muscle tissue due to the exercise. This effect associated with kidney injury and polyuria/glycosuria would promote greater dehydration, resulting in plasma concentration of blood elements.44
No alterations in hematimetric values were observed, including mean corpuscular volume (MCV), red cell distribution width (RDW), mean corpuscular hemoglobin concentration (MCHC), and mean corpuscular hemoglobin (MCH). These rates are not related to metabolic syndrome or physiological alterations caused by physical exercise. Mostly, alterations in these values occur due to deficiency anemia, kidney neoplasms, and medullar dysplasia.45,46
According to what has been thoroughly demonstrated and discussed here, chronic physical exercise resulted in increased BDNF in blood plasma of trained diabetic animals, which promoted significant improvement of the metabolic syndrome related to DM. This physiological condition with a good prognosis, possibly associated with the increase in this factor, could be verified by significant alterations in biochemical and hematological profiles that resulted in physiological improvement of the organism against harmful effects of diabetes mellitus.
Conclusion
In this study, chronic physical exercise was capable of increasing production and plasma concentration of BDNF in association with a reduction in hyperglycemia of trained diabetic animals in comparison to sedentary diabetic rats. This suggests an intertissue regulation of serum glucose homeostasis.
In addition, during chronic physical exercise, BDNF production correlated positively with improvement in body weight, plasma lipoprotein profile, and dyslipidemia. Hematological analyses demonstrated that exercise improved parameters of leukocytes in trained groups with increased production of this factor, which are essential for the immune response. Electrophoresis results demonstrated reduction in proinflammatory protein levels, reduction in lipoprotein fractions, and preservation of albumin in trained diabetic rats with greater concentration of plasma BDNF.
Considering the physiological improvements observed in this study, it is plausible to suggest that chronic physical exercise may act as a treatment for diabetes mellitus. In this manner, the increase in BDNF induced by the exercise is related to the better prognosis of systemic harmful effects of metabolic syndrome.
Hence, the increase in plasma BDNF induced by chronic physical exercise may help in controlling glycemia in diabetic patients. The intensity exercise may bring concrete benefits in cardiovascular dysfunctions caused by diabetes in humans and rodents. However, there are scarce studies aimed to comprehend how chronic physical exercise may result in specific molecular response in the cardiovascular system or other systems, such as CNS, in hyperglycemic situations. Therefore, the effect of molecular response in each system may be investigated in a specific manner aiming to describe direct and indirect effects of BDNF in improvement of metabolic syndrome complications caused by diabetes mellitus. This conduct could help in developing drug-free therapies based on physical exercise aimed at promoting production of this factor according to metabolic dysfunctions of patients.
Abbreviations
BS, brain stroke; BDNF, brain-derived neurotrophic factor; BMI, body mass index; DK, diabetic ketoacidosis; CBB, Coomassie brilliant blue; CEUA, Ethics Committee for the Use of Animals; MCHC, mean corpuscular hemoglobin concentration; DM, diabetes mellitus; DM1, type 1 diabetes mellitus; DM2, type 2 diabetes mellitus; EDTA, ethylenediaminetetra-acetic acid; GTT, glucose tolerance test; MCH, mean corpuscular hemoglobin; HDL-C, high density lipoprotein; LDL-C, low density lipoprotein; PKA, protein kinase; RDW, red cell distribution width; STZ, streptozotocin; GOT, glutamic oxaloacetic transaminase; GPT, glutamic pyruvic transaminase; MST, maximum speed test; MCV, mean corpuscular volume; VLDL-C, very low density lipoprotein; MPV, mean platelet volume.
Acknowledgments
We are grateful to Mr. Isaac Neto Goes da Silva for providing our analyses at the veterinary clinical analysis laboratory, VETTINGS, Veterinary Medicine School at State University of Ceará.
Disclosure
The authors report no conflicts of interest in this work.
References
1. International Diabetes Federation (IDF). IDF Diabetes Atlas.
2. DeBoer MD, Filipp SL, Gurka MJ. Use of a metabolic syndrome severity Z score to track risk during treatment of prediabetes: an analysis of the diabetes prevention program. Diabetes Care. 2018;41(11):2421–2430. doi:10.2337/dc18-1079
3. Alfawaz HA, Wani K, Alnaami AM, et al. Effects of different dietary and lifestyle modification therapies on metabolic syndrome in prediabetic arab patients: a 12-month longitudinal study. Nutrients. 2018;10(3):383. doi:10.3390/nu10030383
4. Sociedade brasileira de diabetes. Posicionamento Oficial SBD, SBPC-ML, SBEM e FENAD;2017/2018.
5. Farinha JB, Dos Santos GC, Vargas JLF, et al. Capillary glycaemia responses to strength exercises performed before or after high-intensity interval exercise in Type 1 diabetes under real-life settings. Complement Ther Med. 2018;40:116–119. doi:10.1016/j.ctim.2018.08.004
6. Walsh JJ, D’Angiulli A, Cameron JD, et al. Changes in the brain-derived neurotrophic factor are associated with improvements in diabetes risk factors after exercise training in adolescents with obesity: the HEARTY randomized controlled trial. Neural Plast. 2018;30:7169583.
7. Bathina S, Das UN. Dysregulation of PI3K-Akt-mTOR pathway in brain of streptozotocin-induced type 2 diabetes mellitus in Wistar rats. Lipids Health Dis. 2018;17(1):168. doi:10.1186/s12944-018-0809-2
8. Ferreira-da-Silva FW, Silva-Alves KS, Lemos-dos-Santos M, et al. n5-STZ diabetic model develops alterations in sciatic nerve and dorsal root ganglia neurons of wistar rats. ISRN Endocrinol. 2013;2013:1–13. doi:10.1155/2013/638028
9. Lima TL, Monteiro IC, Samuel Valença S, et al. Effect of exercise training on liver antioxidant enzymes in STZ-diabetic rats. Life Sci. 2015;128:64–71. doi:10.1016/j.lfs.2015.01.031
10. Teixeira PSA, Monteiro IC, Lima TL, et al. Prescription of aerobic exercise training based on the incremental load test: a model of anaerobic threshold for rats. J Exerc Physiol Online. 2012;15:47–52.
11. Facundo R, Espinosa CLF, Martinez CGA, et al. Toxicity, distribution, and accumulation of silver nanoparticles in Wistar rats. J Nanopart Res. 2013;15:1702.
12. Luciano E, Mello MA. Atividade física e metabolismo de proteínas em músculo de ratos diabéticos experimentais. Rev Paul Educ Fi´s. 1998;2:202–209. doi:10.11606/issn.2594-5904.rpef.1998.139561
13. Li B, Lang N, Cheng ZF. Serum levels of brain-derived neurotrophic factor are associated with diabetes risk, complications, and obesity: a cohort study from Chinese patients with type 2 diabetes. MolNeurobiol. 2016;53(8):5492–5499.
14. Meek TH, Wisse BE, Thaler JP, et al. BDNF action in the brain attenuates diabetic hyperglycemia via insulin-independent inhibition of hepatic glucose production. Diabetes. 2013;62(5):1512–1518. doi:10.2337/db12-0837
15. Li Y, Xu F, Xiao H, et al. Long noncoding RNA BDNF-AS inversely regulated BDNF and modulated high-glucose induced apoptosis in human retinal pigment epithelial cells. J Cell Biochem. 2018;119(1):817–823. doi:10.1002/jcb.26245
16. Huang L, Yan S, Luo L, et al. Irisin regulates the expression of BDNF and glycometabolism in diabetic rats. Mol Med Rep. 2019;19(2):1074–1082. doi:10.3892/mmr.2018.9743
17. Zhong Y, Zhu Y, He T, et al. Brain-derived neurotrophic factor inhibits hyperglycemia-induced apoptosis and downregulation of synaptic plasticity-related proteins in hippocampal neurons via the PI3K/Akt pathway. Int J Mol Med. 2019;43(1):294–304.
18. Bente KP. Physical activity and muscle–brain crosstalk. Nat Rev Endocrinol. 2019;15:383–392. doi:10.1038/s41574-019-0174-x
19. Fan J, Liu Y, Yin S, et al. Small dense LDL cholesterol is associated with metabolic syndrome traits independently of obesity and inflammation. Nutr Metab (Lond). 2019;16:7. doi:10.1186/s12986-019-0334-y
20. Palmer MK, Toth PP. Trends in lipids, obesity, metabolic syndrome, and diabetes mellitus in the United States: an NHANES analysis (2003–2004 to 2013–2014). Obesity. 2019;2:309–314. doi:10.1002/oby.22370
21. Banitalebi E, Kazemi A, Faramarzi M, et al. Effects of sprint interval or combined aerobic and resistance training on myokines in overweight women with type 2 diabetes: a randomized controlled trial. Life Sci. 2019;217:101–109. doi:10.1016/j.lfs.2018.11.062
22. Zembron-Lacny A, Dziubek W, Rynkiewicz M, et al. Peripheral brain-derived neurotrophic factor is related to cardiovascular risk factors in active and inactive elderly men. Braz J Med Biol Res. 2016;49(7). doi:10.1590/1414-431x20165253.
23. Lawrence YA, Steiner JM. Laboratory evaluation of the liver. Vet Clin North Am Small Anim Pract. 2017;47:539–553. doi:10.1016/j.cvsm.2016.11.005
24. Kantartzis K, Fritsche L, Bombrich M, et al. Effects of resveratrol supplementation on liver fat content in overweight and insulin-resistant subjects: a randomized, double-blind, placebo-controlled clinical trial. Diabetes Obes Metab. 2018;20(7):1793–1797. doi:10.1111/dom.2018.20.issue-7
25. O’Neill S, Larsen MB, Gregersen S, et al. miR-758-3p: a blood-based biomarker that’s influence on the expression of CERP/ABCA1 may contribute to the progression of obesity to metabolic syndrome. Oncotarget. 2018;9:9379–9390. doi:10.18632/oncotarget.24314
26. Perry RA, Brown LA, Lee DE, et al. Differential effects of leucine supplementation in young and aged mice at the onset of skeletal muscle regeneration. Mech Ageing Dev. 2016;157:7–16. doi:10.1016/j.mad.2016.05.007
27. Shimomura R, Nezu T, Hosomi N, et al. Alpha-2-macroglobulin as a promising biological marker of endothelial function. J Atheroscler Thromb. 2018;25(4):350–358. doi:10.5551/jat.41335
28. Kim M, Cai Q, Oh Y. Therapeutic potential of alpha-1 antitrypsin in human disease. Ann Pediatr Endocrinol Metab. 2018;23(3):131–135. doi:10.6065/apem.2018.23.3.131
29. Li J, Zhang LM, Huang X. Urinary albumin, immunoglobulin G and Beta-microglobulin in the diagnosis of diabetes in the elderly. J Biol Regul Homeost Agents. 2017;2:395–398.
30. Borné Y, Muhammad IF, Lorés-Motta L, et al. Complement C3 associates with incidence of diabetes, but no evidence of a causal relationship. J Clin Endocrinol Metab. 2017;102(12):4477–4485. doi:10.1210/jc.2017-00948
31. Mariete BM, Douglas SF, Kalil CF, et al. Investigação da supressão de fluorescência de soro albumina bovina e humana por complexo de rutênio. Quim. 2015;38:227–232.
32. Dong Y, Wang P, Dai Z, et al. Increased self-care activities and glycemic control rate in relation to health education via wechat among diabetes patients: a randomized clinical trial. Medicine (Baltimore). 2018;97(50):e13632. doi:10.1097/MD.0000000000013632
33. Mohorko N, Černelič-Bizjak M, Poklar-Vatovec T, et al. Weight loss, improved physical performance, cognitive function, eating behavior, and metabolic profile in a 12-week ketogenic diet in obese adults. Nutr Res. 2019;62:64–77. doi:10.1016/j.nutres.2018.11.007
34. Gustafson MP, DiCostanzo AC, Wheatley CM, et al. A systems biology approach to investigating the influence of exercise and fitness on the composition of leukocytes in peripheral blood. J Immunother Cancer. 2017;5:30. doi:10.1186/s40425-017-0231-8
35. Annibalini G, Lucertini F, Agostini D, et al. Concurrent aerobic and resistance training has anti-inflammatory effects and increases both plasma and leukocyte levels of IGF-1 in late middle-aged type 2 diabetic patients. Oxid Med Cell Longev. 2017;2017:3937842. doi:10.1155/2017/3937842
36. Souza PRK, Ferreira SS, Nunes FPB, et al. Cytokine and adhesion molecule expression induced by different strains of Staphylococcus aureus in type 1 diabetic rats: role of insulin. Front Immunol. 2019;9:3165. doi:10.3389/fimmu.2018.03165
37. La Favor JD, Dubis GS, Yan H, et al. Microvascular endothelial dysfunction in sedentary, obese humans is mediated by NADPH Oxidase: influence of exercise training. Arterioscler Thromb Vasc Biol. 2016;36(12):2412–2420. doi:10.1161/ATVBAHA.116.308339
38. Kim BJ, Cho SH, Cho KI, et al. The combined impact of neutrophil-to-lymphocyte ratio and type 2 diabetic mellitus on significant coronary artery disease and carotid artery atherosclerosis. J Cardiovasc Ultrasound. 2016;2:115–122. doi:10.4250/jcu.2016.24.2.115
39. Sellami M, Gasmi M, Denham J, et al. Effects of acute and chronic exercise on immunological parameters in the elderly aged: can physical activity counteract the effects of aging? Front Immunol. 2018;9:2187. doi:10.3389/fimmu.2018.02187
40. Azoulay D, Herishanu Y, Shapiro M, et al. Elevated serum BDNF levels are associated with favorable outcome in CLL patients: possible link to CXCR4 downregulation. Exp Hematol. 2018;63:17–21. doi:10.1016/j.exphem.2018.04.005
41. Restell TI, Porfirio LC, Souza AS, et al. Hematology of Swiss mice (Mus musculus) of both genders and different ages. Acta Cir Bras. 2014;5:306–312. doi:10.1590/S0102-86502014000500004
42. Miller GD, Teramoto M, Smeal SJ, et al. Assessing serum albumin concentration following exercise-induced fluid shifts in the context of the athlete biological passport. Drug Test Anal. 2019;6:782–791. doi:10.1002/dta.v11.6
43. Montero D, Lundby C. Regulation of red blood cell volume with exercise training. Compr Physiol. 2018;9:149–164.
44. Khorasani V, Jeddi S, Yaghmaei P, et al. Effect of long-term sodium nitrate administration on diabetes-induced anemia and glucose homeostasis in obese type 2 diabetic male rats. Nitric Oxide. 2019;86:21–30. doi:10.1016/j.niox.2019.02.003
45. Bastida JM, López-Godino O, Vicente-Sánchez A, et al. Hidden myelodysplastic syndrome (MDS): a prospective study to confirm or exclude MDS in patients with anemia of uncertain etiology. Int J Lab Hematol. 2019;4:109–117. doi:10.1111/ijlh.12933
46. Garg N, Kotru M, Yadav A, et al. Serum ferritin <70 μg/L predicts functional iron deficiency in patients with chronic kidney disease. Saudi J Kidney Dis Transpl. 2018;29:1035–1041. doi:10.4103/1319-2442.243956
 © 2020 The Author(s). This work is published and licensed by Dove Medical Press Limited. The
full terms of this license are available at https://www.dovepress.com/terms
and incorporate the Creative Commons Attribution
- Non Commercial (unported, 3.0) License.
By accessing the work you hereby accept the Terms. Non-commercial uses of the work are permitted
without any further permission from Dove Medical Press Limited, provided the work is properly
attributed. For permission for commercial use of this work, please see paragraphs 4.2 and 5 of our Terms.
© 2020 The Author(s). This work is published and licensed by Dove Medical Press Limited. The
full terms of this license are available at https://www.dovepress.com/terms
and incorporate the Creative Commons Attribution
- Non Commercial (unported, 3.0) License.
By accessing the work you hereby accept the Terms. Non-commercial uses of the work are permitted
without any further permission from Dove Medical Press Limited, provided the work is properly
attributed. For permission for commercial use of this work, please see paragraphs 4.2 and 5 of our Terms.