Back to Journals » ClinicoEconomics and Outcomes Research » Volume 13
Evaluating Treatment Patterns, Relapses, Healthcare Resource Utilization, and Costs Associated with Disease-Modifying Treatments for Multiple Sclerosis in DMT-Naïve Patients
Authors Freeman L, Kee A, Tian M, Mehta R
Received 27 October 2020
Accepted for publication 27 December 2020
Published 22 January 2021 Volume 2021:13 Pages 65—75
DOI https://doi.org/10.2147/CEOR.S288296
Checked for plagiarism Yes
Review by Single anonymous peer review
Peer reviewer comments 3
Editor who approved publication: Professor Samer Hamidi
Leorah Freeman,1 Arianna Kee,2 Marc Tian,2 Rina Mehta2
1Dell Medical School, The University of Texas at Austin, TX, USA; 2Bristol Myers Squibb, Princeton, NJ, USA
Correspondence: Leorah Freeman
Health Discovery Building, Dell Medical School, The University of Texas at Austin, 1601 Trinity Street, Austin, TX 78701, USA
Tel + 1-512-495-5355
Email [email protected]
Purpose: Early diagnosis and treatment of multiple sclerosis (MS) with disease-modifying therapy (DMT) can reduce relapse number and severity, which has cost implications. We describe treatment patterns, healthcare utilization, and cost among MS patients newly initiating DMTs (index).
Patients and Methods: DMT-naïve adults with 12 months’ continuous enrollment pre- and post-index and ≥ 2 MS claims (2009‒2018) were identified from the Optum Clinformatics Data Mart database. Treatment adherence and persistence were measured as time on index DMT. Relapses were identified using a validated claims-based algorithm. All-cause and MS-related healthcare expenditures and utilization were captured pre- and post-index. Outcomes were stratified by route of administration. Multivariate analyses assessed differences in outcomes and costs.
Results: The analysis included 5906 MS patients (mean age, 46.6 years). The majority initiated injectable (63.5%) followed by oral (28.8%) and infusion (7.7%) DMTs. Post-index, 45.3% of patients were nonadherent and 39.4% were nonpersistent. Relapse rates decreased from pre- to post-index (oral: 24.3%‒16.1%; injectable: 25.0%‒17.1%; infusion: 29.3%‒15.5%). Post-index mean (SD) all-cause total costs were lowest with oral ($70,970 [$36,681]) vs injectable ($82,521 [$58,569]) and infusion ($80,871 [$49,627]) DMTs. MS-related total costs were lowest with oral ($65,149 [$65,133]) vs injectable ($76,197 [$60,204]) and infusion ($72,703 [$47,287]) DMTs. Multivariate analysis showed no differences between oral and injectable DMTs in adherence, persistence, or relapse rate; however, oral DMTs had significantly lower all-cause and MS-related costs.
Conclusion: With similar outcomes across DMT administration routes, initiating the least costly DMT may be warranted for many patients. In newly treated MS patients, the need exists to improve adherence and persistence.
Keywords: administrative claims, healthcare costs, treatment adherence and compliance, drug administration routes
Introduction
Multiple sclerosis (MS) is a chronic, inflammatory disease of the central nervous system.1 MS has a mean age of onset of approximately 30 years and is the most common progressive neurologic disease among young adults worldwide.1,2 MS affects an estimated 900,000 individuals in the United States.2 Studies show that its prevalence has increased steadily over the past 5 decades and is 2 to 3 times higher among women than men.1,2
MS is characterized by the demyelination of axons and other injury to the brain, optic nerve, and spinal cord.1,3 Relapsing-remitting MS, the most common (80%–90%) MS phenotype, is characterized by alternating periods of disease relapse and remission.1,4,5 During relapses, patients experience temporary exacerbations of neurologic signs or symptoms.4 Relapses can result in the incomplete recovery of function and permanent disability, especially when occurring early in the course of MS.3,6,7 MS causes a high level of disability and impaired quality of life (QOL).1
Furthermore, MS is associated with substantial costs, both for society and patients.1,6 The total annual cost of MS was estimated by the National Multiple Sclerosis Society to be $28 billion in the United States,8 with a lifetime cost per patient of $4 million (2010 USD).9 After congestive heart failure, MS ranks as the chronic condition with the second-highest all-cause direct medical costs.9 Not surprisingly, the cost of managing MS increases with higher disease severity as disability progresses.1,9
While MS is incurable, multiple treatment options, including disease-modifying therapies (DMTs), reduce relapse rates and slow the progression of disability.10,11 These DMTs vary in mechanisms of action, efficacy, dosing schedules, routes of administration, tolerability, and safety profiles, which are all considerations when selecting a treatment course.11,12 For a DMT to provide full efficacy, patients must adhere to therapy; however, research shows that one-third of patients do not adhere to their prescribed regimen and up to 40% stop using DMTs within 1 year of initiating treatment.12,13 Treatment nonadherence correlates with reduced effectiveness, increased relapse, a decline in overall health, and higher healthcare costs.12,13 Additionally, route of administration may influence treatment adherence and patient satisfaction.14,15
Early diagnosis and treatment with a DMT can reduce the number and severity of relapses and substantially improve patient QOL.1,10,16 In addition, relapse is associated with increased healthcare resource utilization (HCRU) and expenditures.6,17 Consequently, it is possible that early diagnosis and treatment with DMTs may reduce the cost burden for both patients and society. Thus, given the growing prevalence of MS2 and the ongoing development of new DMTs,16 it is important to reassess MS treatment costs, HCRU, and treatment patterns (eg, adherence, persistence). This study uses real-world evidence to describe DMT treatment patterns, rates of relapse, cost, and HCRU in a treatment-naïve patient population with MS stratified by route of administration.
Patients and Methods
Study Design and Data Source
This retrospective, observational cohort study used administrative claims data from the Optum Clinformatics Data Mart database, which includes claims for both commercial and Medicare Advantage health plans. The database population includes 15 to 18 million annual covered lives in all 50 states. The Optum database includes only data for patients who have both medical and prescription drug coverage.
Captured data include standard pricing for all medical claims, pharmacy claims, and inpatient confinements. Optum’s standard pricing algorithms estimate the allowed payment amounts (ie, insurance plus patient payment) across all services and account for the following factors: quantity of services, relative resource costs, and the nature of HCRU. Inpatient facility pricing was determined using the estimated per diem cost based on aggregated diagnostic categories and hospitalization length. Outpatient facility pricing was based on revenue codes and a percentage of reimbursement requested from the healthcare provider. Professional and ancillary services pricing was estimated using a resource-based value scale that monetizes Centers for Medicare and Medicaid Services relative value units. Pharmacy costs were based on pricing from the First Databank (an integrated drug and medical device database, including drug pricing information for US Food and Drug Administration [FDA]-approved prescription drugs) and were adjusted according to therapeutic category.
Study Period and Study Population
The study period was January 1, 2009, to September 30, 2018, and comprised a patient selection period (January 1, 2010, to September 30, 2017), a 12-month pre-index period, and a 12-month post-index period (Figure 1). The index date was the date of the first claim for DMT between January 1, 2010, and September 30, 2017.
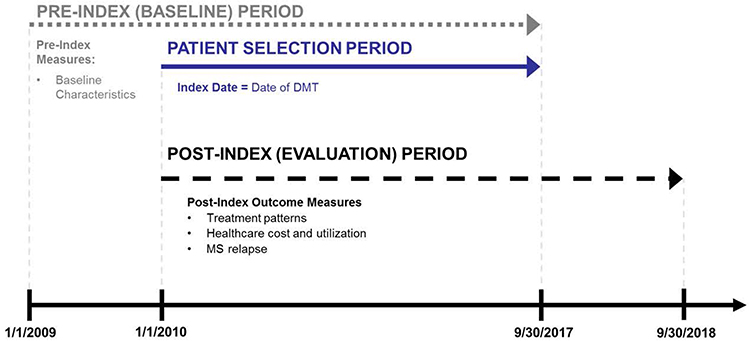 |
Figure 1 Study periods. Abbreviations: DMT, disease-modifying therapy; MS, multiple sclerosis. |
Adult patients (aged ≥18 years on the index date) were included if they had ≥2 nondiagnostic claims (1–365 days apart) for MS (ICD-9-CM code 340 or ICD-10-CM code G35) and initiated treatment with a DMT (index event) for MS between January 1, 2010, and September 30, 2017. Patients were required to be continuously covered by a healthcare insurance plan for ≥12 months prior to and after the index date. Claims for the following DMTs were included: oral DMT (teriflunomide, fingolimod, and dimethyl fumarate); injectable DMT (interferon beta-1a, interferon beta-1b, glatiramer acetate, and peginterferon beta-1a); and infusion DMT (alemtuzumab, mitoxantrone, natalizumab, and ocrelizumab). Patients were excluded if there was evidence of pregnancy or a primary malignancy during the 12-month pre- or post-index period. Patients were also excluded for known use of any DMT prior to the index date.
Outcomes
Treatment patterns, adherence, persistence, and time to nonpersistence were reported for the index DMT. Adherence was measured as the proportion of days covered (PDC) with the index DMT during the 12-month post-index period. A PDC ≥0.8 (or 80%) was the threshold for adherence. Persistence on the index DMT was defined as the number of days from the index date until the earliest of the following occurred: treatment discontinuation, a DMT switch, or the end of the 12-month post-index period (ie, nonpersistence). Treatment discontinuation was defined as a gap of ≥60 days without the index DMT after exhausting the current supply.18 For claims based off of Healthcare Common Procedure Coding System codes (which can identify medications based on route of administration), the duration of clinical benefit was used as a proxy for days supplied. Patients who had a fill for a DMT different from the index DMT were classified as switching treatment, with the switch date set to the fill date of the new DMT. A switch to a generic equivalent was not flagged as a treatment change. Time to nonpersistence (a measure of the duration of therapy) was defined as the time from the index date until the date of nonpersistence. DMT treatment patterns (adherence, persistence, and switch) were assessed at 3 and 6 months post-index.
Relapse was identified using a validated claims-based algorithm19,20 and was defined as either a claim for an MS-related inpatient stay (with ICD-9-CM 340 or ICD-10-CM G35 as the primary diagnosis) or a claim with an MS diagnosis code in the primary or secondary position in an outpatient setting in addition to a pharmacy or medical claim for a qualifying corticosteroid or adrenocorticotropic hormone on or within 7 days of the visit. Relapse-related measures evaluated included the percentage of patients with a relapse and the number of relapses observed. Relapse rates were reported as proportion of patients with a relapse, number of relapses observed (0, 1, 2, or ≥3 relapses), and time to first relapse (calculated as the number of days from the index date to the earliest occurrence of a relapse).
Direct healthcare costs consisted of all-cause and MS-related healthcare expenditures for all patients. Healthcare costs were based on amounts paid on adjudicated claims, including insurer and health plan payments, as well as patient cost-sharing in the form of copayments, deductibles, and coinsurance. These costs were measured in the 12-month pre-index and 12-month post-index periods. Healthcare costs were reported as total expenditures, inpatient expenditures, emergency department (ED) expenditures, outpatient medical expenditures, and outpatient pharmacy expenditures. Costs were adjusted to 2017 USD.
All-cause and MS-related HCRU were analyzed for all patients and for patients with ≥1 service during the 12-month pre-index and 12-month post-index periods. HCRU outcomes included inpatient admissions, ED visits, outpatient office visits, and outpatient prescriptions. Inpatient admissions were reported as the percentage of patients with inpatient admissions, the number of inpatient admissions, and the average length of inpatient stay (LOS). ED visits were reported as the percentage of patients with any ED visit and the number of ED visits. Outpatient office visits were reported as the percentage of patients with an office visit to a neurologist, primary care provider, physical therapist, occupational therapist, speech therapist, or other clinician. Outpatient prescriptions were reported as the number of outpatient prescriptions, by medication category.
Statistical Analysis
Patients were stratified by DMT route of administration. Patient characteristics and outcomes were summarized using descriptive statistics. Continuous variables were summarized using means and standard deviations (SDs), and categorical variables were presented as number counts and percentage of patients in each category.
Logistic regression was used to examine the odds of post-index persistence, adherence, and relapse. A gamma model with log link function was used to examine post-index all-cause and MS-specific healthcare costs. All models were adjusted for select patient characteristics, including the initial DMT route of administration, baseline relapses, age (by decade), sex, index year, geographic region of residence, select comorbidities (depression, hyperlipidemia, hypertension, fatigue, and neuropathic pain), and baseline medications (antispasmodics, nonsteroidal anti-inflammatory drugs [NSAIDs] or cyclooxygenase-2 [COX-2] inhibitors, neuropathic pain medications, and opioids). For cost models only, pre-index all-cause healthcare costs were also controlled. Data are presented as odds ratio (OR) and 95% confidence intervals (CIs).
Results
Patient Selection and Baseline Characteristics
Of the 94,838 patients with MS identified in the database, 5906 met the inclusion criteria (Figure 2). The mean (SD) age of study participants was 46.6 (12.4) years, and the majority were female (74.2%) and white (67.0%) (Table 1). Most participants initiated an injectable DMT (63.5%), followed by oral (28.8%) and infusion (7.7%) DMTs. Demographic characteristics (with the exception of DMT index year) were consistent across routes of administration. Those who initiated infusion DMTs had the lowest Charlson Comorbidity Index scores and the highest rates of MS symptoms and comorbidities, such as bowel dysfunction, bladder dysfunction, dizziness/vertigo, and gait/motility difficulties (Table 2). During the pre-index period, opioids (39.4%), NSAIDs/COX-2 inhibitors (25.5%), and benzodiazepines (22.2%) were the most commonly used concomitant medications (Figure S1 in Supplemental Material).
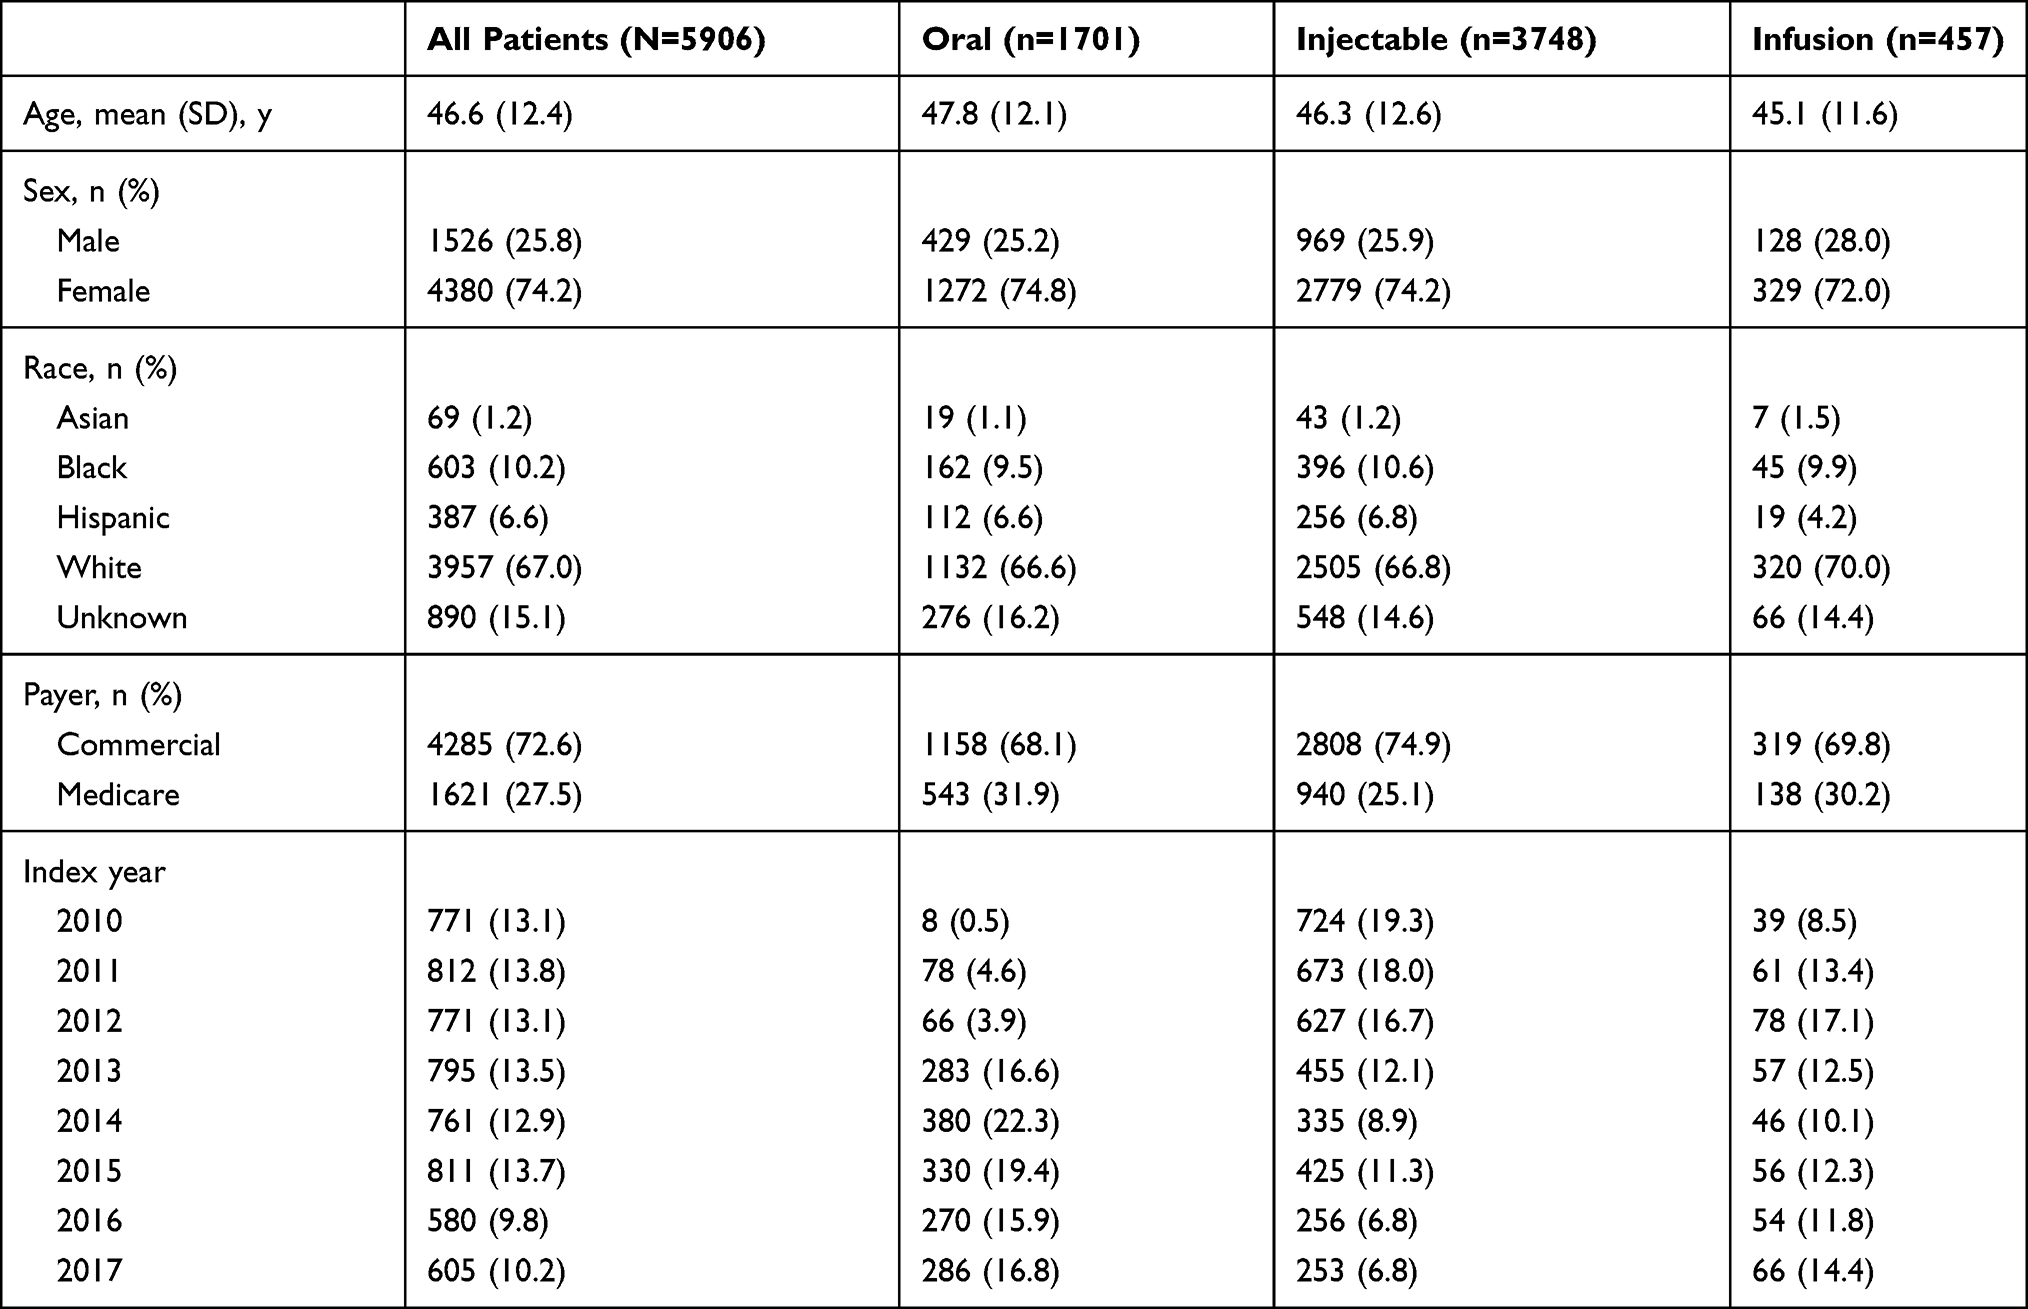 |
Table 1 Baseline Demographic Characteristics |
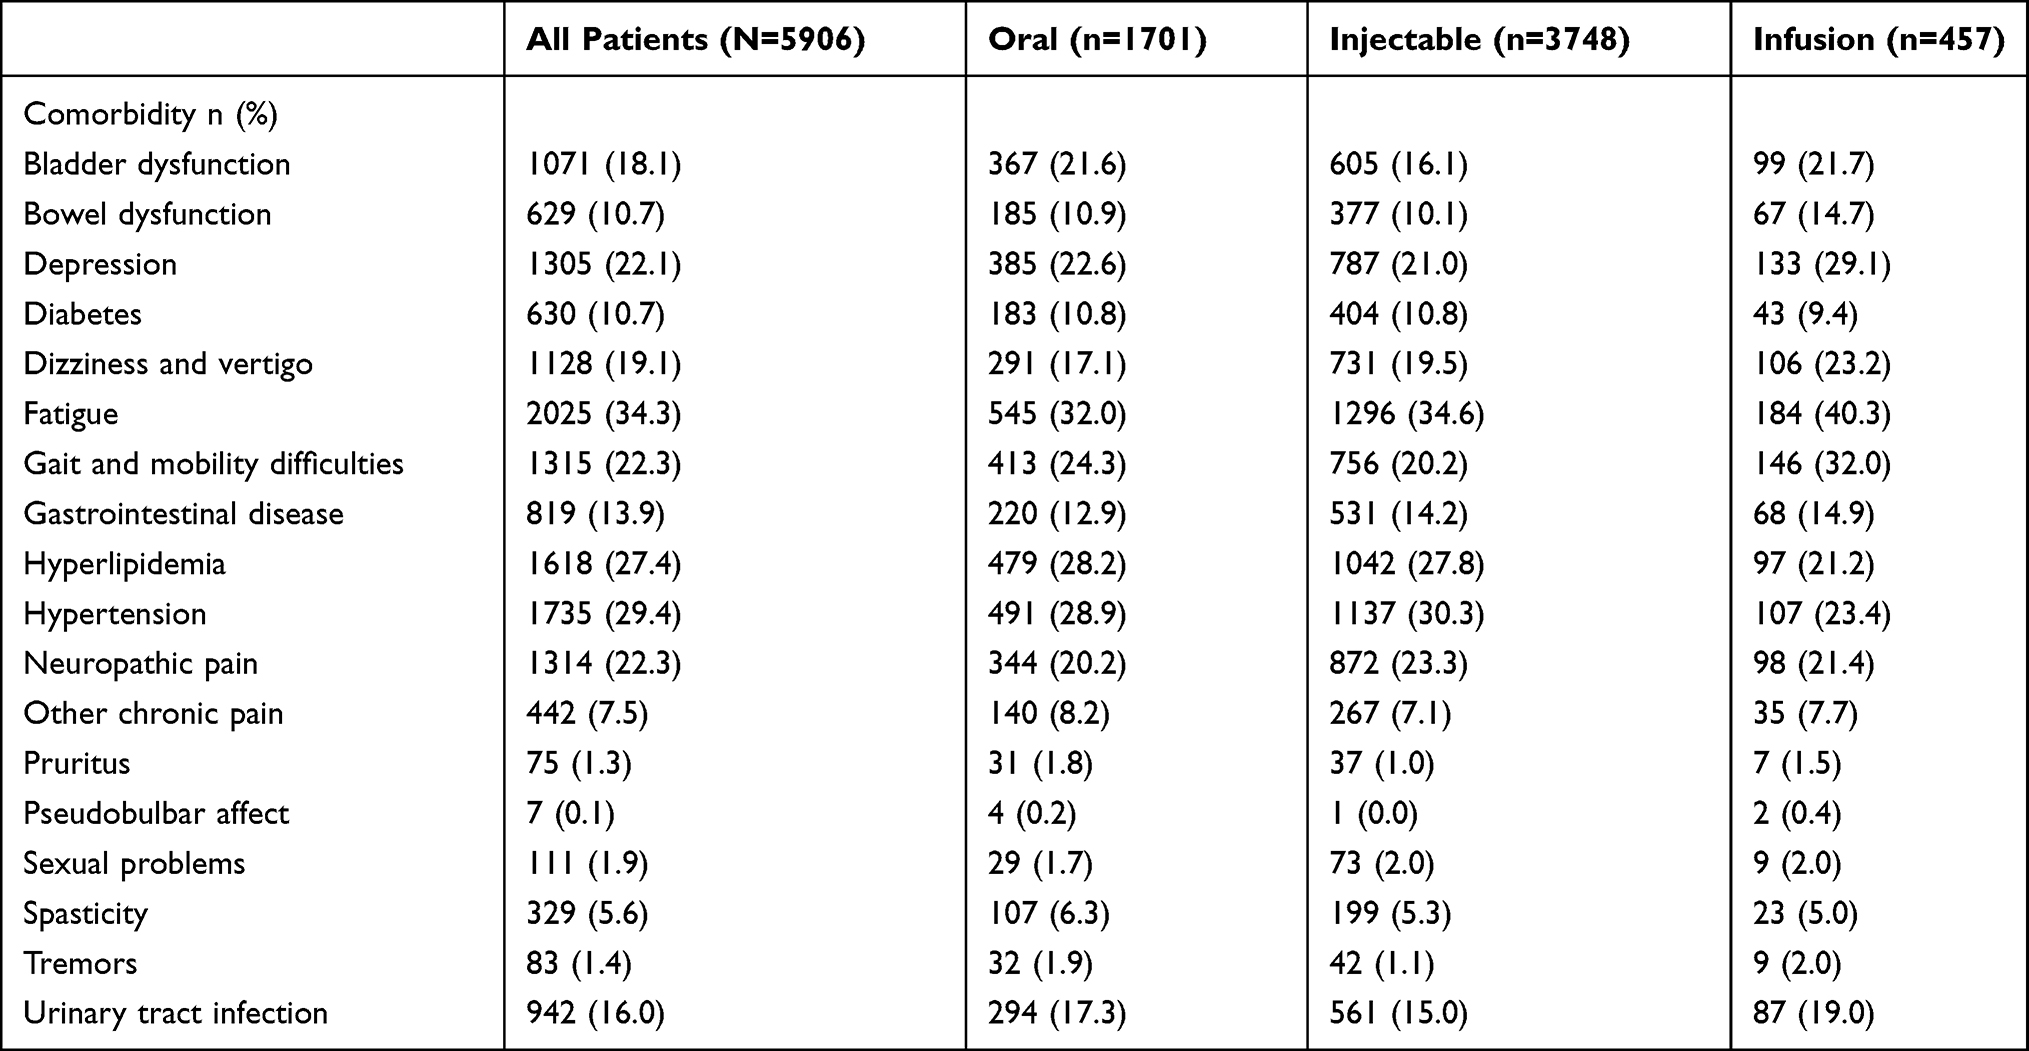 |
Table 2 Clinical Characteristics |
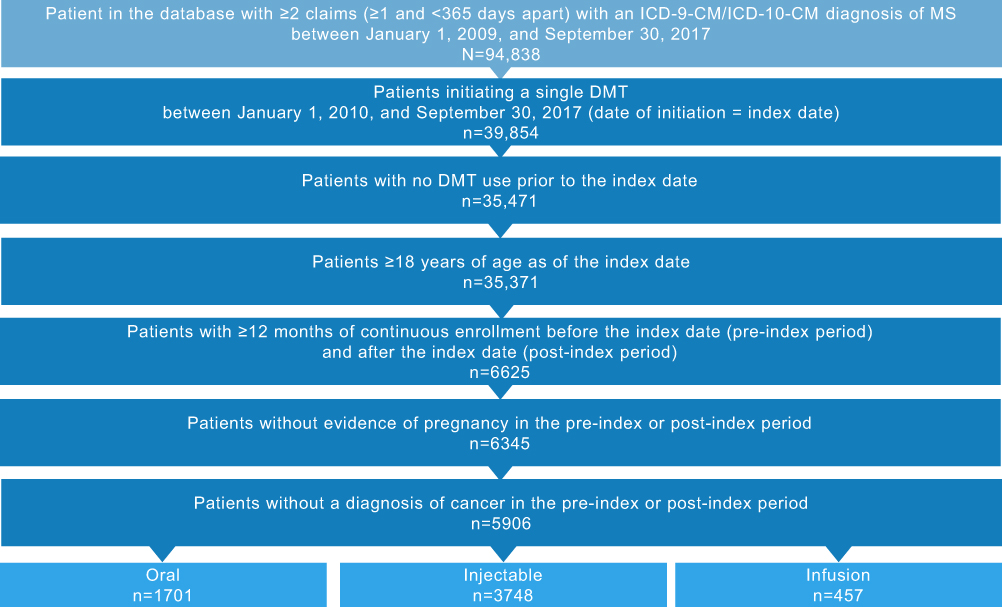 |
Figure 2 Patient disposition. Abbreviations: DMT, disease-modifying therapy; ICD-9-CM/ICD-10-CM, International Classification of Diseases, Ninth/Tenth Revision, Clinical Modification; MS, multiple sclerosis. |
Treatment Patterns
In the 12-month post-index period, 45.3% of patients were nonadherent (PDC <0.8), with an overall mean PDC of 0.7 (Figure S2A in Supplemental Material), and 39.4% were nonpersistent (Figure S2B in Supplemental Material). Mean PDC and rates of nonadherence and nonpersistence were consistent across DMT routes of administration. The mean (SD) time to nonpersistence was 133 (92) days for all patients, equivalent to <5 months. Time to nonpersistence was shortest for patients initiating oral DMTs (114 days), followed by infusion and injectable (128 and 142 days, respectively). A total of 90.6% of patients who were nonpersistent discontinued, and 9.5% switched to a different DMT, with discontinuation rates highest among patients initiating an infusion DMT (98.8%), followed by oral (94.5%) and injectable (87.7%) DMTs. Of the 2107 patients who discontinued, approximately half did not restart treatment (48.4%), and this trend was consistent across patients who initiated oral, injectable, and infusion treatment (50.8%, 47.2%, and 48.5%, respectively).
Relapse
The mean (SD) time to first relapse (days) was similar across all DMTs (156 [104]), oral DMTs (158 [103]), injectable DMTs (156 [105]), and infusion DMTs (151 [98]). Overall, the percentage of patients with no evidence of relapse increased from the pre- to the post-index period (74.9% to 83.3%) (Figure S3 in Supplemental Material). This trend was consistent across all administration routes. The proportion of patients who relapsed decreased from the pre- to the post-index periods in patients receiving oral (24.3% to 16.1%), injectable (25.0% to 17.1%), and infusion (29.3% to 15.5%) DMTs. Patients who were persistent with their prescribed regimen also exhibited greater percentage reductions in relapse rates than patients who were not nonpersistent (46.2% reduction vs 15.8% reduction). This trend was noted for persistent vs nonpersistent patients using oral DMTs (45.4% vs 17.4% reductions, respectively) and injectable DMTs (44.2% vs 15.0% reductions, respectively) and was somewhat more pronounced among persistent and nonpersistent patients using infusion DMTs (59.6% vs 17.5% reductions, respectively).
There was a slight decrease in the mean (SD) number of relapses in the pre- and post-index periods (0.3 [0.6] and 0.2 [0.6], respectively). There was a slight increase in the percentage of patients experiencing ≥2 relapses between the pre- and post-index periods (2.9%–4.1%). This percent change was greater for patients initiating injectable DMTs (65.9% increase) compared with oral (26.2% increase) or infusion (30.6% decrease) DMTs.
Direct Healthcare Costs
Mean all-cause healthcare costs increased across all routes of administration between the pre- and post-index periods; this was driven primarily by pharmacy costs (Table 3). The lowest mean increase in all-cause costs from pre- to post-index periods was seen with patients initiating an oral DMT ($53,122 [$36,988]). Similarly, mean (SD) all-cause healthcare costs in the post-index period were lowest for patients initiating oral DMTs ($70,970 [$36,681]), followed by infusion ($80,871 [$49,627]) and injectable ($82,521 [$58,569]) DMTs (Figure S4 in Supplemental Material).
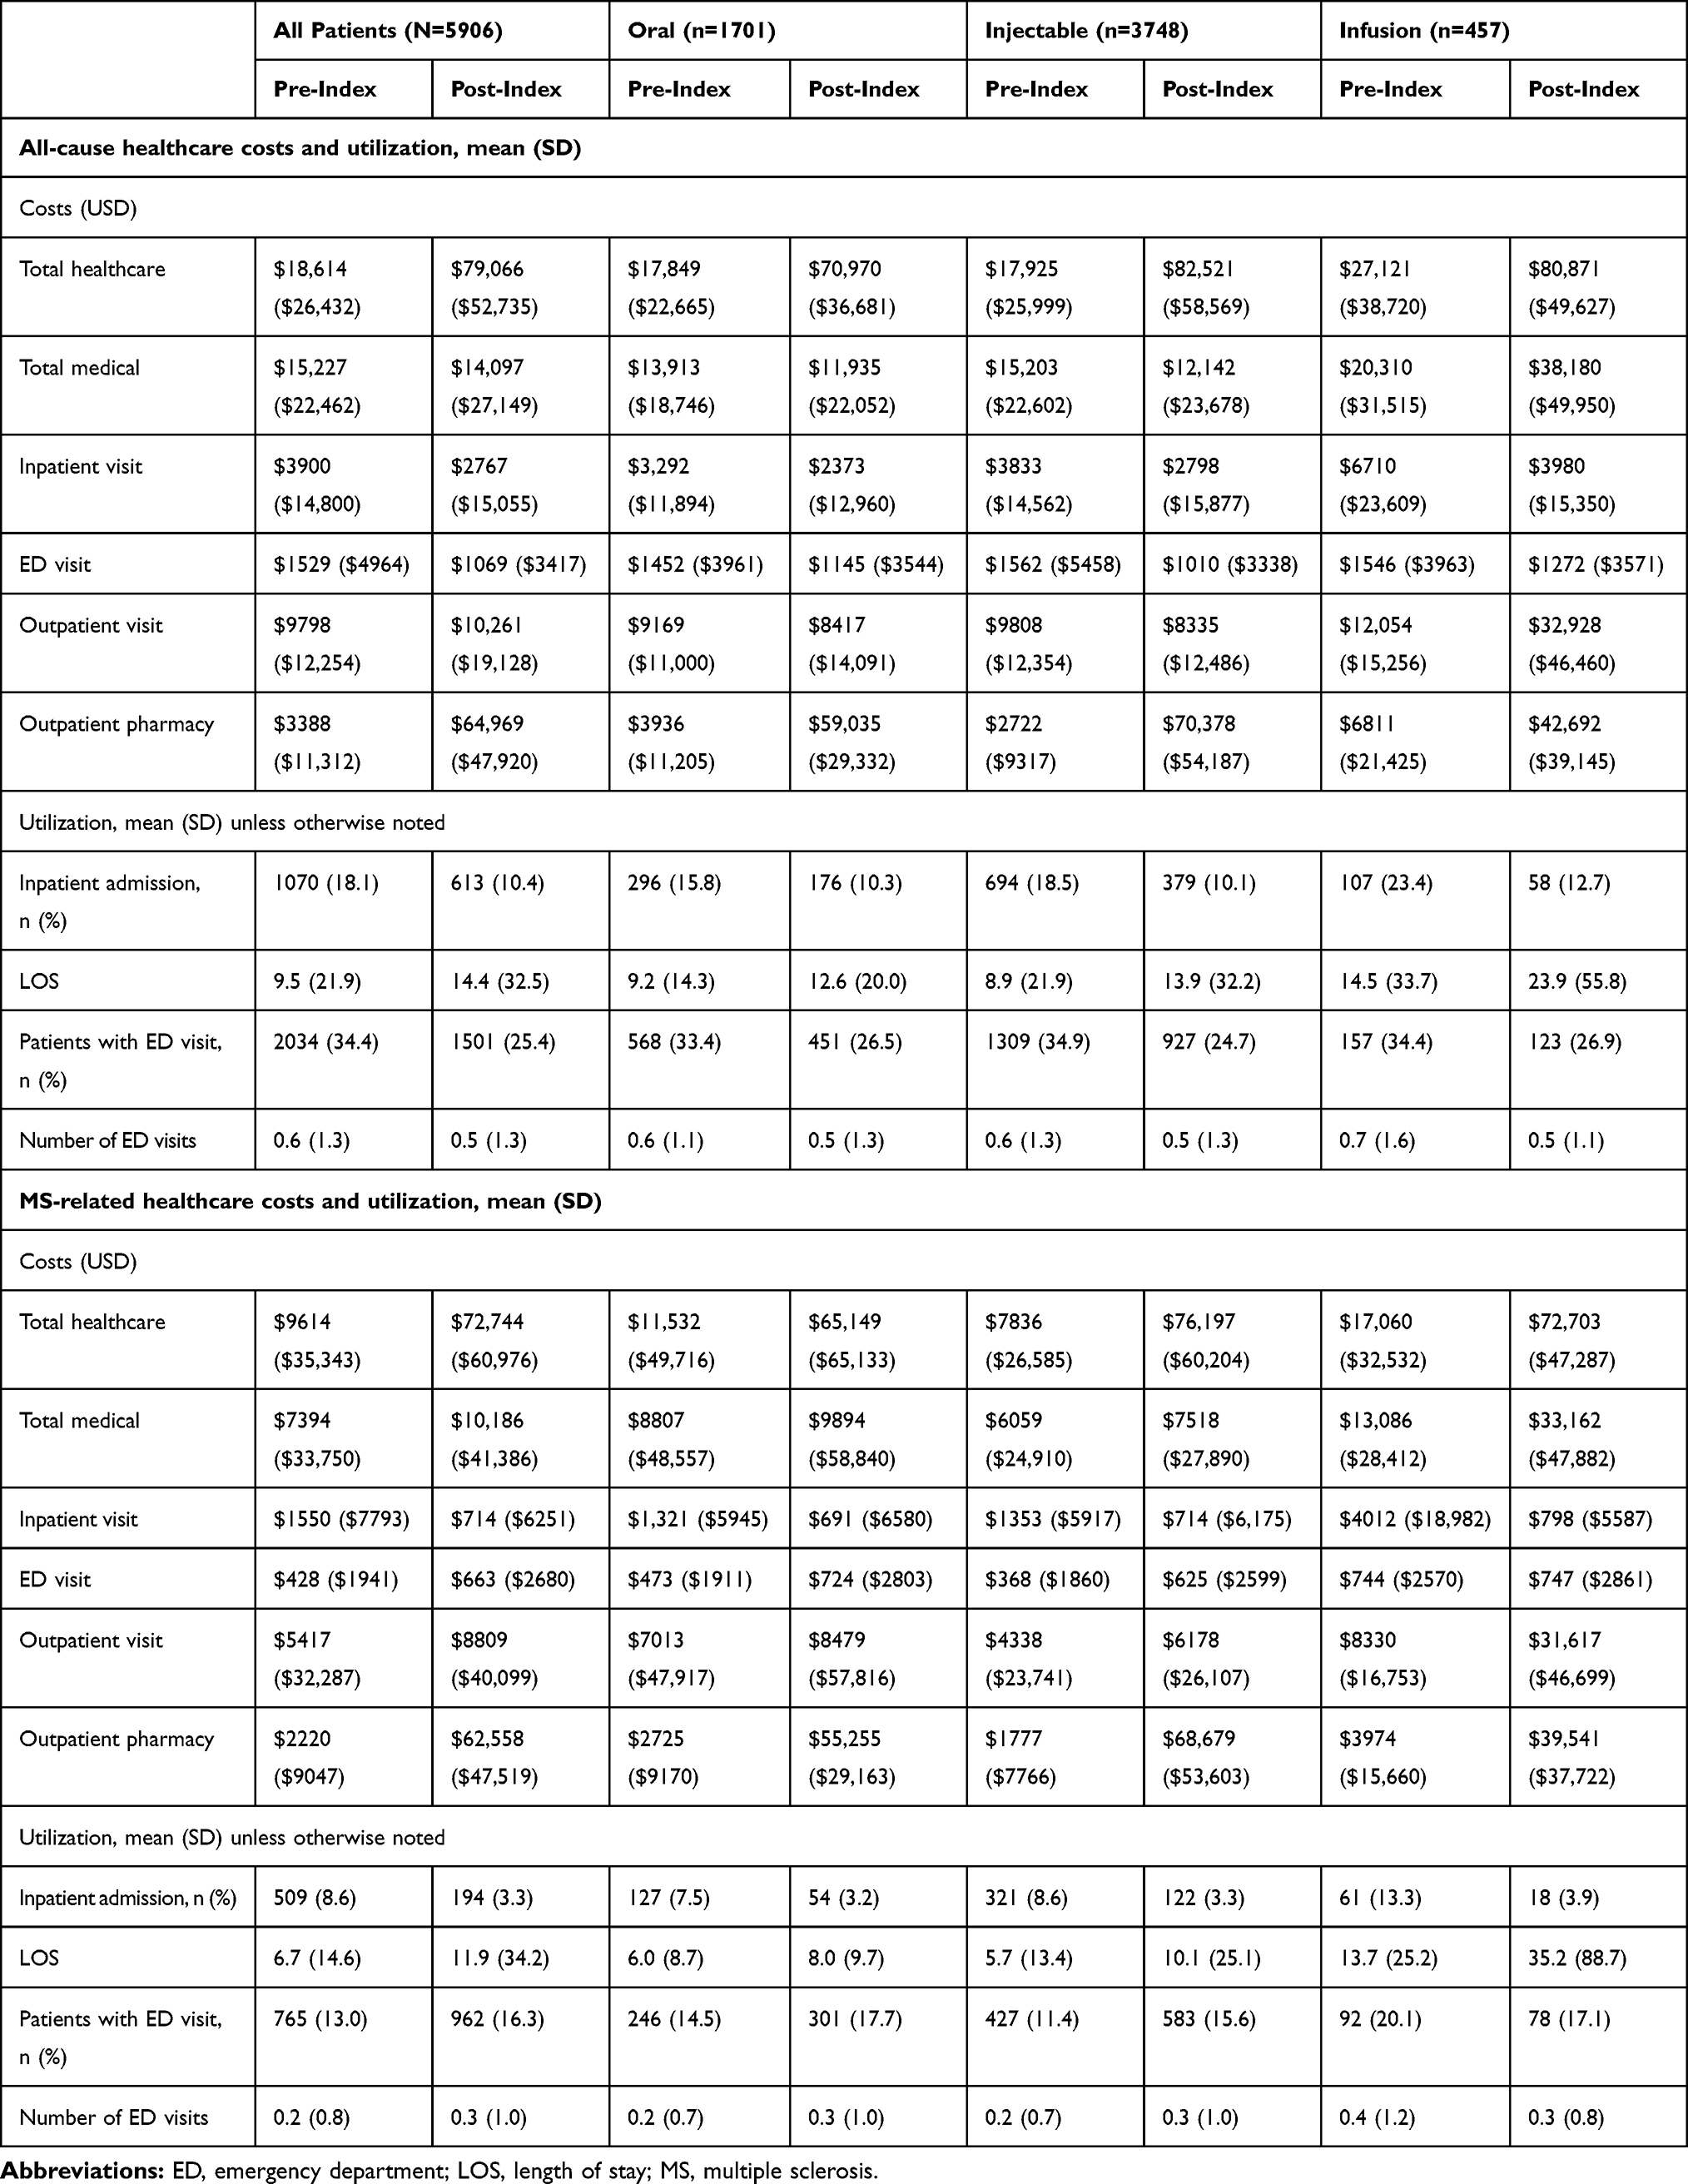 |
Table 3 All-Cause and MS-Related Healthcare Costs and Utilization in the 12-Month Pre- and Post-Index Periods |
Mean MS-related healthcare costs also increased for all administration routes between the pre- and post-index periods, driven primarily by pharmacy costs (Table 3). The smallest mean increase in MS-related healthcare costs from the pre- to the post-index period was seen for patients initiating oral DMTs ($53,618 [$40,767]). Similarly, mean MS-related healthcare costs in the post-index period were lowest for those initiating oral DMTs ($65,149 [$65,133]), followed by infusion ($72,703 [$47,287]) and injectable ($76,197 [$60,204]) DMTs (Figure S4 in Supplemental Material). The smallest mean (SD) change in MS-related medical costs from the pre- to the post-index period was seen among patients initiating oral DMTs ($1087 [$29,600]), followed by injectable ($1458 [$20,888]) DMTs, whereas those initiating infusion DMTs had the largest mean change ($20,076 [$49,785]). This MS-related medical cost increase was largely driven by a substantial increase from the pre- to the post-index period in mean (SD) MS-related outpatient visit costs for patients initiating infusion DMTs ($23,287 [$46,326]) compared with oral ($1466 [$27,498]) and injectable ($1840 [$18,201]) DMTs.
Healthcare Resource Utilization
Across all patients and routes of administration between the pre- and the post-index period, the proportion of patients with an all-cause inpatient admission decreased from 18.1% to 10.4% and the proportion of patients with ED visits decreased from 34.4% to 25.4%, but average inpatient LOS increased from 9.5 to 14.4 days (Table 3). Post-index, patients initiating oral DMTs had the shortest mean all-cause inpatient LOS (12.6 days) and the lowest mean increase from pre-index in LOS (3.4 days) compared with those initiating injectable (13.9 days; 5.0-day increase) or infusion (23.9 days; 9.4-day increase) DMTs.
There was an increase in MS-related ED visits for patients initiating DMTs with all routes of administration (all patients, 13.0% to 16.3%; oral, 14.5% to 17.7%; injectable, 11.4% to 15.6%) except for infusion (20.1% to 17.1%). Similar to all-cause-related inpatient admissions, the number of patients with an MS-related admission decreased from pre- to post-index (8.62% vs 3.28%, respectively), yet there was an increase in MS-related inpatient LOS for all routes of administration (all patients, 6.7 pre-index to 11.9 days post-index). Post-index, patients initiating an oral DMT had the shortest mean MS-related inpatient LOS (8.0 days) and the lowest mean increase from pre-index in LOS (2.0 days) compared with those initiating injectable (10.1 days; 4.4-day increase) or infusion (35.2 days; 21.5-day increase) DMTs.
Multivariate Analyses
The multivariate analyses showed no difference between injectable DMTs (reference) and oral DMTs in adherence (OR: 1.03; 95% CI: 0.90–1.17; P=0.6637) or persistence (OR: 1.07; 95% CI: 0.94–1.22; P=0.3017; Table 4). Similarly, no difference was found between injectable (reference) and oral DMTs in relapse rate (OR: 1.03; 95% CI: 0.86–1.23; P=0.7481). Compared with injectable DMTs, oral DMTs had significantly lower all-cause and MS-related costs (OR: 0.95, P=0.0040 and OR: 0.92, P=0.0001, respectively). No significant difference was found between infusion and injectable DMTs (reference) in adherence (OR: 1.15; 95% CI: 0.94–1.41; P=0.1634), persistence (OR: 1.19; 95% CI: 0.97–1.46; P=0.1008), or relapse rate (OR: 0.80; 95% CI: 0.60–1.06; P=0.1233). Likewise, no significant difference was found between injectable (reference) and infusion DMTs in all-cause costs (OR: 1.00; 95% CI: 0.95–1.06; P=0.8732) or MS-related costs (OR: 1.00; 95% CI: 0.94–1.07; P=0.8808).
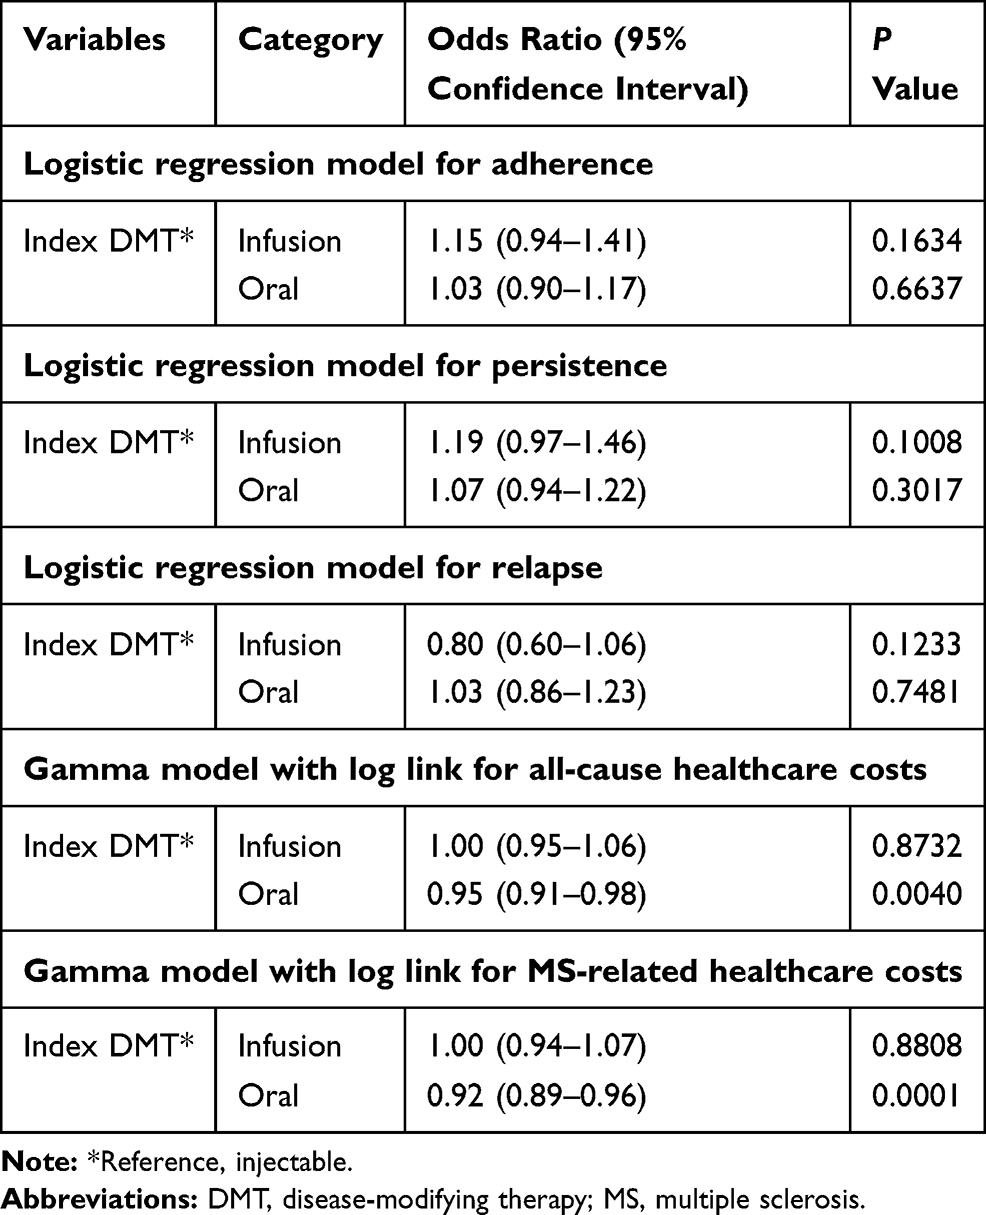 |
Table 4 Multivariate Analysis of Post-Index Outcomes |
Discussion
In this claims-based, retrospective, observational cohort study of patients with MS initiating DMT for the first time (during the study period), treatment nonadherence (45.3%), nonpersistence (39.4%), and discontinuation were common. On average, nonpersistence occurred within 5 months of treatment initiation. These trends were consistent across routes of administration. Among all patients, there was an increase in the percentage of relapse-free patients between the pre- and post-index periods (74.9% to 83.3%).
Mean all-cause and MS-related healthcare costs were substantially higher in the post-index than pre-index period. Outpatient pharmacy costs, both all-cause ($64,969) and MS-related ($62,558) costs, accounted for the majority of the total costs in the post-index period. Treatment with oral DMT incurred the lowest costs overall, for both all-cause ($70,970) and MS-related ($65,149) expenses. Cost drivers for injectable and infusion DMTs are likely attributable to outpatient pharmacy costs and outpatient visit costs, respectively. Oral DMT also showed the lowest mean cost increases (all cause, $53,122; MS-related, $53,618) between the pre- and post-index periods. Compared with injectable DMTs, oral DMTs incurred significantly lower costs in the multivariate analysis; whereas results were significant, it is important to note that MS is a costly disease to treat and this difference may be relative.
There was a reduction in all-cause and MS-related inpatient admissions in the post-index period. On average, patients experienced longer all-cause and MS-related inpatient LOS in the post-index period, regardless of DMT route of administration. However, of all routes examined, patients initiating treatment with oral DMTs had the shortest post-index mean all-cause (12.6 days) and MS-related inpatient (8.0 days) LOS. These patients also had the lowest mean increases from pre-index in all-cause (3.4 days) and MS-related (2.0 days) LOS.
These findings suggest that initiation of an oral DMT in the first-line setting confers a cost advantage, with patient adherence, persistence, and experience of relapse similar to initiation of an injection or infusion DMT.
In this study, the higher proportion of relapses and MS-related symptoms in the pre-index period among patients who initiated infusion DMTs suggests that these individuals may have different MS phenotypes. An oral or injectable DMT benefit/risk profile may not be appropriate for those who initiate an infusion DMT. Because patients continue to relapse after initiating a DMT, initiating with a higher efficacy DMT with an appropriate benefit/risk profile provides an opportunity to lower total cost of care and improve outcomes.
The decision to initiate DMT is complex; as options for MS DMTs expand, evidence-based treatment algorithms will be necessary.13 Until the 2018 release of the American Academy of Neurology (AAN) MS practice guideline, no US evidence-based clinical guidelines existed for the treatment of MS.13 However, the current AAN practice guidelines for MS offer only limited direction on DMT selection, noting that physicians should consider benefit/risk profile of treatment for each patient and take into consideration likelihood of adherence.12 Adherence to and persistence with therapy is one of the greatest concerns for patients with MS.13 Gaps in therapy lasting at least 90 days nearly double the probability of severe relapse,21 which increases healthcare costs substantially.13
Limitations
This study includes limitations inherent in any retrospective analysis. It was limited to individuals with commercial health coverage or private Medicare supplemental coverage and may not be generalizable to patients with MS with other insurance types or without health insurance coverage. There was also the potential for misclassification of MS status, clinical and demographic characteristics, and study outcomes (MS-specific costs, utilization, and relapse) because of use of administrative claims data as opposed to medical records. Additionally, other important MS outcomes, such as MRI activity, cannot be assessed using claims data. Adherence and persistence were determined based on filled prescriptions, but there was no confirmation that the patients actually took the medications. Moreover, DMTs were limited to FDA-approved products at the time of analysis and did not include those approved for use during or after study initiation. Therefore, it is not known whether newer treatments will show improved adherence/persistence and/or better outcomes compared with current therapies. Relapses were identified through a validated claims-based algorithm that demonstrated high positive and negative predictive power; however, the investigators who validated this algorithm noted that it may not detect mild relapses that do not affect daily activities.20
In addition, MS phenotype, severity, expanded disability status scale score, and confirmatory brain scan data were not available from the administrative claims data. It is possible that the 12-month post-index period biased the study to include patients with less severe disease, as those who died or went on long-term disability owing to serious health conditions may have had continuous enrollment for <12 months. Finally, there may have been systematic differences between study cohorts that accounted for differences in treatment patterns, HCRU, and healthcare costs. Differences between cohorts were controlled for by multivariate regression; however, adjustments were limited to those characteristics that could be measured from administrative claims.
Conclusion
MS is a costly and debilitating chronic condition. DMT slows disease progression; however, low adherence and high therapeutic discontinuation remain key treatment concerns. In this study, similar outcomes in terms of adherence/persistence and relapse were observed for all routes of DMT administration. Treatment with oral DMT incurred significantly lower costs overall. Therefore, initiating treatment with the least costly DMT option may be warranted for many patients.
Abbreviations
MS, multiple sclerosis; QOL, quality of life; USD, US dollars; DMT, disease-modifying therapy; HCRU, healthcare resource utilization; FDA, Food and Drug Administration; ICD-9-CM/ICD-10-CM, International Classification of Diseases, Ninth/Tenth Revision, Clinical Modification; PDC, proportion of days covered; ED, emergency department; LOS, length of inpatient stay; SD, standard deviation; NSAID, nonsteroidal anti-inflammatory drug; COX-2, cyclooxygenase-2; OR, odds ratio; CI, confidence interval; AAN, American Academy of Neurology.
Data Sharing Statement
Data requests may be submitted to Celgene, a Bristol Myers Squibb company, at https://vivli.org/ourmember/celgene/ and must include a description of the research proposal.
Ethics Approval and Informed Consent
This was a retrospective, observational, non-interventional study carried out using anonymized administrative claims data from a commercial database and, as such, did not require ethical approval by an institutional review board or ethics committee.
Acknowledgments
The authors would like to thank Tim Pham of Bristol Myers Squibb for his contributions to this study.
Author Contributions
All authors made substantial contributions to conception and design, acquisition of data, or analysis and interpretation of data; took part in drafting the article or revising it critically for important intellectual content; agreed to submit to the current journal; gave final approval of the version to be published; and agreed to be accountable for all aspects of the work.
Funding
This study was sponsored by Bristol Myers Squibb, Princeton, NJ, USA. Support for third-party writing assistance for this manuscript was provided by Peloton Advantage, LLC, Parsippany, NJ, an OPEN Health company, funded by Bristol Myers Squibb.
Disclosure
Leorah Freeman has received consultancy fees from Celgene, Biogen, and EMD Serono; has received program sponsorship from Biogen and EMD Serono; and has participated on advisory boards for Genentech, Novartis, and Celgene. Arianna Kee is employed by Bristol Myers Squibb. Marc Tian and Rina Mehta were employed by Celgene, a Bristol Myers Squibb company, at the time the study was conducted. The authors report no other conflicts of interest in this work.
References
1. Hunter SF. Overview and diagnosis of multiple sclerosis. Am J Manag Care. 2016;22(Suppl 6):S141–150.
2. Wallin MT, Culpepper WJ, Campbell JD, et al. The prevalence of MS in the United States: a population-based estimate using health claims data. Neurology. 2019;92(10):e1029–e1040. doi:10.1212/WNL.0000000000007035
3. Hirst C, Ingram G, Pearson O, Pickersgill T, Scolding N, Robertson N. Contribution of relapses to disability in multiple sclerosis. J Neurol. 2008;255(2):280–287. doi:10.1007/s00415-008-0743-8
4. Gelfand JM. Multiple sclerosis: diagnosis, differential diagnosis, and clinical presentation. Handb Clin Neurol. 2014;122:269–290.
5. Thompson AJ, Banwell BL, Barkhof F, et al. Diagnosis of multiple sclerosis: 2017 revisions of the McDonald criteria. Lancet Neurol. 2018;17(2):162–173. doi:10.1016/S1474-4422(17)30470-2
6. O’Connell K, Kelly SB, Fogarty E, et al. Economic costs associated with an MS relapse. Mult Scler Relat Disord. 2014;3(6):678–683. doi:10.1016/j.msard.2014.09.002
7. Scalfari A, Neuhaus A, Degenhardt A, et al. The natural history of multiple sclerosis: a geographically based study 10: relapses and long-term disability. Brain. 2010;133(Pt 7):1914–1929. doi:10.1093/brain/awq118
8. Ma VY, Chan L, Carruthers KJ. Incidence, prevalence, costs, and impact on disability of common conditions requiring rehabilitation in the United States: stroke, spinal cord injury, traumatic brain injury, multiple sclerosis, osteoarthritis, rheumatoid arthritis, limb loss, and back pain. Arch Phys Med Rehabil. 2014;95(5):986–995.e981. doi:10.1016/j.apmr.2013.10.032
9. Owens GM. Economic burden of multiple sclerosis and the role of managed care organizations in multiple sclerosis management. Am J Manag Care. 2016;22(6 Suppl):s151–158.
10. Cross AH, Naismith RT. Established and novel disease-modifying treatments in multiple sclerosis. J Intern Med. 2014;275(4):350–363. doi:10.1111/joim.12203
11. Burks J, Marshall TS, Ye X. Adherence to disease-modifying therapies and its impact on relapse, health resource utilization, and costs among patients with multiple sclerosis. ClinicoEconomics Outcomes Res. 2017;9:251–260. doi:10.2147/CEOR.S130334
12. Rae-Grant A, Day GS, Marrie RA, et al. Practice guideline recommendations summary: disease-modifying therapies for adults with multiple sclerosis: report of the guideline development, dissemination, and implementation subcommittee of the American Academy of Neurology. Neurology. 2018;90(17):777–788. doi:10.1212/WNL.0000000000005347
13. Anderson SS, Philbrick AM. Improving multiple sclerosis care: an analysis of the necessity for medication therapy management services among the patient population. J Manag Care Specialty Pharmacy. 2014;20(3):254–261.
14. Sánchez Martínez I, Cerdán Sánchez M, López Román J, et al. Possible influence of the route of treatment administration on treatment adherence in patients with multiple sclerosis. Clin Ther. 2020;42(5):e87–e99. doi:10.1016/j.clinthera.2020.03.005
15. Thach AV, Brown CM, Herrera V, et al. Associations between treatment satisfaction, medication beliefs, and adherence to disease-modifying therapies in patients with multiple sclerosis. Int J MS Care. 2018;20(6):251–259. doi:10.7224/1537-2073.2017-031
16. Rae-Grant A, Day GS, Marrie RA, et al. Comprehensive systematic review summary: disease-modifying therapies for adults with multiple sclerosis: report of the guideline development, dissemination, and implementation subcommittee of the American Academy of Neurology. Neurology. 2018;90(17):789–800. doi:10.1212/WNL.0000000000005345
17. Parise H, Laliberte F, Lefebvre P, et al. Direct and indirect cost burden associated with multiple sclerosis relapses: excess costs of persons with MS and their spouse caregivers. J Neurol Sci. 2013;330(1–2):71–77. doi:10.1016/j.jns.2013.04.007
18. Margolis JM, Fowler R, Johnson BH, Kassed CA, Kahler K. Disease-modifying drug initiation patterns in commercially insured multiple sclerosis patients: a retrospective cohort study. BMC Neurol. 2011;11:122. doi:10.1186/1471-2377-11-122
19. Ollendorf DA, Jilinskaia E, Oleen-Burkey M. Clinical and economic impact of glatiramer acetate versus beta interferon therapy among patients with multiple sclerosis in a managed care population. J Manag Care Pharm. 2002;8(6):469–476. doi:10.18553/jmcp.2002.8.6.469
20. Chastek BJ, Oleen-Burkey M, Lopez-Bresnahan MV. Medical chart validation of an algorithm for identifying multiple sclerosis relapse in healthcare claims. J Med Econ. 2010;13(4):618–625. doi:10.3111/13696998.2010.523670
21. Patti F. Optimizing the benefit of multiple sclerosis therapy: the importance of treatment adherence. Patient Prefer Adherence. 2010;4:1–9. doi:10.2147/PPA.S8230
 © 2021 The Author(s). This work is published and licensed by Dove Medical Press Limited. The
full terms of this license are available at https://www.dovepress.com/terms
and incorporate the Creative Commons Attribution
- Non Commercial (unported, 3.0) License.
By accessing the work you hereby accept the Terms. Non-commercial uses of the work are permitted
without any further permission from Dove Medical Press Limited, provided the work is properly
attributed. For permission for commercial use of this work, please see paragraphs 4.2 and 5 of our Terms.
© 2021 The Author(s). This work is published and licensed by Dove Medical Press Limited. The
full terms of this license are available at https://www.dovepress.com/terms
and incorporate the Creative Commons Attribution
- Non Commercial (unported, 3.0) License.
By accessing the work you hereby accept the Terms. Non-commercial uses of the work are permitted
without any further permission from Dove Medical Press Limited, provided the work is properly
attributed. For permission for commercial use of this work, please see paragraphs 4.2 and 5 of our Terms.