Back to Journals » Risk Management and Healthcare Policy » Volume 13
Evaluating the Impact of Patient No-Shows on Service Quality
Authors Marbouh D, Khaleel I, Al Shanqiti K, Al Tamimi M, Simsekler MCE ![]() , Ellahham S
, Ellahham S ![]() , Alibazoglu D, Alibazoglu H
, Alibazoglu D, Alibazoglu H
Received 23 September 2019
Accepted for publication 23 March 2020
Published 4 June 2020 Volume 2020:13 Pages 509—517
DOI https://doi.org/10.2147/RMHP.S232114
Checked for plagiarism Yes
Review by Single anonymous peer review
Peer reviewer comments 3
Editor who approved publication: Dr Kent Rondeau
Dounia Marbouh,1 Iman Khaleel,1 Khawla Al Shanqiti,1 Maryam Al Tamimi,1 Mecit Can Emre Simsekler,1,2 Samer Ellahham,3 Deniz Alibazoglu,3 Haluk Alibazoglu4
1Research Center of Digital Supply Chain and Operations, Department of Industrial and Systems Engineering, Khalifa University, Abu Dhabi, United Arab Emirates; 2School of Management, University College London, London, UK; 3Heart and Vascular Institute, Cleveland Clinic Abu Dhabi, Abu Dhabi, United Arab Emirates; 4Imaging Institute, Cleveland Clinic Abu Dhabi, Abu Dhabi, United Arab Emirates
Correspondence: Mecit Can Emre Simsekler
Khalifa University of Science and Technology, Department of Industrial and Systems Engineering, P.O. Box 127788, Abu Dhabi, United Arab Emirates
Tel +9712 501 8410
Fax +971 2 447 2442
Email [email protected]
Purpose: Patient no-shows are long-standing issues affecting resource utilization and posing risks to the quality of healthcare services. They also lead to loss of anticipated revenue, particularly in services where resources are expensive and in great demand.
Methods: In order to address common reasons why patients miss appointments, this study reviews the current literature and investigates various tools and methods that have been implemented to mitigate such issues. Further, a case study is conducted to identify the rate of no-shows and underlying causes at a radiology department in one of the leading hospitals in the MENA region.
Results: Our results show that the no-shows are high due to multiple factors, such as patient behavior, patients’ financial situation, environmental factors and scheduling policy.
Conclusion: In conclusion, we generate a list of recommendations that can help in reducing the rate of patient no-shows, such as patient education, application of dynamic scheduling policies and effective appointment reminder systems to patients.
Keywords: quality, no-shows, overbooking, resource utilization, scheduling policy, patient appointment, predictive analytics
Introduction
With the increasing demand and cost pressures, it is imperative for healthcare organizations to improve the effectiveness and efficiency of their services. Despite huge efforts, there are inevitable events leading to higher costs and underutilization. Patient no-shows are great examples that significantly trigger the mismatch between supply and expected demand. Therefore, they have an impact on service quality and system performance.1
No-shows occur, when a patient fails to attend a scheduled appointment with no prior notification to the healthcare provider. They are missed healthcare utilized time slots and resources that can negatively affect the utilization of space and human resources. Further, they can affect the patient’s health condition due to the delay in diagnosis or treatment. Prospective patients can also be impacted and less satisfied due to their inability of scheduling timely appointments. Furthermore, generated revenue also decreases due to the reduction in the system’s operational efficiency. For instance, in a recent study, it was estimated that 67,000 no-shows can cost the healthcare system approximately $7 million.2 Such costs may be even much higher in some settings, such as radiology departments, where resources, such as X-Ray and MRI machines are very expensive and underutilization may cause huge financial constraints to the healthcare organizations.
Although recent studies show the impact of no-shows in operational context, there is limited research comprehensively identifying factors underlying such no-show cases. In order to shed light on this, we first review the literature on this particular topic. Second, we investigate if there are any particular approaches used in healthcare to minimize the rate of no-shows. Finally, we conduct a short case study to provide significant insight from a real healthcare setting and stakeholders to measure the rate of no-shows while narrowing down to their underlying causes. We select radiology department in our case study as it is a unique service supporting both inpatient and outpatient clinics in most hospitals, where appointment compliance, service quality and delivery are important for patients to follow up their diagnosis and treatment procedures on time.
Literature Review
No-Show Rate and Underlying Reasons
Patient no-shows cause volatility in healthcare operations and waste human and space resources. Different no-show rates were reported from 12% to 80% in various healthcare settings.3,4
Several studies have identified various factors influencing no-show rates, such as gender, age, service quality, number of preceding appointments, appointment lead times, and waiting times.5 Another study showed that most no-shows are more common among men, younger, and patients of lower socioeconomic status.6 According to a study conducted in an South-Eastern American rural free clinic, the no-show reasons include hard transportation access, consulting various doctors, long waiting times, bad weather and fear of doctors/hospitals.1
Some of the underlying causes of patient no-shows are immeasurable in some cases and difficult to be tackled by healthcare organizations. However, through patient records, some patterns can be developed to enhance future prediction for no-shows. For instance, earlier studies showed that patient’s past no-show record is a powerful alert that can be used to predict patients who will most likely miss their next appointment.7 Most of the studies aim to reduce the no-shows by suggesting new methods, such as reminder calls. For instance, Drabkin et al reduced the no-shows from 20.99% to 7.07% with the application of telephone reminders.8 On the other hand, some recent studies worked on incorporating no-show rate into the scheduling model to minimize the negative consequences, for example by overbooking.9 The studies showed a positive impact when overbooking was introduced to the system, where patient access improved, and productivity increased. However, if healthcare providers are to perform a naïve overbooking – without considering the likelihood that double-booked patients for that particular time will or will not attend their appointment - this would potentially increase staff overtime and patient waiting time further.9
Forgetting about the appointment,10,11 patient scheduling conflicts10 and miscommunication11 were found to be the most common causes of patient no-shows in various healthcare settings. Besides, no-show of first-time visiting patients could be due to the resolution of symptoms or transportation barriers.12 Additional causes include the wrong beliefs of the patient about the disease or the test,13 long waiting time between the actual and scheduled appointment, insurance coverage, language and transportation difficulties.14 Studies also suggested that reasons can differ depending on the type of healthcare settings and nature of medical tests. For instance, it was found that the high no-show rate in the mammography department is affected due to the anxiety and discomfort of patients.13 In fact, the examinations for less serious conditions had high rates of no-shows since patients believe that postponing tests would be harmless.
Impact of No-Shows
The negative impacts of high no-shows are many and are not limited to the healthcare providers only but also affect those patients missing their appointment. Some of these harms include: a discontinued care process, longer waiting time for appointments, and higher (sometimes inappropriate) admissions to Emergency Room (ER) services. An inappropriate admission to an ER can drive medical expenses up as ER services are more expensive and provide little preventative care.15 Furthermore, missing a scheduled appointment causes a minimized access for other patients, this can create dissatisfaction among patients and healthcare providers, and suboptimal care results.14
In addition to no-show harms discussed above, a high no-show rate involves a lost revenue and thus profit to the hospital. For instance, a research conducted in a vascular laboratory found that a no-show rate of 12% can cost the laboratory a gross loss of $89,107 annually. It also creates inefficiency in the scheduling system and increases the waiting time for outpatient. Additionally, it was demonstrated that reducing the no-show rate to 5% would result in increasing the revenue by $51,769.00.16
Various data analysis tools and methods have been used to determine the most significant factors driving patient no-show rates. In a recent study, a retrospective statistical analysis of scheduled appointments in a year has been conducted for a single multi-subspecialty academic otolaryngology department by fitting marginal regression models. In this model, the interrelation between no-show rates and some variables was examined. These variables included: patient demographic, scheduled appointment time, insurance type and its benefits, rurality, medical specialty, hospital’s location, and visit type. The results of the study showed a no-show rate of 20% with a significantly high rate among patients who live in rural areas, new patient visits, and those who scheduled for summer appointments. Furthermore, among the different specialties, paediatrics faced the highest no-show rates whereas face plastic surgeries were the lowest. Additionally, self-payers and patients over 60 years tend to have lower no-show rates compared to insured and younger patients.12
In another study, Rosenbaum et al built a model using logistic regression. This model’s data were from the imaging department and its sub-departments: Mammography, Radiography, CT Scan, MRI, Ultrasound, and Nuclear Medicine. This research used a multivariate logistic regression analysis with categorical variables including patient’s age, timing of the appointment, day of the week, modality, and lead-time. The two most important variables associated with increasing the no-show rates were found to be the scheduling lead-time and the modality type. It was also found that mammography had the highest modality no-show rate while radiography had the lowest modality rate. Also, a lead time higher than six months resulted in higher no-show rates compared to a lead time of one week.13 In another study, conducted by Shaw et al, no-show rates were significantly high among patients who were assigned to an appointment with a lead-time of 37 days. Further, it was found the no-show rates increased with an increasing lead time, i.e., 19.60% for a lead time of 20 days to 21.40% for a 30 days lead time.17 In a similar study context, it was found that a lead time exceeding two weeks would remarkably cause a patient’s no-show probability to increase.18
The Association Rule Mining (ARM) is another specific data mining technique used to predict patients’ no-show probabilities. The specific variables used in the model are: day of the week, the time interval between appointments, missed appointments history, visit’s reason, current physician’s name, previous physician, time, patient’s age, gender and race. After 1000 replications of the model, the study concluded that models applying the rule sets proved to have a significant rise in profits, where the individual and three block methods performed the greatest compared to the other methods. To evaluate the scheduling and rule-based methods, clinics use metrics such as the physicians’ and nurses’ idle time and overtime, the patients seen in total and their total waiting time. The study concluded that rule-association is very effective and might be useful to achieve better strategic and scheduling planning.1
Another study was conducted in a vascular laboratory consisted of implementing an automatic call reminder to reduce the no-show rate to 5%. The results of the 17 months experiment showed no difference in the no-show rate between patients who received an automated call or who did not. However, the implementation of the reminder call showed a high rate of cancellation which allows the providers to schedule other patients but still, it did not appear to be very successful in decreasing the no-show rate. The study suggested that introducing the self-scheduling system but due to fear of patient confidentiality and cost this strategy did not receive high attention.16
In order to prevent the impact of no-shows, overbooking was adopted by many healthcare providers. Satiani et al found that the use of the overbooking strategy may be applicable and can work effectively in laboratories that are big, bustling and with high no-show rates.16 In another study, conducted by Bargash and Saleet, the overbooking was discussed from a different angle. They examined how the percentage overbooking (POB) and the basic appointment scheduled interval size (BASIS) can mitigate the losses of no-shows. Hence, they established a simulation model that can analyze the impact of patient no-show, lateness, POB, and BASIS on patient waiting time, doctors’ utilization and overtime. They concluded that using a POB lower than no-show percentage might mitigate the high no-show rates. On the other hand, to augment the doctors’ utilization without detriment to their overtime, they suggested that healthcare providers should opt for low BASIS values and moderate POB values.5
Kim and Giachetti examined how healthcare providers can use overbooking to increase their profits by seeing more patients.15 It was found that if the service is overbooked by many patients, healthcare providers might find themselves obligated to work overtime in order to assist the overbooked patients. Therefore, the authors suggested balancing the costs when too many patients show up with few patients showing up. To achieve this, authors used a Stochastic Mathematical Overbooking Model (SMOM) that establishes the optimum number of to-be-scheduled appointments to optimize the total predicted profits for the healthcare provider. This model would benefit healthcare providers by better utilizing their staff, which is the utmost element of their total costs. On the other hand, this latter would benefit patients by reducing their waiting times and so their no-show rates and increasing their continuity of treatment. The SMOM also considers the variability of walk-ins as well as no-shows, as both are critical components impacting the expected revenue. The study showed that the SMOM’s implementation could result in increasing profits by 43.72% for 59 clinics. The SMOM’s application would also necessitate (1) tracking parameters such as no-show history, walk-ins and appointment cancellation, (2) periodically updating the database of no-show rates, cancellations and walk-in rates.15
Another type of model was developed and applied in West China Hospital (WCH).19 The developed model is based on patients’ sensitivity to time delay. The WCH allows patients to book their appointments in various ways, such as web-based reservation, phone reservation and on-site appointment. However, the WCH uses a large lead time of two months which causes longer patient waiting time (PWT), higher no-show rates and greater physician idle times. In order to solve this conflict, they developed a queuing model to find the ideal scheduling lead time. It was found that when patients are not sensitive to time delay, leveraging the lead-time has no effect in minimizing the total cost of no-shows per day. However, when patients show sensitivity to time delay then the model would account for the possible cost of physician idle time. Thus, for the clinic to achieve optimized total costs per day, the lead time adopted should be kept proper, moderate and under two months.19
The regression models of no-shows discussed earlier seem to be an effective way of identifying data trends and correlations that can be used to mitigate the no-show challenge. The models’ results can guide the selection of required interventions, such as deployment of different patient reminder strategies. These regression models consider several characteristics that assist in a higher accuracy while computing whether the patient will attend their appointment or not. Linear regression models usually are associated with simulation models, to check for robustness and the model’s potentials. Parente et al managed to reduce the no-show rates significantly using this methodology for overbooking the achieved an average no-show of about 14%.20 In addition, there was a minor increase in the patients’ waiting time. Both Alaeddini et al and Harvey et al developed linear regression models to shed light on no-show phenomenon.21,22 In fact, Parente et al also used empirical Bayesian inference in order to forecast the patient’s no-show in real-time, considering social, demographics and attendance records. Similarly, Harvey et al implemented a linear regression model for their radiology department which helped them finding underlying causes of no-shows; therefore helped decreasing its rate to 6.5% on average for all the department.22
Studies showed that scheduling process may also play a role in mitigating patient no-shows. Mainly, the appointment scheduling workflow includes three main decision categories: (i) appointment rules, (ii) patient classification, and (iii) adjustments for disruption.1 There are several appointment rules to schedule patients. One of the most commonly used rules is the single block rule, where all patients are assigned to one-time spot and get treated based on the first come first serve basis. Another approach is the two-block approach, where patients are scheduled for two schedule times but still get treated as a single approach. Today, most healthcare service providers use the individual block approach, where patients are assigned to a unique interval time that varies depending on the patient and illness type. The second element deals with the classification of patients that include sequencing, time intervals, number of patients seen, new/established patients and type of procedures. The third decision, which is very important, deals with the ability of the system to adjust with disruptions such as walk-ins, urgent patients, emergencies, consultations, late arrivals and no-shows.1
Methods
In order to investigate the challenge of patient no-shows further, we conducted a case study in a radiology department at a leading hospital in the MENA region. Serving both inpatient and outpatient clinics, radiology department have been experiencing very high no-show rates with a high underutilization cost. In order to understand the current scheduling practice and more information on no-shows, retrospective data on patient no-shows were analysed. Further, informal discussions were conducted with the hospital staff, including managers, physicians, nurses and scheduling assistants to validate if patient no-shows that have been identified through the literature review is valid in their particular healthcare setting in the hospital studied. Through discussions, we aimed to understand appointment rules, patient classification, and any adjustments used in case of disruption, while identifying the underlying causes of no-shows in the chosen setting. This study is based on retrospective and de-identifiable data and does not include any access to identifiable private information. Therefore, it does not require IRB review.
Hospital Setting
The hospital under study has one of the largest radiology departments in the MENA region. This department includes: CT-scanning, MRI, X-ray, nuclear medicine, ultrasound, etc. The department is equipped with advanced technology that is sophisticated; hence encountering a high cost and revenue to the hospital’s overall budget. The hospital has an effective scheduling system, as they have a dedicated team specialized in scheduling. Moreover, each department has a preference to use their own schedulers or general scheduling team. Mostly, the radiology department patients are internal referrals; therefore, the procedure is initiated by physicians from the same hospital. The scheduling team plays a role of assigning patients to free slots based on availability and the urgency of the case. Lead-time varies from immediate referrals to three months at most. The patient receives several verification phone calls where he/she is asked to confirm his/her availability in addition to SMS reminders. In case of no-shows, the scheduling team sends a warning email to the physician. In such cases, it is up to the physician to deal with the matter and interference by the hospital is not tolerated unless requested.
Despite such efforts, this department has faced high no-show rates that were exceeding 50% in some cases and particular time periods, as shown in Tables 1 and 2. These tables represent no-show heatmaps for both the imaging sub-departments X-ray and MRI, respectively. These tables are matrices that represent days of the week arranged in the columns versus the time of the day in the rows (i.e., 0 refers to midnight), while the last column represents the no-show average for each day/hour and the last row represents the no-show average for each day of the week. The values figured in the matrices were obtained on the last week of a particular month from the 24th till the 30th, while the values represented on the last column and row are average values for the whole month. The colours in the matrices provide a better visualization of the no-show rate intensity and when this latter is low, moderate or high. For instance, the white values are no-show rates between 0% and 5%, green represents rates between 6% and 10%, yellow is for rates between 11% and 20%, amber represents values between 21% and 30% and red highlights rates over 31%. As can be noted from Table 1, the no-show rates show an overall white colour throughout the heatmap, which signifies very low rates. As can also be retrieved from the same table, the highest no-show rates that this test experienced were green and took place on Sundays and Tuesdays between 1pm and 3pm with a value not exceeding 10%. The low no-show rates of this test can be explained by the simple nature of the X-ray. In fact, the X-ray test, unlike the other tests in the radiology department, is fast but most importantly, less worrying for patients as it is usually used to diagnose less serious health issues.
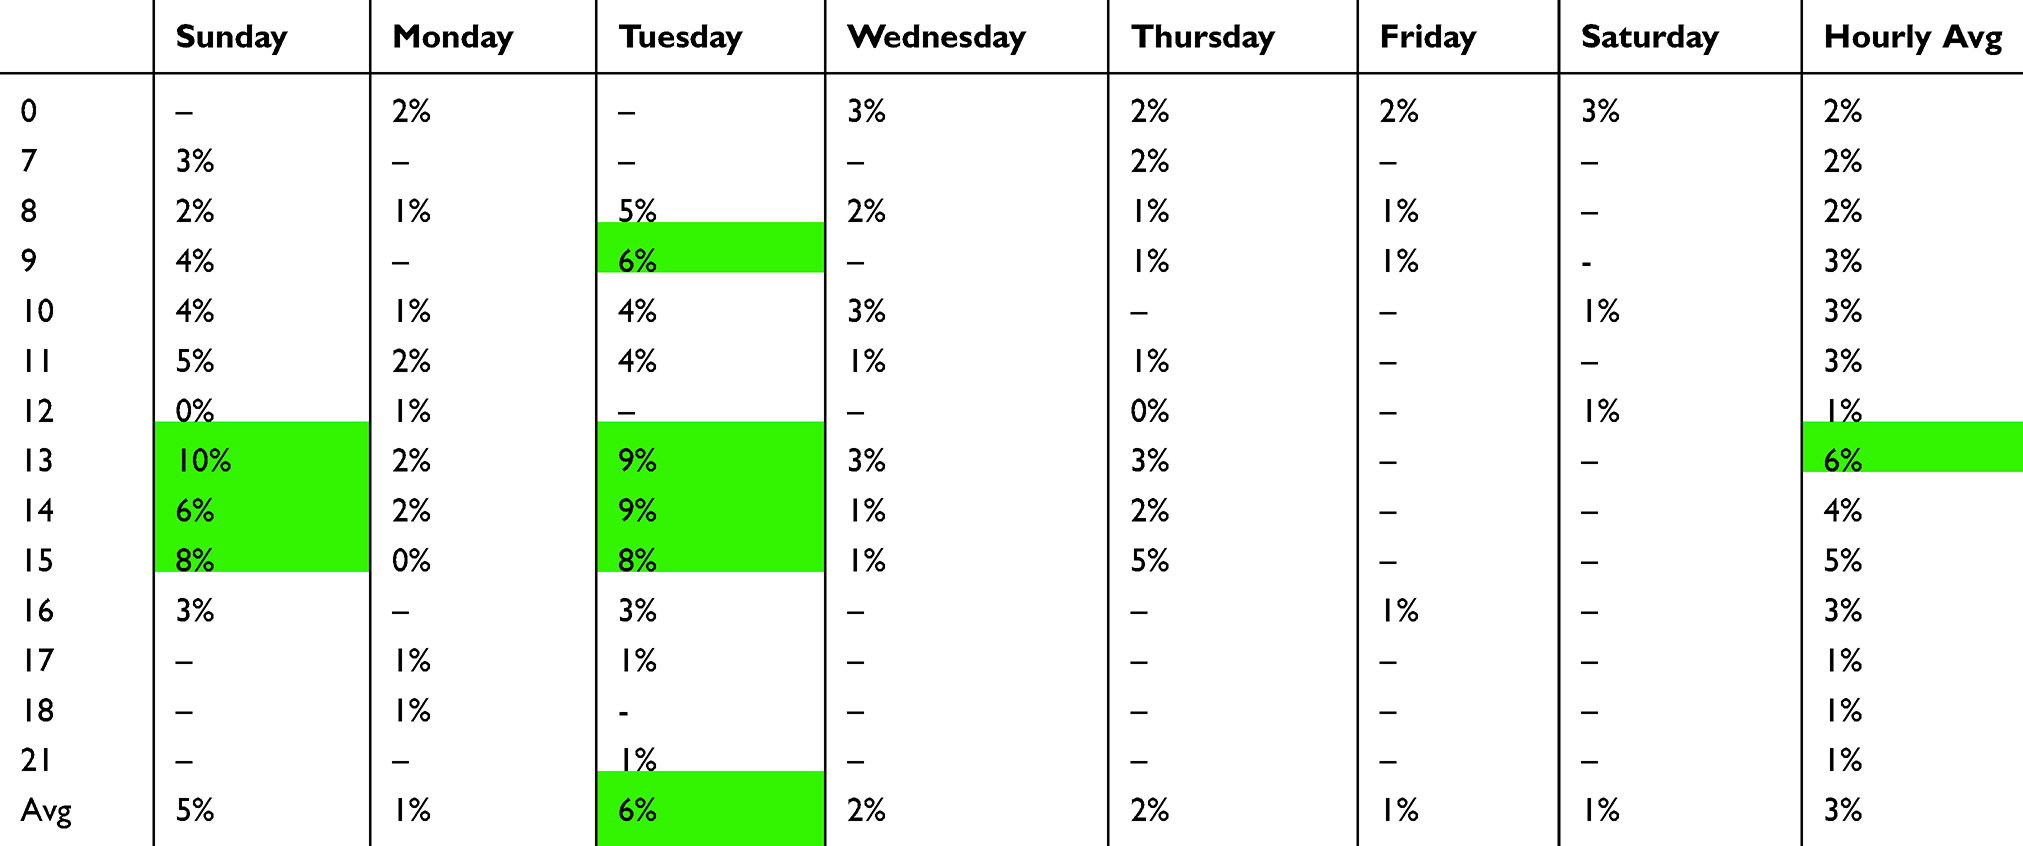 |
Table 1 X-Ray No-Show Heatmap |
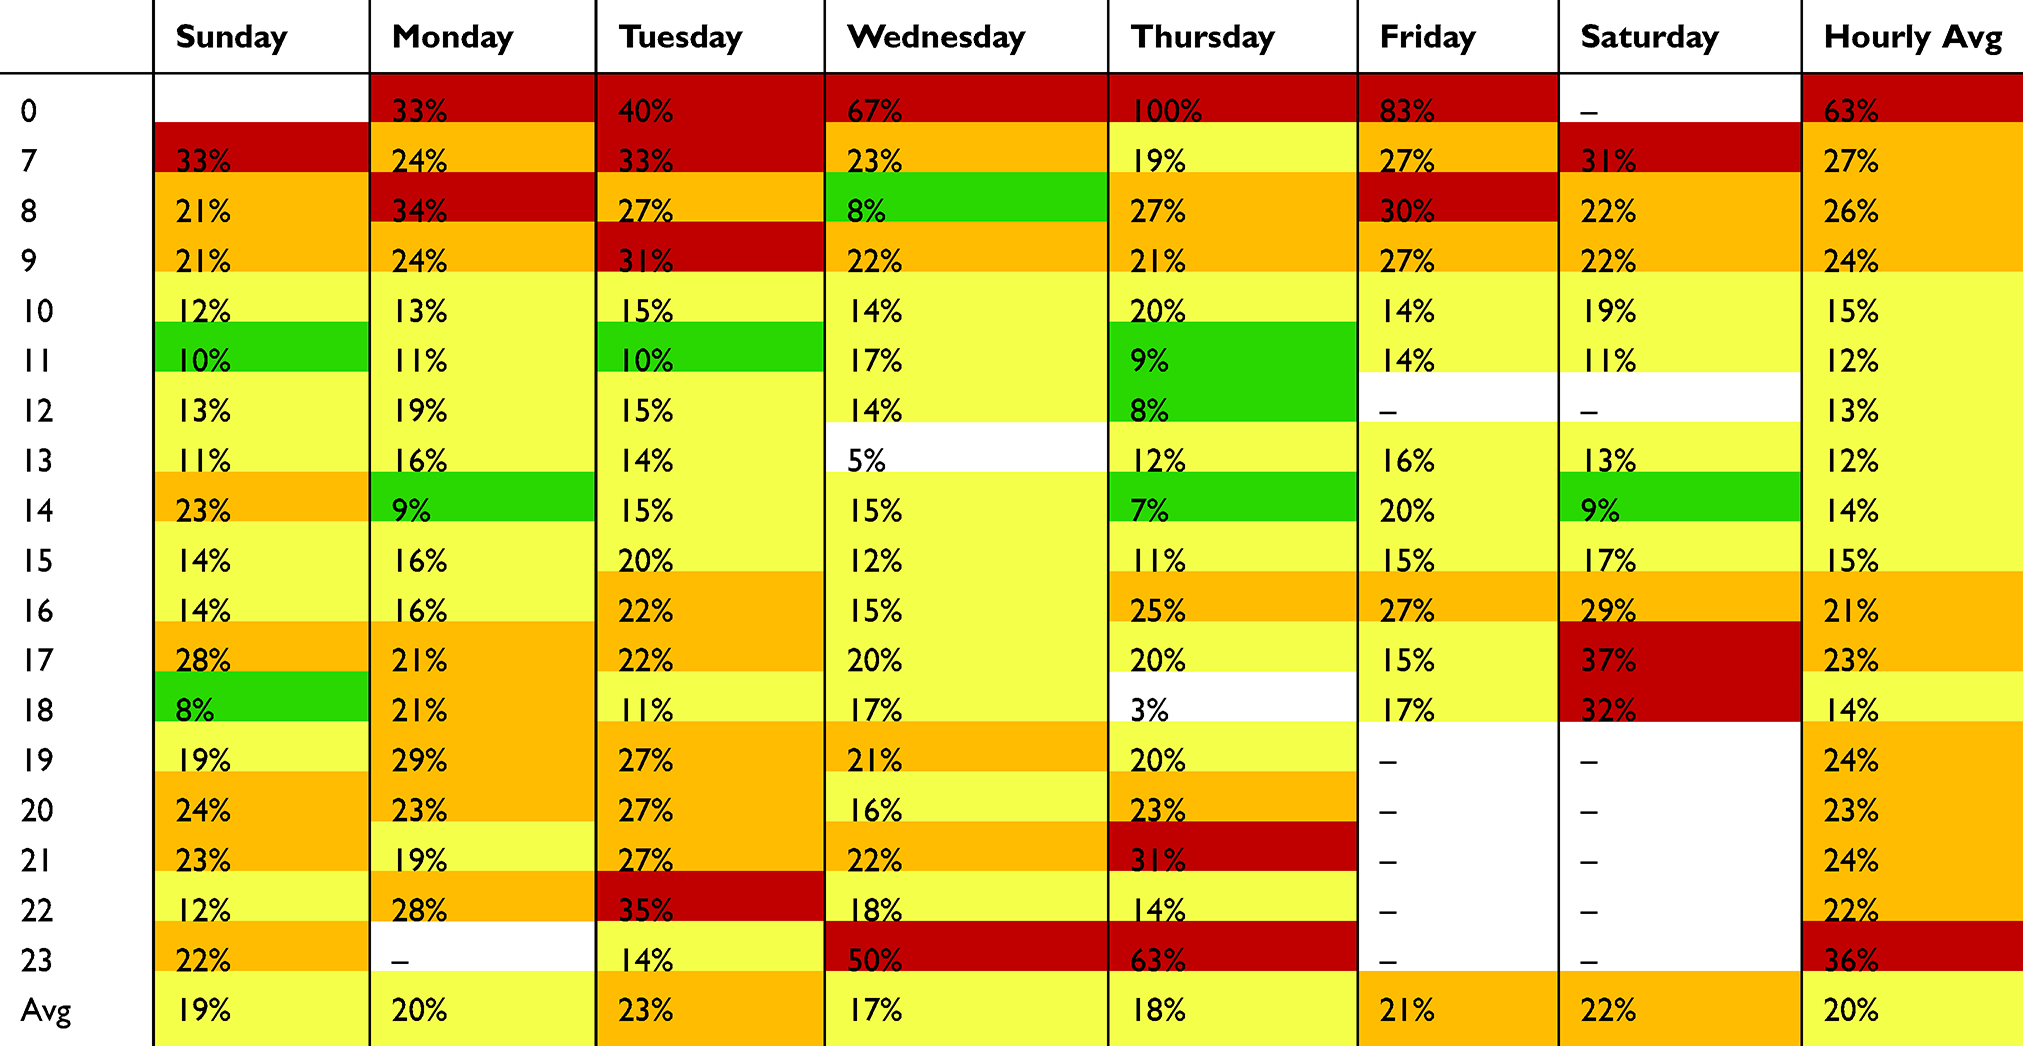 |
Table 2 MRI No-Show Heatmap |
Unlike the X-ray test, the heatmap for the MRI test in Table 2 illustrates no-show rates that exceeded 80% in some particular days but maintained an average of 20% for the rest. As already explained, the dark red highlights the cells with very high no-show rates during the day and throughout the week. As the no-show values decrease, the cells take a yellowish colour to illustrate lower ranges, while the green cells illustrate moderate values for the rates and white for low ones. The no-show rates tend to be very high – from 67% to 100% – on Wednesdays, Thursdays, and Fridays at midnight. Moreover, appointments between 11pm and 12am tend to have the highest no-show rates in the day with an average no-show rate of 36% and 63%, respectively. In fact, appointments scheduled in the early mornings (7am to 9am) and evenings (7pm to 10pm) have also a moderate no-show rate of approximately a 25%. The significant high rates for this test can be explained by the complex nature of the MRI. The MRI is usually perceived as a test for extreme cases, useful in determining any overall damage from an injury beyond what an X-ray can relate. Hence, the negative patients’ perception toward this test can make them anxious to go further with the process.
Potential Factors Affecting Patient No-Shows
In order to identify potential factors affecting no-shows, we brought all findings from the literature and the case study together. The main factors driving patient no-shows could be grouped under four categories: (1) patient-related issues, (2) environmental issues, (3) financial issues, and (4) scheduling-related issues. The following list details the causes and sub-causes of the no-show problem as per the case of the hospital.
Patient-Related Issues
- Lack of urgency sense and responsibility. Patients may not regard missing their appointment as crucial to their care and to healthcare providers.
- Improved health condition. Patients tend to skip further appointments once they feel better.
- Fear and anxiety. The nature of the setting in radiology department can cause anxiety in patients.
- Childcare. If a patient is a parent and has no one to help take care of their children and dependents, this can be a reason not to show up.
- Language barrier.
- Oversleeping and forgetfulness.
Environmental Issues
- Transportation-related issues. Patient may miss the appointment if there is no suitable transportation.
- Unavailability of parking area. Most residents in the studied region own a car, and heavily depend on it for transportation. Not finding a parking lot in a reasonable time can cause the patient to miss the appointment.
- Weather condition. The studied region is known for its hot weather, which may lead to no-shows, particularly the hottest period of the day and year.
Financial Issues
- Service cost. If the patient is not insured, and the test cost is not affordable by the patient, then s/he might decide to miss the appointment.
- Insurance type and coverage. If a patient’s insurance does not cover the service, then the patient might consider not taking the test.
Scheduling-Related Issues
- Lead time. A high lead time (e.g. having an appointment for eight weeks later) significantly increases the probability of no-shows.
- Time of the assigned appointment. If the assigned appointment falls during an unsuitable time, the patient might miss the appointment.
As shown in the list above, the factors affecting no-shows for this particular hospital were many. However, probably, the unique one to this particular healthcare setting was fear and anxiety. As mentioned before, the radiology department, unlike other departments, can cause anxiety and claustrophobia23 in patients. According to the discussions conducted with the physicians of the clinic under study, the causes of anxiety are due mainly to the enclosed nature of the scanning examination. As a result, patients might get claustrophobic reactions and anxiety regarding the results of the test. Additionally, language barrier is a common cause for no-shows as having difficulties to communicate with the doctors and nurses can cause the patients not to show up and look for other alternatives.
Discussion and Conclusions
Patient no-shows disrupt the healthcare delivery system by creating inefficiencies and keeping idle the utilization of valuable resources. Identifying all possible factors underlying no-shows with appropriate mitigation strategies, e.g. dynamic scheduling systems with the use of predictive analytics tools via machine learning and artificial intelligence, may help healthcare organizations to reduce and absorb the impact of no-shows. Aiming to make healthcare more effective and efficient,24 such approaches would enable better match supply with expected demand under such circumstances. The recommendations below for the scheduling process may also be helpful for the purpose of reducing no-show rates:
- Shortening the waiting time between scheduled and the actual appointment aka., lead time. As mentioned above, patients tend to be sensitive to time delay19 and any lead time higher than two weeks can significantly cause the probability of failing to attend the appointment.18
- Adding automated reminders to adjust patient behaviors (e.g. text messages, phone calls, emails). Earlier studies showed the reduction of no-shows from 20.99% to 7.07% thanks to the telephone reminders.8
- Establishing a separate cancellation phone line and using smart communication language in the phone call reminders, to give the patient the comfort and the courage to cancel the booked appointments if they are no longer needed.
- By using the Electronic Health Records (EHRs), healthcare providers can access patients’ no-show history and build predictive models that can assess each patient and their probability of no-show. By considering the no-show record of patients and their probability of missing their appointment, predictive analytics tools and methods can be used to create overbooking conditions.15,20 These models can avoid the hospital the potential costs of no-shows.
- The “no-show fee” is a common practice in the airline industry, where passengers are charged a fee for not attending their booked flight. The healthcare industry might also consider adopting this practice by applying financial penalties or incentives when patients miss or attend their booked appointments. Additionally, healthcare providers can adopt a discharge policy for patients that repeatedly do not show up in order to force patients to develop a good sense of responsibility.
- In order to reduce the anxiety, fear and claustrophobia in patients undergoing any type of examination (specifically an MRI), it is crucial to develop strategies, such as providing detailed information to patients, usage of audiovisual tools, and anxiety-reducing protocols. These strategies, in addition to providing healthcare providers with the right training, can make patients more medically literate about their condition and mentally prepared to attend their appointment without unnecessary worry and fear.
The findings and recommendations in this study can be used to consider different no-show factors and their potential impacts in a particular case study where fear and anxiety are potentially driving forces for high no-show rates. While the results of this study provide significant insights, future studies may benefit from more structured qualitative and quantitative studies to better rank the importance of factors as drivers of patient no-shows. It should also be noted that each clinic is unique and understanding the factors driving no-show behavior is important to develop the right set of suggestions and solutions.
Acknowledgments
This publication is based upon work supported by the Khalifa University of Science and Technology under Award No. RC2 DSO.
Disclosure
The authors report no conflicts of interest in this work.
References
1. Glowacka KJ, Henry RM, May JH. A hybrid data mining/simulation approach for modelling outpatient no-shows in clinic scheduling. J Oper Res Soc. 2009;60(8):1056–1068. doi:10.1057/jors.2008.177
2. Berg BP, Murr M, Chermak D, et al. Estimating the cost of no-shows and evaluating the effects of mitigation strategies. Med Decis Making. 2013;33(8):976–985. doi:10.1177/0272989X13478194
3. Lee VJ, Earnest A, Chen MI, Krishnan B. Predictors of failed attendances in a multi-specialty outpatient centre using electronic databases. BMC Health Serv Res. 2005;5:1. doi:10.1186/1472-6963-5-51
4. Barron WM. Failed appointments. Who misses them, why they are missed, and what can be done. Prim Care. 1980;7(4):563–574.
5. Barghash M, Saleet H. Enhancing outpatient appointment scheduling system performance when patient no-show percent and lateness rates are high. Int J Health Care Qual Assur. 2018;31(4):309–326. doi:10.1108/IJHCQA-06-2015-0072
6. Kheirkhah P, Feng Q, Travis LM, Tavakoli-Tabasi S, Sharafkhaneh A. Prevalence, predictors and economic consequences of no-shows. BMC Health Serv Res. 2015;16:1. doi:10.1186/s12913-015-1243-z
7. Dantas LF, Hamacher S, Cyrino Oliveira FL, Barbosa SDJ, Viegas F. Predicting patient no-show behavior: a study in a bariatric clinic. Obes Surg. 2019;29(1):40–47. doi:10.1007/s11695-018-3480-9
8. Drabkin MJ, Lobel S, Kanth N, et al. Telephone reminders reduce no-shows: a quality initiative at a breast imaging center. Clin Imaging. 2019;54:108–111. doi:10.1016/j.clinimag.2018.12.007
9. Daggy J, Lawley M, Willis D, et al. Using no-show modeling to improve clinic performance. Health Informatics J. 2010;16(4):246–259. doi:10.1177/1460458210380521
10. Guzek LM, Fadel WF, Golomb MR. A pilot study of reasons and risk factors for “no-shows” in a pediatric neurology clinic. J Child Neurol. 2015;30(10):1295–1299. doi:10.1177/0883073814559098
11. Kaplan-Lewis E, Percac-Lima S. No-show to primary care appointments: why patients do not come. J Prim Care Community Health. 2013;4(4):251–255. doi:10.1177/2150131913498513
12. Fiorillo CE, Hughes AL, I-Chen C, et al. Factors associated with patient no-show rates in an academic otolaryngology practice: no-show rates in an otolaryngology practice. Laryngoscope. 2018;128(3):626–631. doi:10.1002/lary.26816
13. Rosenbaum JI, Mieloszyk RJ, Hall CS, Hippe DS, Gunn ML, Bhargava P. Understanding why patients no-show: observations of 2.9 million outpatient imaging visits over 16 years. J Am Coll Radiol. 2018;15(7):944–950. doi:10.1016/j.jacr.2018.03.053
14. Samuels RC, Ward VL, Melvin P, et al. Missed appointments: factors contributing to high no-show rates in an urban pediatrics primary care clinic. Clin Pediatr (Phila). 2015;54(10):976–982. doi:10.1177/0009922815570613
15. Kim S, Giachetti RE. A stochastic mathematical appointment overbooking model for healthcare providers to improve profits. IEEE Trans Syst Man Cybern a Syst Hum. 2006;36(6):1211–1219. doi:10.1109/TSMCA.2006.878970
16. Satiani B, Miller S, Patel D. No-show rates in the vascular laboratory: analysis and possible solutions. J Vasc Interv Radiol. 2009;20(1):87–91. doi:10.1016/j.jvir.2008.09.027
17. Shaw T, Metras J, Ting ZAL, Courtney E, Li S-T, Ngeow J. Impact of appointment waiting time on attendance rates at a clinical cancer genetics service. J Genet Couns. 2018;27(6):1473–1481. doi:10.1007/s10897-018-0259-z
18. Navarro MJ, LaPiene B, Sivak S. Wait times less than 2 weeks minimize no-show rates in cardiology practices. Am J Med Qual. 2017;32(6):684. doi:10.1177/1062860617706019
19. Luo L, Zhou Y, Han BT, Li J. An optimization model to determine appointment scheduling window for an outpatient clinic with patient no-shows. Health Care Manag Sci. 2019;22(1):68–84. doi:10.1007/s10729-017-9421-7
20. Parente CA, Salvatore D, Gallo GM, Cipollini F. Using overbooking to manage no-shows in an Italian healthcare center. BMC Health Serv Res. 2018;18:1. doi:10.1186/s12913-018-2979-z
21. Alaeddini A, Yang K, Reddy C, Yu S. A probabilistic model for predicting the probability of no-show in hospital appointments. Health Care Manag Sci. 2011;14(2):146–157. doi:10.1007/s10729-011-9148-9
22. Harvey HB, Liu C, Ai J, et al. Predicting no-shows in radiology using regression modeling of data available in the electronic medical record. J Am Coll Radiol. 2017;14(10):1303–1309. doi:10.1016/j.jacr.2017.05.007
23. Munn Z, Pearson A, Jordan Z, Murphy F, Pilkington D, Anderson A. Patient anxiety and satisfaction in a magnetic resonance imaging department: initial results from an action research study. J Med Imaging Radiat Sci. 2015;46(1):23–29. doi:10.1016/j.jmir.2014.07.006
24. Ellahham S, Ellahham N, Simsekler MCE. Application of artificial intelligence in the health care safety context: opportunities and challenges. Am J Med Qual. 2019;1062860619878515. doi:10.1177/1062860619878515
 © 2020 The Author(s). This work is published and licensed by Dove Medical Press Limited. The
full terms of this license are available at https://www.dovepress.com/terms
and incorporate the Creative Commons Attribution
- Non Commercial (unported, 3.0) License.
By accessing the work you hereby accept the Terms. Non-commercial uses of the work are permitted
without any further permission from Dove Medical Press Limited, provided the work is properly
attributed. For permission for commercial use of this work, please see paragraphs 4.2 and 5 of our Terms.
© 2020 The Author(s). This work is published and licensed by Dove Medical Press Limited. The
full terms of this license are available at https://www.dovepress.com/terms
and incorporate the Creative Commons Attribution
- Non Commercial (unported, 3.0) License.
By accessing the work you hereby accept the Terms. Non-commercial uses of the work are permitted
without any further permission from Dove Medical Press Limited, provided the work is properly
attributed. For permission for commercial use of this work, please see paragraphs 4.2 and 5 of our Terms.