
Back to Journals » Risk Management and Healthcare Policy » Volume 19
Evaluating the Impact of National Essential Public Health Services Program Coverage on Hypertension Management, Medical Care Utilization and Household Socioeconomic Well-Being
Authors Luo Y  , Cao Z, Geldsetzer P, Chen Q, Hao Z , He L , Bärnighausen T, Wang C, Chen S
Received 10 September 2025
Accepted for publication 7 February 2026
Published 4 March 2026 Volume 2026:19 564931
DOI https://doi.org/10.2147/RMHP.S564931
Checked for plagiarism Yes
Review by Single anonymous peer review
Peer reviewer comments 4
Editor who approved publication: Dr Keon-Hyung Lee
Yuheng Luo,1,* Zhong Cao,2,* Pascal Geldsetzer,3 Qiushi Chen,4 Zhuang Hao,5 Liu He,6 Till Bärnighausen,2,7 Chen Wang,6,8 Simiao Chen2,6,8
1School of Health Policy and Management, Chinese Academy of Medical Sciences & Peking Union Medical College, Beijing, People’s Republic of China; 2Heidelberg Institute of Global Health, Faculty of Medicine and University Hospital, Heidelberg University, Heidelberg, Germany; 3Division of Primary Care and Population Health, Department of Medicine, Stanford University School of Medicine, Stanford, CA, USA; 4Harold and Inge Marcus Department of Industrial and Manufacturing Engineering, The Pennsylvania State University, University Park, PA, USA; 5School of Economics and Management, Beihang University, Beijing, People’s Republic of China; 6School of Population Medicine and Public Health, Chinese Academy of Medical Sciences & Peking Union Medical College, Beijing, People’s Republic of China; 7Harvard T.H. Chan School of Public Health, Harvard University, Boston, MA, USA; 8State Key Laboratory of Respiratory Health and Multimorbidity, Chinese Academy of Medical Sciences & Peking Union Medical College, Beijing, People’s Republic of China
*These authors contributed equally to this work
Correspondence: Chen Wang, Email [email protected] Simiao Chen, Email [email protected]
Background: Launched in 2009, China’s National Essential Public Health Services Program (NEPHSP) has been broadly implemented throughout the country. However, rigorous evaluations of its impact on chronic disease outcomes remain limited. Hypertension, being one of the major noncommunicable diseases targeted by the program, provides an important case study for assessing its effectiveness.
Methods: We used longitudinal data from the China Health and Retirement Longitudinal Study (CHARLS) from 2011 to 2018 to evaluate the impact of receiving NEPHSP-covered services (from 2015 onward) on hypertension management. A difference-in-difference approach with two-way fixed effects was used on a cohort of 774 hypertensive adults to estimate changes in health and socioeconomic outcomes associated with NEPHSP coverage.
Results: NEPHSP participation contributed to significant increases in hypertension control (9.8%; 95% CI: 2.7– 16.9%; p< 0.01) and treatment rates (9.9%; 95% CI: 3.8– 16.1%; p< 0.01). It also increased inpatient admissions by 0.17 per year (95% CI: 0.03– 0.31; p< 0.05). No significant effect was found on outpatient visits. In addition to clinical benefits, involvement in NEPHSP was linked to a 5.4% reduction in the Engel coefficient (95% CI: 1.2– 9.6%; p< 0.05), indicating improved household economic well-being. These impacts were more pronounced among younger adults and urban residents, highlighting disparities across subpopulations.
Conclusion: The findings provide evidence that NEPHSP has improved hypertension management and household economic well-being. To further maximize these gains, future policy refinements should focus on adapting services to the specific needs of older age groups and other less-responsive subpopulations to ensure universal health equity.
Keywords: hypertension management, essential public health service, health policy evaluation, difference-in-difference analysis
Introduction
Hypertension, the most common chronic disease, is still the main cause of cardiovascular disease (CVD) and mortality worldwide.1 In 2019, it was reported that approximately 1.28 billion adults worldwide, aged 30 to 79 years, have been diagnosed with hypertension, representing roughly 32 to 34% of the global population.2 The prevalence of hypertension among adults aged 18 to 69 years in China increased from 20.8% in 2004 to a peak at 29.6% in 2010, and then fell to 24.7% by 2018.3 Even with these changes, controlling high blood pressure is still very important. In the survey between 2016 and 2017 conducted in China, only 77.5% of diagnosed individuals received treatment, and merely 26.6% achieved hypertension control.4 Another recent study5 showed that in China the weighted prevalence of hypertension in 2021–2022 was 31.6%, representing a significantly absolute increase of 8.4% from 2012–2015 to 2021–2022. Similarly, according to the latest annual report in China on CVD6 in 2023, a total of 50.37 million hypertension-related admissions were recorded, accounting for 65.8% of all CVD-related admissions.
The Chinese government started the National Essential Public Health Services Program (NEPHSP) in 20097 to help with the growing problem of high blood pressure and other common chronic diseases and to make sure that all residents have equal access to basic healthcare services that are of good quality and protect them from financial risk. Starting in 2009, the NEPHSP was funded by a government subsidy of 15 yuan (about US $2.14) per person. Its main goal was to make sure that everyone had fair access to basic healthcare services and to protect people from having to pay for health-related costs. This was a key step toward achieving universal health coverage (UHC). The program includes a wide range of preventative services such as routine screening, physical examination, health education, and regular follow-up consultations to monitor their condition.8,9 The initial version of NEPHSP established standards for managing health records, health education, and specific health management for key demographics including children aged 0–36 months, pregnant and postpartum women, the elderly, and patients with conditions such as hypertension, diabetes, and severe mental illnesses.8 This program offers free annual blood pressure measurements for all permanent residents aged 35 years and older, with additional monitoring and lifestyle interventions for those over age 55 years or at higher risk due to factors such as obesity, family history of hypertension, or poor lifestyle choices. The hypertension management program of the NEPHSP exhibits low coverage, as evidenced by the standardized management rates for hypertensive patients, which were recorded at 77.4% in 2013, 79.4% in 2015, and 75.6% in 2018.10 Even though many studies have looked into the benefits of better coverage for managing high blood pressure, there is not much real-world evidence yet, highlighting the imperative for a comprehensive evaluation of its efficacy in this subsequent period.
Yet, the significance of NEPHSP extends beyond clinical metrics. To fully understand its value, we must situate the program within the broader context of China’s social welfare reforms. Since these reforms aim to enhance quality of life and reduce socioeconomic disparities. By offering free preventative services to underserved populations, NEPHSP potentially alleviates the household financial burden associated with chronic diseases to make it easier for them to get basic health management and preventative care.11 Therefore, a comprehensive evaluation must examine the program’s spillover effects on broader welfare indicators, specifically household consumption structure such as the Engel coefficient.
At present, research on the effects of NEPHSP coverage in China can be primarily classified into qualitative and quantitative assessments. For qualitative evaluations, related studies have predominantly focused on descriptive analyses and cross-sectional studies across regions, which have broadly introduced the utilization of NEPHSP and associated health expenditures.12–14 These studies, which usually have a lot of data, offer useful information, but they often do not show how policies change and take effect over time.
A limited number of studies have quantitatively evaluated the effects of NEPHSP. These studies have shown that NEPHSP improves hypertension management outcomes, including blood pressure control, medication adherence, healthcare utilization, and lifestyle behaviors such as reduced alcohol consumption and increased physical activity using quasi-experimental designs including interrupted time series and difference-in-difference approaches.7,15–17 However, studies related to the socioeconomic well-being of NEPHSP coverage have focused primarily on inpatient out-of-pocket costs and outpatient out-of-pocket costs. While out-of-pocket costs are a crucial metric of financial protection, they do not capture the broader economic well-being of a household. If salaries are also going down, lowering medical costs may not lead to better overall living standards.18 The Engel coefficient, which looks at how much of a household’s income goes to food, is a better way to measure how well a household can handle economic shocks and how much money it has to spend on things that are not necessary, supported by empirical evidence.19,20 Furthermore, while the majority of current studies primarily focus on the effects of the NEPHSP on hypertension patients before 2015, there exists a significant deficiency in research evaluating its influence on hypertensive individuals subsequent to this timeframe. After 2015, NEPHSP constantly made changes and upgrades to keep up with the changing public health situation. Specifically, in 2015, the per capita funding allocated to village doctors for implementing basic public health services was increased by 5 yuan, a policy change aimed at incentivizing greater engagement from village healthcare providers.21 This financial incentive was meant to help close the gap between pay and the growing responsibility of managing public health. We believe that giving village doctors more money would encourage them to do better follow-ups for chronic diseases and get more people to get health screenings, which would make people trust and use village-level healthcare more.22,23 These changes probably brought forth new ways to stop, find, and manage high blood pressure. Consequently, it is imperative to conduct a study to ascertain if NEPHSP coverage can enhance hypertension management, medical care utilization, and the socioeconomic well-being of households affected by hypertension, thereby guiding health policy and optimizing the efficacy of intervention programs.
This study utilized individual-level data from the CHARLS and adopted a quasi-experimental research design to investigate the influence of NEPHSP coverage on hypertension management, medical care utilization and household socioeconomic well-being with hypertensive patients. The key contributions of our study are as follows: (1) We employed a two-way fixed-effects model, effectively adjusting for both time-invariant and observable variables to reduce biases and improve the reliability and validity of findings on the NEPHSP’s effectiveness. (2) We have expanded our analysis beyond conventional health metrics to encompass an evaluation of the impact on healthcare resource utilization and socioeconomic well-being, facilitating a more profound assessment of the NEPHSP coverage as a socioeconomic initiative with extensive implications for societal welfare. (3) Our study offers insights into the varying effects of NEPHSP coverage by thoroughly analyzing data from various demographics and regions. This helps identify areas of success and those that need more attention, which can help guide policy changes and resource allocation.
Materials and Methods
NEPHSP Implementation Timeline
The NEPHSP, started in 2009 as a key part of China’s healthcare reform, went through three editions. Its main goal was to create a standard framework for basic public health services. The first edition of the National Basic Public Service Specifications included 41 service items in 9 categories, such as managing health records, giving vaccines, and providing maternity and child health services. This edition’s goal was to test the framework’s viability and applicability through pilot programs in a few areas.24 After that, the program grew from 2012 to 2015. The second edition of the service standards were out in 2011. It included 55 elements in 14 categories to the service package. The main goal was to expand services to all provinces, with a focus on rural and underserved areas. In 2016, 85.46% of people had access to electronic health records, and 55.11% of people used them.24,25 The third phase, which started in 2017, grew from 41 products in 9 categories in 2009 to 55 items in 14 categories in 2017.26 A schematic diagram is shown in Figure S1.
Data Description
We used data from the CHARLS, a nationally representative survey of Chinese adults aged 45 years and older.27 Initiated in 2011, the study has conducted multiple waves of data collection, providing a comprehensive temporal analysis of health and retirement patterns. CHARLS employs a multistage stratified sampling method that is probability-proportional to size, guaranteeing representation of China’s varied regions. The sampling process involves randomized selection from county-level units throughout China, excluding Tibet, progressing to the selection of households and individuals aged 45 and above, along with their spouses. CHARLS encompasses a broad spectrum of subjects, collecting comprehensive data on demographics, health issues, chronic illnesses, healthcare usage, work status, and household economic situations.
In our study, we used data from 2011 to 2018 waves, with their harmonized data respectively to evaluate the impact of receiving NEPHSP-covered blood pressure measurements on hypertension management, medical care utilization and household socioeconomic well-being indicators among hypertensive patients since 2011. Due to the impact of COVID-19 in 2020, we observed that the 2020 wave questionnaire no longer included questions to identify individuals receiving blood pressure assessments covered by NEPHSP. Therefore, we did not include the 2020 wave data in our research.
Research Design
This study employed the DID approach, a quasi-experimental framework widely used to examine causal effects in public health studies.28 The DID approach estimates the causal effect of an intervention by comparing changes in outcomes over time between an intervention group and a comparison group, thereby controlling for unobserved time-invariant confounders and common temporal trends affecting both groups.29 In this study, the intervention consisted of blood pressure measurements covered by the NEPHSP. The construction of this variable is further explained in the “Independent variables” section.
The study sample selection process is summarized in Figure 1. First, we identified all individuals who participated in four waves (2011, 2013, 2015, and 2018) to ensure the construction of a balanced panel data. It should be noted that the fourth wave of data was collected in 2018 instead of 2017 due to adjustments in the official fieldwork schedule. Second, participants who had received NEPHSP-covered blood pressure measurements before 2015 were excluded from the study to ensure the intervention group consisted solely of individuals newly exposed to the NEPHSP after 2015. Third, participants diagnosed with hypertension in 2011 wave were included in the study. Hypertension was defined as meeting one of the following criteria: (i) having an average systolic blood pressure of 140 mmHg or higher, (ii) having an average diastolic blood pressure of 90 mmHg or higher, or (iii) with current use of antihypertensive medications (both Western and traditional Chinese medications) for hypertension management, consistent with WHO guidelines.30 It is important to note that for participants who had eaten, smoked, consumed alcohol, or performed vigorous physical activity within 30 minutes before blood pressure measurements, we marked their blood pressure data as missing, as these activities could interfere with the accuracy of the measurements. Finally, individuals with missing values on key variables were excluded from the study. The estimation of Engel coefficients and control rate utilized unbalanced panel data due to a high volume of missing variables. The final analytical sample included 774 participants (3,096 observations in total) who had completed all surveys and provided data for the primary study variables. For more details about the missing data and statistical power analysis, please refer to Supplementary materials B and Table S1 for more details.
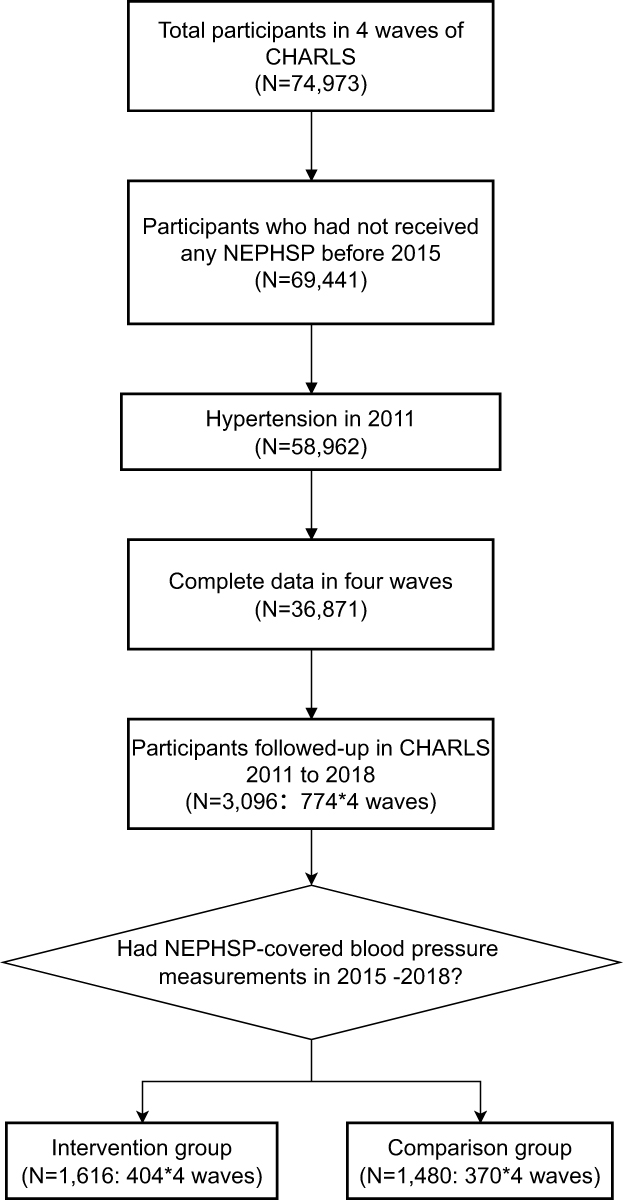 |
Figure 1 Sample selection procedure. The sample selection methodology identifies a cohort of individuals with hypertension who participated in blood pressure assessments funded by the NEPHSP during the period from 2015 to 2018. |
Measurements
Dependent Variables
The study assesses changes in the hypertension control rate, hypertension treatment rate, inpatient admissions, outpatient visits and household Engel coefficients among this cohort between 2015 and 2018. Aligning with previous studies,7,15,17 hypertension control status was defined as having either (1) an average systolic blood pressure below 140 mm Hg and an average diastolic blood pressure below 90 mm Hg, based on blood pressure measurements from 2011 to 2015 (Not assessed for 2018 due to data unavailability), or (2) a self-reported positive response to the question “Is your blood pressure generally under control?”. Respondents meeting either of these criteria were considered to have controlled hypertension. The treatment rate was characterized as the proportion of respondents who indicated that they utilized medication or other interventions to manage hypertension in the waves 2011 to 2018. In 2011, 2013 and 2015, we employed the question “Are you now taking any of the following treatments to treat or control your hypertension? (Check all that apply) Taking Chinese traditional medicine, taking Western modern medicine?” to assess the medication usage status of respondents. To evaluate people’s health awareness, utilizations of medical care were assessed using outpatient visits and inpatient admissions. Outpatient visits were defined as the answer of “How many times did you visit any medical facility last month?”. Inpatient admissions were defined as the answer of “How many times did you receive inpatient care over the past year?”. However, medical care utilization is influenced not only by health awareness but also by factors such as healthcare accessibility, socioeconomic status, and the severity of health conditions, all of which are included as control variables in the analysis. The household Engel coefficient was calculated using weekly household food consumption and annual non-food household expenditure from harmonized data. Given the relatively small variation in weekly food expenditures, weekly food expenses were annualized by multiplying by 52 and then divided by the sum of annual food and non-food expenditures to estimate the Engel coefficient.
Independent Variables
In this study, the intervention encompassed blood pressure screenings that were covered under the NEPHSP coverage from the 2015 wave through 2018 wave, we identify the intervention using the free of charge hypertension measurement as a proxy for NEPHSP-covered blood measurement. Specifically, we used “Since last interview time, have you had your blood pressure checked by a doctor or nurse? Yes or no” and “Do you have to pay for the blood pressure examination by community/village doctors? Yes or no” in 2018 questionnaire to identify those who received the NEPHSP service during 2015–2018. Only samples with the first question’s answer of yes and the latter one answer of no were considered to have been included in the NEPHSP hypertension management.
The validity of this proxy is supported by the following reasons: (1) It reflects NEPHSP-covered blood pressure measurement, which is the essential first step in the broader NEPHSP management process, even though it does not capture other aspects like follow-up or medication guidance. (2) Similar studies, such as Cui et al17 have used this same proxy to identify NEPHSP-covered services. (3) The service providers for both NEPHSP and the proxy are similar, as both are delivered by grassroots-level health providers, such as township health centers and village clinics, aligning with NEPHSP’s guidelines. Moreover, the two questions were asked to all participants, regardless of their health conditions, ensuring equal opportunities for inclusion in the NEPHSP group and minimizing bias from selective recommendations. Given that the NEPHSP aims to provide free blood pressure screenings to all eligible residents, this approach further reduces the likelihood of selection bias.
Control Variables
Following previous studies, the following variables were included in the regression as control variables: age, gender, educational attainment, marital status, residential type, residential region, hukou, whether covered by public health insurance, comorbidities. The descriptive analysis is shown in the Table 1. Among the control variables, comorbidities were defined as having more than one of the following diseases: hypertension, diabetes, dyslipidemia, cancer, lung disease, liver disease, heart disease, stroke, kidney disease, digestive disease, psych problem, memory problem, arthritis and asthma which are all most commonly considered 14 chronic diseases in literatures. For all variables used in the analysis, please refer to Table S2 for more details.
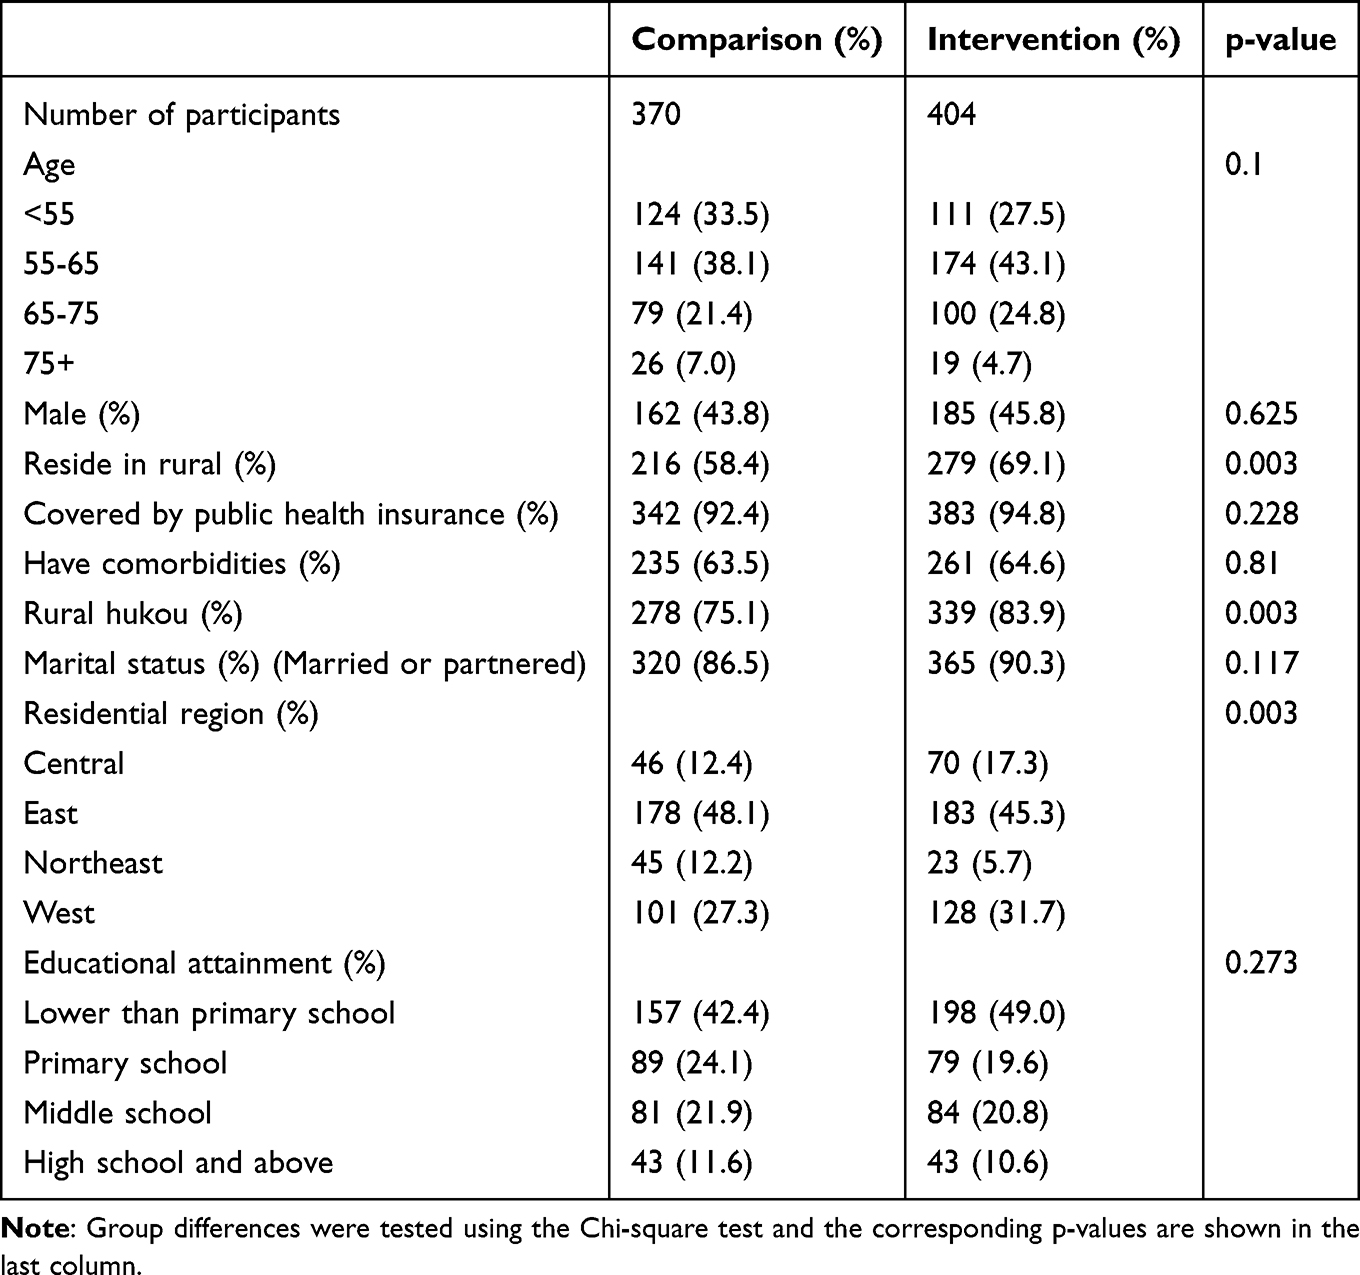 |
Table 1 Descriptive Statistics of the Main Variables (2011 Wave) |
Statistical Analysis
The DID approach was utilized to assess the average policy effect of NEPHSP participation, by comparing outcome changes between the intervention and comparison cohorts before and after policy implementation. This methodological framework allowed for the calculation of the intervention’s impact by determining the differential change in the intervention group pre- and post-policy enactment, juxtaposed against the analogous variation within the comparison group.31 The main regression model encapsulating this analysis is as follows:

Where  is the outcome variable of respondent i at time t;
  is the intervention dummy variable that equals 1 for the respondents who received NEPHSP-covered blood pressure measurements and 0 for the respondents who did not receive NEPHSP-covered blood pressure measurements;
  is a dummy variable that equals 0 denoting the period before the intervention (2011–2015) and 1 denoting the period after the intervention (2018), when the NEPHSP policy effect is evaluated;
  is the interaction of
  and
and  , with
  capturing the average treatment effect of the NEPHSP participation, defined as the differential change in outcomes between participants and non-participants after policy implementation, under the parallel trends assumption;
  is a set of control variables;
  and
and  are individual fixed effect and time fixed effect respectively; and
  is the error term.
In the parallel trend assumption test section, we used the following dynamic model to investigate whether the pre-trend of the dependent variables is parallel or not:

We set the 2015 wave as the baseline wave, and  represents the relative wave to it (wave 2018 means
  =1 and wave 2013 means
  =-1).
=-1).  captures the impact of the NEPHSP coverage in different waves.
To evaluate the robustness of our regression result, we evaluate the stability of the regression results from three distinct perspectives. First, from the perspective of model specification, we further control for the temporal trends of various provinces during the robustness test, as these trends may influence the results. Additionally, to reduce bias from observed confounders, we applied inverse probability weighting (IPW)32 using propensity scores estimated from a logistic regression of treatment status on baseline covariates measured in 2015. Individual weights were then constructed as the inverse of the predicted probability of receiving the observed treatment assignment. These weights were applied to subsequent analyses to create a pseudo-population in which the distribution of measured baseline covariates is independent of treatment assignment. To assess covariate balance, we compared differences in baseline characteristics between intervention and comparison groups before and after weighting, using both regression-based tests and standardized mean differences.33,34 Furthermore, to strengthen the credibility of the research design and the causal inferences derived from our findings, we conduct a placebo test utilizing a randomly generated pseudo-intervention group alongside a pseudo-comparison group, applying the same DID methodology used in our primary regression analysis. If the intervention aimed at blood pressure measurement were the sole factor contributing to an increase in the hypertension management, medical care utilization and household socioeconomic well-being, we would not anticipate observing any significant effects from these pseudo-interventions. The placebo test was repeated 500 times, generating 500 pairs of pseudo-intervention and comparison groups.
Results
Demographic and Socioeconomic Characteristics
Table 1 presents the summary statistics of the study sample at baseline. Among 774 hypertensive patients, 404 (52.2%) were in the intervention group, and 370 (47.8%) were in the comparison group. Most of the respondents in the intervention group were 55–65 (43.1%), female (54.2%), covered by Public Health Insurance Program (94.8%), had an education level lower than primary school (49.0%), were married or partnered (90.3%), had an rural hukou (83.9%), resided in a rural area (69.1%) and east region (45.3%), and had more than one disease (64.6%).
Comparison Before and After Intervention
Figure 2 illustrates the trends in hypertension management, medical care utilization and household socioeconomic well-being, measured by five dependent variables. From wave 2011 to 2018, the hypertension control rate consistently increased, with a notable decrease observed between 2015 and 2018. The intervention group exhibited a rising trend in treatment rate, while the comparison group experienced a small increase during the same timeframe. The inpatient admissions over the 2015 wave in the intervention group increased markedly, whereas the comparison group displayed a more gradual change. Outpatient visits demonstrated a downward trend in both groups. Besides, the mean Engel coefficient exhibited a decreasing trend over time in both groups.
 |
Figure 2 Time trends of dependent variables (grouped by intervention group and comparison group). The X-axis denotes different years; Y-axis shows the corresponding average outcome. |
Parallel Trend Assumption Test
We conducted a parallel trend regression analysis, using the 2015 wave as reference point and including data from both the 2011 and 2018 waves. The model is outlined by Equation (2). As depicted in Figure 3, a comparison with the 2015 wave reveals that no significant differences were identified across all five dependent variables between the intervention and comparison groups in the 2011 and 2013 wave.
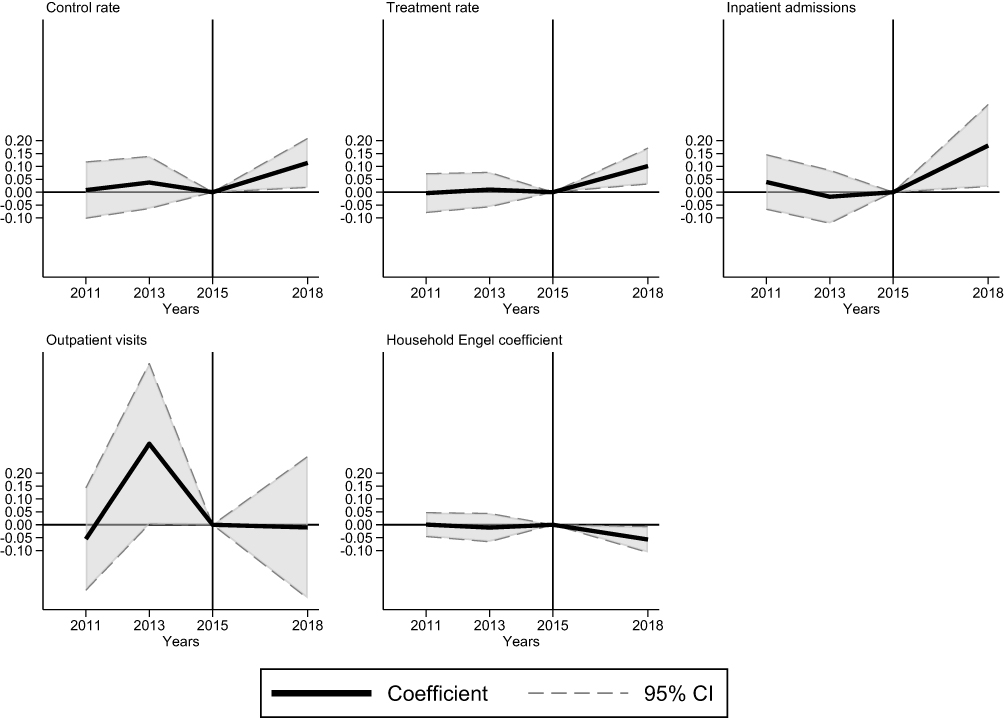 |
Figure 3 Dynamic DID regression result of the five dependent variables. The Y-axis represents the estimated coefficients for each year. The solid line displays the point estimates, while the dashed lines indicate the corresponding 95% confidence intervals. The year 2015 is set as the reference year. Notably, there were no statistically significant differences between the treatment and control groups in 2011 and 2013 across all variables, suggesting the parallel trends assumption holds. By 2018, however, four of the five variables show statistically significant differences between the groups, with outpatient visits being the exception. |
The Impacts of the NEPHSP in DID Estimation
Table 2 presents the regression results of static DID, with columns 1 to 2 showing the results on hypertension management, column 3 to 4 showing the results on medical care utilization, column 5 showing the results on household socioeconomic well-being.
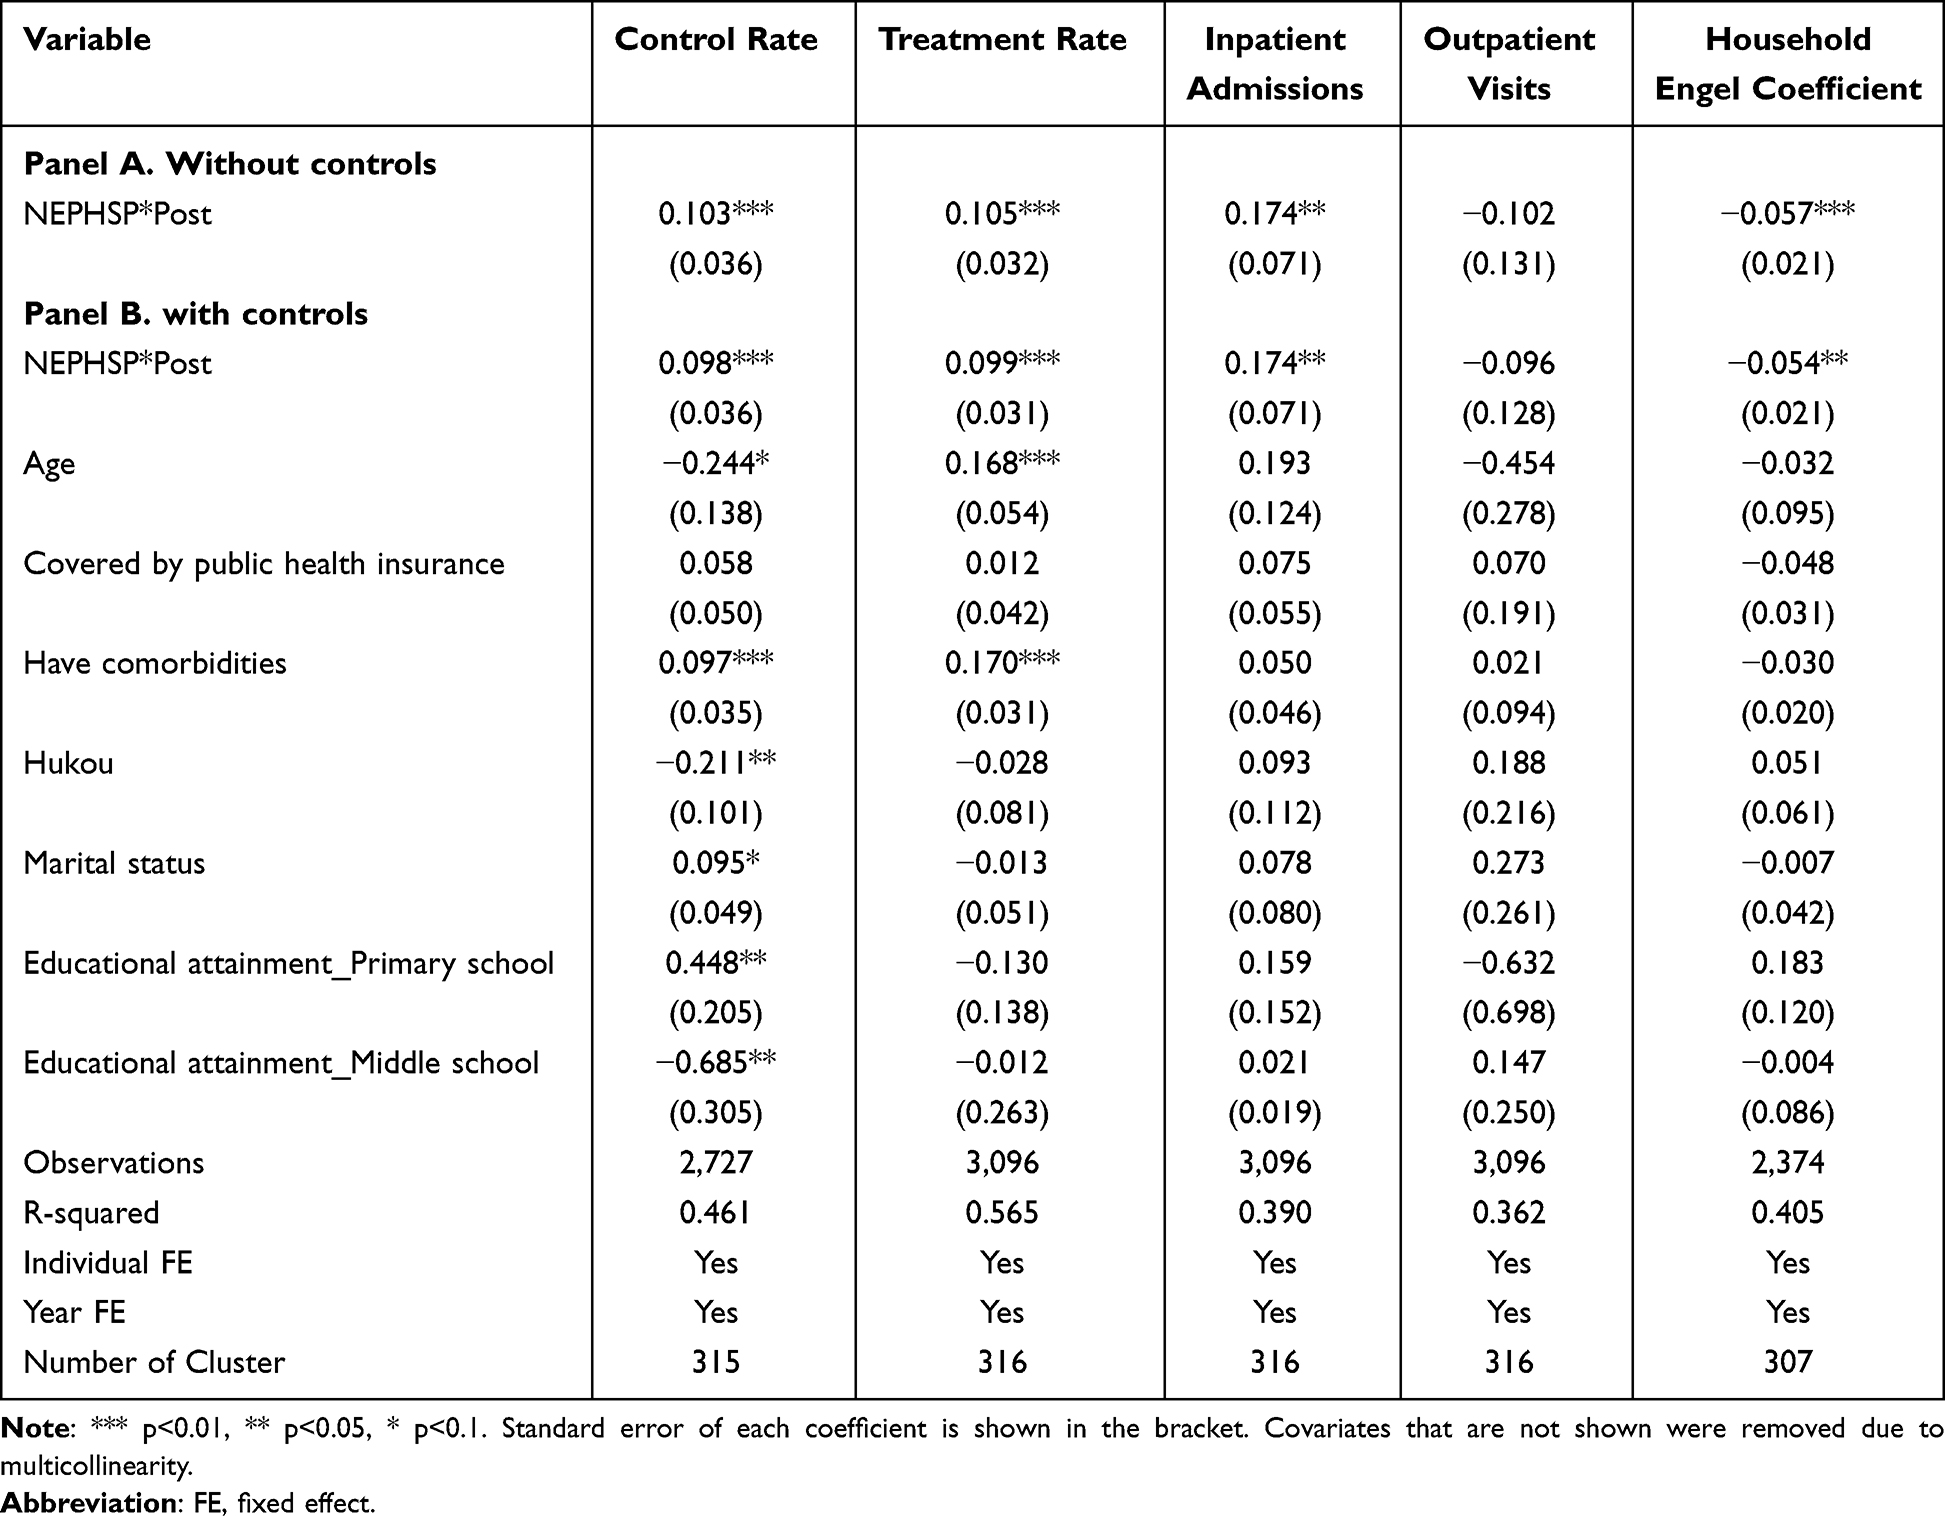 |
Table 2 Regression Result of the Static DID Model |
To accurately assess the effect of the NEPHSP coverage on the dependent variable, we compared the effect of whether to include control variables on the economic significance and statistical significance of the regression coefficients of the DID term. The results indicate a minimal effect, which somewhat suggests that the effect of the NEPHSP coverage on the dependent variable is robust.
As shown in columns 1 to 2, NEPHSP-covered blood pressure measurements increased hypertension control rate by 9.8% (2.7–16.9%, P < 0.01) and hypertension treatment rate by 9.9% (3.8–16.1%, P < 0.01). As shown in columns 3, NEPHSP-covered blood pressure measurements increased the inpatient admissions by 0.17 (0.03–0.31, P < 0.05) per year. Outpatient visits last month, as shown in column 4, did not show a significant effect. As shown in column 5, NEPHSP-covered blood pressure measurements reduced the household Engel coefficient by 5.4% (1.2–9.6%, P < 0.05).
Heterogeneity Tests
It is essential to identify the population for whom the NEPHSP coverage has the most significant impact. This section examines the heterogeneity in demographic characteristics, including age, residential type, and regions, as shown in Figure 4.
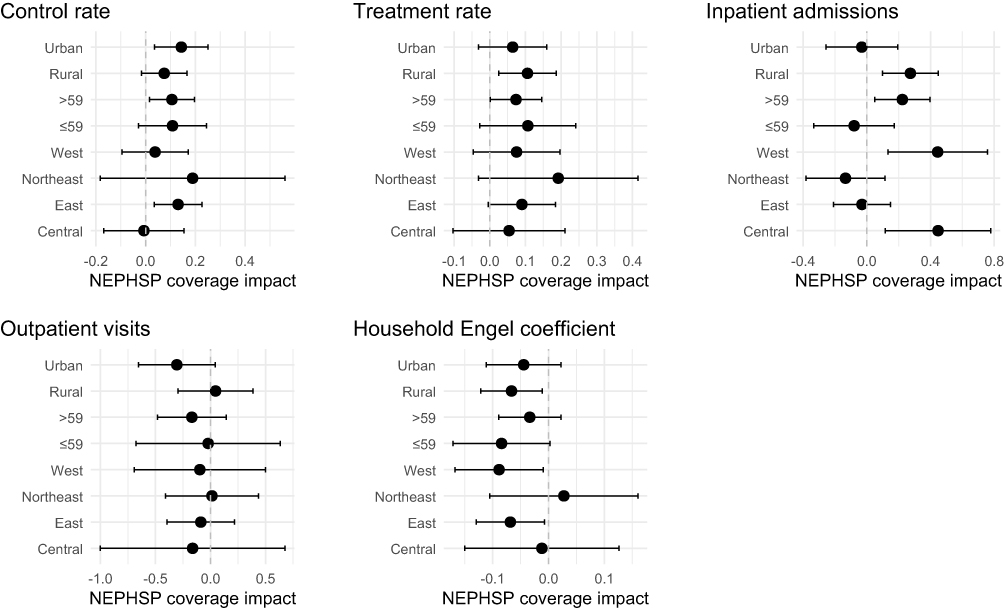 |
Figure 4 NEPHSP coverage impact on control rate, treatment rate, inpatient admissions, outpatient visits and household Engel coefficients, by subgroups. Heterogeneity is categorized by residential type (Rural, Urban), age (Above 59, 59 and below) and geographic location (West, East, Central and Northeast) groups. Each dot represents the estimated effect size, with horizontal lines indicating 95% CI. A dashed vertical line at zero denotes no effect. |
Age significantly influences hypertension, and adherence to health education varies across age groups, potentially leading to heterogeneity in the effects of NEPHSP coverage.35 The results show that for those over 60 years of age, they have higher statistical significance in hypertension control rates and inpatient admissions and a weaker impact on the treatment rates as well as in the Engel’s coefficient compared to those under 59 years of age. In terms of residential type, rural residents have greater impact on treatment rate, inpatient admissions and household Engel coefficient while urban residents have greater impact on control rate. In terms of regions, NEPHSP coverage achieved largest impacts on hypertension control and treatment rates in the eastern region, following by western regions and central regions. The Northeastern region shows the widest confidence interval, which can be attributed to the relatively small number of provinces classified under this region in China.
We also conducted pairwise marginal comparisons of the treatment effect across regions, applying Bonferroni adjustment for multiple testing, which is shown in Table S3. Compared with Central, the East and the Northeast exhibit significantly larger reductions in inpatient admissions associated with the treatment (East vs Central: −0.322, p < 0.1; Northeast vs Central: −0.466, p < 0.05), while the West shows no significant difference versus Central. The West exceeds the Northeast on the inpatient admissions (West vs Northeast: 0.521, p < 0.01), and West also shows a marginally larger inpatient effect than East (West vs East: 0.377, p < 0.1). Age heterogeneity indicates that individuals aged ≤59 experienced a significantly larger treatment-related reduction in inpatient admissions than those >59 (−0.158, p < 0.05). Finally, rural–urban comparisons reveal a lower control-rate improvement in rural areas but a higher treatment-rate enhancement.
Robustness Check
Model Setting
The results in Table 3 show that the coefficients obtained after adding the fixed effect of province changes over time are not very different from the results of the benchmark regression. This suggests that after controlling for all biases as much as possible, the inclusion of the NEPHSP has a significant impact on hypertension control rate, treatment rate, inpatient admissions, and household socioeconomic well-being. The result for outpatient visits remained insignificant.
 |
Table 3 Model Setting Test |
IPW Analysis
As shown in Table S4, after applying weighting, the standardized differences across all covariates were reduced, with all standardized differences below 1%, indicating good covariate balance between the treatment groups. The weighted regression coefficients were close to zero, and none of the associations remained statistically significant (all p-values > 0.90). These results indicate that IPW effectively achieved covariate balance between the intervention groups. We also implement DID after IPW. As it can be seen from the Table 4, the coefficients of four dependent variables are still statistically significant, and the coefficient for outpatient visits is still nonsignificant.
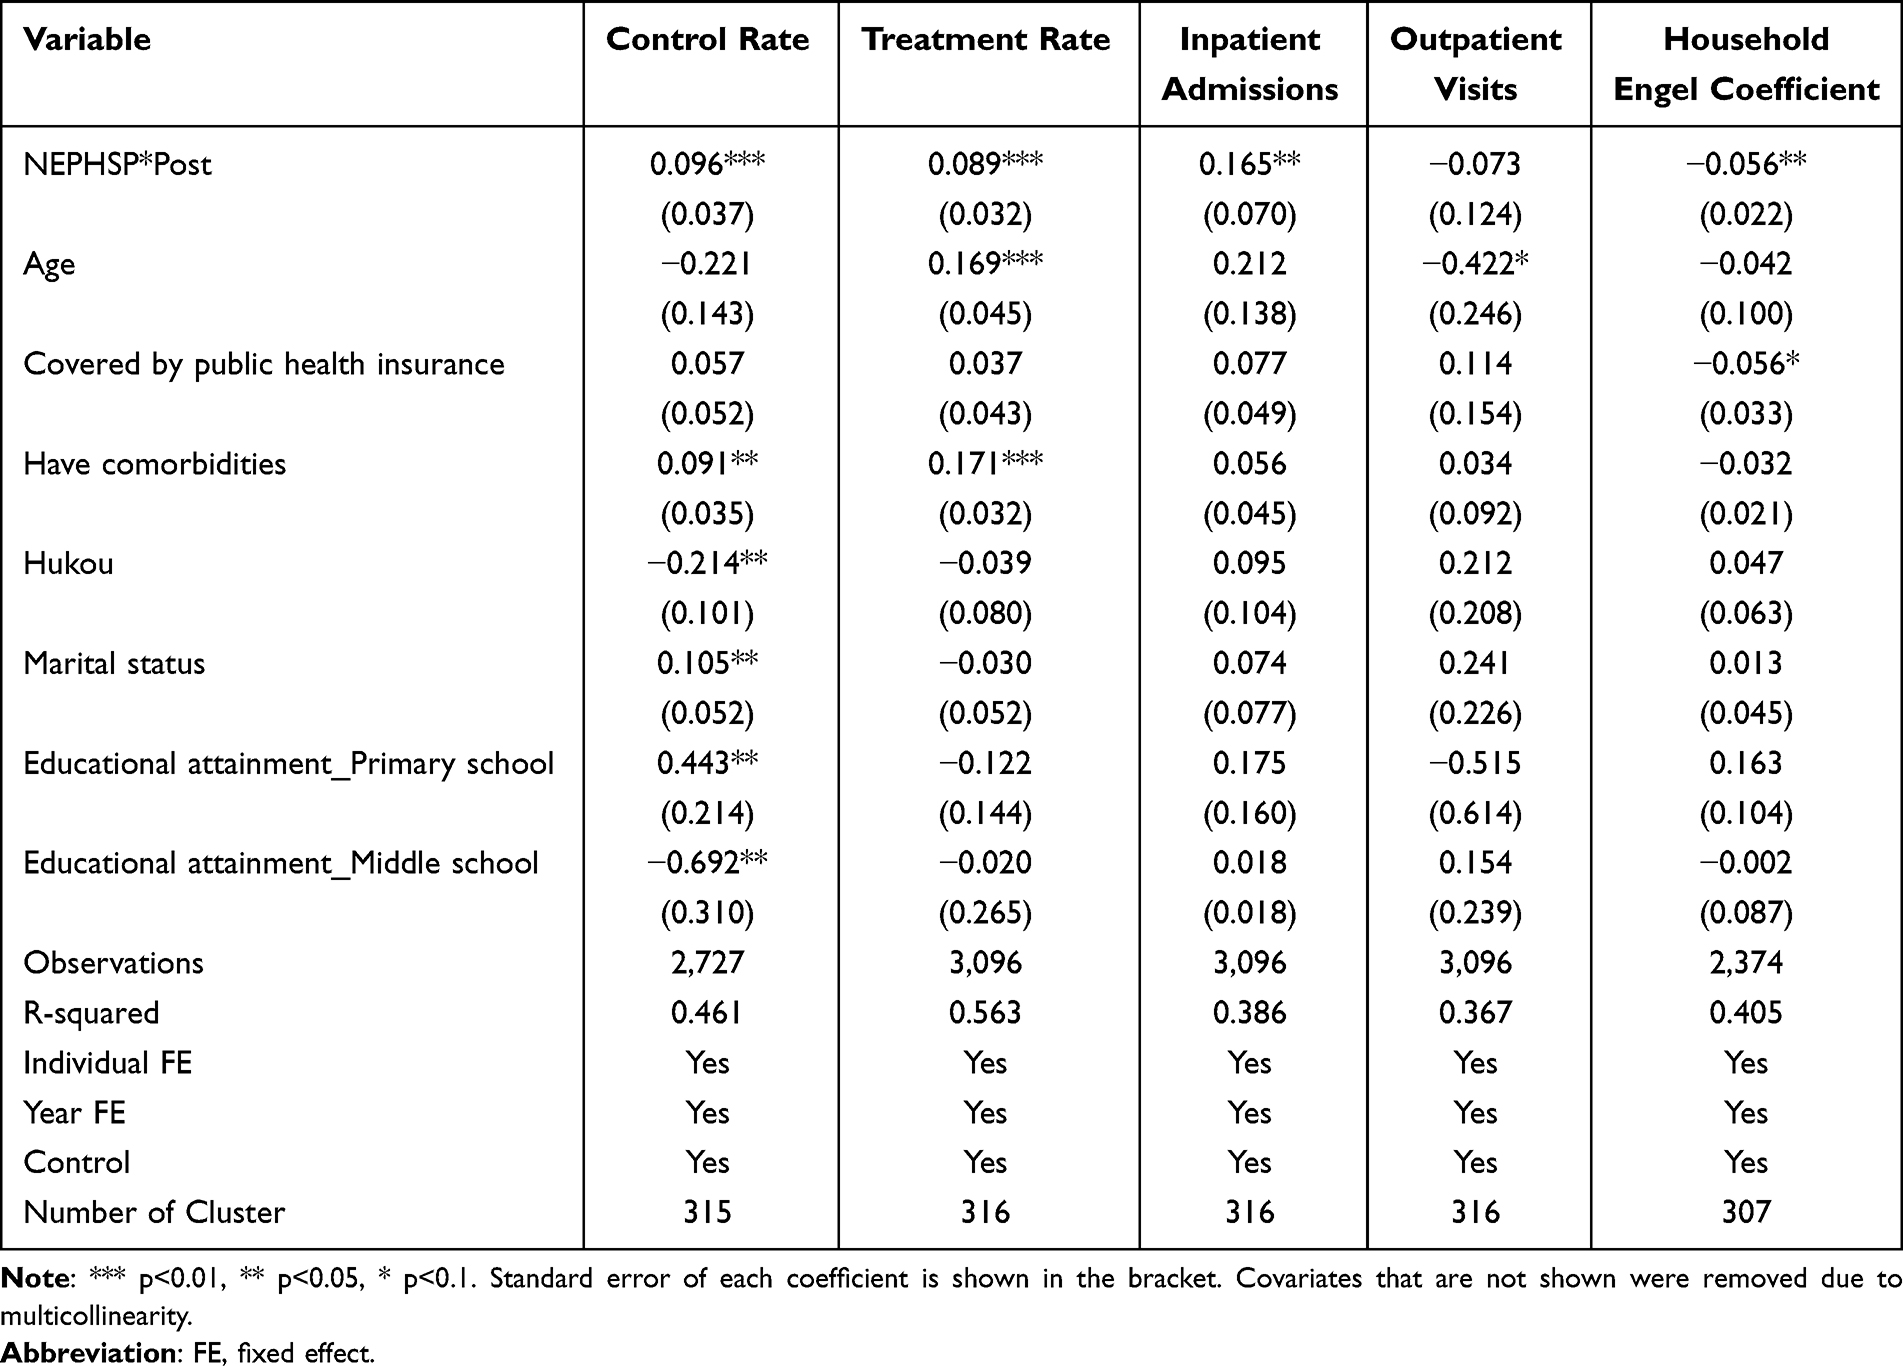 |
Table 4 The Effects of the NEPHSP in IPW–DID Estimation |
Placebo Test
Figure 5 reports the estimated coefficients of NEPHSP*Post from all pseudo-intervention DID regressions. The results indicated that the coefficients for control rate, treatment rate, inpatient admissions, and household Engel coefficient under the pseudo-interventions are concentrated around zero. In contrast, the estimate corresponding to the actual intervention deviates markedly from zero, thereby strengthening the causal relationship between the covered blood pressure measurement intervention and the improvements in these outcome variables. It is noteworthy that the coefficient of outpatient visits is relatively close to zero, suggesting that the NEPHSP coverage may not exert a substantial impact on outpatient care utilization.
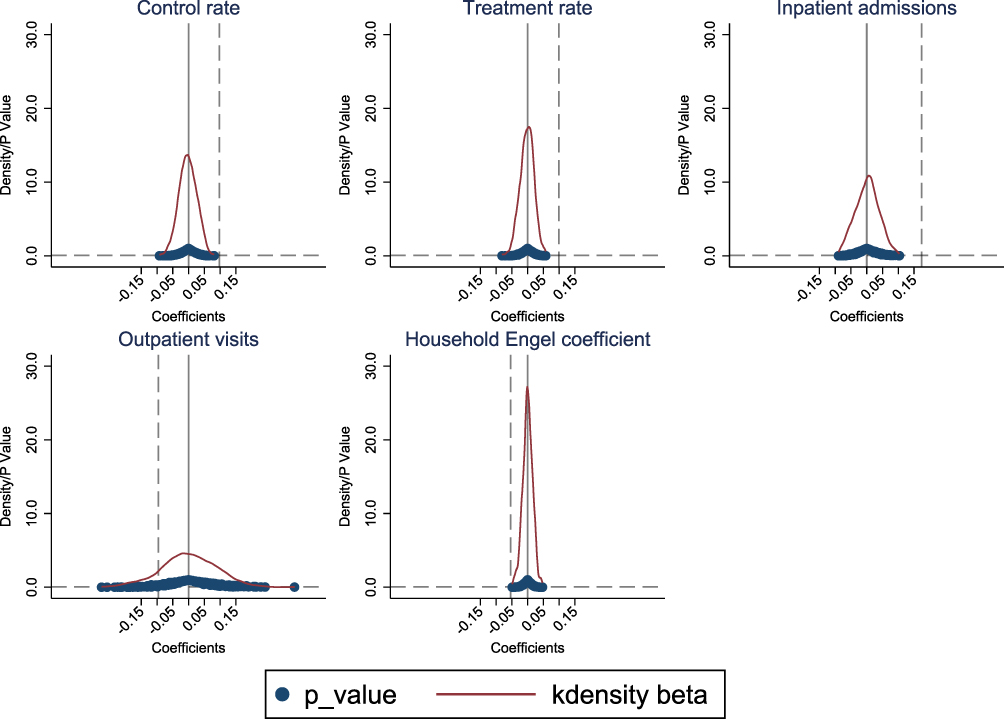 |
Figure 5 Placebo test. The X-axis illustrates the estimated coefficients for the variable “NEPHSP*Post”, while the Y-axis denotes the kernel density value alongside the P value. The curve depicted represents the kernel density distribution of the estimated coefficients, with the blue dot indicating the P value associated with the estimated coefficient. The vertical grey dashed lines signify the coefficients and P value for NEPHSP*Post derived from the actual intervention in our primary regression analyses. |
Discussion
Our findings indicate that the NEPHSP in China is an effective public health intervention for improving hypertension control and alleviating socioeconomic burdens among middle-aged and older persons. In addition to these health benefits, NEPHSP coverage is associated with changes in healthcare utilization patterns, including increased inpatient service use and improved disease management. Together, these results underscore the importance of the NEPHSP in promoting preventive health behaviors and more effective resource allocation in an aging population facing a growing burden of noncommunicable diseases, and provide empirical evidence to inform future program refinement.
Our study finds that NEPHSP coverage has led to a substantial rise in hospital admissions, but a slight drop in outpatient visits. Several mechanisms may explain this trend. First, patients may prefer inpatient care because they think hospital-based treatment is more complete and of higher quality. This is a common occurrence in the Chinese healthcare system, where higher-tier hospitals are often more trusted than primary care facilities.36 Second, the rise in inpatient use may be due to changes on the supply side of the NEPHSP, especially better screening, follow-up, and referral practices by primary care clinicians after 2015, when policy incentives were put in place. Better case detection may have found diseases that were not diagnosed before or were not being treated well and sent these individuals to the hospital for therapy.37 Finally, better disease management and risk stratification under NEPHSP may have helped find individuals with more serious clinical conditions who really needed to be hospitalized instead of being treated as outpatients. From this point of view, the rise in hospital admissions may be a sign that people are getting better care, not that the healthcare system is being overworked. In this sense, a strengthened gatekeeping role of primary care, treating low-acuity cases in the community while referring high-severity cases, could explain why admissions rose without an increase in outpatient visits.
However, this rise in inpatient utilization warrants caution, as it could suggest potential allocative inefficiencies where conditions treatable in outpatient settings are managed via hospitalization. This trend toward inpatient care is in line with national health statistics from 2013 to 2015. According to the Chinese Statistical Bulletin on the Development of Health and Family Planning, the rate of hospitalizations rose from 14.1% of all records in 2013 to 15.3% in 2015. This signals an increasing burden on the tertiary healthcare system. While precise data on outpatient visits during this specific period remains limited, the observed pattern highlights the critical need to balance the expansion of public health coverage with efficient resource allocation.38 Future reforms should prioritize strengthening primary care capacity to manage chronic conditions effectively, thereby mitigating unnecessary reliance on inpatient services.
For the first time, this study utilizes the household Engel’s coefficient, a recognized economic metric of household welfare,39 to evaluate alterations in the socioeconomic well-being of households impacted by hypertension under the NEPHSP for the first time. Our findings suggest that NEPHSP’s provision of standardized hypertension treatment services may reduce normal out-of-pocket healthcare costs, hence potentially alleviating direct financial burdens on households. At the same time, better access to primary care may minimize the risk of serious complications,40 which would lower the chance of having to pay for huge medical bills41 and helping preserve household savings. Moreover, better health status may improve the productivity and earning capacity42 of patients or their caregivers, while reduced health-related uncertainty could shift household spending priorities away from precautionary health savings toward consumption, including improved food quality.43 The results are consistent with findings from other studies, indicating that health interventions can enhance the financial stability of families.44 Specifically, fewer catastrophic health costs have been found to help people spend their extra money better, as evidenced by lower Engel’s coefficients.45 This shows how important public health programs like NEPHSP can be as part of integrated social policy frameworks that bring together health and economic development goals.46
Heterogeneity studies indicated that NEPHSP coverage had different effects on people of different ages and in different areas. This information can help policymakers focus their efforts. Younger participants (under 59 years old) saw bigger changes in their treatment rate than older ones. This means that health education and intervention measures work better on younger people. People who lived in cities were better able to regulate their high blood pressure and had fewer hospital stays than people who lived in rural regions. This is probably because healthcare is easier to get in cities. This shows that we need to make efforts to improve access to healthcare and literacy in rural communities. The program had a bigger impact on the control rate in the west and east than it did in the center. This highlights to differences in socioeconomic status and infrastructure that need to be fixed to make sure that everyone in the country has access to the same level of healthcare.
The results of this study highlight important policy implications for the future enhancement of the NEPHSP. First, the rise in inpatient admissions demonstrates that the NEPHSP coverage has motivated hypertensive patients to pursue better care. However, this trend also puts more stress on hospital resources. To address this problem, we advise that policymakers improve outpatient services and preventive care. This could help reduce the number of people who need to stay in hospital. Also, investment in primary healthcare infrastructure, particularly in rural areas, can assist make this change go more smoothly.47 Second, the differences in NEPHSP coverage impacts across different age groups, residential types, and regions highlight the need for targeted interventions. Younger people and people who live in rural areas see the biggest improvements in treatment rates from the program. This suggests that there are still gaps between the need for and use of health education, which means that more attention needs to be paid to migrants with low levels of education.48 Third, the decrease in household Engel coefficients indicates that the NEPHSP coverage has made it easier for low-income families to pay for hypertension, which is an important way to help their socioeconomic well-being. The finding underscores the necessity for ongoing monitoring and evaluation of public health programs to continually assess their impact not just on health but on socioeconomic well-being outcomes.
Our study has the following limitations. First, using the availability of free blood pressure assessments at community doctor or village doctor as an inclusion criterion for in the hypertension management component of the NEPHSP could lead to skewed estimates of the NEPHSP coverage’s effects. If individuals receiving free measurements outside the NEPHSP are misclassified as being covered by the program, this non-differential misclassification of exposure would probably make the estimated effects less significant, which means that our findings may represent a conservative estimate of the real benefits of NEPHSP coverage. Second, recall bias could affect the data utilized in the NEPHSP program because participants may not precisely remember or report their free blood measurement. Third, the lack of data on medical examinations in 2018 resulted in a modified criterion for detecting hypertension relative to 2011, 2013, and 2015, potentially introducing measurement-related bias in assessing the impact of NEPHSP coverage. Fourth, the analytical sample is restricted to individuals who were observed in all four CHARLS waves (2011–2018), which may introduce survival and attrition bias. Future studies using imbalanced panels or administrative health records may facilitate a more comprehensive evaluation of the NEPHSP’s effects. Despite these unavoidable limitations, the robust analysis in the study demonstrates that these discrepancies have minimal impact on the statistical and economic interpretations of the DID results, which keeps the NEPHSP coverage’s causal impacts sound.
Conclusions
In China, the introduction of the NEPHSP has led to improvements in blood pressure control rates and medication adherence among hypertensive patients. This indicates that basic public health services are beneficial to patients with chronic diseases. The NEPHSP coverage has also improved household socioeconomic well-being by reducing the financial strain associated with hypertension management, which is an important step in avoiding medical poverty. However, these benefits were also accompanied by a significant rise in hospital admissions, suggesting potential unintended consequences, like increased pressure on the healthcare system. Heterogeneity in program effects also deserves attention. As we found that basic public health services in the Northeast region and rural areas still need to be further strengthened. Finally, the implementation of the NEPHSP in China offers not only valuable lessons, but also important cautions, for other developing countries seeking to expand essential public health services. Similar initiatives should be coupled with techniques to regulate subsequent hospital utilization and be intentionally designed to reduce socioeconomic, regional, and urban–rural disparities in access and effectiveness.
Abbreviations
CHARLS, China Health and Retirement Longitudinal Study; NEPHSP, National Essential Public Health Service Program; CVD, Cardiovascular disease; DID, Difference-in-Differences; UHC, Universal Health Coverage; PSM-DID, Propensity Score Matching with Difference-in-Differences.
Data Sharing Statement
The authors do not have permission to share data.
Ethics Approval and Consent to Participate
As per the “Measures for Ethical Review of Life Science and Medical Research Involving Human Subjects” (February 18, 2023), the research qualifies for exemption under item [1 or 2] of Article 32. Specifically, analysis with no direct interaction with participants using anonymized data. Therefore, no additional ethical review or approval was required from our institution. Ethical approval for collecting data on human subjects was obtained from the Biomedical Ethics Review Committee of Peking University (IRB00001052-11015). Participants gave informed consent to participate in the study before taking part.
Acknowledgments
We thank the CHARLS research and field team and every respondent in the study for their contributions. For the publication fee we acknowledge financial support by Heidelberg University.
Funding
The study was supported by the Noncommunicable Chronic Diseases–National Science and Technology Major Project (Project Number 2023ZD0506000), and the European Commission through Horizon Europe “Population Medicine and Sustainable Development: European Opportunities in collaborating with China to improving global health” (HORIZON-MSCA-2021-SE-01; Project Number 101086139-PoPMeD-SuSDeV).
Disclosure
All authors declare no competing interests in this work.
References
1. World Health Organization. Global report on hypertension 2025: high stakes–turning evidence into action. World Health Organization; 2025.
2. Collaboration NCDRF. Worldwide trends in hypertension prevalence and progress in treatment and control from 1990 to 2019: a pooled analysis of 1201 population-representative studies with 104 million participants. Lancet. 2021;398(10304):957–17. doi:10.1016/S0140-6736(21)01330-1
3. Zhang M, Shi Y, Zhou B, et al. Prevalence, awareness, treatment, and control of hypertension in China, 2004-18: findings from six rounds of a national survey. BMJ. 2023;380:e071952. doi:10.1136/bmj-2022-071952
4. China PCG, Zhou T, Wang Y, et al. Primary care institutional characteristics associated with hypertension awareness, treatment, and control in the China PEACE-million persons project and primary health-care survey: a cross-sectional study. Lancet Glob Health. 2023;11(1):e83–e94. doi:10.1016/S2214-109X(22)00428-4
5. Cao X, Wang X, Tian Y, et al. Trends and sociodemographic patterns in hypertension prevalence and treatment in China. Med. 2025;6(11).
6. Liu M, He X, Yang X, Wang Z. 2024 annual report on cardiovascular health and diseases in China: data and trend. Chin Med J. 2025;138(23):3037–3049. doi:10.1097/CM9.0000000000003902
7. Zhang D, Pan X, Li S, et al. Impact of the National Essential Public Health Services Policy on hypertension control in China. Am J Hypertens. 2017;31(1):115–123. doi:10.1093/ajh/hpx139
8. Chen Z. Launch of the health-care reform plan in China. Lancet. 2009;373(9672):1322–1324. doi:10.1016/S0140-6736(09)60753-4
9. Yip W, Hsiao W. China’s health care reform: a tentative assessment. China Econom Rev. 2009;20(4):613–619. doi:10.1016/j.chieco.2009.08.003
10. Lili YOU, Zhao J, Chen X, et al. National Essential Public Health Services Programs over the past decade research report two: progress and achievements of the implementation of National Essential Public Health Services Programs over the past decade. Chinese General Pract. 2022;25(26):3209–3220. doi:10.12114/j.issn.1007-9572.2022.0407
11. Liu L, You L. Equity of implementing Universal Health Coverage With China’s National Essential Public Health Service Program in 2019. Int J Integrat Care. 2025;25(S1):020. doi:10.5334/ijic.ICIC24020
12. Jithitikulchai T, Feldhaus I, Bauhoff S, Nagpal S. Health equity funds as the pathway to universal coverage in Cambodia: care seeking and financial risk protection. Health Policy Plan. 2021;36(1):26–34. doi:10.1093/heapol/czaa151
13. Kaiser AH, Okorafor O, Ekman B, Chhim S, Yem S, Sundewall J. Assessing progress towards universal health coverage in Cambodia: evidence using survey data from 2009 to 2019. Soc Sci Med. 2023;321:115792. doi:10.1016/j.socscimed.2023.115792
14. Mao W, Tang Y, Tran T, Pender M, Khanh PN, Tang S. Advancing universal health coverage in China and Vietnam: lessons for other countries. BMC Public Health. 2020;20(1):1791. doi:10.1186/s12889-020-09925-6
15. Xue L, Sui M, He Y, Li H, Ying X. The impact of increasing expenditure on National Essential Public Health Services on the medical costs of hypertension in China: a difference-in-difference analysis. PLoS One. 2022;17(11):e0278026. doi:10.1371/journal.pone.0278026
16. Xiong S, Jiang W, Zhang X, et al. Strengthening China’s National Essential Public Health Services Package for hypertension and diabetes care: protocol for an interrupted time series study with mixed-methods process evaluation and health economic evaluation. BMC Public Health. 2024;24(1):2563. doi:10.1186/s12889-024-20027-5
17. Cui C, Zhang Y, Ding R, He P. Impact of the Essential Public Health Service program on financial protection and health outcomes among hypertensive patients: a quasi-experimental study in China. Soc Sci Med. 2024;345:116705. doi:10.1016/j.socscimed.2024.116705
18. Grootaert C. The conceptual basis of measures of household welfare and their implied survey data requirements. Rev Income Wealth. 1983;29(1):1–21.
19. Sun K-A, Moon J. Relationship between subjective health, the Engel coefficient, employment, personal assets, and quality of life for Korean people with disabilities. Healthcare. 2023;11(22):2994.
20. Moon J, Hwang J, Lee WS. Relationship between the Engel coefficient, life satisfaction, and subjective health for senior citizens in Korea: moderating effect of COVID-19. Behav Sci. 2022;13(1):22. doi:10.3390/bs13010022
21. Lili YOU, Xinyue C, Linghe Y, et al. National Essential Public Health Services Programs over the past decade research report three: challenges and recommendations of implementation National Essential Public Health Services Programs over the past decade. Chinese General Pract. 2022;25(26):3221.
22. Li T, Lei T, Xie Z, Zhang T. Determinants of basic public health services provision by village doctors in China: using non-communicable diseases management as an example. BMC Health Serv Res. 2015;16(1):42. doi:10.1186/s12913-016-1276-y
23. Ding Y, Smith HJ, Fei Y, et al. Factors influencing the provision of public health services by village doctors in Hubei and Jiangxi provinces, China. Bull World Health Organ. 2013;91:64–69. doi:10.2471/BLT.12.109447
24. Fang G, Yang D, Wang L, Wang Z, Liang Y, Yang J. Experiences and challenges of implementing universal health coverage with China’s national basic public health service program: literature review, regression analysis, and insider interviews. JMIR Public Health Surveill. 2022;8(7):e31289. doi:10.2196/31289
25. Yang L, Sun L, Wen L, et al. Financing strategies to improve essential public health equalization and its effects in China. Int J Equity Health. 2016;15(1):194. doi:10.1186/s12939-016-0482-x
26. Wang L, Wang Z, Ma Q, Fang G, Yang J. The development and reform of public health in China from 1949 to 2019. Global Health. 2019;15(1):45. doi:10.1186/s12992-019-0486-6
27. Zhao Y, Hu Y, Smith JP, Strauss J, Yang G. Cohort profile: the china health and retirement longitudinal study (CHARLS). Int J Epidemiol. 2014;43(1):61–68. doi:10.1093/ije/dys203
28. Wing C, Simon K, Bello-Gomez RA. Designing difference in difference studies: best practices for public health policy research. Ann Rev Public Health. 2018;39(1):453–469. doi:10.1146/annurev-publhealth-040617-013507
29. Stuart B, Loh FE, Roberto P, Miller L. Incident user cohorts for assessing medication cost-offsets. Health Serv Res. 2014;49(4):1364–1386. doi:10.1111/1475-6773.12170
30. Collaboration NCDRF. Long-term and recent trends in hypertension awareness, treatment, and control in 12 high-income countries: an analysis of 123 nationally representative surveys. Lancet. 2019;394(10199):639–651. doi:10.1016/S0140-6736(19)31145-6
31. Pan Y, Zhong WF, Yin R, et al. Does direct settlement of intra-province medical reimbursements improve financial protection among middle-aged and elderly population in China? Evidence based on CHARLS data. Soc Sci Med. 2022;308:115187. doi:10.1016/j.socscimed.2022.115187
32. Robins JM, Hernan MA, Brumback B. Marginal structural models and causal inference in epidemiology. Epidemiology. 2000;11(5):550–560. doi:10.1097/00001648-200009000-00011
33. Austin PC, Stuart EA. Moving towards best practice when using inverse probability of treatment weighting (IPTW) using the propensity score to estimate causal treatment effects in observational studies. Stat Med. 2015;34(28):3661–3679. doi:10.1002/sim.6607
34. Kainz K, Greifer N, Givens A, et al. Improving causal inference: recommendations for covariate selection and balance in propensity score methods. J Soc Soc Work Res. 2017;8(2):279–303. doi:10.1086/691464
35. Levinthal BR, Morrow DG, Tu W, Wu J, Murray MD. Cognition and health literacy in patients with hypertension. J Gen Intern Med. 2008;23(8):1172–1176. doi:10.1007/s11606-008-0612-2
36. Li B. From habit to justification: a dual process theory approach to primary care bypassing in China. Health Care Anal. 2025;1–19.
37. Xiong S, Jiang W, Meng R. Factors associated with the uptake of national essential public health service package for hypertension and type-2 diabetes management in China’s primary health care system: a mixedmethods study. Lancet Regional Health-Western Pacific. 2023;31:100664. doi:10.1016/j.lanwpc.2022.100664
38. Chu H, Yang C, Lin Y, et al. Hospitalizations of chronic dialysis patients: a National Study in China. Kidney Dis. 2023;9(4):298–305. doi:10.1159/000530069
39. Chen M. Engel’s law in China: some new evidence. Rev Dev Econom. 2022;26(3):1640–1662.
40. Silva GS, de Andrade JBC, Martins EB, Santo K, Julia Machline-Carrion M. Blood pressure management to prevent recurrent stroke: current evidence and perspectives. Npj Cardiovascular Health. 2024;1(1):18. doi:10.1038/s44325-024-00021-x
41. Zhai X, Zhou Z, Liu G, et al. Catastrophic health expenditure of households with hypertension: a comparative study in China. Front Public Health. 2023;11:1176170. doi:10.3389/fpubh.2023.1176170
42. Pintor MP, Fumagalli E, Suhrcke M. The impact of health on labour market outcomes: a rapid systematic review. Health Policy. 2024;143:105057.
43. Anquan Z, Wanying Z, Ruoxuan H, Lailiang Z. Importance of precautionary savings for urban Chinese households. Rev Econom Household. 2024;1–25.
44. Wang Y, Jin Z, Yuan Y. The consequences of health shocks on households: evidence from China. China Econom Rev. 2023;79:101969. doi:10.1016/j.chieco.2023.101969
45. Kim Y, Yang B. Relationship between catastrophic health expenditures and household incomes and expenditure patterns in South Korea. Health Policy. 2011;100(2–3):239–246. doi:10.1016/j.healthpol.2010.08.008
46. Pettigrew LM, De Maeseneer J, Anderson MI, Essuman A, Kidd MR, Haines A. Primary health care and the sustainable development goals. Lancet. 2015;386(10009):2119–2121. doi:10.1016/S0140-6736(15)00949-6
47. van Weel C, Kidd MR. Why strengthening primary health care is essential to achieving universal health coverage. CMAJ. 2018;190(15):E463–E466. doi:10.1503/cmaj.170784
48. Shao S, Zhang H, Chen X, et al. Health education services utilization and its determinants among migrants: a cross-sectional study in urban-rural fringe areas of Beijing, China. BMC Fam Pract. 2021;22(1):23. doi:10.1186/s12875-021-01368-1
 © 2026 The Author(s). This work is published and licensed by Dove Medical Press Limited. The
full terms of this license are available at https://www.dovepress.com/terms
and incorporate the Creative Commons Attribution
- Non Commercial (unported, 4.0) License.
By accessing the work you hereby accept the Terms. Non-commercial uses of the work are permitted
without any further permission from Dove Medical Press Limited, provided the work is properly
attributed. For permission for commercial use of this work, please see paragraphs 4.2 and 5 of our Terms.
© 2026 The Author(s). This work is published and licensed by Dove Medical Press Limited. The
full terms of this license are available at https://www.dovepress.com/terms
and incorporate the Creative Commons Attribution
- Non Commercial (unported, 4.0) License.
By accessing the work you hereby accept the Terms. Non-commercial uses of the work are permitted
without any further permission from Dove Medical Press Limited, provided the work is properly
attributed. For permission for commercial use of this work, please see paragraphs 4.2 and 5 of our Terms.