
Back to Journals » Journal of Inflammation Research » Volume 19
Evaluating the Diagnostic Value and Molecular Mechanism of Energy Metabolism-Related Gene PEA15 in Sepsis
Authors Yu X, Liu C, Jia L, Wan B, Feng J, Wu Y, Tang J, Jia Y  , Liu H, Luo S, Li Q, Kong G, Li P
Received 29 July 2025
Accepted for publication 24 January 2026
Published 3 February 2026 Volume 2026:19 556793
DOI https://doi.org/10.2147/JIR.S556793
Checked for plagiarism Yes
Review by Single anonymous peer review
Peer reviewer comments 2
Editor who approved publication: Dr Anh Ngo
Xiao Yu,1,2,* Congrui Liu,1,* Libin Jia,1,* Bingjie Wan,2 Jun Feng,2 Yonghong Wu,3 Jin Tang,1 Yachun Jia,2 Hongwei Liu,2 Siyu Luo,2 Qiao Li,2 Guangyao Kong,2 Ping Li1
1Department of General Practice, The Second Affiliated Hospital of Xi’an Jiaotong University, Xi’an, Shaanxi, People’s Republic of China; 2National & Local Joint Engineering Research Center of Biodiagnosis and Biotherapy, Precision Medical Institute, The Second Affiliated Hospital of Xi’an Jiaotong University, Xi’an, Shaanxi, People’s Republic of China; 3College of Medical Technology, Xi’an Medical University, Xi’an, Shaanxi, People’s Republic of China
*These authors contributed equally to this work
Correspondence: Ping Li, Department of General Practice, The Second Affiliated Hospital of Xi’an Jiaotong University, Xi’an, Shaanxi, 710004, People’s Republic of China, Email [email protected] Guangyao Kong, National & Local Joint Engineering Research Center of Biodiagnosis and Biotherapy, Precision Medical Institute, The Second Affiliated Hospital of Xi’an Jiaotong University, Xi’an, Shaanxi, 710004, People’s Republic of China, Email [email protected]
Purpose: Sepsis, a life-threatening condition with high mortality, is closely linked to energy metabolism (EM) and immune-inflammatory responses. However, the precise mechanisms remain incompletely understood. This research aims to identity EM-related genes (EMRGs) in sepsis and examine the diagnostic potential and molecular mechanisms through machine learning and single-cell RNA sequencing (scRNA-seq).
Methods: This study utilized the GSE65682 and GSE95233 datasets from the Gene Expression Omnibus (GEO) for analysis. Kaplan-Meier (KM) survival analysis and receiver operating characteristic (ROC) diagnostic analysis were applied to identify key EM-related genes. A sepsis model with overexpression of key genes was developed, and RNA sequencing (RNA-Seq) was employed to identify associated genes. Additionally, scRNA-seq was conducted to examine cell type distributions and gene expression profiles in sepsis.
Results: ATM and PEA15 were identified as critical genes. Overexpression of PEA15 alleviated septic symptoms. In sepsis, alterations in immune cell infiltration, particularly T follicular helper cells, were correlated with key gene expression. Core genes (RSAD2, IFI44, MX1, IFIT3, and ISG15), closely associated with the key genes, were also identified. Single-cell analysis further delineated the cell type profiles and core gene expression patterns in sepsis. From a translational perspective, PEA15 addresses a critical gap in sepsis management. Its strong prognostic and diagnostic performance, validated through KM and ROC analyses, positions it as a promising biomarker for early sepsis detection—essential for improving patient outcomes through timely intervention.
Conclusion: PEA15 and its associated core genes represent potential therapeutic targets: modulating PEA15 expression or targeting the underlying molecular network may help restore immune balance and reduce septic damage, offering a novel approach for targeted therapeutic strategies.
Keywords: sepsis, energy metabolism, key gene, immune, single-cell RNA-sequencing
Introduction
Sepsis, a life-threatening syndrome characterized by acute organ dysfunction due to a dysregulated response to infection, represents a significant global health challenge.1 With a mortality rate of approximately 22.5%, sepsis accounts for 19.7% of global deaths. It is a disease marked by high incidence, mortality, and treatment costs.2 Clinically, sepsis manifests as a systemic inflammatory response and multiple organ dysfunction.3 At the cellular and molecular levels, its pathogenesis is highly complex, involving a range of pathophysiological processes, including inflammatory imbalance, immune dysfunction, mitochondrial damage, coagulopathy, neuroendocrine immune network abnormalities, endoplasmic reticulum stress, and autophagy, ultimately leading to organ failure.4 Current treatment strategies, consisting of anti-infection therapy, hemodynamic support, and organ support, form the core of sepsis management.5 However, these therapies often provide suboptimal outcomes in heterogeneous patient populations. Incorporating multi-omics analyses to identify precision biomarkers—such as CD33, LY9, and S100A8/A9—for early diagnosis and targeted gene therapy is critical to overcoming this patient variability.6,7
Energy metabolism (EM), the process of converting nutrients into cellular energy, involves metabolic fuels such as glucose, fatty acids (FAs), amino acids, ketone bodies, and lactate. These fuels are metabolized through a series of interconnected biochemical pathways to generate cellular energy, primarily in the form of adenosine triphosphate (ATP).8 Disruptions in EM are a central feature of sepsis and a key driver of organ dysfunction. During the early stages of sepsis, the body enters a “hypermetabolic storm”, leading to a surge in energy consumption (eg, muscle protein breakdown and enhanced gluconeogenesis), while energy utilization efficiency remains low. As mitochondrial dysfunction progresses, ATP production becomes insufficient, contributing to organ failure (eg, heart, liver, and kidneys) due to energy depletion.9–11
Septic-induced myocardial dysfunction (SIMD) is a common complication of sepsis, characterized by metabolic disorders and myocardial energy failure. Pathologically, SIMD involves altered myocardial substrate uptake, impaired fatty acid oxidation, accumulation of intermediate metabolites, mitochondrial dysfunction, and dysregulated mitophagy/mitochondrial biogenesis, which collectively reduce ATP synthesis and trigger myocardial inflammation and cell death.12 Notably, in burn-related sepsis, glutamine (Gln) mitigates liver injury by repairing dysfunctional mitochondrial electron transport chain (ETC) complexes, enhancing ATP synthesis, attenuating oxidative stress, and restoring energy supply and redox homeostasis.13 In macrophages, TGF-β (transforming growth factor-β) can promote glycolysis, suppress pro-inflammatory cytokine production, and reduce survival in sepsis models.14 In neutrophils, however, glycolysis inhibition exacerbates immunosuppression and contributes to the progression of sepsis.15 These findings highlight the complexity of EM’s role in sepsis. Despite substantial research, the identification of validated EM-related biomarkers remains an unmet need.
This study leveraged transcriptomic data from public databases to identify key EM-related genes in sepsis through bioinformatic analysis. Cellular models were established and subjected to sequencing to identify core genes. In parallel, single-cell resolution analysis was conducted to map the expression patterns of these core genes and explore their underlying regulatory mechanisms. Overall, this study provides novel insights for sepsis diagnosis, treatment, and prognostic evaluation.
Materials and Methods
Data Acquisition
Three public transcriptome datasets, GSE65682, GSE95233, and GSE167363, were obtained from the GEO database (https://www.ncbi.nlm.nih.gov/geo/). Among these, GSE65682 and GSE95233 are bulk RNA sequencing (RNA-seq) datasets, while GSE167363 is a single-cell RNA-seq dataset. Additionally, a total of 1110 EMRGs were retrieved from the GeneCards database (https://www.genecards.org/) with a relevance score greater than 2 (supplementary file 1).
Identification of Candidate Genes and Functional Analyses
For the GSE65682 dataset, weighted gene co-expression network analysis (WGCNA) was performed using the WGCNA package (v1.70.3)16 to identify genes strongly associated with sepsis. The limma package (v3.54.0)17 was subsequently employed to identify differentially expressed genes (DEGs) between sepsis and control groups (adjusted P < 0.05, |log2 fold change (FC)| > 1). The ggplot2 (v 3.4.1)18 and ComplexHeatmap (v 2.14.0)19 packages were used for visualization. The VennDiagram package (v1.7.1)20 was then used to intersect DEGs, key module genes, and EMRGs, resulting in candidate genes related to EM in sepsis. The potential roles of these candidate genes in sepsis were then further explored, with clusterProfiler package (v 4.2.2)21 applied for Gene Ontology (GO) and Kyoto Encyclopedia of Genes and Genomes (KEGG) analyses (P < 0.05). For exploring the interactions of candidate genes at the protein level, Search Tool for the Retrieval of Interacting Genes/Proteins (STRING) database (https://string-db.org/) was employed, and a protein-protein interaction (PPI) network was established. The proteins with high-quality interactions were visualized by Cytoscape software (v 3.8.2)22 (confidence score > 0.4).
Recognition of EM-Related Key Genes and Diagnostic Value Analysis
In the GSE65682 dataset, machine learning algorithms, including least absolute shrinkage and selection operator (LASSO)via the glmnet package (v4.1.4)23 and XGBoost via xgboost package (v1.7.3.1),24 were applied to identify EM-related key genes in sepsis. To assess the association between these signature genes and patient survival, Kaplan-Meier (K-M) survival analysis was conducted using the survminer package (v0.4.9),25 with survival differences evaluated by the Log rank test (P < 0.05), leading to the identification of hub genes. Additionally, the expression differences of hub genes between groups in the GSE65682 and GSE95233 datasets were evaluated using the Wilcoxon rank-sum test (P < 0.05) to identify key genes. To assess the diagnostic value of the EM-related key genes for sepsis, receiver operating characteristic (ROC) curves were generated using the pROC package (v1.18.0),26 with an area under the curve (AUC) greater than 0.7 indicating a good diagnostic potential.
Analysis of the Regulatory Mechanism of EM-Related Key Genes
For pathway analysis, Gene Set Enrichment Analysis (GSEA) was conducted within the GSE65682 dataset to explore the signaling pathways in which the EM-related key genes were involved (P < 0.05, |NES| > 1). The reference gene set was “c2.cp.kegg.v2023.1.Hs.symbols.gmt”, which was obtained from Molecular Signatures Database (MSigDB) (https://www.gsea-msigdb.org/gsea/msigdb). Additionally, the NetworkAnalyst database (https://www.networkanalyst.ca/NetworkAnalyst/) was used to predict microRNAs (miRNAs) targeting these key genes. Corresponding long non-coding RNAs (lncRNAs) were predicted via miRNet (https://www.mirnet.ca/miRNet/home.xhtml), starBase (https://rnasysu.com/encori/), and miRcode2 (http://c1.accurascience.com/miRecords/) databases, respectively. Notably, the lncRNAs predicted in all 3 databases were selected as key lncRNAs. Finally, Cytoscape software (v 3.8.2) was applied to illustrate the key lncRNA-miRNA-mRNA regulatory network.
Construction of Cell Models and Functional Analyses
LPS-induced sepsis models were established in BEAS-2B cells (human normal lung epithelial cells) to investigate the underlying mechanisms of this EM-related biomarker at the cellular level. BEAS-2B cells were purchased from Procell Life Science & Technology Co., Ltd. (China). BEAS-2B cells were recovered from passage 2 (P2) and serially passaged 3 times at a 1:2 split ratio to reach passage 5 (P5) for subsequent plating and intervention. The cells were divided into three groups: BEAS-2B normal culture group (the blank control group), empty plasmid transfection group (BEAS-2B+ex-NC), and PEA15 overexpression vector transfection group where BEAS-2B cells were transfected with the pCDH-PEA15-3XFlag-GFP+Puro plasmid (Figure S1) (HonorGene, HG-HO003768, China) (BEAS-2B+ex-PEA15). Forty-eight hours post-transfection, the proportion of positive cells was observed and quantified via fluorescence microscopy to evaluate transfection efficiency. Subsequently, the BEAS-2B+ex-NC group (n=5) and BEAS-2B+ex-PEA15 group (n=5) were each induced with 10 µg/mL LPS (Servicebio, China) to respectively establish the sepsis model group and the PEA15 overexpression sepsis model group. And the blank control group (5 samples), which consisted of normal BEAS-2B cells. Cell viability was evaluated using the Cell Counting Kit-8 (CCK-8) assay (Tongren, Japan) according to the manufacturer’s instructions. Apoptosis was assessed using the Annexin V-PE/7-AAD Apoptosis Detection Kit (Yisheng Biotechnology Co., Ltd., China) following the manufacturer’s protocol. Cytokine levels of tumor necrosis factor-α (TNF-α), interleukin-1β (IL-1β), and interleukin-6 (IL-6) were quantified using corresponding ELISA kits (Jiangsu Meimian Industrial Co., Ltd., China) according to the manufacturer’s guidelines. The results are presented as mean ± standard deviation (SD). Differences between the two groups were analyzed using the unpaired two-tailed Student’s t-test.
Quantitative Real-Time Polymerase Chain Reaction (qRT-PCR)
RNAs were isolated from cells using TRIzol reagent (R401-01, Ambion, USA) and reverse-transcribed into cDNA with the SureScript First-strand cDNA Synthesis Kit (11141ES60, Yisheng, China). RT-qPCR was performed with 2×Universal Blue SYBR Green qPCR Master Mix (G3326-05, Servicebio, China) using primers for the biomarker and internal reference GAPDH. Following the reagent’s instructions for the reaction system and program. Primers for the biomarker and the internal reference gene (GAPDH) are listed in Table S1. The 2-ΔΔCT method was used to calculate the gene expression level.
Western Blotting (WB)
Total protein was extracted using RIPA lysis buffer (Servicebio, China), and its concentration was determined with a BCA protein assay kit (Beyotime, China) prior to separation by SDS-PAGE electrophoresis and transfer to a PVDF membrane (Millipore, USA). The membrane was blocked with 5% bovine serum albumin (BSA) solution (Servicebio, China; 40 mL) at 37°C for 30 min, then incubated overnight at 4°C with primary antibodies (anti-PEA15, Proteintech, 21446-1-AP, 1:1000; anti-β-actin, Proteintech, 66009-1-Ig, 1:25000, USA) and subsequently with secondary antibodies (HRP-conjugated goat anti-rabbit IgG, Servicebio, GB23303, 1:3000; HRP-conjugated goat anti-mouse IgG, Servicebio, GB23301, 1:5000, China) at room temperature for 60 min, following kit instructions. Finally, the protein bands were visualized with chemiluminescence reagent (Huiying, China).
Functional Analyses of Key DEGs and Acquisition of Core Genes
RNA-seq was performed on cell samples from the biomarker overexpression sepsis model, sepsis model, and blank control groups to capture gene expression profiles (Lianchuan Biotechnology, China). DEGs resulting from biomarker overexpression were identified using the limma package (v3.54.0) (adjusted P < 0.05, |log2FC| > 1). Low-quality bases (Q < 20) and adapter sequences were removed, and reads shorter than 20 bp were filtered out to ensure high-quality alignment. The reads were aligned to the reference genome to generate BAM files, and alignment statistics for all samples were summarized. Genome coverage distribution plots were created to assess the uniformity of sequencing depth. Using the GTF annotation file (based on the human genome reference version hg38), the number of reads mapped to each gene was counted, generating a “gene × sample” count matrix. Gene expression levels were ranked, and the maximum expression value was retained for genes with multiple expression values. Key DEGs were GO and KEGG analyses for functional exploration using the clusterProfiler package (v4.2.2) (P < 0.05). PPIs of key DEGs were evaluated using the STRING database, and the genes encoding the top 5 proteins ranked by degree in the PPI network (confidence score > 0.9) were selected as core genes.
Functional Analyses and Regulatory Mechanisms of Core Genes
To investigate the molecular mechanisms by which the EM-related biomarker influences sepsis progression, Spearman correlations between the biomarker and core genes were first assessed using the psych package (v 2.1.6) (|cor| > 0.3, P < 0.05). A gene-gene interaction (GGI) network was then constructed via the GeneMANIA database (https://genemania.org/) to predict genes associated with core gene functions and related pathways. Additionally, the GO SemSim package (v 2.24.0)27 was utilized to explore functional correlations among the core genes.
To facilitate further understanding of core genes in sepsis, the RCircos package (v1.22)28 was used for chromosomal localization analysis to identify their specific genomic regions. Subcellular localization information of these core genes was retrieved from the mRNALocater database (http://bio-bigdata.cn/mRNALocater/). In the GSE167363 dataset, the potential mechanisms through which the EM-related biomarker influenced sepsis progression via core genes were explored at the single-cell level. Selection criteria included nFeature RNA (the number of genes quantified per cell) within the range of 200 to 5000, nCount RNA (the total gene counts per cell) under 20,000, and percentmt (the proportion of mitochondrial gene expression per cell) limited to less than 20%. Cell clusters were annotated using literature-derived marker genes.29 Core gene distribution and expression across cell types were assessed to clarify their cellular localization, and cell type functional annotation was conducted using the ReactomeGSA package (v1.16.1)30 to reveal associated biological functions.
Statistical Analysis
Bioinformatics analyses were performed using R software (v 4.2.2). All experimental data are presented as means ± SD. The Wilcoxon rank-sum test, t-test, one-way ANOVA, and chi-square test were applied to evaluate intergroup differences, with statistical significance set at P < 0.05. Data visualization was performed using GraphPad Prism 5 software (v 8.0).31
Results
Relevant Functions of EM-Related Candidate Genes and Identification of Signature Genes
In the GSE65682 dataset, after confirming the absence of outlier samples (Figure 1A), WGCNA was performed on all samples to identify key module genes associated with sepsis. The optimal soft thresholding was determined to be 18, based on the scale-free fit index (signed R2 = 0.85) and mean connectivity (approaching 0), leading to the establishment of a gene co-expression network. Genes were clustered into modules via hybrid dynamic tree cutting (minModuleSize = 30, mergeCutHeight = 0.4). Pearson correlation analyzed module eigengene (ME)-phenotype (sample grouping) associations. Genes from 14 modules were clustered, excluding those from the grey module (Figure 1B–D). Notably, after screening, 802 key module genes strongly correlated with sample grouping information were identified from the brown module (|cor| = 0.67, P < 0.0001, |GS| > 0.4, |MM| > 0.6) (Figure 1E).
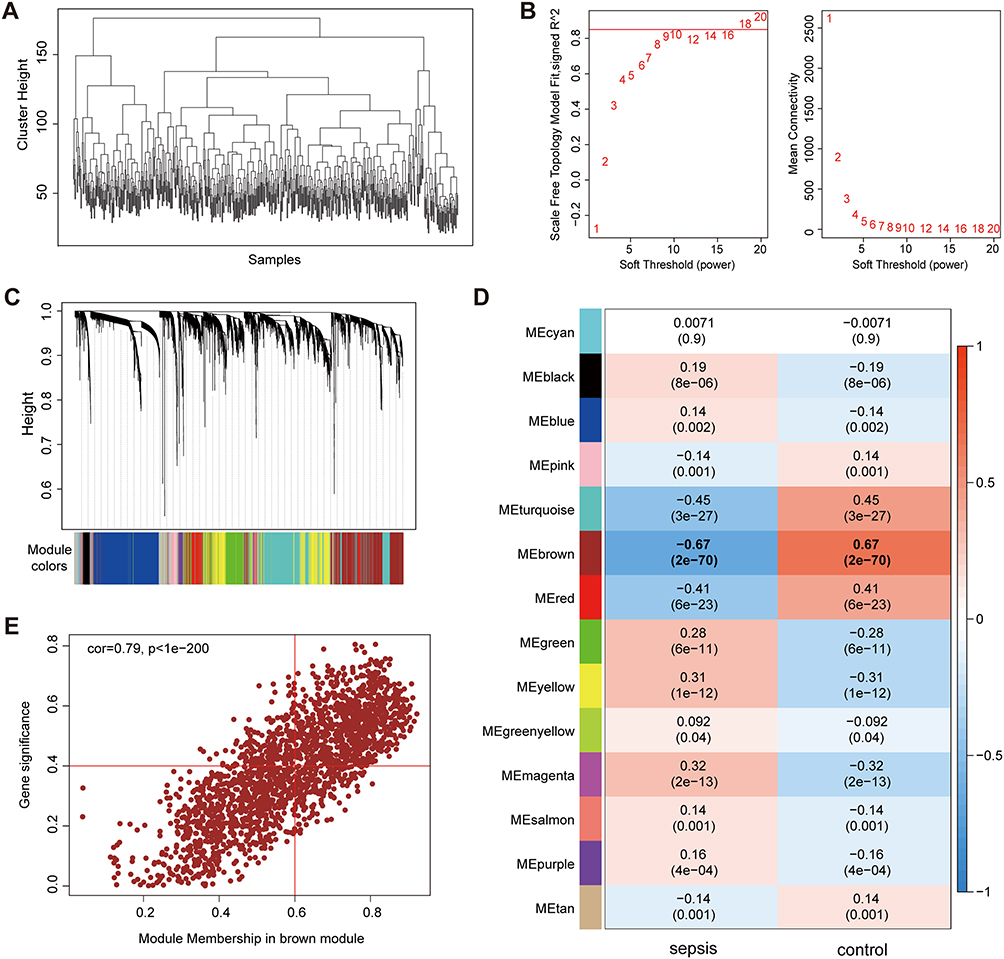 |
Figure 1 WGCNA analysis and identification of key module genes related to sepsis. (A) Hierarchical clustering of samples in GSE65682. (B) Screening of the optimal soft threshold. Left panel: Scale-free topology fit index (y-axis) across soft-thresholding powers (x-axis); Right panel: Network connectivity. Red line denotes selected index (R2=0.85). β=8 was chosen for meeting scale-free criterion (R2>0.8) and preserving adequate connectivity. (C) Identification of co-expression modules. (D) Correlation heatmap of key modules related to traits and groups. Numbers in each cell indicate correlation and significance. (E) Scatter plot of Gene Significance (GS) vs Module Membership (MM) in the key module. |
Furthermore, 1287 DEGs were identified in the sepsis group, comprising 445 upregulated and 842 downregulated genes (adjusted P < 0.05) (Figure 2A and B). Twenty-four candidate genes associated with EM in sepsis were obtained from the intersection of key module genes, DEGs, and EMRGs (Figure 2C). These candidate genes were enriched in GO terms such as “response to gamma radiation” and “regulation of apoptotic signaling pathway” (P < 0.05) (Figure 2D). Additionally, they were linked to KEGG pathways such as “NF-kappa B signaling pathway” and “apoptosis” (P < 0.05) (Figure 2E), highlighting the multiple roles of EM in sepsis progression.
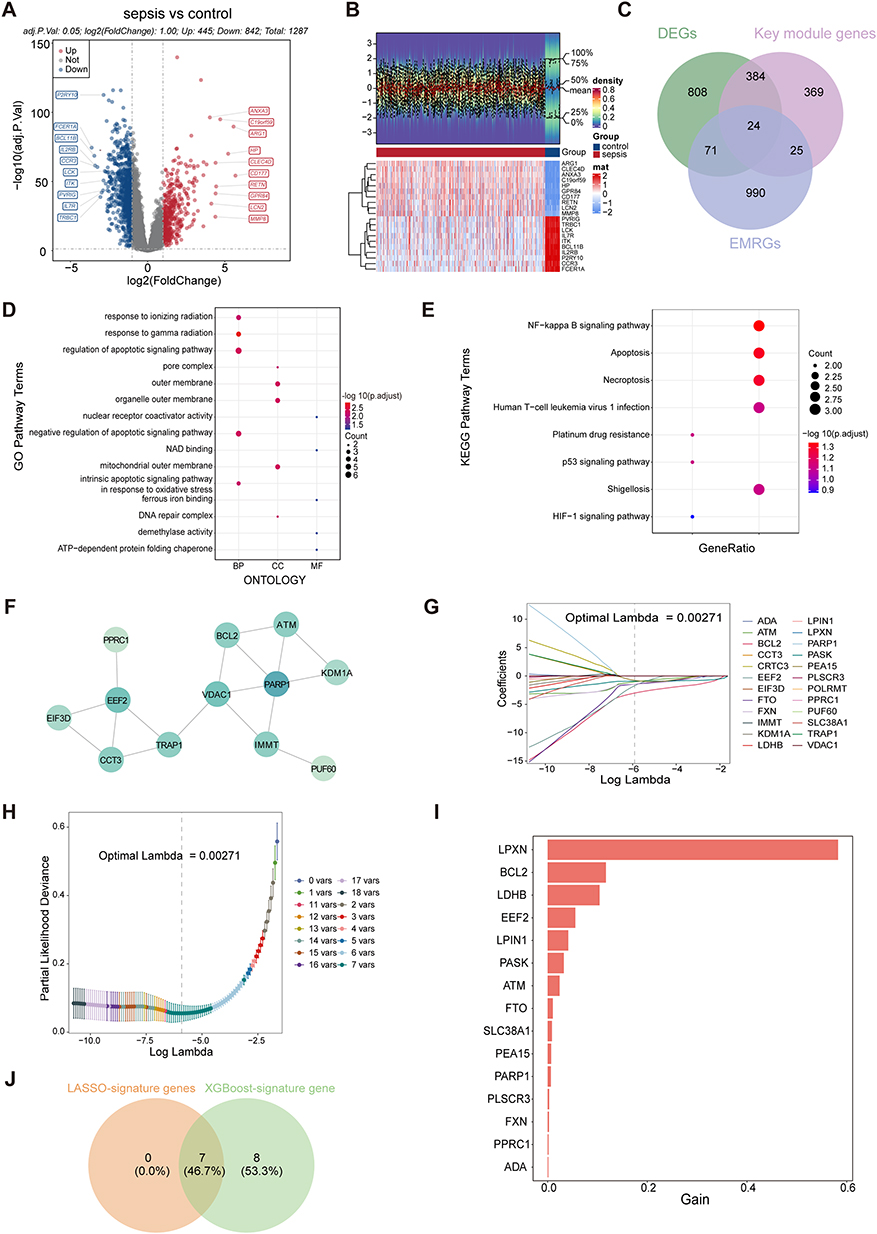 |
Figure 2 Identification and functional analysis of candidate genes and screening of characteristic genes. (A) Volcano plot showing the distribution of differentially expressed genes (DEGs) between the sepsis and control groups. (B) Heatmap of the distribution of DEGs. (C) Venn diagram of candidate genes. (D) GO enrichment results of candidate genes. (E) KEGG enrichment results of candidate gene. (F) PPI network of the 24 candidate genes. (G) Path diagram of regression coefficients in LASSO analysis of candidate genes. (H) Cross-validation curve of LASSO analysis for candidate genes. (I) Feature gene importance ranked by XGBoost. (J) Venn diagram of signature genes. Abbreviations: BP, Biological Process; CC, Cellular Component; MF, Molecular Function. |
The constructed PPI network contained 17 interaction pairs (eg, PARP1-VDAC1), involving 12 proteins, further elucidating the complex protein-level interactions among the candidate genes (Figure 2F). Screening of these candidate genes led to the identification of 7 signature genes from the intersection of 7 LASSO-signature genes (optimal lambda = 0.00271) and 15 XGBoost-signature genes, including PASK, BCL2, FTO, ATM, FXN, PEA15, and EEF2 (Figure 2G–J).
The EM-Related Key Genes PEA15 and ATM Had Outstanding Diagnostic Value for Sepsis
Based on the optimal cutoff values for signature genes (PASK = 2.539, BCL2 = 2.685, FTO = 4.654, ATM = 3.576, FXN = 3.406, PEA15 = 3.812, EEF2 = 8.514), high- and low-expression groups were generated. Significant survival differences between these groups identified ATM and PEA15 as hub genes (P < 0.05), which were associated with patient survival outcomes (Figure 3A–G). Expression analysis revealed consistent expression trends for ATM and PEA15 in both the GSE65682 and GSE95233 datasets, with significant inter-group differences (P < 0.0001), confirming them as key genes (Figure 3H and I). Notably, compared to the control group, expression of these key genes was downregulated in the sepsis group. ROC curves for these genes in both datasets exhibited AUC values exceeding 0.9, demonstrating their excellent diagnostic potential for sepsis (Figure 3J and K).
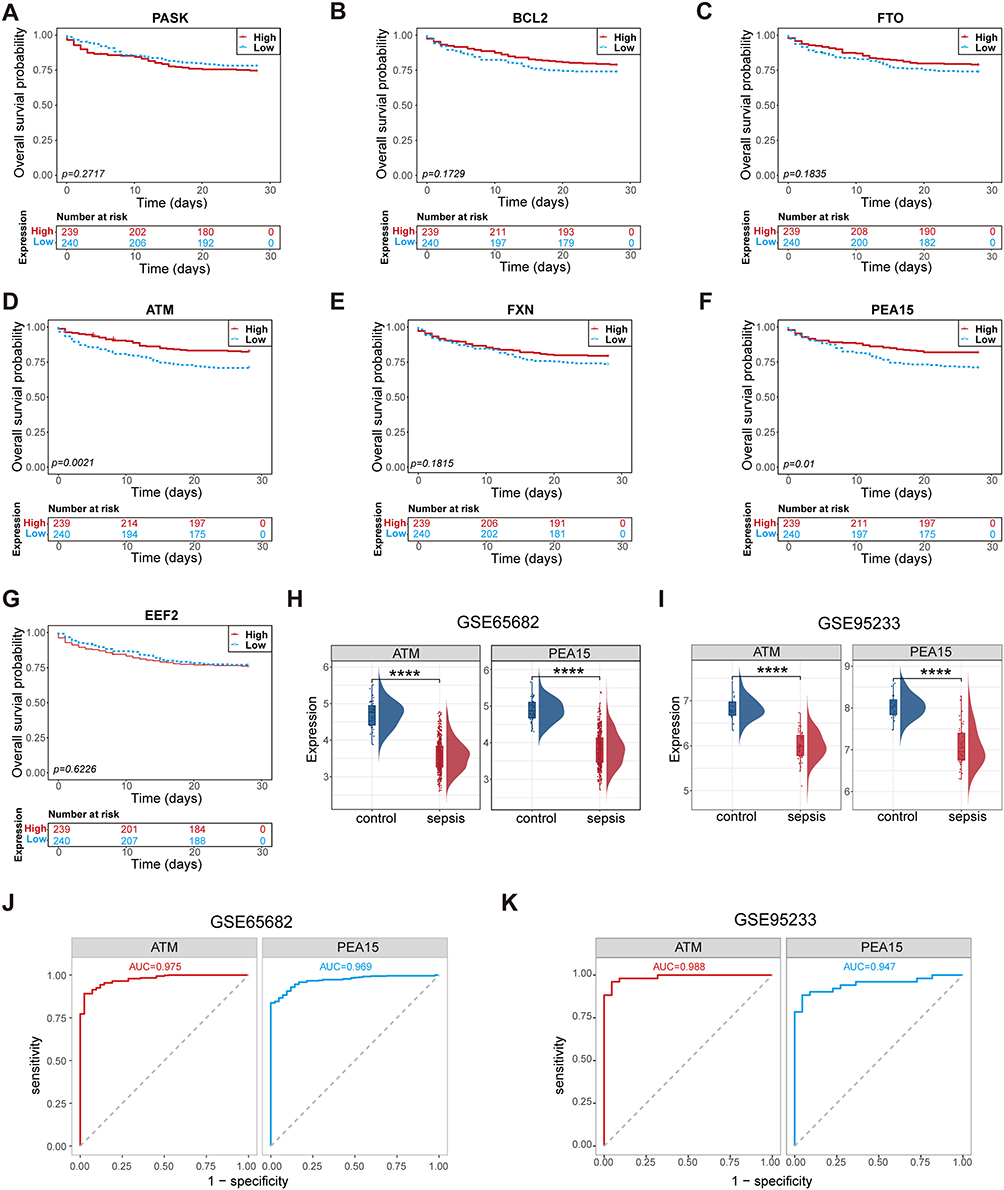 |
Figure 3 Identification and validation of key genes. (A–G) Kaplan-Meier survival analysis of feature genes in the high and low expression groups in GSE65682. (A) PASK. (B) BCL2. (C) FTO. (D) ATM. (E) FXN. (F) PEA15. (G) EEF2. (H and I) Validation of expression levels of key genes in (H) GSE65682 and (I) GSE95233. (J and K) ROC curve analysis of key genes (AUC > 0.8) in (J) GSE65682 and (K) GSE95233. The results are presented as means±SD, ****p<0.0001. |
PEA15 and ATM Were Regulated by Multiple Regulatory Factors and Affected the Progression of Sepsis Through Multiple Pathways
In the GSE65682 dataset, biological pathways associated with EM-related key genes were explored through GSEA. ATM and PEA15 were significantly linked to critical pathways, including “ribosome”, “spliceosome”, “glycosphingolipid biosynthesis lacto and neolacto series”, “olfactory transduction”, and “neuroactive ligand-receptor interaction” (Figure 4A and B). These results suggest that EM plays a pivotal role in sepsis progression by modulating these pathways.
 |
Figure 4 Crucial functional pathways and detailed molecular regulatory networks of EM-related key genes. (A and B) Single-gene gene set enrichment analysis (GSEA) of hub genes ATM (A) and PEA15 (B). (C) LncRNA-miRNA-mRNA regulatory network analysis of key genes. |
Additionally, upstream regulatory elements of EM-related key genes were predicted. A constructed lncRNA-miRNA-mRNA regulatory network revealed 6 miRNAs (eg, hsa-miR-4262 and hsa-miR-17-5p) targeting specific key genes (ATM and PEA15), along with 13 lncRNAs (eg, NEAT1 and XIST) regulating these miRNAs (Figure 4C). Identifying these regulatory elements is crucial for understanding the pathophysiological mechanisms linking EM to sepsis.
Immune Microenvironment Was Altered, and PEA15 and ATM Were Significantly Correlated with Most of Differential Immune Infiltration Cells in Sepsis
In the GSE65682 dataset, differential immune microenvironment profiles between the sepsis and control groups were delineated (Figure 5A). Notably, 25 differential immune cell types were identified, including activated B cells (P < 0.01) (Figure 5B). Significant correlations were observed between most differential immune infiltrating cell types (Figure 5C), with the strongest positive correlation between activated CD8 T cells and effector memory CD8 T cells (cor = 0.83, P < 0.0001). In contrast, activated CD8 T cells exhibited the strongest negative correlation with activated dendritic cells (DCs) (cor = −0.54, P < 0.0001). Moreover, EM-related key genes showed significant correlations with most differential immune infiltrating cell types (Figure 5D). These genes exhibited strong positive correlations with various immune cells, with the strongest correlation observed between PEA15 and T follicular helper cells (cor = 0.617, P < 0.0001). Conversely, EM-related key genes were strongly and inversely correlated with activated DCs (|cor| > 0.3, P < 0.0001). In summary, the immune microenvironment profiles of sepsis and control groups differed, and these differences were associated with significant correlations between EM-related key genes and many immune infiltrating cell types. These immune infiltrating cell types may provide new targets for personalized therapeutic approaches to sepsis. Figure 5 continued. Figure 5 Immune cell infiltration analysis. (A) Heatmap of immune cell enrichment scores in the sepsis and control groups. (B) Box plot showing differences in the enrichment scores of 28 immune cell types between the sepsis and control groups. (C) Heatmap showing the correlation between key genes and differentially expressed immune cells. (D) Heatmap of the correlation among differentially infiltrated immune cells. Red and blue squares indicate positive and negative correlations, respectively. The results are presented as means±SD. *p<0.05, **p <0.01, ***p<0.001, ****p<0.0001.

PEA15 Overexpression Sepsis Models Were Successfully Constructed
PEA15, an EM-related biomarker, was selected for further investigation due to its reported association with sepsis-induced acute respiratory distress syndrome.32 To explore its role, a stable human PEA15 overexpression vector was utilized. Successful transfection of the overexpression vector into BEAS-2B cells was confirmed through sequencing and alignment (Figure S2). Following LPS treatment, PEA15 overexpression sepsis models were established, along with a separate sepsis model. Cell samples from both the PEA15 overexpression sepsis model and sepsis model groups were observed under an inverted microscope. The cells exhibited normal morphology and adhered well to the culture surface, confirming their suitability for subsequent experimental analysis (Figure S3).
To validate the successful transfection of the PEA15 overexpression vector into BEAS-2B cells, RT-qPCR and WB assays were performed. PEA15 expression in the PEA15 overexpression sepsis model group was significantly higher compared to the sepsis model group (P < 0.01) (Figure 6A). Consistent results were obtained from WB analysis (P < 0.05) (Figure 6B), further confirming the successful construction of the PEA15 overexpression vector and its efficient transfection into BEAS-2B cells.
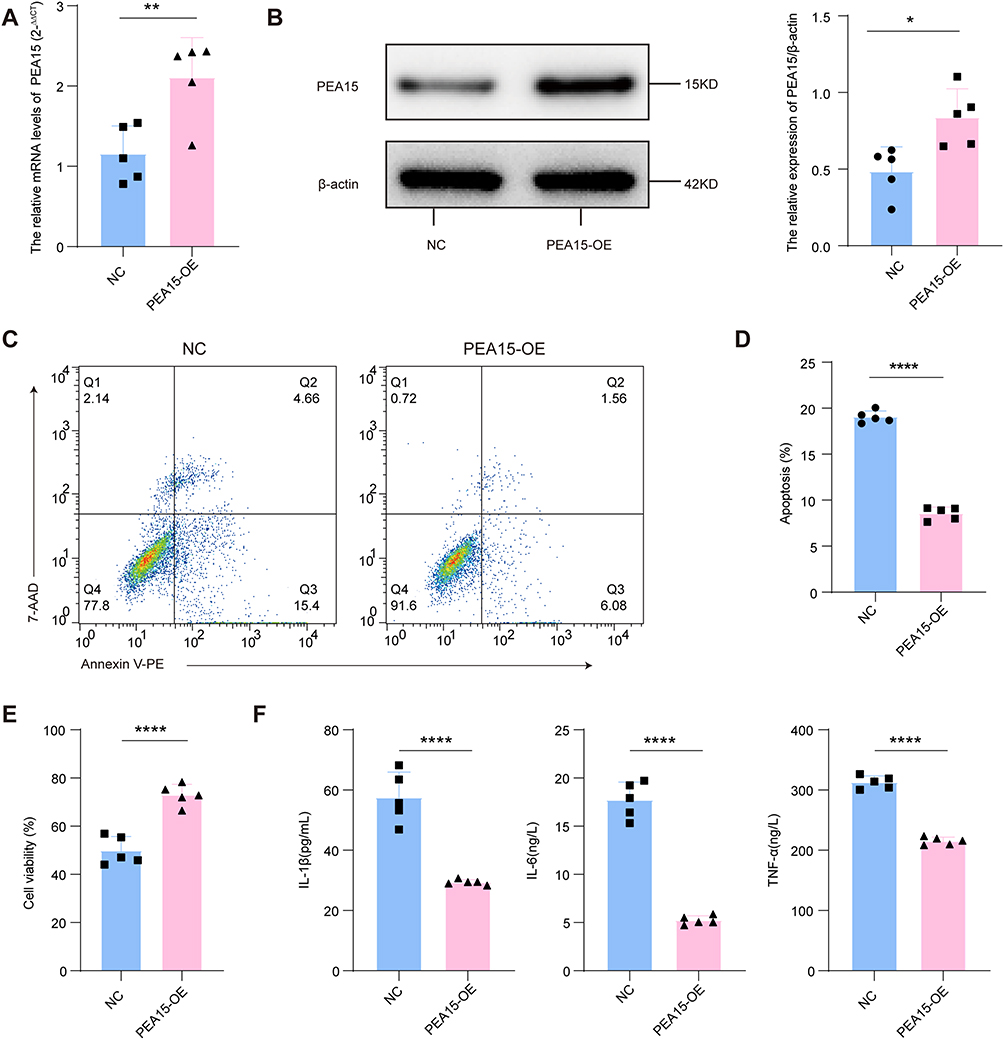 |
Figure 6 Construction and functional validation of the PEA15 overexpression sepsis cell model. A sepsis cell model was established using the BEAS-2B cell line. The sepsis model group transfected with empty vector served as the negative control (NC), while the sepsis cell model with stable PEA15 overexpression was designated as the PEA15 overexpression group (PEA15-OE). (A) Results of real-time quantitative PCR for PEA15 overexpression. (B) Western blot analysis of PEA15 overexpression. (C and D) Apoptosis analysis via flow cytometry. (E) Cell viability measured by CCK-8 assay. (F) Expression levels of TNF-α, IL-1β, and IL-6 detected by ELISA. The results are presented as means±SD. *p<0.05, **p <0.01, ****p<0.0001. |
Overexpression of PEA15 Could Enhance Cell Activity, Reduce Apoptosis, and Suppress Inflammation in Sepsis
The cellular functions of PEA15 were assessed. Compared to the sepsis model group, the PEA15 overexpression sepsis model group demonstrated a significant increase in cell viability (P = 0.0001) (Figure 6E). Furthermore, the PEA15 overexpression sepsis model group showed a notable reduction in the percentage of apoptotic cells compared to the sepsis model group (P < 0.0001) (Figure 6C and D). Collectively, these results indicate that PEA15 overexpression enhances cell viability and reduces apoptosis in sepsis-affected cells, suggesting a potential protective role for PEA15 in the pathophysiology of sepsis. Additionally, compared to the sepsis model group, the PEA15 overexpression sepsis model group exhibited significantly lower levels of TNF-α, IL-1β, and IL-6 (P < 0.0001) (Figure 6F). These results suggest that PEA15 overexpression effectively suppresses the inflammatory response in sepsis, offering a promising therapeutic strategy to mitigate sepsis progression.
Related Functional Pathways of Key DEGs and Recognition of Core Genes
RNA-seq was performed to analyze the gene expression profiles of the PEA15 overexpression sepsis model, sepsis model, and blank control groups. A total of 201 DEGs1 were identified in the blank control (vs sepsis model) group, including 40 upregulated and 161 downregulated genes, and 527 DEGs2 were identified in the PEA15 overexpression sepsis model (vs sepsis model) group, consisting of 203 upregulated and 324 downregulated genes (adjusted P < 0.05) (Figure 7A–D). After excluding genes from DEGs2 that shared the same expression trends as DEGs1, 492 key DEGs resulting from PEA15 overexpression were identified (Figure 7E and F).
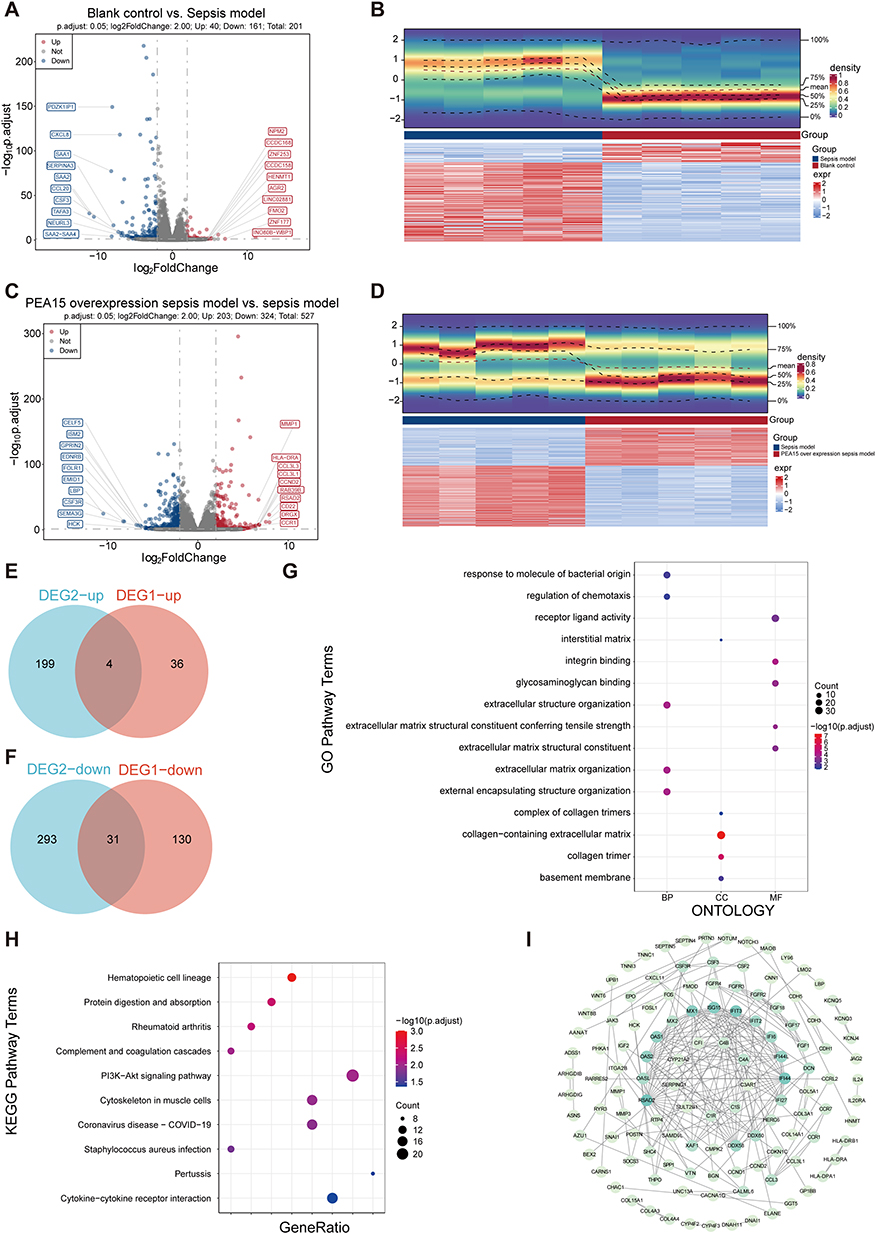 |
Figure 7 Functional pathways related to key DEGs and identification of core genes. (A) Volcano plot of differentially expressed genes (DEGs1) between the control and sepsis groups. (B) Heatmap of DEGs1 between the control and sepsis groups. (C) Volcano plot of differentially expressed genes (DEG2) between the PEA15 overexpression and sepsis groups. (D) Heatmap of DEG2 between the PEA15 overexpression and sepsis groups. (E and F) Venn diagrams showing the 492 differentially expressed genes (DEGs1) in the context of PEA15 overexpression, including 199 upregulated (E) and 293 downregulated (F) genes. (G) GO enrichment analysis results of the 492 DEGs. (H) KEGG enrichment analysis results of the 492 DEGs. (I) Identification of five core genes through protein-protein interaction (PPI) network analysis of DEGs1. Abbreviations: BP, Biological Process; CC, Cellular Component; MF, Molecular Function. |
Further analysis revealed that the key DEGs were enriched in GO terms such as “extracellular matrix organization” (P < 0.05) (Figure 7G). They were also associated with KEGG pathways, including “hematopoietic cell lineage” (P < 0.05) (Figure 7H). These findings provided insight into the potential regulatory mechanisms of EM-related PEA15 in cell functions and sepsis progression. The shared GO terms and KEGG pathways are presented in Tables S2 and S3, offering a more comprehensive understanding of PEA15’s role in sepsis and highlighting its potential as a biomarker. The PPI network of key DEGs included 205 interaction pairs involving 122 proteins, with RSAD2, IFI44, IFIT3, ISG15, and MX1 identified as core genes (Figure 7I).
PEA15 Could Affect the Progression of Sepsis Through Extensive Interactions with Core Genes
Correlations between the core genes and EM-related PEA15 were visualized in Figure 8A. Notably, ISG15 and MX1 exhibited strong positive correlations with PEA15 (cor > 0.7, P < 0.05). A GGI network of core genes was constructed, highlighting the complex interactions between core genes and 20 related genes (Figure 8B). The physical interactions among these genes were particularly strong, involving functions such as “response to type I interferon” and “response to virus”. This network suggests that PEA15 may influence sepsis progression by modulating these interactions. Additionally, the Friends analysis revealed that IFI44 exhibited the strongest functional correlation with the other core genes, indicating its critical role in the regulatory function of PEA15 in sepsis (Figure 8C).
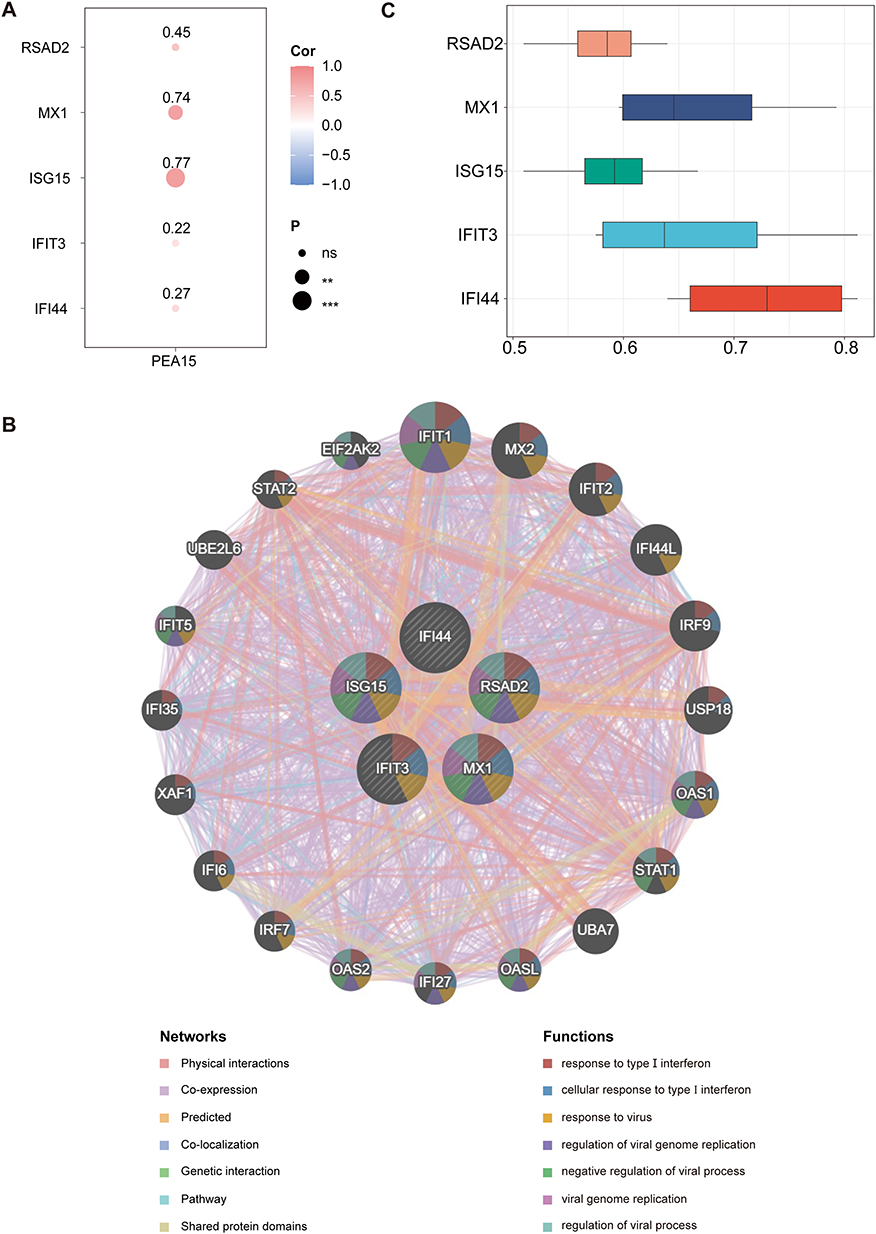 |
Figure 8 Correlation, gene-gene interaction (GGI) network, and functional correlations of core genes. (A) Heatmap showing the correlation between PEA15 and core genes. Red and blue represent positive and negative correlations, respectively. (B) Gene-gene interaction network of the five core genes (RSAD2, IFI44, IFIT3, ISG15, MX1). (C) Results of the Friends analysis for the core genes. |
Core Genes Were Located on Different Chromosomes and Played a Role in the Cytoplasm
The genomic regions of core genes were mapped, revealing that RSAD2, IFI44, IFIT3, ISG15, and MX1 are located on chromosomes 2, 1, 10, 1, and 21, respectively (Figure 9A). These findings provide a novel perspective on their functional associations at the chromosomal level. Additionally, the core genes were found to be localized in the cytoplasm (Figure 9B), suggesting a potential link between their functions and the cytoplasmic environment in sepsis. This association may be relevant to the regulatory role of EM-related PEA15 in sepsis progression.
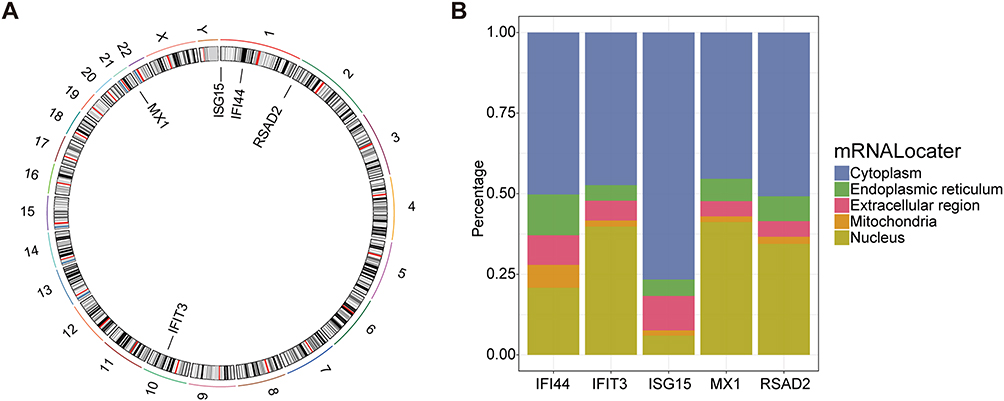 |
Figure 9 Chromosomal and subcellular localization of core genes. (A) Chromosomal locations of the core genes. (B) Subcellular localization of the core genes. |
PEA15 Could Affect the Progression of Sepsis by Regulating the Expression Patterns of Core Genes in Different Cell Types and Influencing Cell Functions
At the single-cell level, the molecular mechanisms by which EM-related PEA15 influences sepsis progression were further explored. Initially, the cell types involved in sepsis progression were analyzed. Following the filtration of scRNA-seq data, 30,319 cells and 19,808 genes were retained for further analysis (Figure S4A and B). Variability across these genes was depicted in Figure S5, highlighting 2000 highly variable genes. Based on a scree plot and PCA replacement test, the top 30 principal components were selected (P < 0.05) (Figure 10A and B). After removing batch effects (Figure S6A and B), cell clustering and annotation were performed, resulting in 16 distinct clusters (Figure 10C and D). These clusters were further annotated into 7 cell types using marker genes, including B cells, monocytes, erythroid precursors, T cells, DCs, natural killer (NK) cells, and platelets (Figure 10E–H and Table S4). This comprehensive characterization of cellular diversity in the sepsis environment was crucial for understanding the complexity of the disease. The proportions of cell types in sepsis and control groups were compared, revealing that monocytes represented the largest proportion in both groups (Figure 11A–C). Notably, B cells showed the most significant difference between groups, with a lower proportion in the sepsis group (P < 0.0001) (Table S5). The distribution and expression of core genes across different cell types were examined (Figure 11D–F). RSAD2 was most highly expressed in erythroid precursors, while IFI44 and MX1 showed the highest expression in DCs. IFIT3 and ISG15 exhibited the highest expression in monocytes. To further understand the functional roles of different cell types, related biological pathways were analyzed. These pathways included “NEIL3-mediated resolution of interstrand crosslinks (ICLs)” and “sterol 12-hydroxylation by CYP8B1” (Figure 11G). In summary, PEA15 likely plays a central role in sepsis progression by modulating the expression patterns of core genes across various cell types and influencing their functions. The distinct expression profiles of RSAD2, IFI44, MX1, IFIT3, and ISG15 highlight the complex interactions between different cell types and EM, providing valuable insights into potential therapeutic targets for sepsis management.
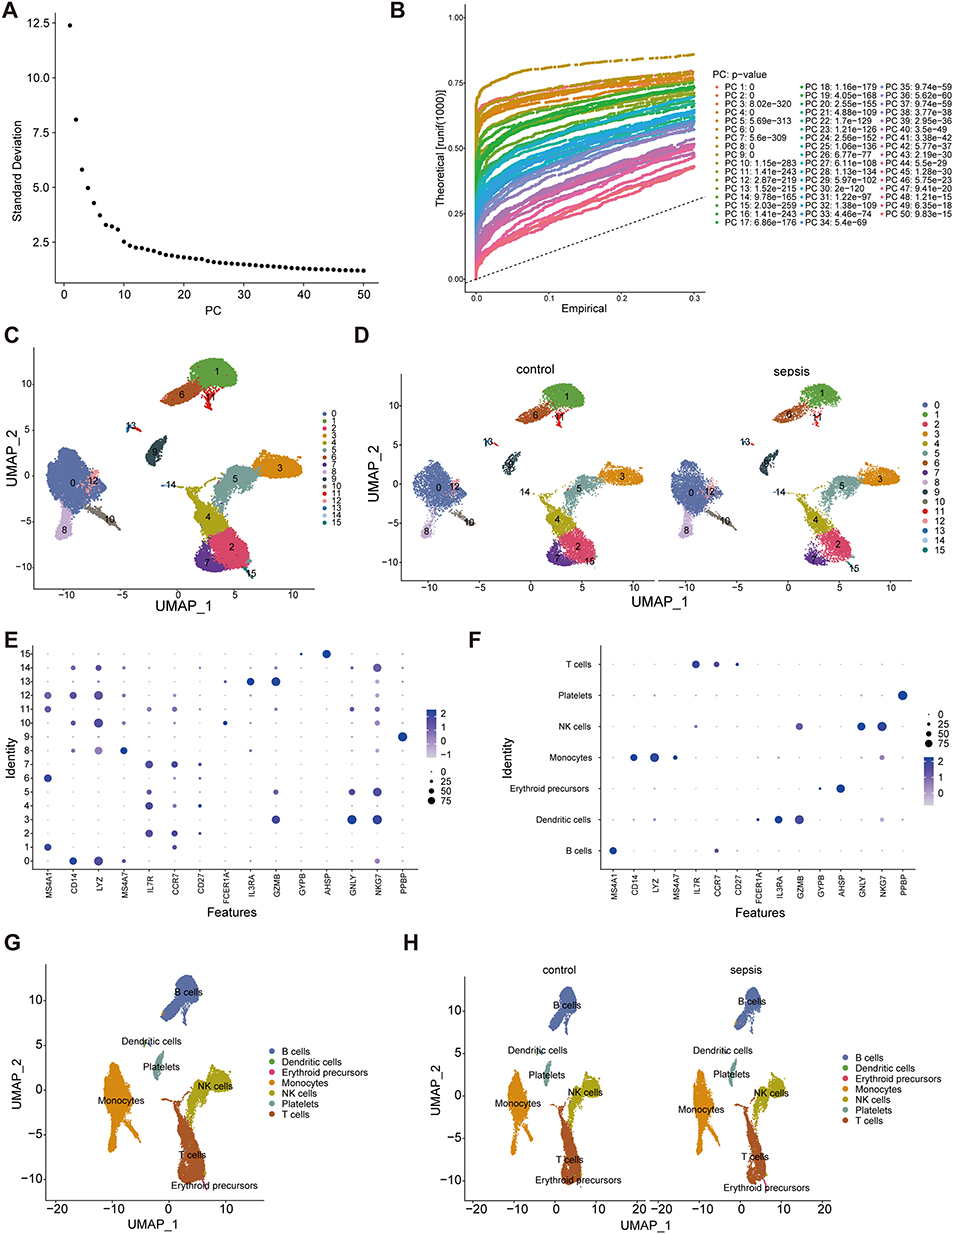 |
Figure 10 Single-cell sequencing analysis of cell types in sepsis. (A) Principal component scree plot. (B) Principal component line chart. (C) UMAP dimensionality reduction clustering. (D) UMAP dimensionality reduction clustering of different groups. (E) Bubble plots showing the expression levels of marker genes in different cell clusters. (F) Bubble plot of marker gene expression levels in different cell types. (G) UMAP diagram of cell type annotation. (H) UMAP diagrams annotated with cell types in different groups. |
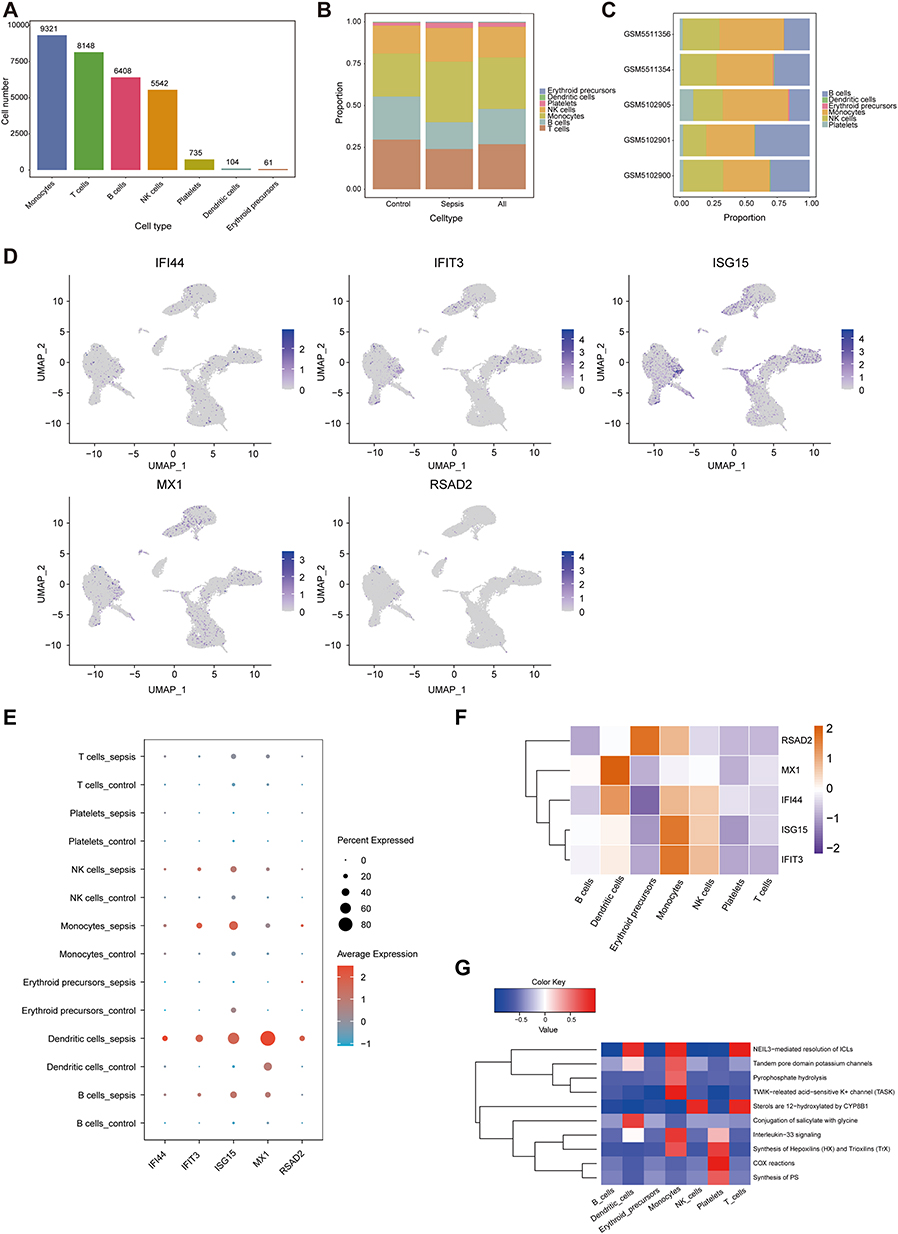 |
Figure 11 Identification of key cell types. (A) Number of cells for different cell types in GSE167363. (B) Proportions of different cell types in the control group, sepsis group, and all samples. (C) Proportions of different cell types across different samples. (D) UMAP graph showing the expression levels of key genes. (E) Bubble plot of expression levels of key genes. (F) Heatmap of expression levels of key genes. (G) Pathway enrichment in different cell types. |
Discussion
Sepsis is a common and critical condition in clinical practice, characterized by a high incidence and mortality rate.33 One of its key features is EM disorder.34 Numerous studies have demonstrated that various EMGRs contribute to the onset and progression of sepsis through diverse mechanisms.13,35–37 Identifying reliable biomarkers related to EM is essential for the prevention and treatment of sepsis. In this study, public RNA-seq data were utilized to identify the EM-related key genes ATM and PEA15 in sepsis through bioinformatics approaches. This study further explored the potential mechanisms of PEA15 by constructing a PEA15 overexpression cell model and conducting single-cell analysis, confirming its diagnostic and therapeutic value in sepsis.
In our study, pathway enrichment analysis of candidate genes identified multiple significantly enriched pathways, with “regulation of apoptotic signaling pathway” emerging as a key component. Accumulating evidence has firmly established apoptosis as a pivotal mechanism governing immune cell death—including neutrophils, macrophages, T lymphocytes, and dendritic cells(DCs)—which often precedes the onset of multiple organ failure in sepsis.38 Previous studies have shown that sepsis induces apoptosis and mitophagy in DCs, with mitophagy exerting a protective effect against sepsis-induced DC apoptosis.39 Consistent with this established paradigm, prior investigations have demonstrated that inhibition of apoptosis enhances survival rates in animal models of severe sepsis, while anti-apoptotic signaling pathways have been shown to mitigate sepsis-induced myocardial dysfunction.40 These results indicate the complexity of energy metabolism gene regulation in sepsis. We infer that it may affect the changes in immune cells and the immune microenvironment through different mechanisms, thereby influencing the progression of the disease.
PEA15 is widely expressed in the nervous system, especially in astrocytes, and plays a role in regulating cellular processes such as signal transduction, proliferation, and apoptosis.41 PEP-1-PEA15 can inhibit inflammatory responses by modulating macrophages and the MAPK pathway. Mechanistically, PEA15 interacts with mitochondrial hexokinase II (HKII) to form a molecular switch that governs cell fate under varying metabolic conditions, determining whether cells follow anabolic pathways for energy storage or enter catabolic states to produce energy.42 Furthermore, accumulating evidence links PEA15 to diverse pathological processes beyond sepsis. For instance, the TNF-α-LPA-LPA receptor-PLCε-PKD-PEA15-RSK-IκB-NF-κB pathway plays a pivotal role in promoting colonic inflammation,43 reflecting PEA15’s conserved involvement in pro-inflammatory cascades. Additionally, PEA15 interacts with hexokinase II (HKII) to inhibit hypoxia-induced apoptosis and regulate cellular metabolism,42 underscoring its dual function in cell survival and metabolic homeostasis. Building on these insights, our study addresses a critical research gap by systematically exploring PEA15’s role in sepsis for the first time. Initially identified via energy metabolism-focused screening—consistent with its known metabolic regulatory activity42—PEA15 correlates significantly with sepsis patient prognosis and exhibits robust discriminatory power between sepsis and control samples. Functionally, PEA15 overexpression in cell models effectively reduces pro-inflammatory cytokine levels. Collectively, these findings provide the first comprehensive demonstration of PEA15’s “diagnostic-prognostic-functional” triple value in sepsis, highlighting its potential as a clinically relevant biomarker and therapeutic target for this life-threatening disease.
ATM is pivotal in regulating the cell cycle, DNA repair, apoptosis, and antioxidant responses. In response to DNA double-strand breaks, ATM activates downstream signaling pathways to maintain genomic stability.44 In sepsis, ATM influences immune recovery and immunosuppression by regulating oxidative stress, DNA repair, and immune responses.45 Previous studies have demonstrated significant downregulation of ATM gene expression in sepsis patients.46 Notably, reduced ATM expression in HK-2 cells attenuates lipopolysaccharide (LPS)-induced inflammation and autophagy in sepsis-associated acute kidney injury (SA-AKI) in vitro, supporting that LPS may induce HK-2 cell autophagy via the ATM pathway to promote pro-inflammatory cytokine upregulation.47 In our study, both PEA15 and ATM were downregulated in sepsis, consistent with previous findings. Overexpression of PEA15 enhanced cell viability, reduced apoptosis, and suppressed inflammation.
However, this study has several limitations. First, the utilized datasets are limited in sample size, and machine learning approaches have inherent constraints (eg, overfitting); the predictive performance of the ceRNA network also depends on existing data and algorithms, potentially leading to discrepancies between predicted and actual outcomes. Second, only the BEAS-2B cell line was employed, which may not fully recapitulate the biological complexity of sepsis. Third, the functional role of ATM remains experimentally unvalidated, and the association between PEA15 and EM relies solely on gene expression correlations, lacking direct metabolic validation data. Fourth, the clinical applicability of the identified key sepsis-related genes requires further robust evidence, necessitating additional in-depth investigations. In future work, we plan to collaborate with clinical institutions to conduct large-sample, multi-center prospective studies, validate the diagnostic efficacy of PEA15, and establish clinical application guidelines to support its eventual translation into clinical practice.
Conclusions
In conclusion, this study identified two key EM-related genes (ATM and PEA15) with strong diagnostic potential in sepsis. The constructed cell model and subsequent single-cell analysis demonstrated that PEA15 has the potential to serve as a candidate biomarker for sepsis, though further validation is required. These findings provide a new theoretical basis and direction for the early diagnosis and treatment of sepsis, as well as for exploring the role of energy metabolism in sepsis.
Data Sharing Statement
The datasets utilized and analyzed in this study were obtained from the Gene Expression Omnibus (GEO) database (https://www.ncbi.nlm.nih.gov/geo/). Further relevant data are available from the corresponding author Ping Li upon reasonable request.
Ethical Approval
Human-related sequencing data analyzed in this study were retrieved from the public Gene Expression Omnibus (GEO) database. All included data were de-identified to protect individual privacy, with original collection and release approved by the relevant Ethical Review Committee (ERC) as stated in the database. In line with Articles 32 (1) and 32 (2) of the Measures for Ethical Review of Life Science and Medical Research Involving Human Subjects (National Health Commission, China, 2023), this study was exempt from additional ethical review, as it only involved bioinformatics analysis of existing public data without new human subjects, biological sample collection, or personal information disclosure.
Author Contributions
All authors made a significant contribution to the work reported, whether that is in the conception, study design, execution, acquisition of data, analysis and interpretation, or in all these areas; took part in drafting, revising or critically reviewing the article; gave final approval of the version to be published; have agreed on the journal to which the article has been submitted; and agree to be accountable for all aspects of the work.
Funding
This work was supported by Natural Science Basic Research Program of Shaanxi (2025JC-YBQN-1046) and Shaanxi Fundamental Science Research Project for Chemistry and Biology (23JHZ007).
Disclosure
The authors declare that they have no competing interests.
References
1. Angus DC, van der Poll T. Severe sepsis and septic shock. N Engl J Med. 2013;369(9):840–21. doi:10.1056/NEJMra1208623
2. Feng Z, Wang L, Yang J, et al. Sepsis: the evolution of molecular pathogenesis concepts and clinical management. Med Comm. 2025;6(3):e70109. doi:10.1002/mco2.70109
3. Xu F, Lu G, Wang J. Enhancing sepsis therapy: the evolving role of enteral nutrition. Front Nutr. 2024;11:1421632. doi:10.3389/fnut.2024.1421632
4. Huang M, Cai S, Su J. The pathogenesis of sepsis and potential therapeutic targets. Int J Mol Sci. 2019;20(21):5376. doi:10.3390/ijms20215376
5. Evans L, Rhodes A, Alhazzani W, et al. Surviving sepsis campaign: international guidelines for management of sepsis and septic shock 2021. Intensive Care Med. 2021;47(11):1181–1247. doi:10.1007/s00134-021-06506-y
6. Chen J, Liu Z, Zhou F, Sun Y, Jiang Z, Zhao P. Assessment of S100A8/A9 and resistin as predictive biomarkers for mortality in critically ill patients with sepsis. Front Cell Infect Microbiol. 2025;15:1555307. doi:10.3389/fcimb.2025.1555307
7. Zhou W, Lin Z, Deng H, et al. Identification of potential therapeutic drug targets for sepsis by combining the human plasma proteome and genome: a mendelian randomization study. J Thorac Dis. 2025;17(4):2576–2593. doi:10.21037/jtd-2025-590
8. Scholtes C, Giguère V. Transcriptional control of energy metabolism by nuclear receptors. Nat Rev Mol Cell Biol. 2022;23(11):750–770. doi:10.1038/s41580-022-00486-7
9. Sun J, Zhang J, Tian J, et al. Mitochondria in Sepsis-Induced AKI. J Am Soc Nephrol. 2019;30(7):1151–1161. doi:10.1681/asn.2018111126
10. Ferrer R, Iba T. Mitochondrial damage in sepsis. Juntendo Iji Zasshi. 2024;70(4):269–272. doi:10.14789/jmj.JMJ24-0016-P
11. Arulkumaran N, Deutschman CS, Pinsky MR, et al. MITOCHONDRIAL FUNCTION IN SEPSIS. Shock. 2016;45(3):271–281. doi:10.1097/shk.0000000000000463
12. Yu X, Gao J, Zhang C. Sepsis-induced cardiac dysfunction: mitochondria and energy metabolism. Intensive Care Med Exp. 2025;13(1):20. doi:10.1186/s40635-025-00728-w
13. Yang Y, Chen Q, Fan S, et al. Glutamine sustains energy metabolism and alleviates liver injury in burn sepsis by promoting the assembly of mitochondrial HSP60-HSP10 complex via SIRT4 dependent protein deacetylation. Redox Rep. 2024;29(1):2312320. doi:10.1080/13510002.2024.2312320
14. Gauthier T, Yao C, Dowdy T, et al. TGF-β uncouples glycolysis and inflammation in macrophages and controls survival during sepsis. Sci Signal. 2023;16(797):eade0385. doi:10.1126/scisignal.ade0385
15. Pan T, Sun S, Chen Y, et al. Immune effects of PI3K/Akt/HIF-1α-regulated glycolysis in polymorphonuclear neutrophils during sepsis. Crit Care. 2022;26(1):29. doi:10.1186/s13054-022-03893-6
16. Langfelder P, Horvath S. WGCNA: an R package for weighted correlation network analysis. BMC Bioinf. 2008;9:559. doi:10.1186/1471-2105-9-559
17. Ritchie ME, Phipson B, Wu D, et al. limma powers differential expression analyses for RNA-sequencing and microarray studies. Nucleic Acids Res. 2015;43(7):e47. doi:10.1093/nar/gkv007
18. Gustavsson EK, Zhang D, Reynolds RH, Garcia-Ruiz S, Ryten M. ggtranscript: an R package for the visualization and interpretation of transcript isoforms using ggplot2. Bioinformatics. 2022;38(15):3844–3846. doi:10.1093/bioinformatics/btac409
19. Gu Z, Hübschmann D. Make interactive complex heatmaps in R. Bioinformatics. 2022;38(5):1460–1462. doi:10.1093/bioinformatics/btab806
20. Chen H, Boutros PC. VennDiagram: a package for the generation of highly-customizable Venn and Euler diagrams in R. BMC Bioinf. 2011;12:35. doi:10.1186/1471-2105-12-35
21. Wu T, Hu E, Xu S, et al. clusterProfiler 4.0: a universal enrichment tool for interpreting omics data. Innovation. 2021;2(3):100141. doi:10.1016/j.xinn.2021.100141
22. Cheng P, Gong S, Guo C, et al. Exploration of effective biomarkers and infiltrating immune cells in osteoarthritis based on bioinformatics analysis. Artif Cells Nanomed Biotechnol. 2023;51(1):242–254. doi:10.1080/21691401.2023.2185627
23. Friedman J, Hastie T, Tibshirani R. Regularization paths for generalized linear models via coordinate descent. J Stat Softw. 2010;33(1):1–22. doi:10.18637/jss.v033.i01
24. Hou N, Li M, He L, et al. Predicting 30-days mortality for MIMIC-III patients with sepsis-3: a machine learning approach using XGboost. J Transl Med. 2020;18(1):462. doi:10.1186/s12967-020-02620-5
25. Liu TT, Li R, Huo C, et al. Identification of CDK2-related immune forecast model and ceRNA in lung adenocarcinoma, a pan-cancer analysis. Front Cell Dev Biol. 2021;9:682002. doi:10.3389/fcell.2021.682002
26. Robin X, Turck N, Hainard A, et al. pROC: an open-source package for R and S+ to analyze and compare ROC curves. BMC Bioinf. 2011;12:77. doi:10.1186/1471-2105-12-77
27. Yu G, Li F, Qin Y, Bo X, Wu Y, Wang S. GOSemSim: an R package for measuring semantic similarity among GO terms and gene products. Bioinformatics. 2010;26(7):976–978. doi:10.1093/bioinformatics/btq064
28. Naquin D, d’Aubenton-Carafa Y, Thermes C, Silvain M. CIRCUS: a package for Circos display of structural genome variations from paired-end and mate-pair sequencing data. BMC Bioinf. 2014;15:198. doi:10.1186/1471-2105-15-198
29. Qiu X, Li J, Bonenfant J, et al. Dynamic changes in human single-cell transcriptional signatures during fatal sepsis. J Leukoc Biol. 2021;110(6):1253–1268. doi:10.1002/jlb.5ma0721-825r
30. Griss J, Viteri G, Sidiropoulos K, Nguyen V, Fabregat A, Hermjakob H. ReactomeGSA - efficient multi-omics comparative pathway analysis. Mol Cell Proteomics. 2020;19(12):2115–2125. doi:10.1074/mcp.TIR120.002155
31. Chang J, Wu H, Wu J, et al. Constructing a novel mitochondrial-related gene signature for evaluating the tumor immune microenvironment and predicting survival in stomach adenocarcinoma. J Transl Med. 2023;21(1):191. doi:10.1186/s12967-023-04033-6
32. Sun M, Yang Q, Hu C, Zhang H, Xing L. Identification and validation of autophagy-related genes in sepsis-induced acute respiratory distress syndrome and immune infiltration. J Inflamm Res. 2022;15:2199–2212. doi:10.2147/jir.S355225
33. Srzić I, Nesek Adam V, Pejak DT. Sepsis definition: what’s new in the treatment guidelines. Acta Clin Croat. 2022;61(Suppl 1):67–72. doi:10.20471/acc.2022.61.s1.11
34. Xiao M, Liu D, Xu Y, Mao W, Li W. Role of PFKFB3-driven glycolysis in sepsis. Ann Med. 2023;55(1):1278–1289. doi:10.1080/07853890.2023.2191217
35. Fan W, Zhang Q, Wang C, Sun J, Zhang J, Yin Y. GLP-1 as a regulator of sepsis outcomes: insights into cellular metabolism, inflammation, and therapeutic potential. Int Immunopharmacol. 2025;152:114390. doi:10.1016/j.intimp.2025.114390
36. Xu B, Ye X, Sun K, et al. IRAP drives ribosomal degradation to refuel energy for platelet activation during septic thrombosis. Adv Sci. 2025;12(13):e2411914. doi:10.1002/advs.202411914
37. Xu LL, Zhou Z, Schäuble S, et al. Multi-omics and -organ insights into energy metabolic adaptations in early sepsis onset. Adv Sci. 2025;12(30):e04418. doi:10.1002/advs.202504418
38. Luan YY, Yao YM, Xiao XZ, Sheng ZY. Insights into the apoptotic death of immune cells in sepsis. J Interferon Cytokine Res. 2015;35(1):17–22. doi:10.1089/jir.2014.0069
39. Zhang Y, Chen L, Luo Y, et al. Pink1/parkin-mediated mitophagy regulated the apoptosis of dendritic cells in sepsis. Inflammation. 2022;45(3):1374–1387. doi:10.1007/s10753-022-01628-x
40. Xie L, Zhao M, Zong L, Yue Y. Propofol ameliorates sepsis-induced myocardial dysfunction via anti-apoptotic, anti-oxidative properties, and mTOR signaling. Discov Med. 2024;36(189):2088–2097. doi:10.24976/Discov.Med.202436189.193
41. Yong JI, Kim DW, Shin MJ, et al. PEP-1-PEA15 suppresses inflammatory responses by regulation of MAPK in macrophages and animal models. Immunobiology. 2018;223(11):709–717. doi:10.1016/j.imbio.2018.07.019
42. Mergenthaler P, Kahl A, Kamitz A, et al. Mitochondrial hexokinase II (HKII) and phosphoprotein enriched in astrocytes (PEA15) form a molecular switch governing cellular fate depending on the metabolic state. Proc Natl Acad Sci U S A. 2012;109(5):1518–1523. doi:10.1073/pnas.1108225109
43. Wakita M, Edamatsu H, Li M, Emi A, Kitazawa S, Kataoka T. Phospholipase Cϵ activates nuclear factor-κb signaling by causing cytoplasmic localization of ribosomal S6 kinase and facilitating its phosphorylation of inhibitor κb in colon epithelial cells. J Biol Chem. 2016;291(24):12586–12600. doi:10.1074/jbc.M116.717561
44. Ma S, Cao C, Che S, et al. PHF8-promoted TOPBP1 demethylation drives ATR activation and preserves genome stability. Sci Adv. 2021;7(19). doi:10.1126/sciadv.abf7684
45. Huff LA, Yan S, Clemens MG. Mechanisms of Ataxia Telangiectasia Mutated (ATM) control in the DNA damage response to oxidative stress, epigenetic regulation, and persistent innate immune suppression following sepsis. Antioxidants. 2021;10(7):1146. doi:10.3390/antiox10071146
46. Wu XL, Guo YN. Role of cellular senescence genes and immune infiltration in sepsis and sepsis-induced ARDS based on bioinformatics analysis. J Inflamm Res. 2024;17:9119–9133. doi:10.2147/jir.S488463
47. Shaha A, Thelmo W, Jaffe BM. Is parotid lymphadenopathy a new disease or part of AIDS? Am J Surg. 1988;156(4):297–300. doi:10.1016/s0002-9610(88)80297-6
 © 2026 The Author(s). This work is published and licensed by Dove Medical Press Limited. The
full terms of this license are available at https://www.dovepress.com/terms
and incorporate the Creative Commons Attribution
- Non Commercial (unported, 4.0) License.
By accessing the work you hereby accept the Terms. Non-commercial uses of the work are permitted
without any further permission from Dove Medical Press Limited, provided the work is properly
attributed. For permission for commercial use of this work, please see paragraphs 4.2 and 5 of our Terms.
© 2026 The Author(s). This work is published and licensed by Dove Medical Press Limited. The
full terms of this license are available at https://www.dovepress.com/terms
and incorporate the Creative Commons Attribution
- Non Commercial (unported, 4.0) License.
By accessing the work you hereby accept the Terms. Non-commercial uses of the work are permitted
without any further permission from Dove Medical Press Limited, provided the work is properly
attributed. For permission for commercial use of this work, please see paragraphs 4.2 and 5 of our Terms.