Back to Journals » Cancer Management and Research » Volume 10
Establishment of cancer/testis antigen profiling based on clinicopathological characteristics in resected pathological stage III non-small cell lung cancer
Authors Jin S, Cao S ![]() , Grigorev A, Li J, Meng Q, Wang C, Feng M, Hu J
, Grigorev A, Li J, Meng Q, Wang C, Feng M, Hu J ![]() , Jiang F, Yu Y
, Jiang F, Yu Y ![]()
Received 29 January 2018
Accepted for publication 7 May 2018
Published 16 July 2018 Volume 2018:10 Pages 2031—2046
DOI https://doi.org/10.2147/CMAR.S164043
Checked for plagiarism Yes
Review by Single anonymous peer review
Peer reviewer comments 3
Editor who approved publication: Dr Antonella D'Anneo
Shi Jin,1,* Shoubo Cao,1,2,* Aleksei Grigorev,3,* Jianhua Li,4 Qingwei Meng,1 Chunyan Wang,1,2 Meiyan Feng,5 Jing Hu,1 Feng Jiang,3 Yan Yu1
1Department of Medical Oncology, Harbin Medical University Cancer Hospital, Harbin, People’s Republic of China; 2Department of Medical Oncology, Linyi People’s Hospital, Linyi City, People’s Republic of China; 3School of Computer Science and Technology, Harbin Institute of Technology, Harbin, People’s Republic of China; 4Department of Neurosurgery, The Fourth Affiliated Hospital of Harbin Medical University, Harbin, People’s Republic of China; 5Department of Pathology, Harbin Medical University Cancer Hospital, Harbin, People’s Republic of China
*These authors contributed equally to this work
Background: Cancer/testis antigen (CTA) expression was found to be highly heterogeneous in previous studies. We aimed to establish a precision CTA profiling in resected stage III non-small cell lung cancer (NSCLC) and demonstrate the best CTA combination covering the widest range of NSCLC cases.
Materials and methods: The expression of 10 CTAs was evaluated in 200 resected stage III NSCLC tissue specimens at protein level. Hierarchical clustering and python programming language analyses was used to demonstrate CTA expression and coverage.
Results: The most commonly expressed CTAs for total cases were MAGEA1 (60.0%), MAGEA10 (50.0%), and KK-LC-1 (47.5%). CTA expression was histology dependent, and concurrent expression was common. The best 2, 3, and 4 CTA combination covered 72.0%, 76.5%, and 79.5% of total cases, respectively. Stratified analysis based on variable clinicopathological characteristics achieved the maximum coverage of 92.3% with only 2 CTA combination in patients with features of male sex, positive smoking history, and adenocarcinoma, compared with a 85.0% coverage when 10 CTAs were assessed. Selected CTA expression was correlated with prognosis based on subgroup analysis. No significant difference was found between CTA expression and epidermal growth factor receptor mutant status.
Conclusion: We established an individualized CTA profiling in resected stage III NSCLC based on 10 CTA expression. With the help of computer programming language, the goal of the maximum CTA expression coverage was reached by using the least CTA combination based on sex, smoking history, and histology. These results were significant for the further study of CTA-specific T-cell immunotherapy.
Keywords: lung cancer, cancer/testis antigens, immunotherapy, prognosis, profiling
Introduction
Lung cancer remains the most frequent newly diagnosed and first leading cause of cancer-related deaths worldwide.1–3 In more developed countries, it has even overpassed breast cancer as the leading cause of cancer death in females. In People’s Republic of China, lung cancer incidence has been increasing and the new diagnosed lung cancer cases in year 2011 increased by 34.8% compared with 2005 data.2 In addition to high incidence and mortality, lung cancer prognosis remains unsatisfied, with a 5-year survival of <10%.2 Treatment strategies with high efficiency and safety profiles are urgently needed.
Antigen-specific T-cell immunotherapy has become an active area of cancer immunotherapy in recent years. Previous studies have demonstrated that antigen-specific T-cell immunotherapy can induce a phenotypic and functional conversion of T cells into a central memory type, resulting in 50%–80% disease stabilization in refractory and progressive metastatic melanoma patients. Continuous complete response was even seen in one patient for over 3 years.4,5 Another study involving relapsed or high-risk leukemia showed a response rate of over 60% induced by long-lived memory T cells.6 All studies give us great encouragement for the long-term efficient anti-tumor effect and safety profiles of antigen-specific T-cell immunotherapy.4–6 However, not all malignancies have potential targets with high immunogenicity.7 The lack of effective targets is the most important element restricting the usage of antigen-specific T-cell immunotherapy in a wide range of cancers.
Cancer/testis antigens (CTAs) are considered as ideal targets for cancer immunotherapy. They are expressed in a wide range of malignancies, while in normal tissues their expression is restricted in germline cells.8–10 Germ cells can escape from T-cell-induced attack due to the downregulation of HLA class I molecules. Thus, T cells can exclusively identify and attack cancer cells expressing corresponding CTA but spare normal somatic cells.11 Along with bladder cancer, melanoma, and ovarian cancer, non-small cell lung cancer (NSCLC) is found to have the highest frequency of CTA expression.11 Thus, CTA-specific T-cell immunotherapy may be more promising in NSCLC treatment.
So far, there are over 200 distinguished CTAs in CT database (http://www.cta.lncc.br), and 39% (90/232) CTAs are demonstrated to be expressed in NSCLC.11,12 However, CTA expression has significant regional and racial difference. For example, MAGEA3 expression in NSCLC ranges from 35% to 60% in studies involving American and European patients.13,14 Previous studies of NSCLC mostly focused on the evaluation of a subset of CTA expression.8,15–19 In addition, it is costly to establish the antigen-specific T-cell therapy library expressing different CTA expressions. In order to improve the feasibility of antigen-specific T-cell therapy, the screening of CTAs to achieve the goal of the widest range of CTA expression coverage with the least CTAs combination is of great value.
Currently, no CTA expression profiles are established in People’s Republic of China. In this study, we aimed to establish a CTA profiling in resected pathological stage III NSCLC through a comprehensive analysis of 10 CTAs’ expression. Stratified analysis was also performed based on variable clinicopathological characteristics to evaluate the best CTA combination covering the widest range of selected NSCLC cases. The construction of CTA expression profile will provide more potential for further study of antigen-specific T-cell immunotherapy.
Materials and methods
Patients and specimens
This study used 200 resected pathological stage III lung cancer tissue specimens (100 squamous cell carcinoma [SCC], 100 adenocarcinomas [ADCs], 1:1) for immunohistochemistry. The tissues were surgically obtained at our hospital between January 2012 and December 2014. This study was approved by the Ethics Committee of Harbin Medical University Cancer Hospital. Prior to the study, written informed consent was obtained from each patient. The tumor stage was classified based on the 8th Edition Lung Cancer Stage Classification.20
CTA selection
CTAs are categorized into multiple family members. In order to select representative CTAs to establish CTAs profiling, we chose CTAs of variable family numbers as soon as possible including MAGE family, newly identified families, and some other family numbers (Table 1).
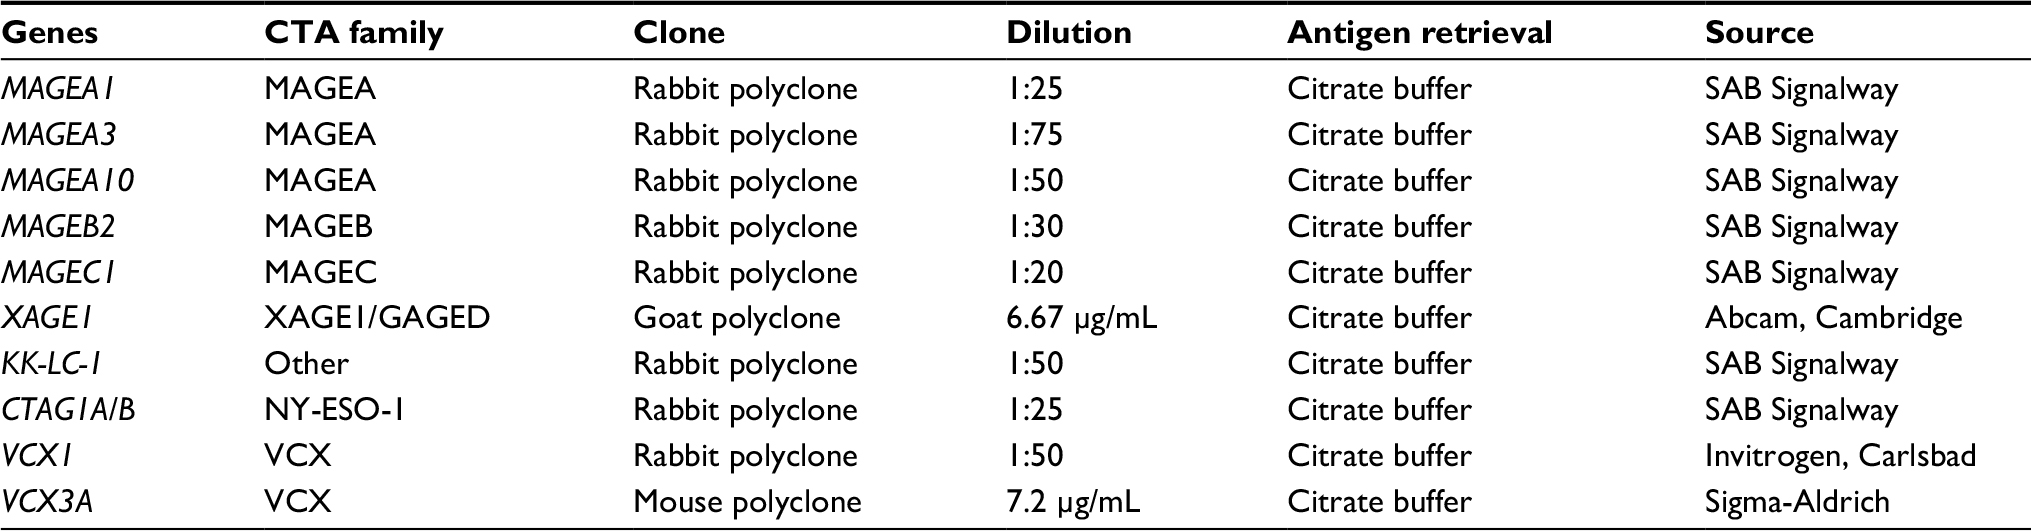 | Table 1 List of immunomarkers used for the immunohistochemical staining of non-small cell lung cancer |
Immunohistochemistry
The paraffin-embedded samples were sliced into 5 μm sections. Each slice was heated at 70°C overnight and then dewaxed using a xylene and ethanol gradient. Then, 3% hydrogen peroxide was used to block the endogenous peroxidase activity, and the specimens were heated in 0.01 mmol/L citrate buffer (pH 6.0) for 10 min. The sections were then incubated with the primary antibodies overnight at 4°C. The primary antibodies and dilutions used in this study are listed in Table 1. The specimens were washed and then incubated in a secondary antibody for 20 min at room temperature. The specimens were visualized with 3,3’-diaminobenzidine (ZSGB-BIO Inc., Beijing, People’s Republic of China) and counterstained with hematoxylin solution.
Immunohistochemistry scoring
CTA expression was assessed by two pathologists. The immunopositivity of the CTAs was evaluated in a semiquantitative manner for the intensity (0=negative, 1=weak positive, 2=moderate positive, 3=strong positive) and the percentage of positive tumor cells (0%–100%). All tumors with >20% of the cells showing 2+ or 3+ staining intensity were considered positive.21
Hierarchical analysis
We employed unsupervised hierarchical clustering analysis to demonstrate deep pairwise relationships between genes. This clustering method seeks to build a hierarchy of clusters. Normalized Hamming distance was used as a metric, and clusters were formed by using farthest point algorithm. Result of clustering is shown as heatmap.
Frequency of CTA expression analysis
In order to estimate percent of patients who have specific genes, we wrote an algorithm in python programming language. The algorithm generated all possible permutations (without repetitions) of specific genes and estimated how many patients had this combination of genes. Such analysis was not only performed on all patients, but also on certain groups of patients as well. For instance, we did split patients according to their sex, histology, and smoking status, and performed the analysis.
EGFR mutation examination
Briefly, genomic DNA was extracted and purified from formalin-fixed paraffin-embedded NSCLC biopsies. The most common epidermal growth factor receptor (EGFR) mutations including exon 18, 19, 20, and 21 were assessed by using the PCR screening method. The assay was performed in 384-well reaction plates (Thermo Fisher Scientific, Waltham, MA, USA), and the reaction was carried out in 40 uL, containing 4 uL of the TaqMan Master Mix (Thermo Fisher Scientific), primers and probes at a final concentration of 9 uM and 2 uM, respectively. The remaining volume was made up to 40 uL with PCR grade water. The reaction was carried out at 95°C for 5 minutes, followed by 46 cycles at 95°C for 40 seconds, 62°C for 20 seconds, and 60°C for 40 seconds, in the Thermo Fisher Scientific 7500 HT machine.
Statistical analysis
The overall survival (OS) time was defined from diagnosis to death or the last follow-up if the patients were still alive. Sufficient clinical data were available. The survival curves and 95% confidence intervals (CIs) were obtained using the Kaplan-Meier method, and the survival rate in different groups was compared by log-rank tests. The relationships between CTAs and clinicopathological features were assessed by the chi-squared test. Univariate analysis was used to evaluate the potential prognostic role of variables. The prognostic factors with P-values <0.2 in the univariate analysis were examined in the multivariate analysis. SPSS 16.0 statistical software was used for statistical analysis. All P-values <0.05 were considered statistically significant.
Results
Patient characteristics
The patient characteristics are listed in Table 2. Most patients were males (66.0%, n=132) and ever smokers (61.5%, n=123). The mean age for all cases was 56.61±8.45 years (range 32–81 years). All patients enrolled were diagnosed at stage III: IIIA (76.5%, n=153) and IIIB (23.5%, n=47). The number of patients treated with postoperative adjuvant chemotherapy and thoracic radiotherapy was 104 (52.0%) and 24 (12.0%), respectively. The main pathological types were ADC (50.0%, n=100) and SCC (50.0%, n=100).
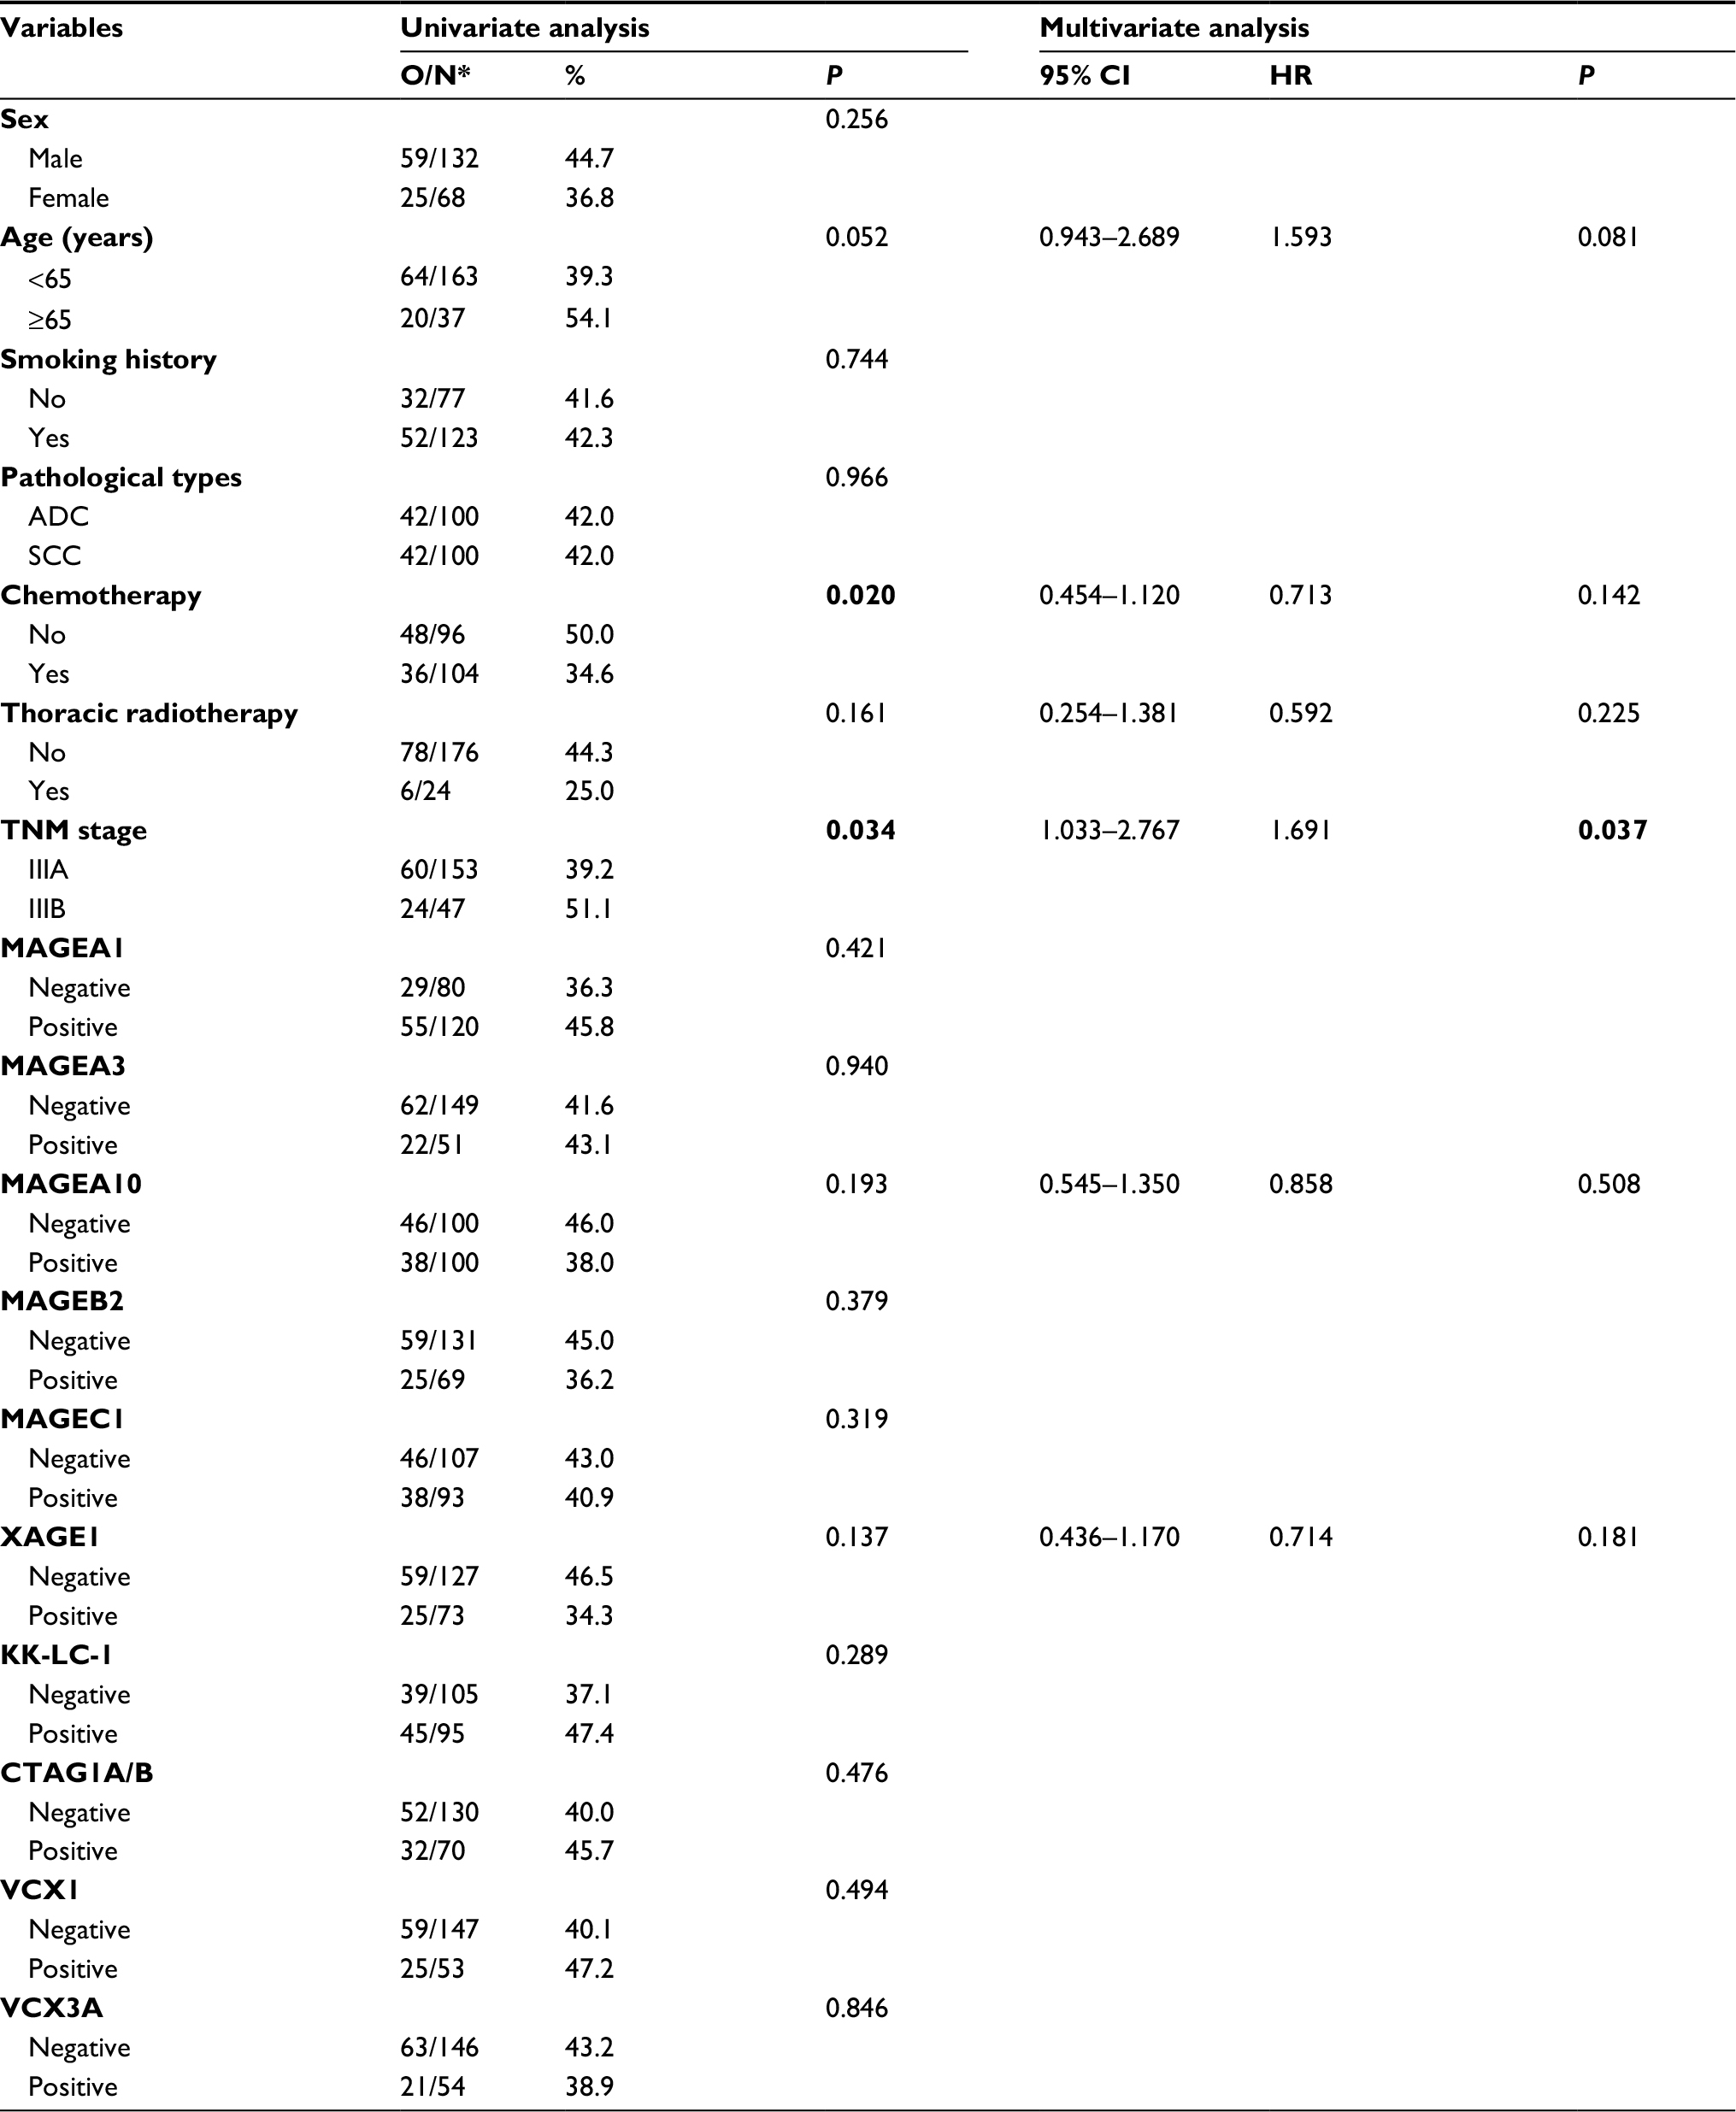 | Table 2 Prognostic analysis of 10 CTAs at protein level Note: *Observed death number/total patient number in each group. The bold numbers represent that the P-value of the prognostic factors in univariate analysis is <0.05, which is significant in univariate analysis. Abbreviations: CTAs, cancer/testis antigens; CI, confidence interval; HR, hazard ratio; ADC, adenocarcinoma; SCC, squamous cell carcinoma. |
CTA expression at protein level
The negative and positive CTA expression profiles in NSCLC are listed in Figure 1. In 200 patients, CTA expression sequence from low to high was listed as MAGEA3, VCX1, VCX3A, MAGEB2, CTAG1A/B, XAGE1, MAGEC1, KK-LC-1, MAGEA10, and MAGEA1, range 25.5%–60.0% (Figure 2A). CTA expression in ADC and SCC patients ranged from 24.0% to 64.0% and from 17.0% to 56.0%, respectively. MAGEA1 showed the highest frequency of CTA expression (Table 3).
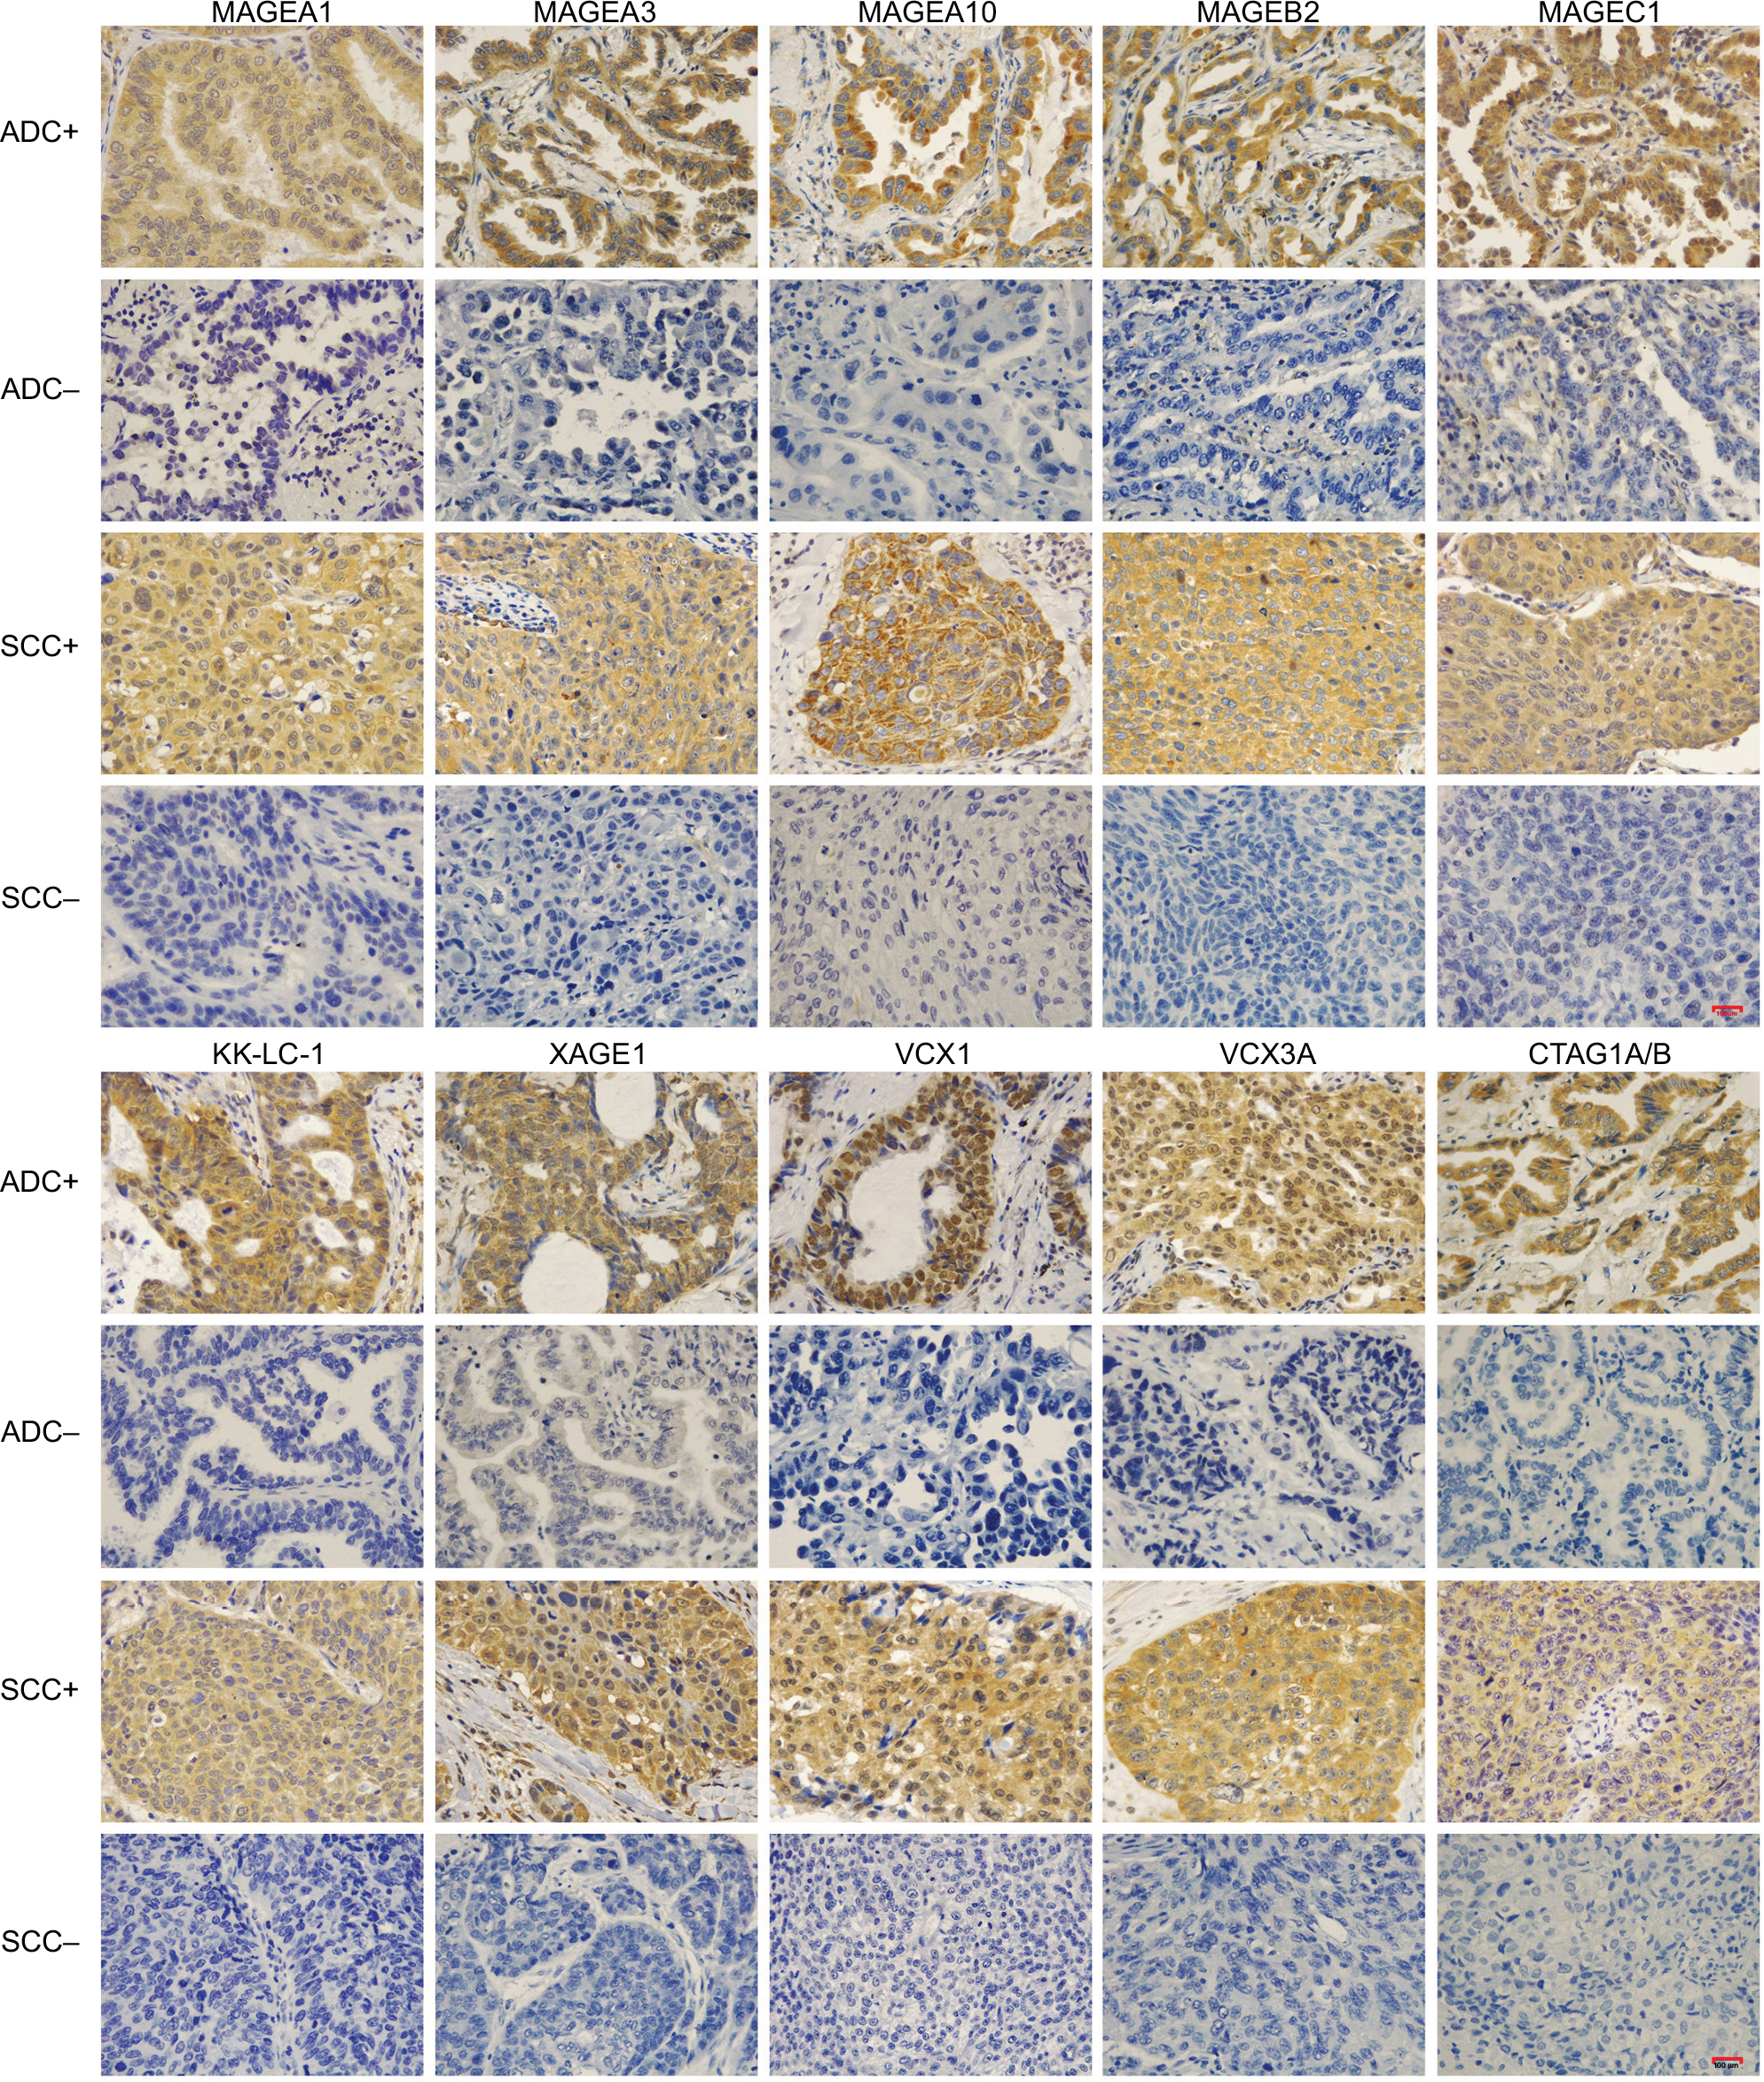 | Figure 1 Positive and negative immunohistochemical staining of 10 selected CTAs in NSCLC according to pathological types. Note: +, positive expression; −, negative expression. Abbreviations: CTAs, cancer/testis antigens; NSCLC, non-small cell lung cancer; ADC, adenocarcinoma; SCC, squamous cell carcinoma. |
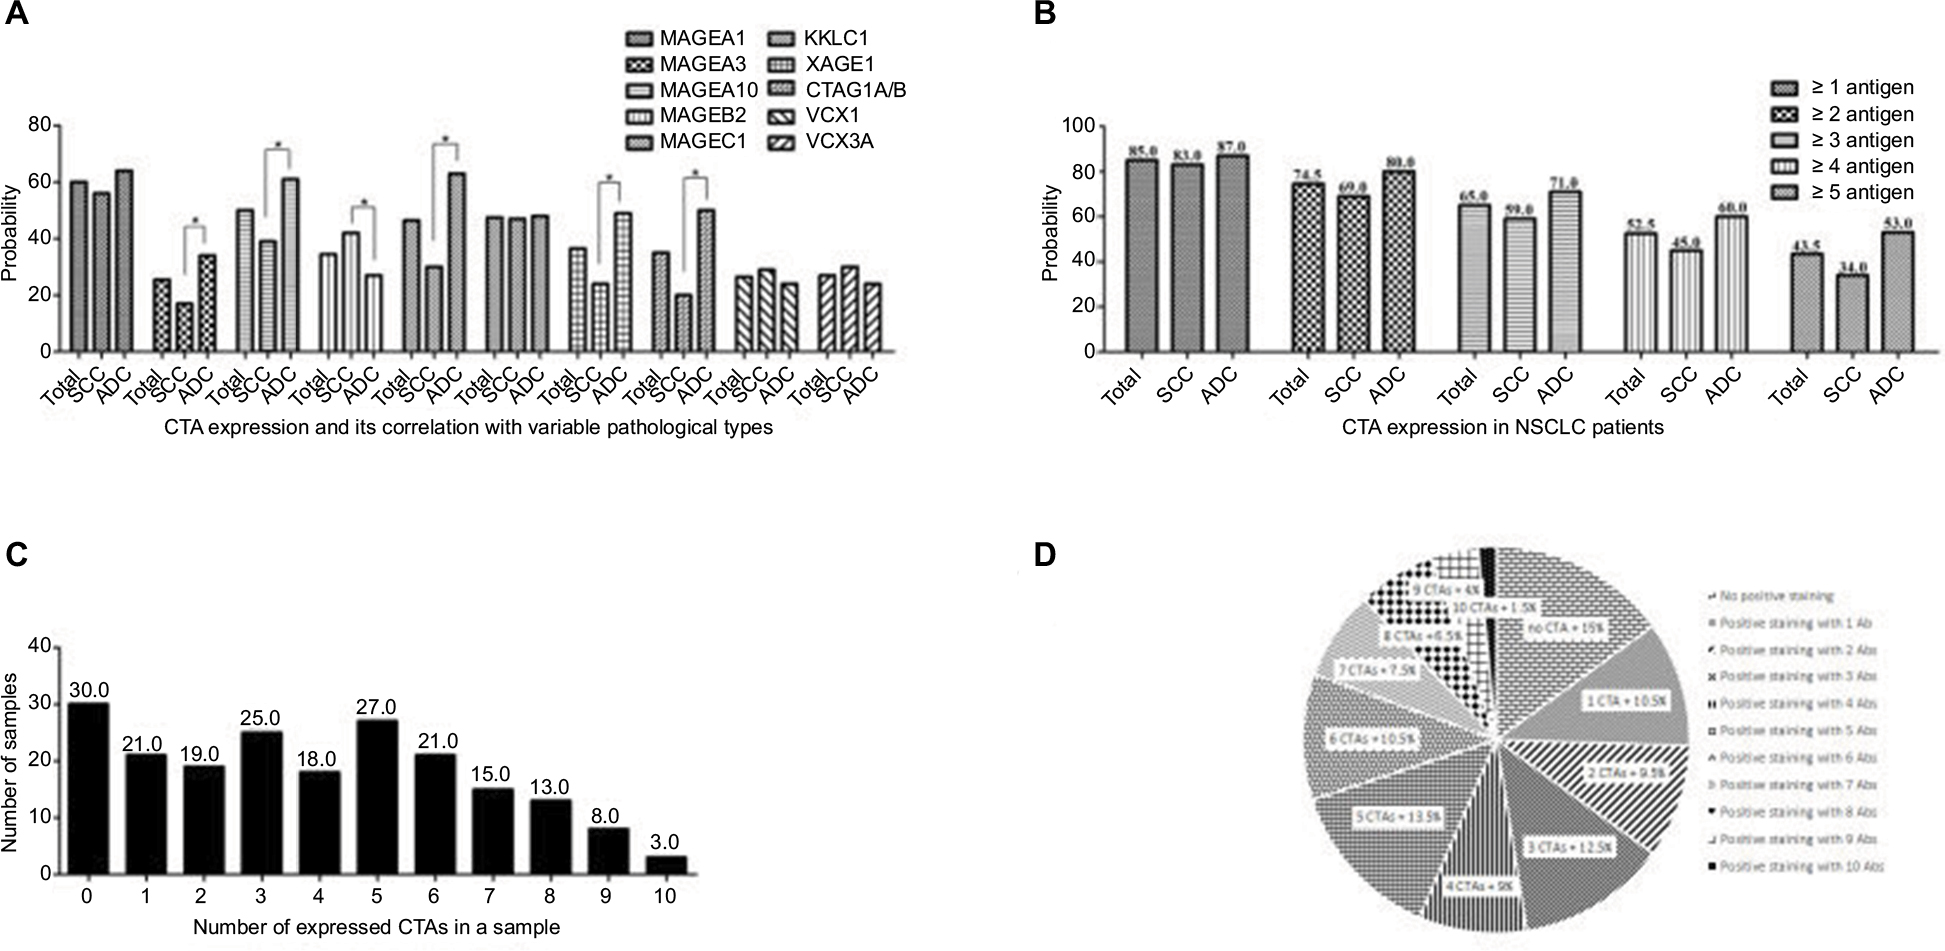 | Figure 2 Expression of CTAs in NSCLC. Notes: (A) CTA expression analysis in NSCLC. *P<0.05. (B) At least 1–5 CTA positive expression in NSCLC. (C and D) CTA co-expression and proportion for all cases. Co-expression of the number of CTAs expressed in a NSCLC tumor sample is shown on the x-axis and the number of tumor samples is shown on the y-axis. Abbreviations: CTAs, cancer/testis antigens; NSCLC, non-small cell lung cancer; ADC, adenocarcinoma; SCC, squamous cell carcinoma. |
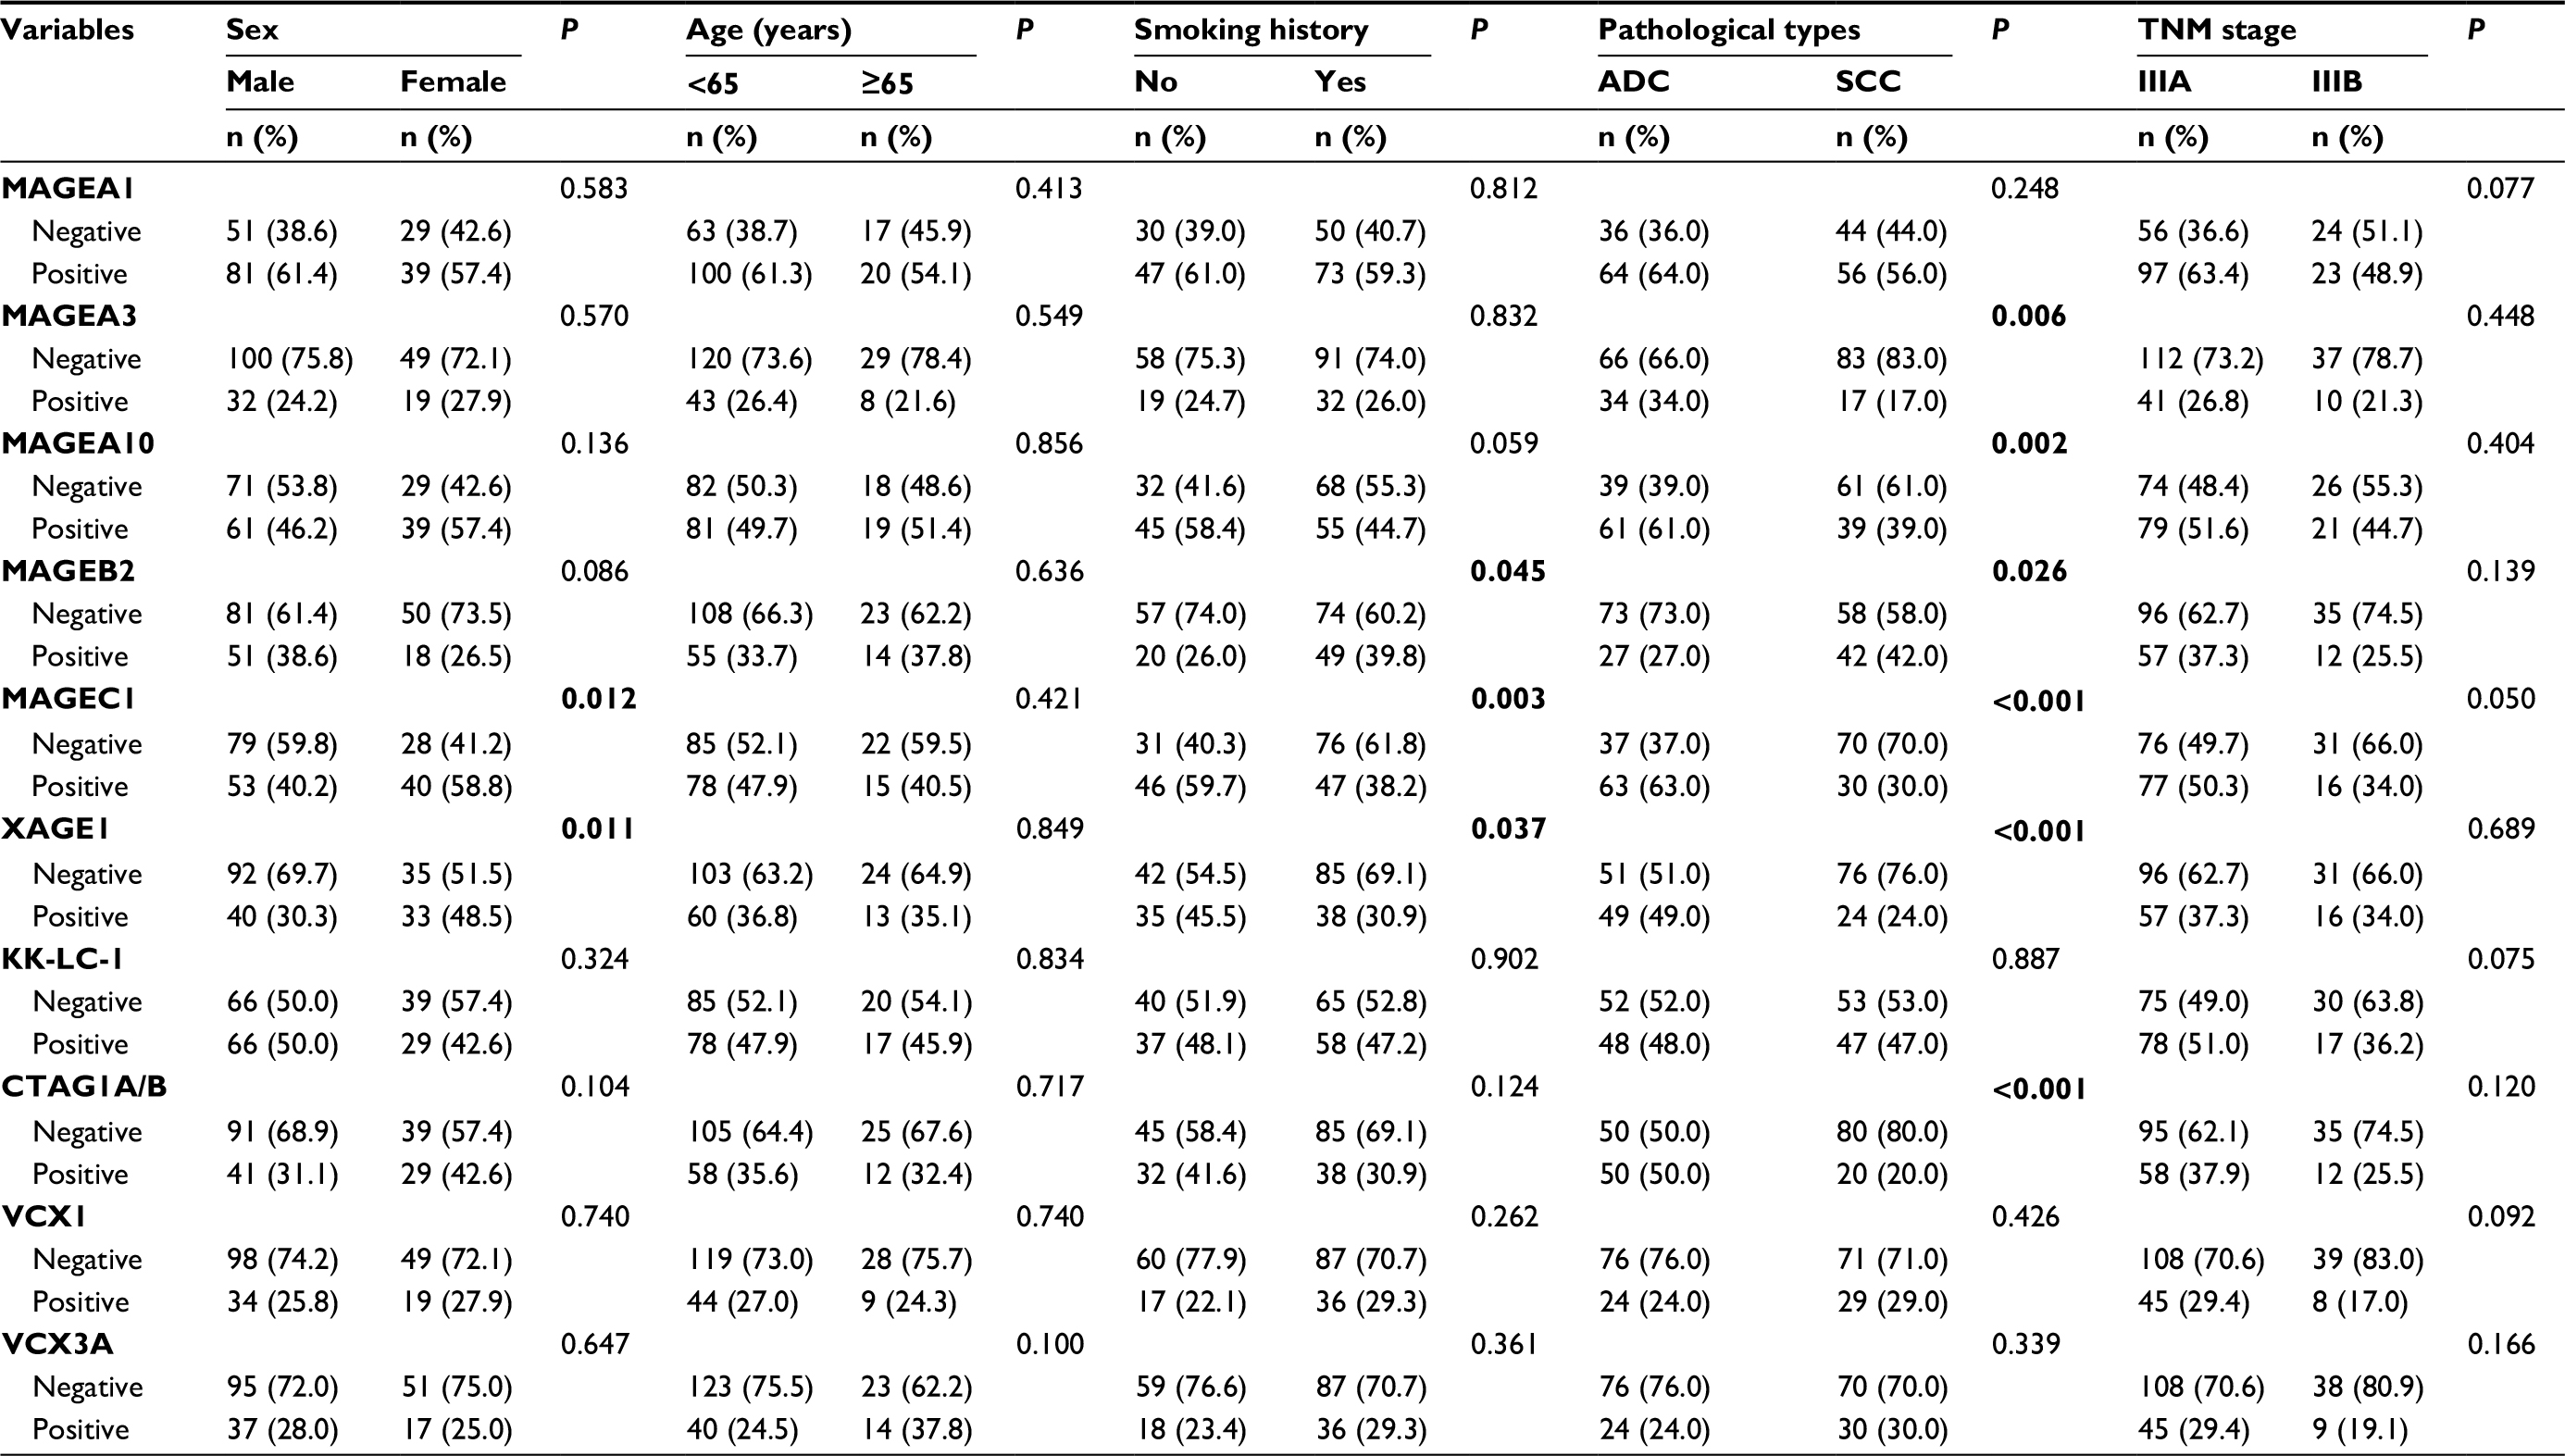 | Table 3 Correlations between CTA expression and clinicopathological features Note: The significance of the bold numbers represents that cancer/testis antigen expression is closely correlated with the related clinicopathological characteristics, and this content is listed in the result part of “Relationship between CTA expression and clinicopathological features”. Abbreviations: CTA, cancer/testis antigen; ADC, adenocarcinoma; SCC, squamous cell carcinoma. |
CTA co-expression and cluster analysis
The majority of CTAs were co-expressed in our study; only 15.0% (n=30) of NSCLC cases did not express any CTA (Figure 2 C and D). The frequencies of at least 1–5 expressed CTAs were 85.0%, 74.5%, 65.0%, 52.5%, and 43.5% of the total 200 cases, respectively. We also found the rates were 87.0%, 80.0%, 71.0%, 60.0%, and 53.0% for ADC patients. The results were 83.0%, 69.0%, 59.0%, 45.0%, and 34.0% for SCC patients (Figure 2B).
Hierarchical clustering analysis was performed to assess CTA expression patterns among 200 NSCLC cases (Figure 3). The results showed that CTAs were co-expressed, one CTA usually expressed together with another one or several CTAs. For example, MAGEA1 expression was usually accompanied by MAGEC1 expression. In addition, CTA expression was found to be histology dependent. For example, XAGE1 showed a significant higher expression frequency in lung ADC.
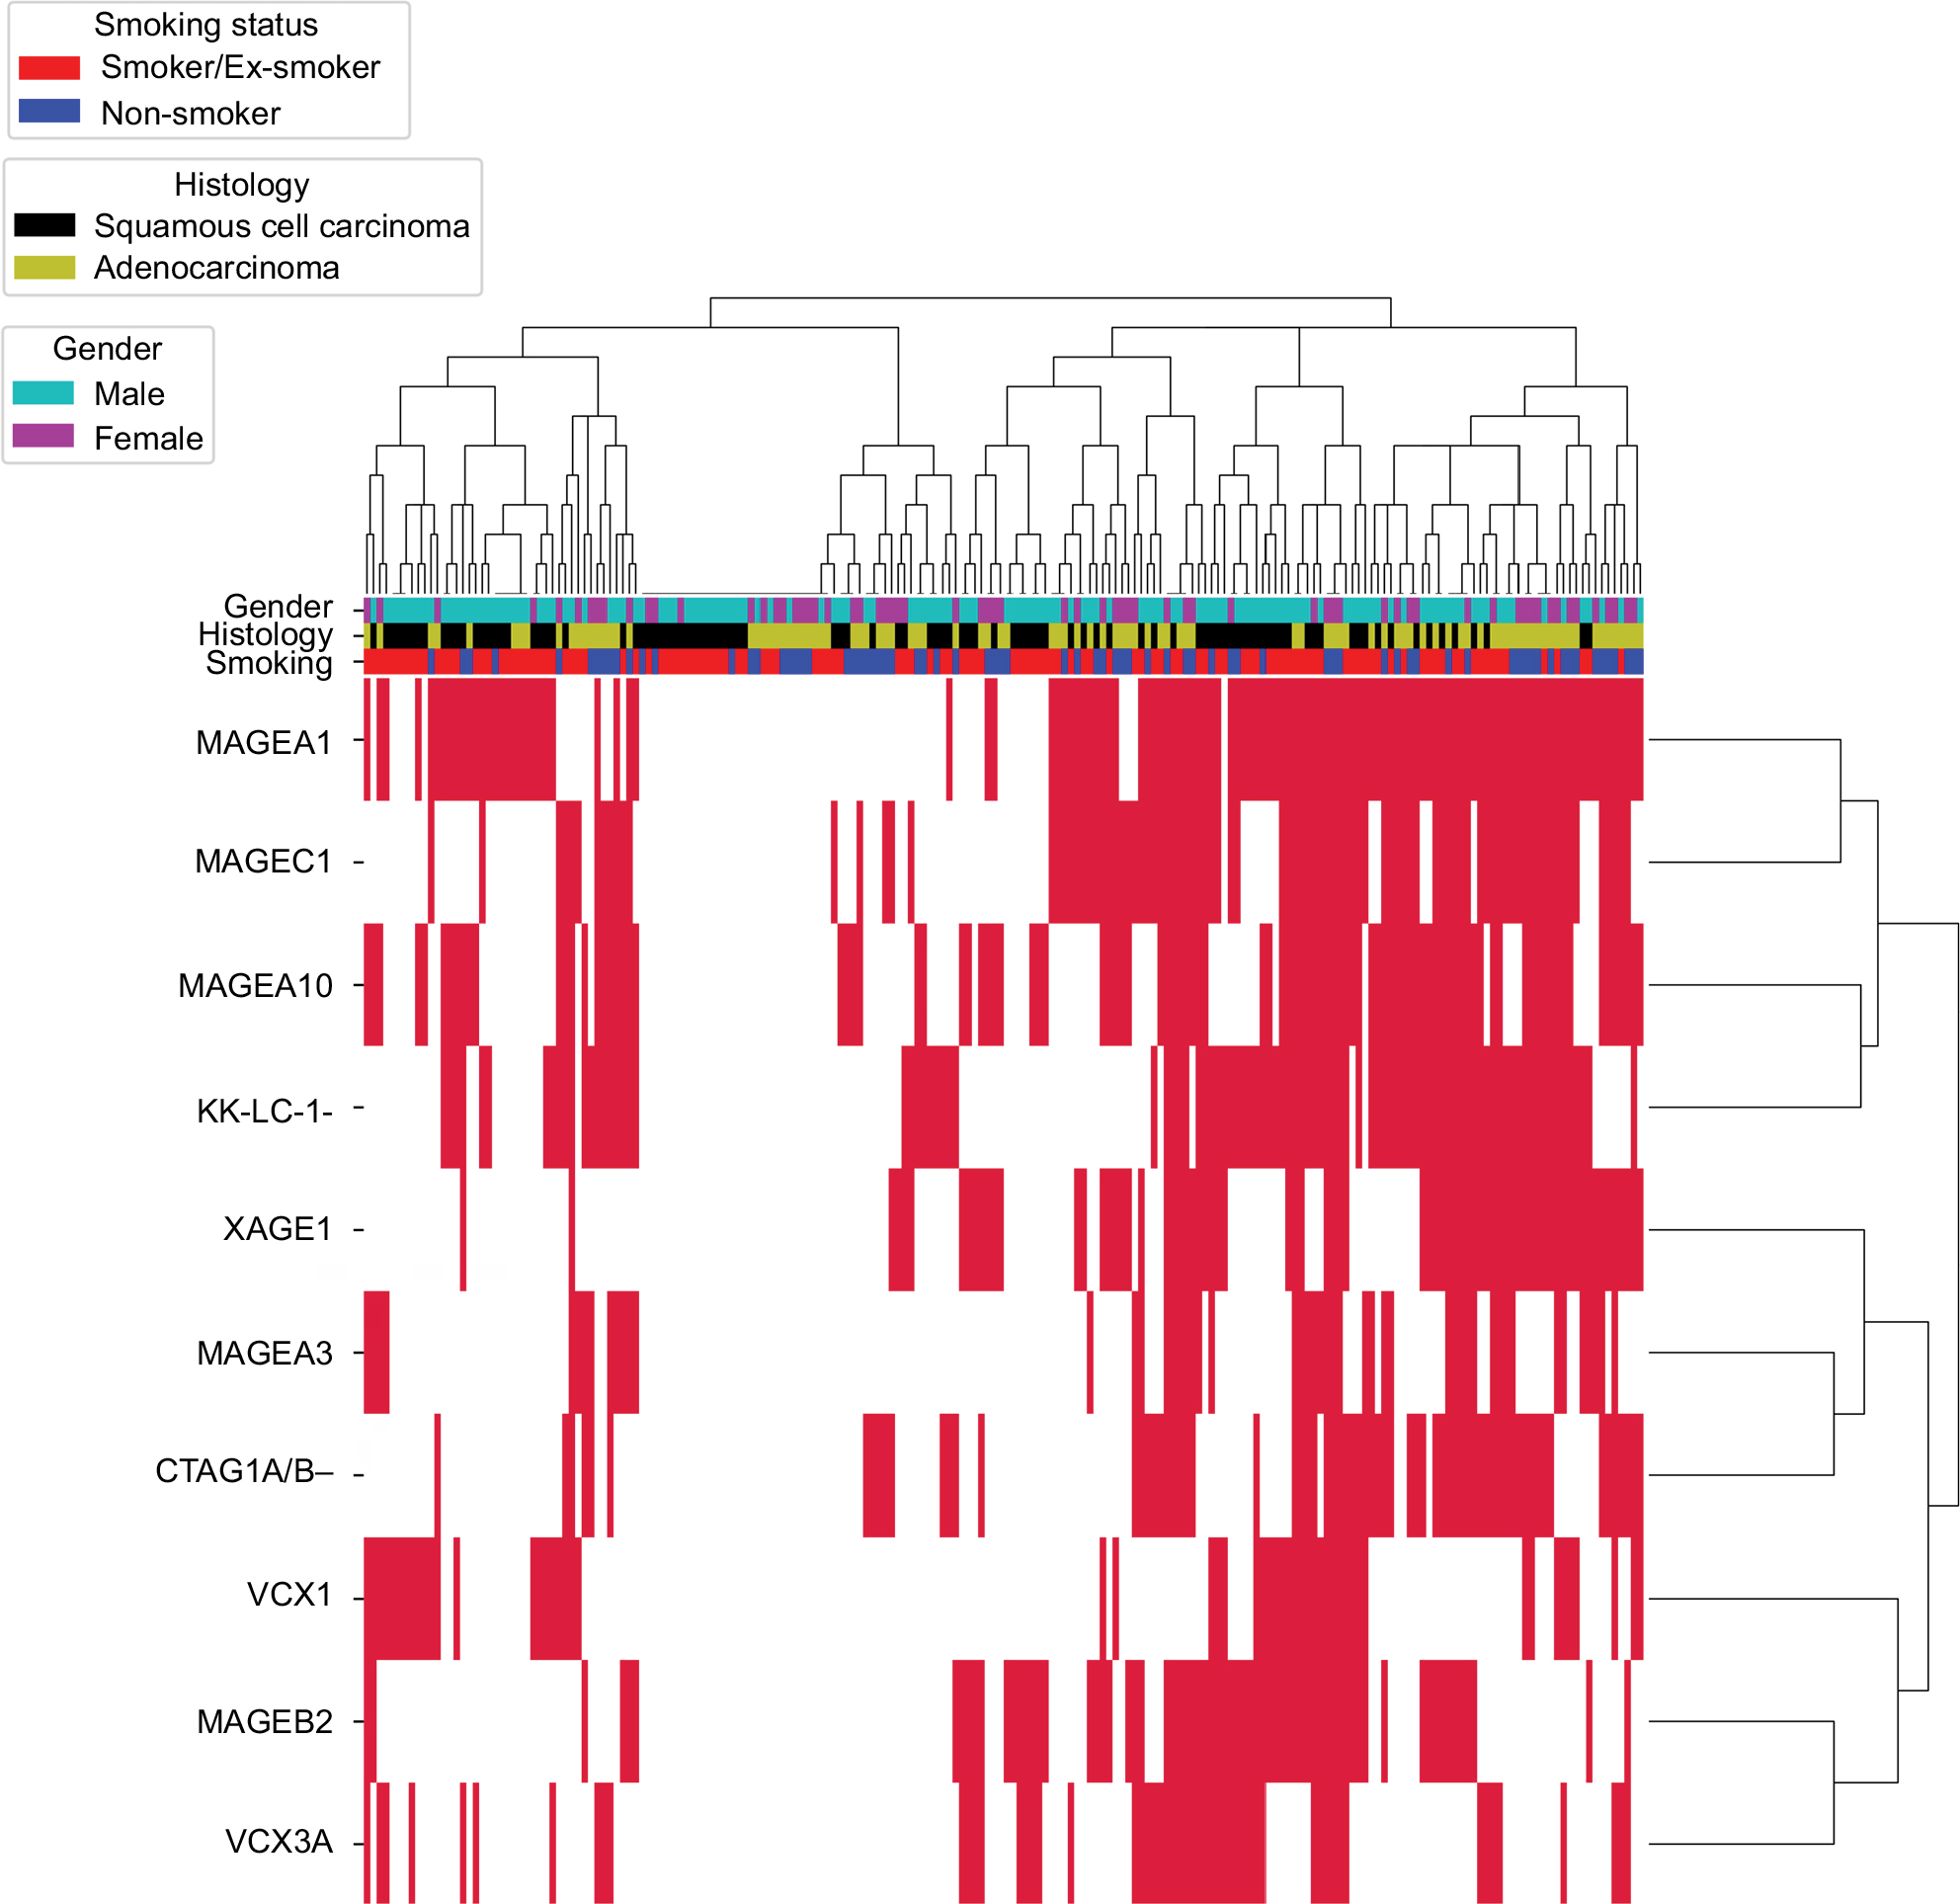 | Figure 3 Hierarchical cluster analysis of CTAs in NSCLC. Notes: The 200 NSCLC cases were clustered based on the expression of the 10 CTAs in our group. The positive CTAs expression is marked red, and the negative expression is marked white. Abbreviations: CTAs, cancer/testis antigens; NSCLC, non-small cell lung cancer. |
Relationship between CTA expression and clinicopathological features
Of all CTAs, MAGEA3 (ADC vs SCC, 34.0% vs 17.0%, P=0.006), MAGEA10 (61.0% vs 39.0%, P=0.002), MAGEC1 (63.0% vs 30.0%, P<0.001), XAGE1 (49.0% vs 24.0%, P<0.001,) and CTAG1A/B (50.0% vs 20.0%, P<0.001) had higher expression trends in ADC. MAGEB2 (ADC vs SCC, 27.0% vs 42.0%, P=0.026) had an increased expression in SCC (Figure 2A, Table 3). We also found that MAGEC1 and XAGE1 were expressed more often in female patients. In addition, MAGEB2, MAGEC1, and XAGE1 expressions were closely associated with smoking history. No significant age and TNM differences were found between CTA expressions. CTA expression was closely correlated with sex, smoking history, and histology.
Profiling CTAs in resected stage III lung cancer
Any 2, 3, and 4 CTAs were coupled to explore the best CTA combinations that could cover the widest range of patients in our group. Of 10 CTAs, there were 45, 120, and 210 conditions when any 2, 3, and 4 CTAs were combined. The best 2, 3, and 4 combinations were MAGEA1+MAGEA10, MAGEA1+MAGEA10+CTAG1A/B, and MAGEA1+MAGEA10+CTAG1A/B+VCX1 (or MAGEA1+MAGEA10+MAGEB2+CTAG1A/B), which covered 72.0%, 76.5%, and 79.5% of total cases, respectively. The top 10 combinations in 2, 3, and 4 CTAs groups are listed in Figure 4A.
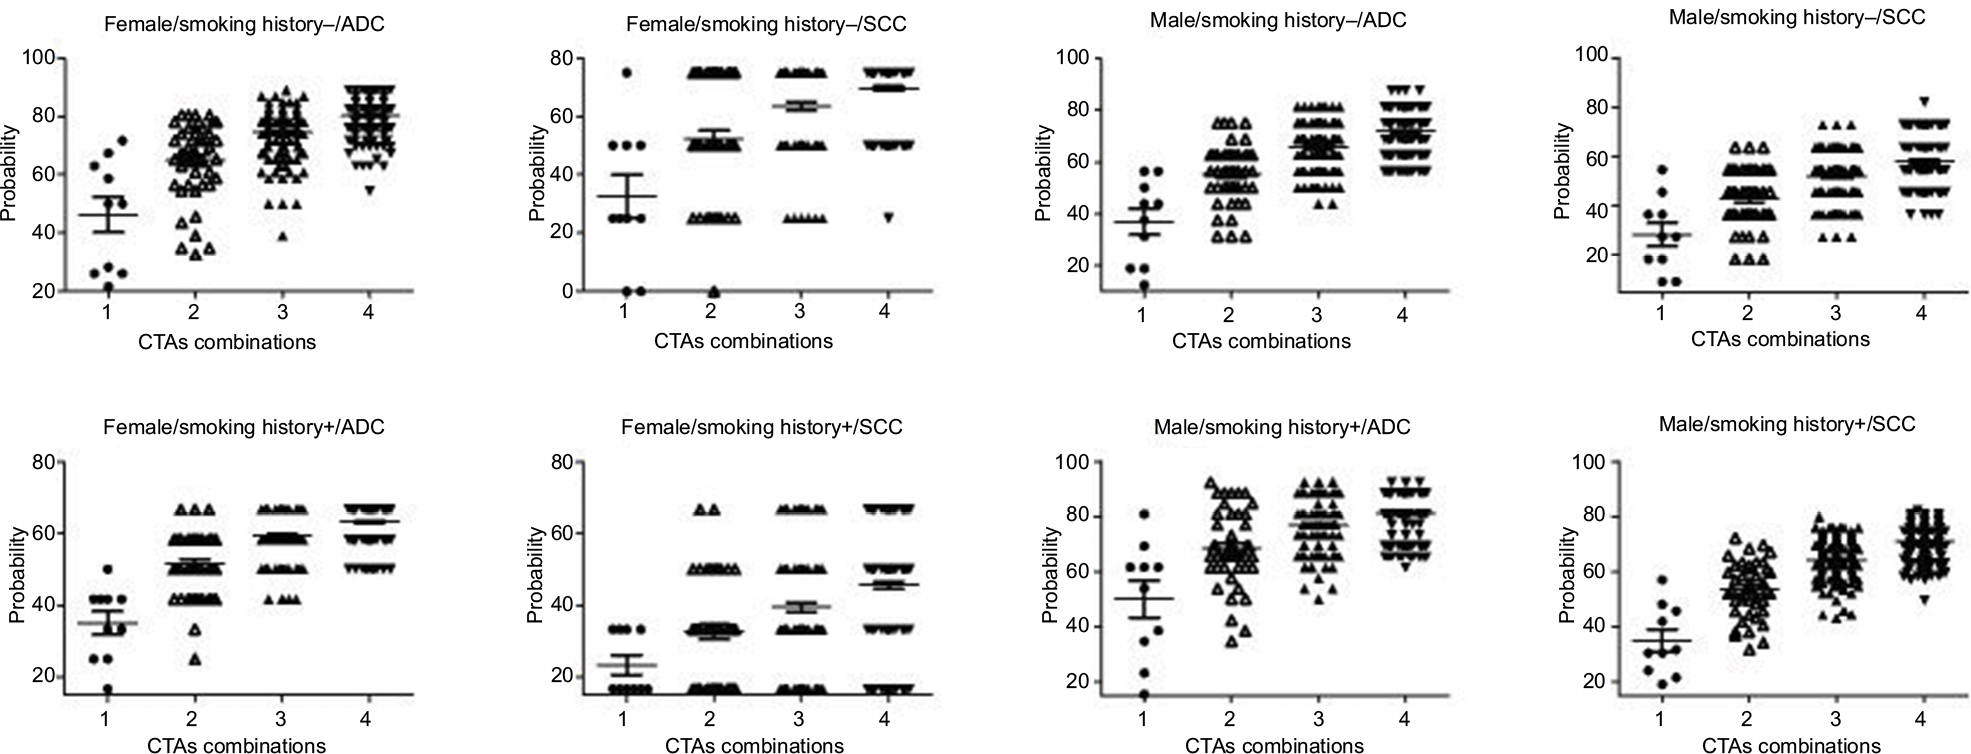
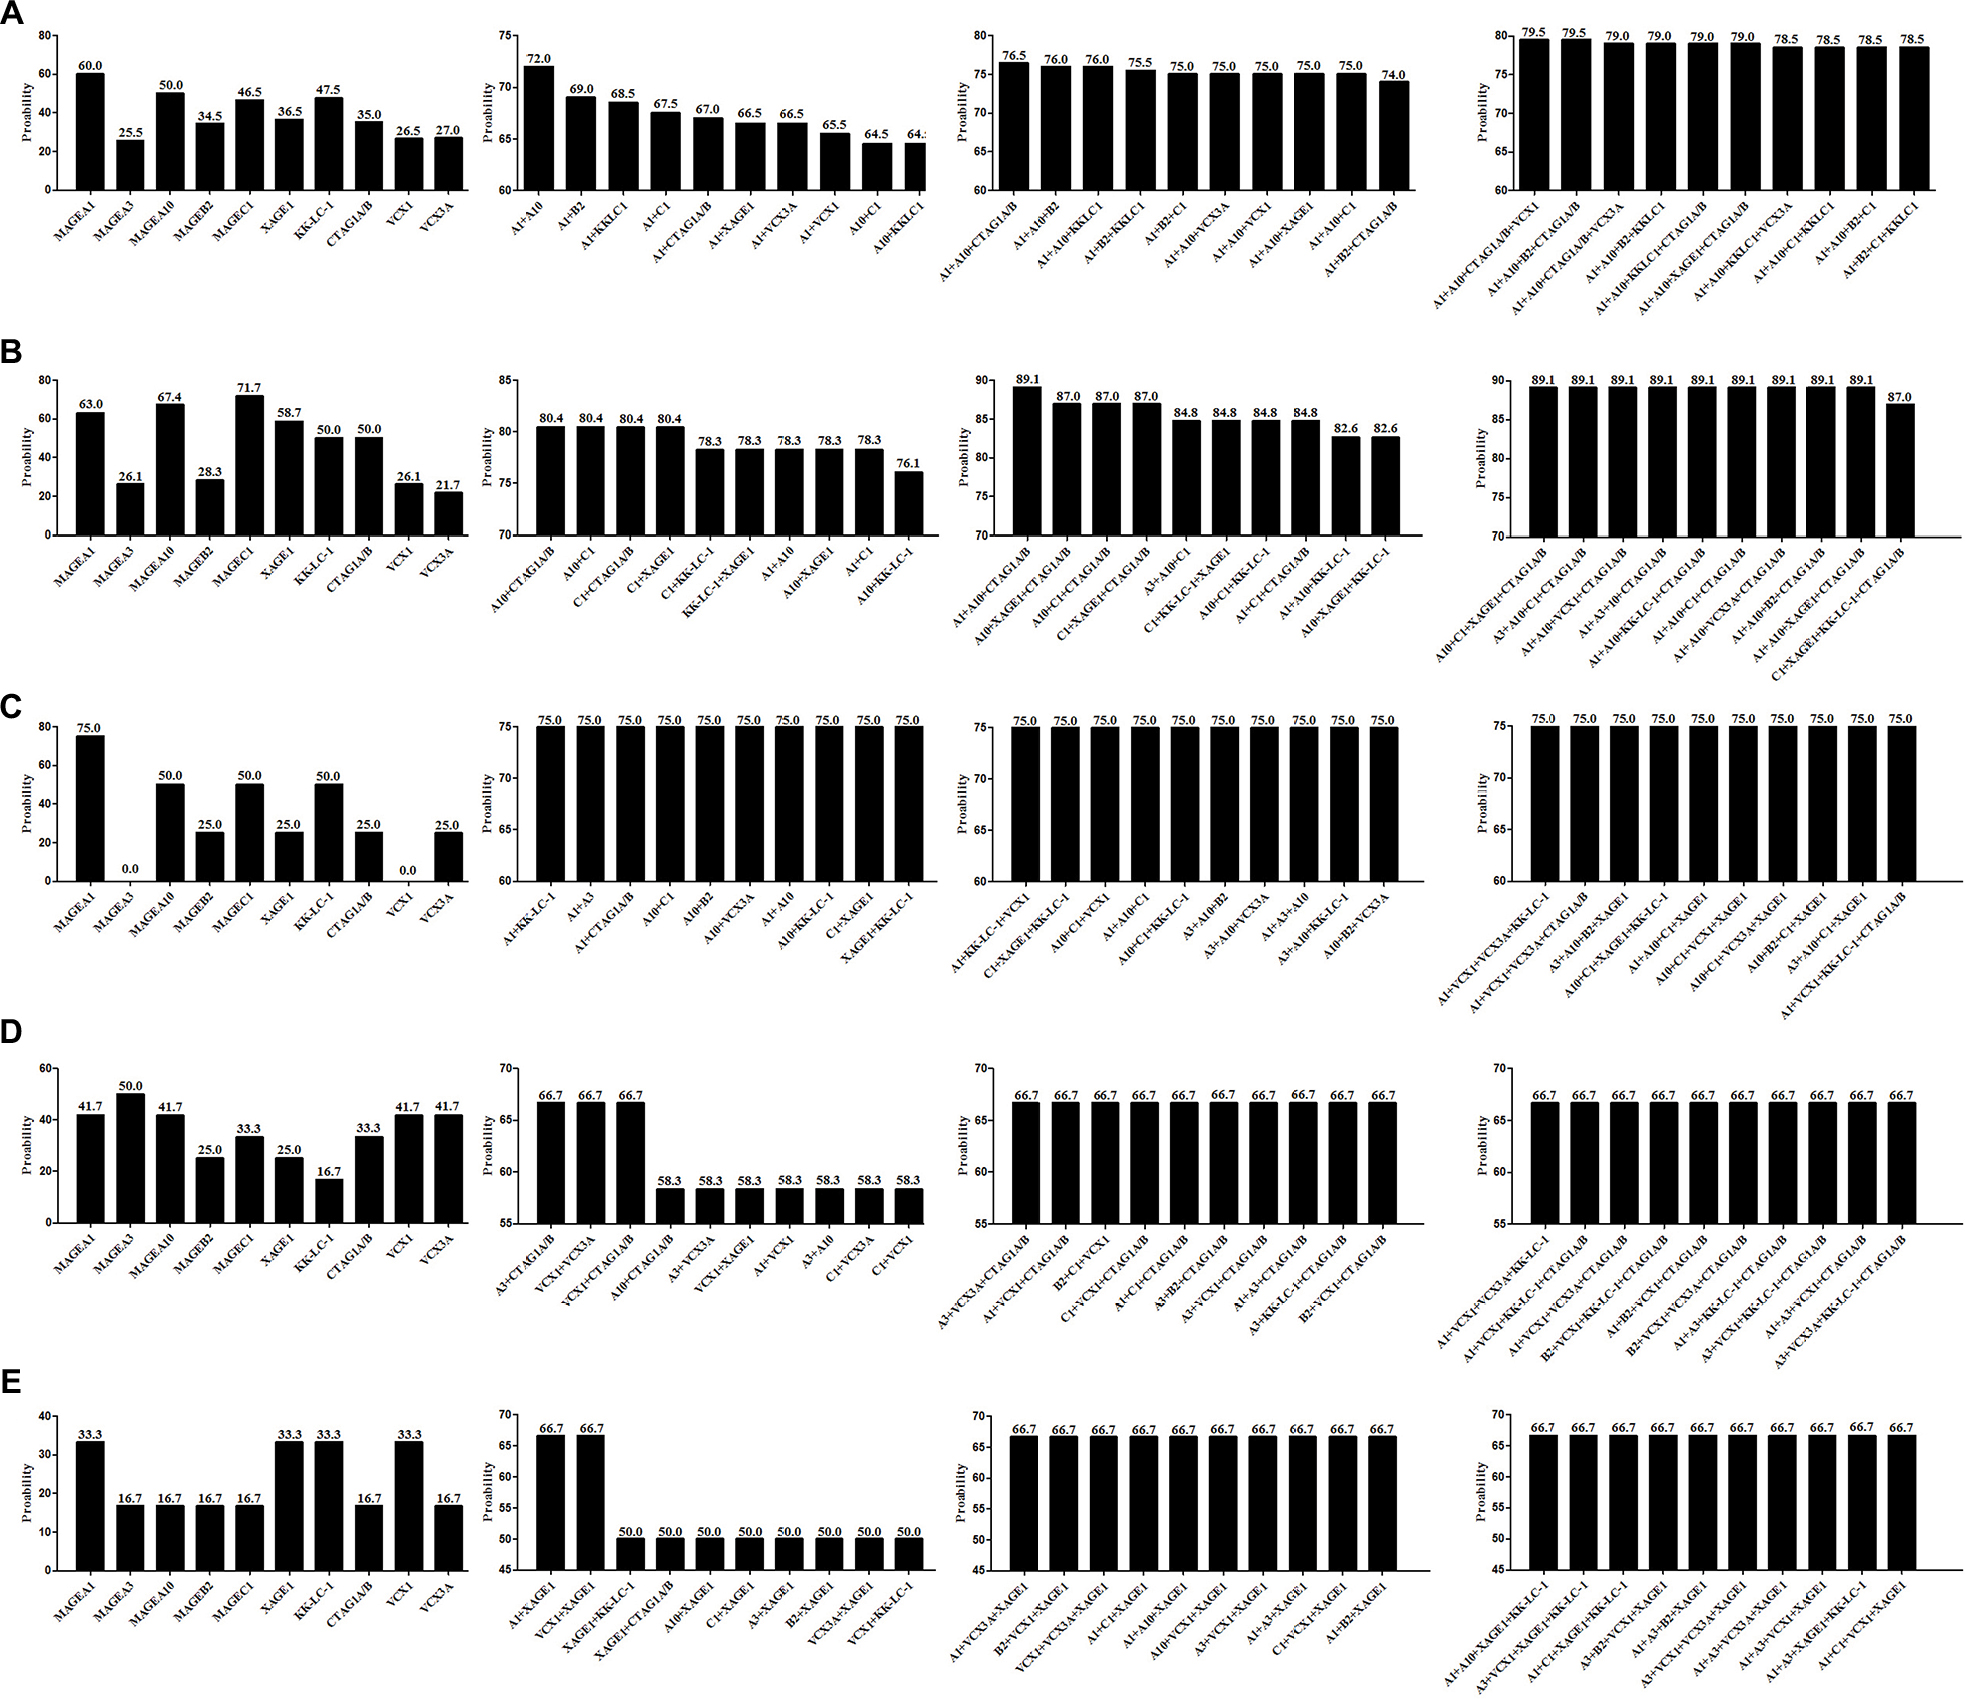 | Figure 4 CTA profiling data based on any 2–4 CTA combination in total cases and precision CTA profiling data based on variable clinicopathological features. Notes: (A) Single CTA expression and the best 2, 3, and 4 CTA combination covering the widest range of total 200 NSCLC cases. (B) CTA expression results for patients with the characteristics of female sex, no smoking history, and ADC. (C) CTA expression results for patients with the characteristics of female sex, no smoking history, and SCC. (D) CTA expression results for patients with the characteristics of female sex, positive smoking history, and ADC. (E) CTA expression results for patients with the characteristics of female sex, positive smoking history, and SCC. Abbreviations: CTA, cancer/testis antigen; NSCLC, non-small cell lung cancer; ADC, adenocarcinoma; SCC, squamous cell carcinoma. |
CTAs profiling based on clinicopathological characteristics
Given that CTA expression was closely associated with sex, smoking history, and pathological types, stratified analysis was performed to assess the best CTA profiling for patients with variable clinicopathological features (Figures 4–6). Eight groups were categorized based on variable clinicopathological characteristics. For patients with features of male sex, positive smoking history, and ADC (n=26, 13.0%), the most commonly expressed CTA was MAGEA1 (80.8%). Two CTA (MAGEA1+KK-LC-1) combination covered 92.3% of total cases, which was equal to 3 or 4 CTA combination (Figure 5C). For patients with features of female sex, no smoking history, and ADC, 2, 3, and 4 CTA combination improved the coverage to 80.4%, 89.1%, and 89.1% (Figure 4B), compared with 75.0%, 81.3%, and 87.5% in patients with features of male sex, no smoking history, and ADC (Figure 5A). No significant coverage difference was found between 2 and 4 CTA combinations in female/positive smoking history/ADC and female/smoking history±/SCC patients (Figure 4C–E). Two CTA combination could best cover these patients. Even in the condition of 4 CTA combinations, the coverage was ~80.0% for the other two groups (Figure 5B and D). Detailed CTA combination information is given in Figure 6.
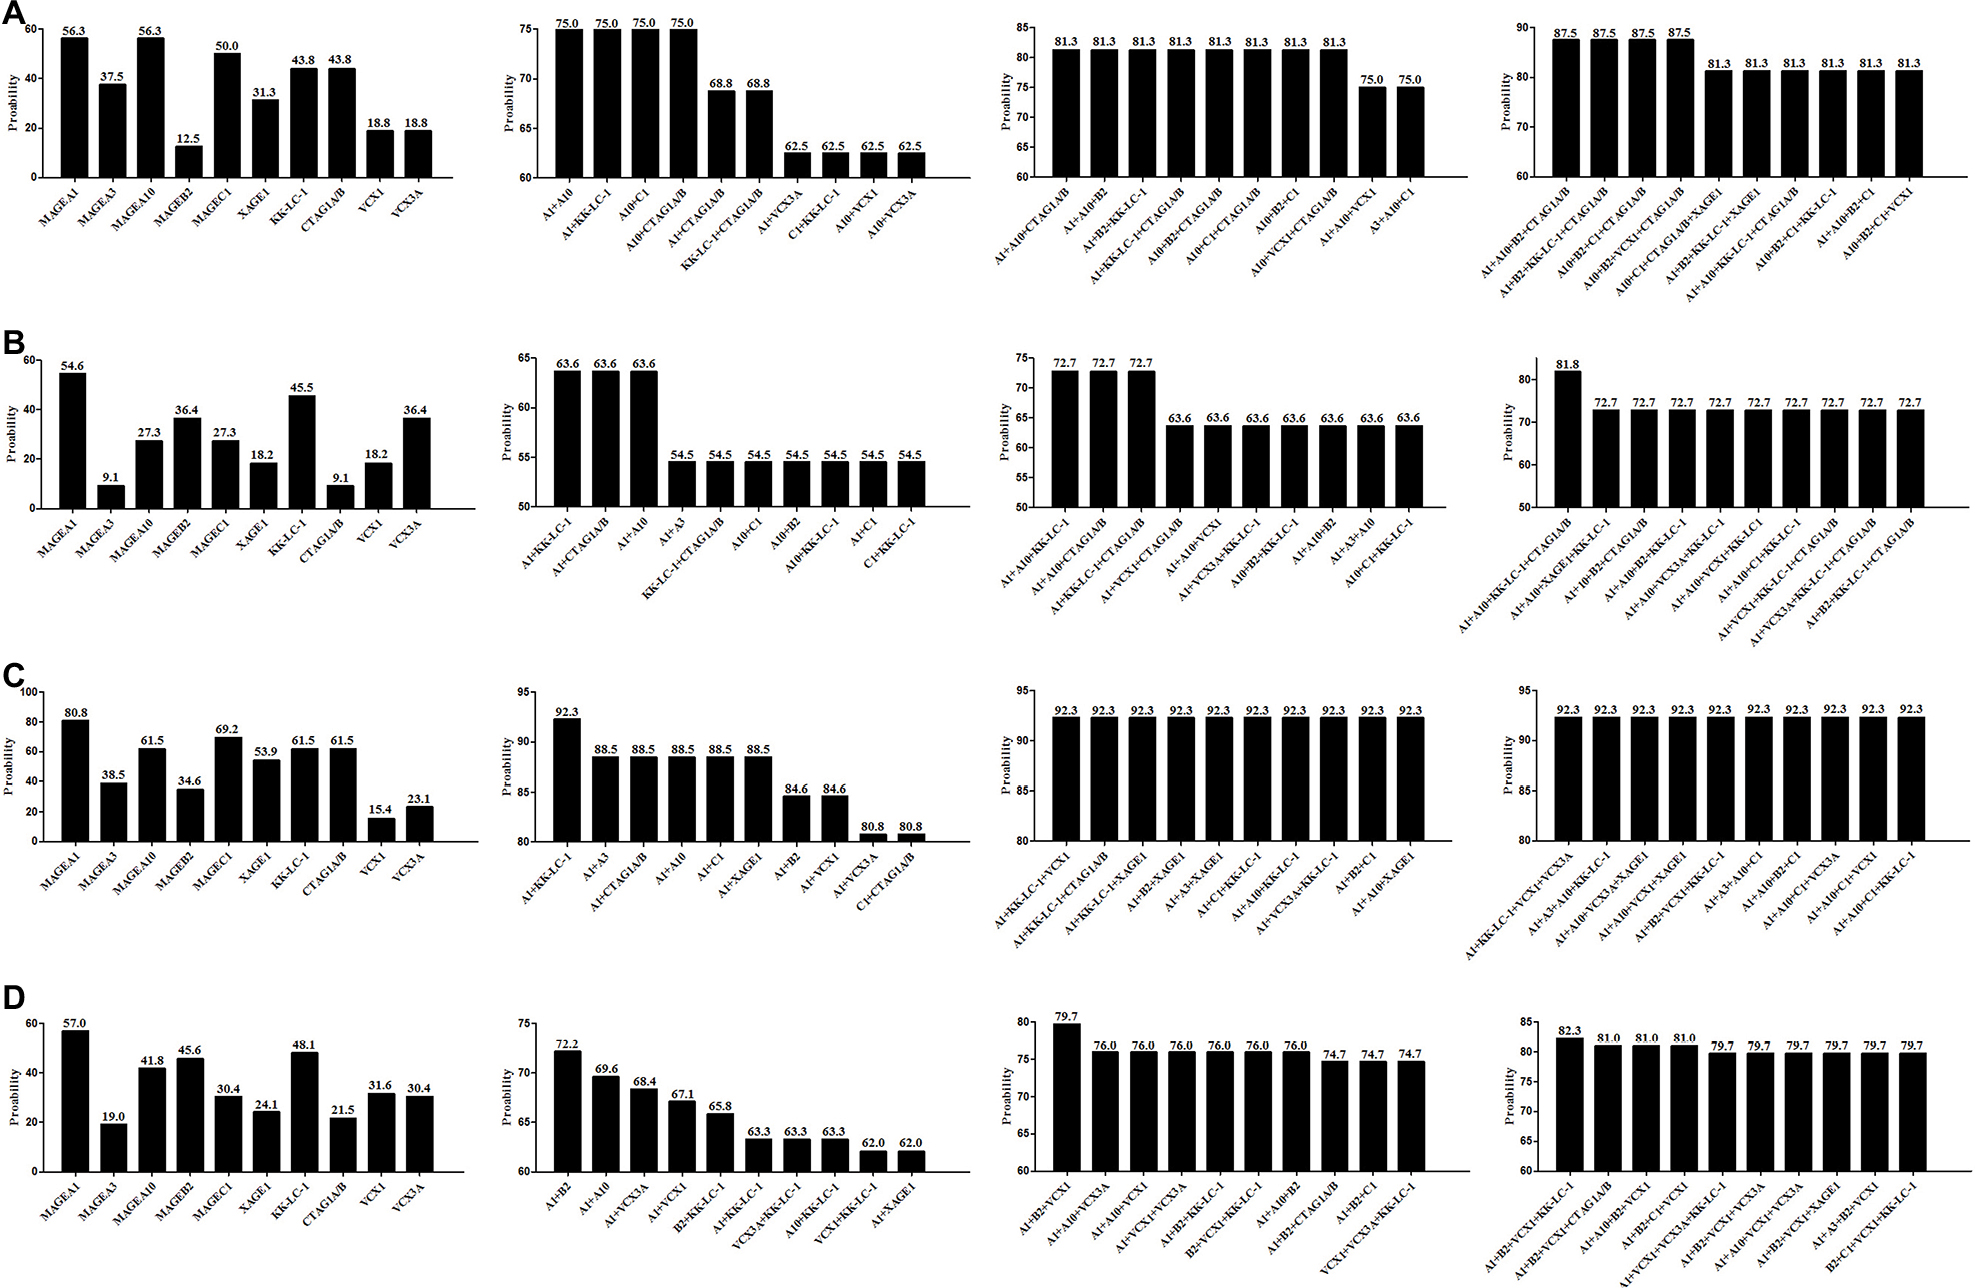 | Figure 5 Precision CTA profiling data based on variable clinicopathological features. Notes: (A) Single CTA expression and the best 2, 3, and 4 CTA combination for patients with the characteristics of male sex, no smoking history, and ADC. (B) CTA expression results for patients with the characteristics of male sex, no smoking history, and SCC. (C) CTA expression results for patients with the characteristics of male sex, positive smoking history, and ADC. (D) CTA expression results for patients with the characteristics of male sex, positive smoking history, and SCC. Abbreviations: CTA, cancer/testis antigen; ADC, adenocarcinoma; SCC, squamous cell carcinoma. |
 | Figure 6 Establishment of CTA profiles to cover the widest range of NSCLC patients in our group based on variable sex, smoking history, and histology. Note: Each triangle represents one CTA combination. Abbreviations: CTA, cancer/testis antigen; NSCLC, non-small cell lung cancer; ADC, adenocarcinoma; SCC, squamous cell carcinoma. |
CTA expression and OS
There was no significant correlation between CTAs expression and OS for total cases (P>0.05). In univariate analysis, postoperative adjuvant chemotherapy (P=0.020) and TNM stage (P=0.034) were found to be correlated with lung cancer prognosis. Only TNM stage (hazard ratio, HR=1.691, 95% CI=1.033–2.767, P=0.037) held statistical significance in multivariate analysis (Table 2).
We also conducted subgroup analyses based on variable pathological types, and the results showed that adjuvant chemotherapy (HR=0.352, 95% CI=0.183–0.678, P=0.002) and VCX1 (HR=2.168, 95% CI=1.138–4.132, P=0.019) were independent prognostic factors for SCC patients (Figure 7A, Table 4). In ADC patients, we found that age (HR=2.107, 95% CI=1.010–4.398, P=0.047), TNM stage (HR=2.196, 95% CI=1.094–4.408, P=0.027), and MAGEA10 (HR=0.530, 95% CI=0.287–0.979, P=0.043) were independent prognostic factors for these patients (Figure 7B). Age <65 years, stage IIIA, and positive MAGEA10 expression represented favorable prognosis.
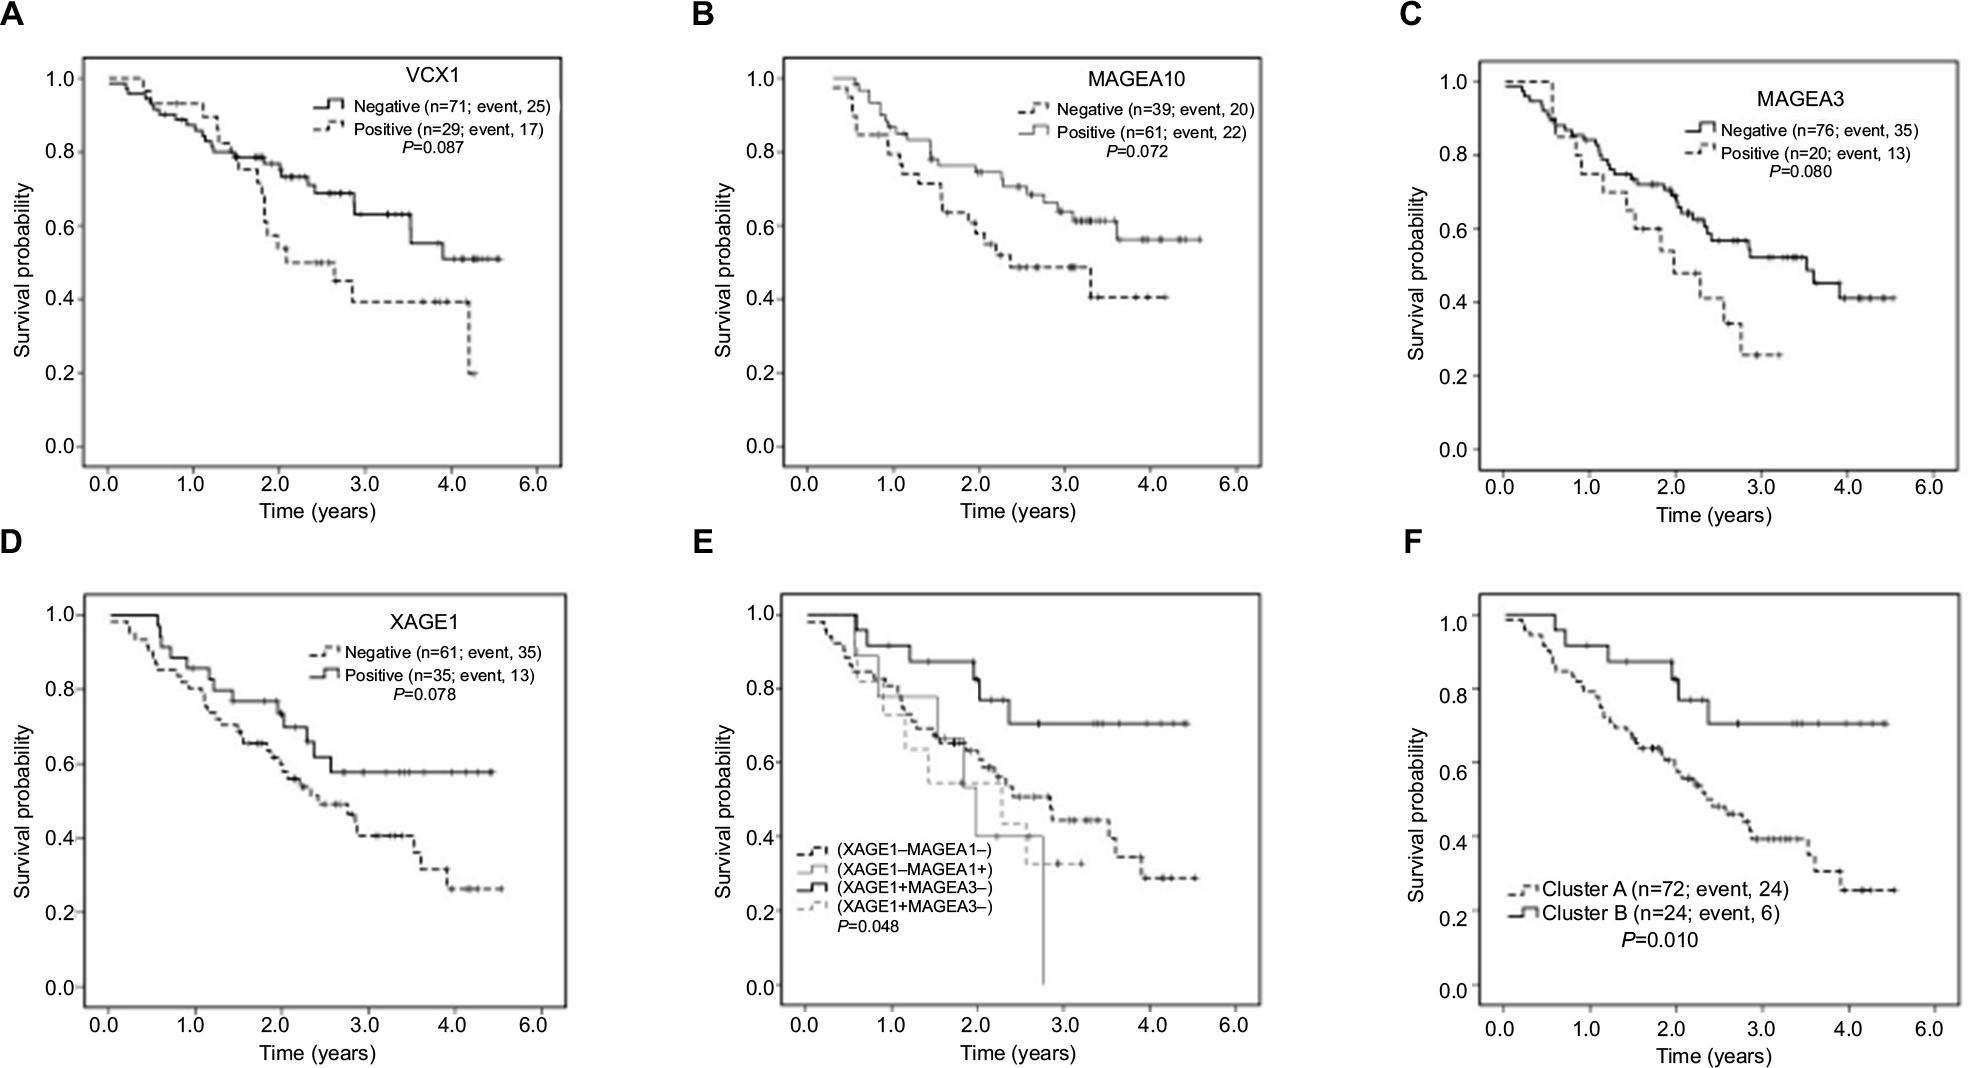 | Figure 7 Prognostic roles of CTAs in non-small cell lung cancer. Notes: (A) Positive VCX1 expression was identified to be a negative prognostic factor of SCC patients based on subgroup analysis. (B) The favorable prognostic role of MAGEA10 in ADC patients. (C and D) Prognostic role of MAGEA3 and XAGE1 in patients treated without adjuvant chemotherapy. (E) OS of patients stratified by the expression of MAGEA3 and XAGE1 is shown by Kaplan-Meier method (P=0.048). (F) Clusters A and B are classified in the text. Cluster B shows a prolonged survival compared with Cluster A (P=0.010). Abbreviations: CTA, cancer/testis antigen; SCC, squamous cell carcinoma; ADC, adenocarcinoma; OS, overall survival. |
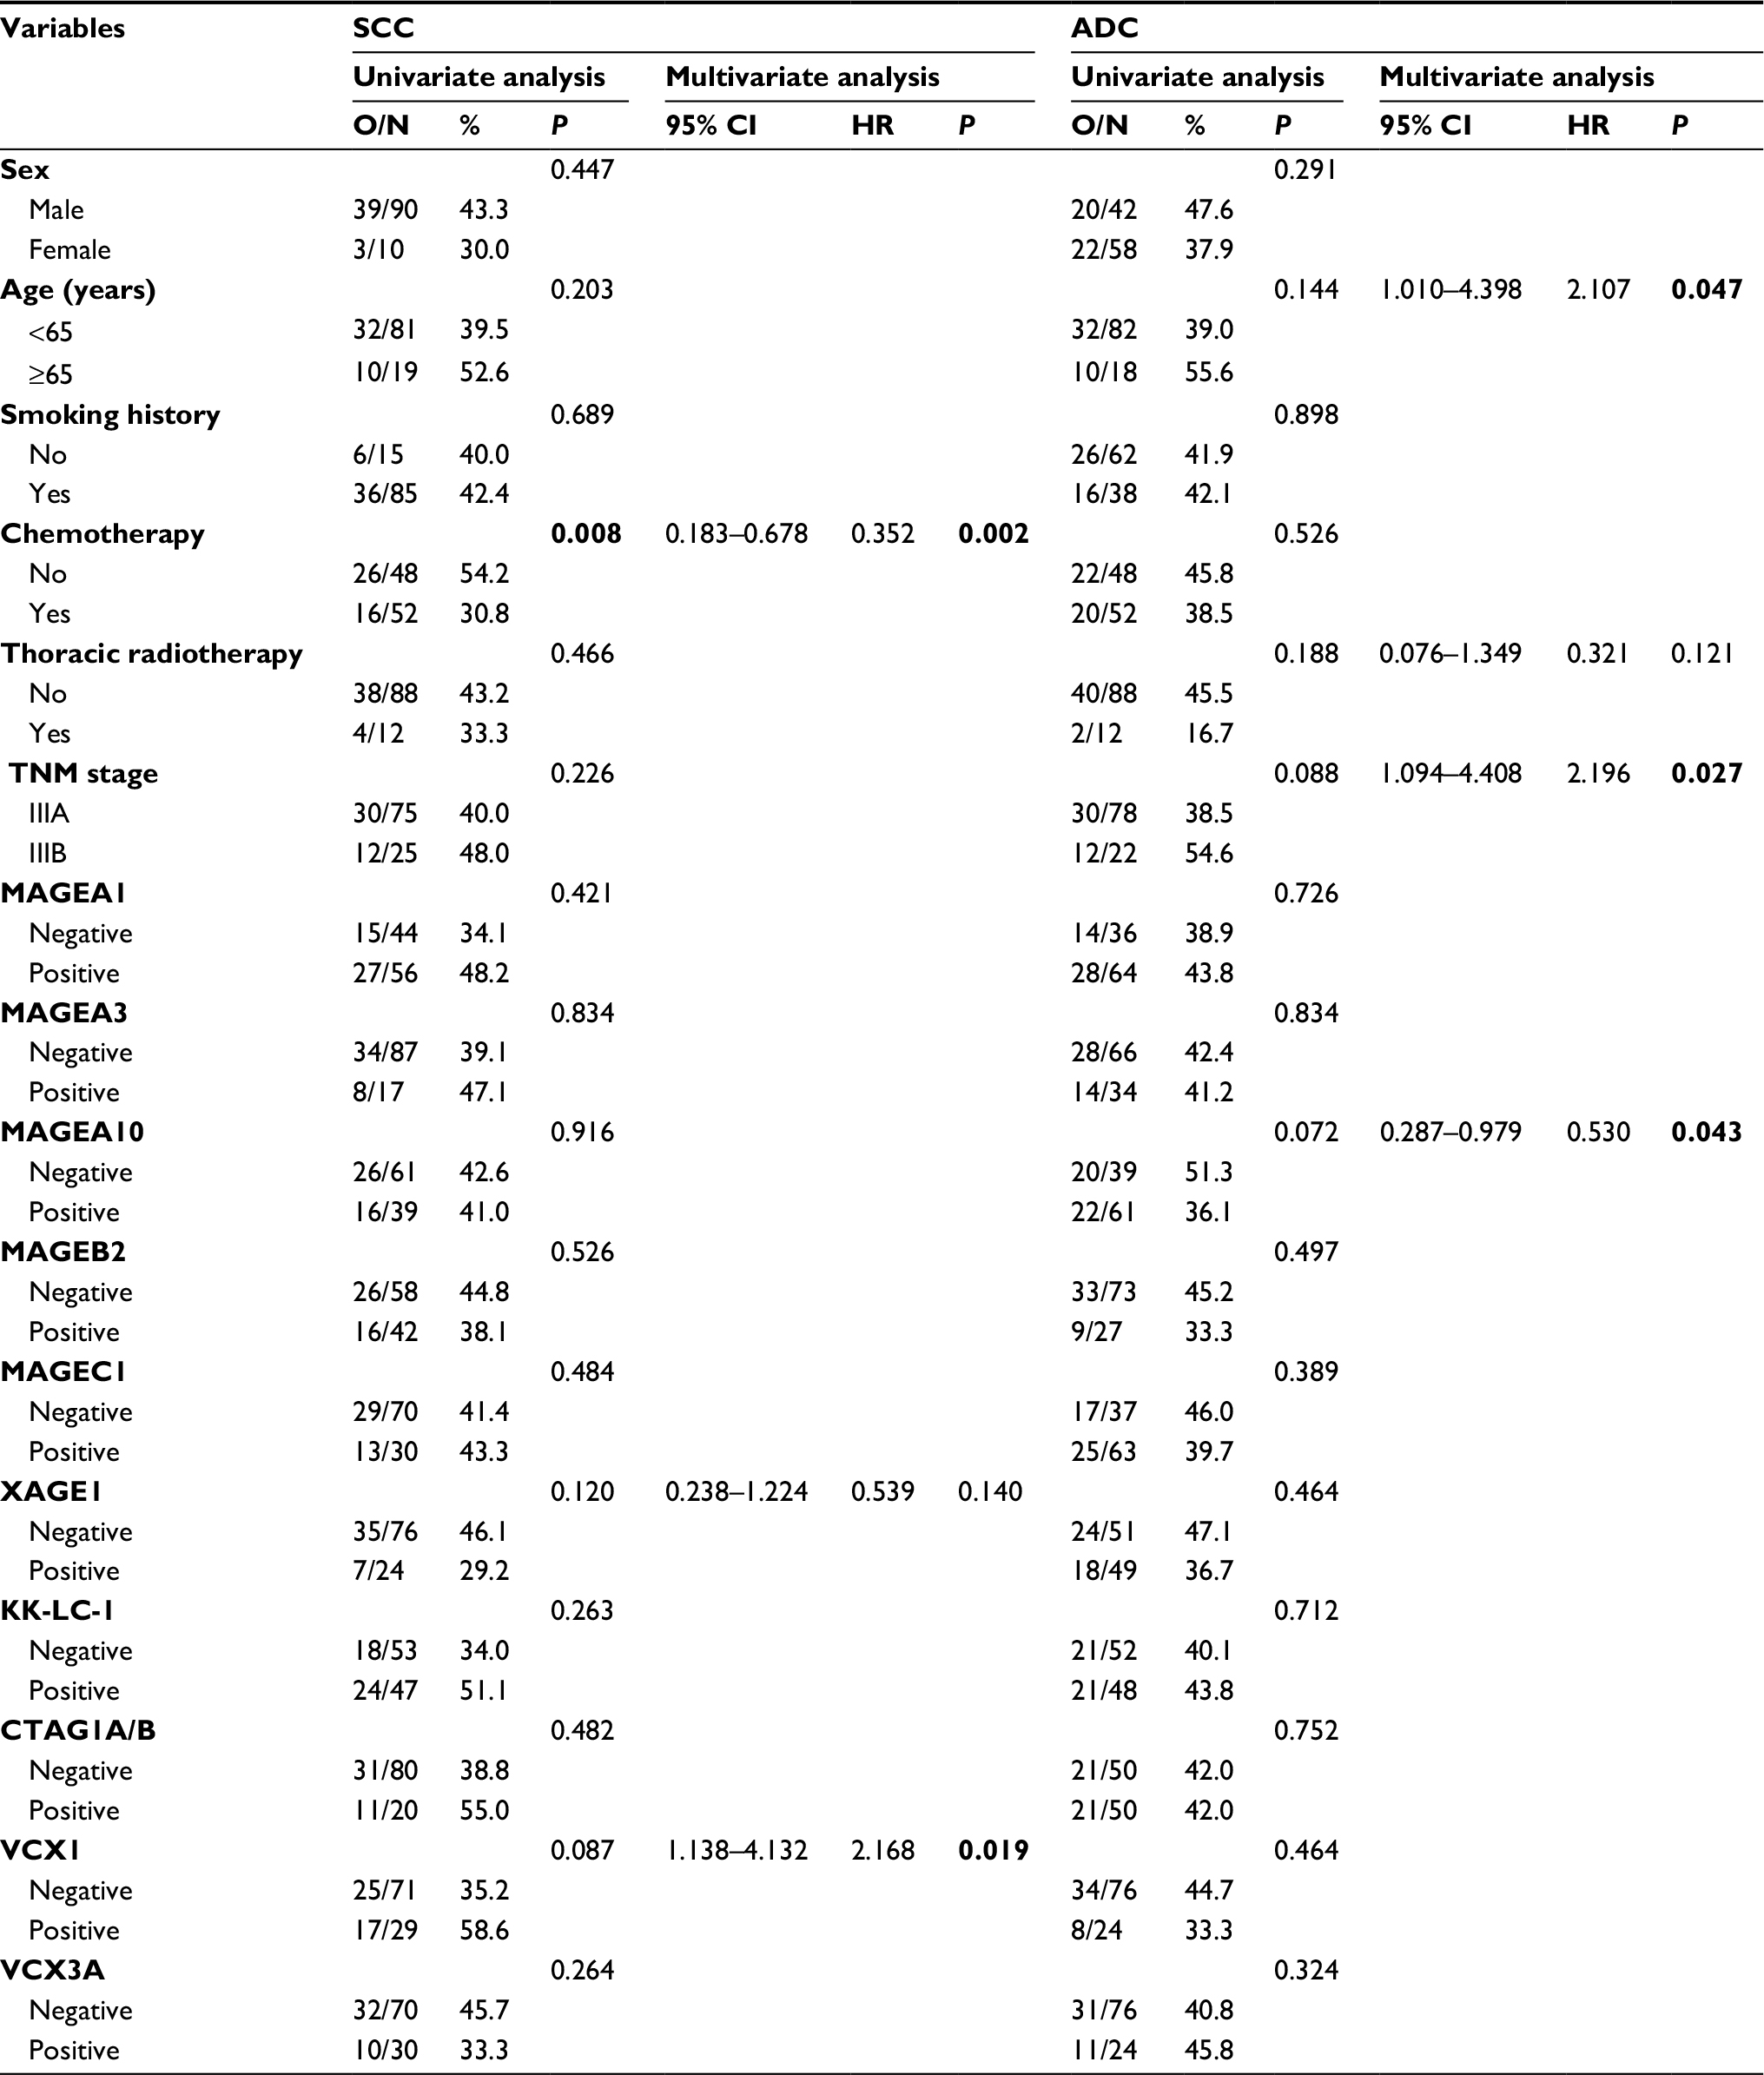 | Table 4 Subgroup analysis of CTA expression in variable pathological types Note: Only factors with a P-value <0.05 are labeled as bolded numbers. Abbreviations: CTA, cancer/testis antigen; SCC, squamous cell carcinoma; ADC, adenocarcinoma; CI, confidence interval; HR, hazard ratio; O/N, observed death number/total patient number in each group. |
Subgroup analysis based on patients treated with or without adjuvant chemotherapy showed that MAGEA3 (HR=2.056, 95% CI=1.055–4.008, P=0.034) and XAGE1 (HR=0.502, 95% CI=0.260–0.968, P=0.040) were independent prognostic factors in patients treated without adjuvant chemotherapy (Table 5). Patients with negative MAGEA3 and positive XAGE1 expression showed prolonged survival (Figure 7C and D). In addition, TNM stage (HR=2.423, 95% CI=1.160–5.063, P=0.019) was found to be an independent unfavorable prognostic factor in patients treated with postoperative adjuvant chemotherapy.
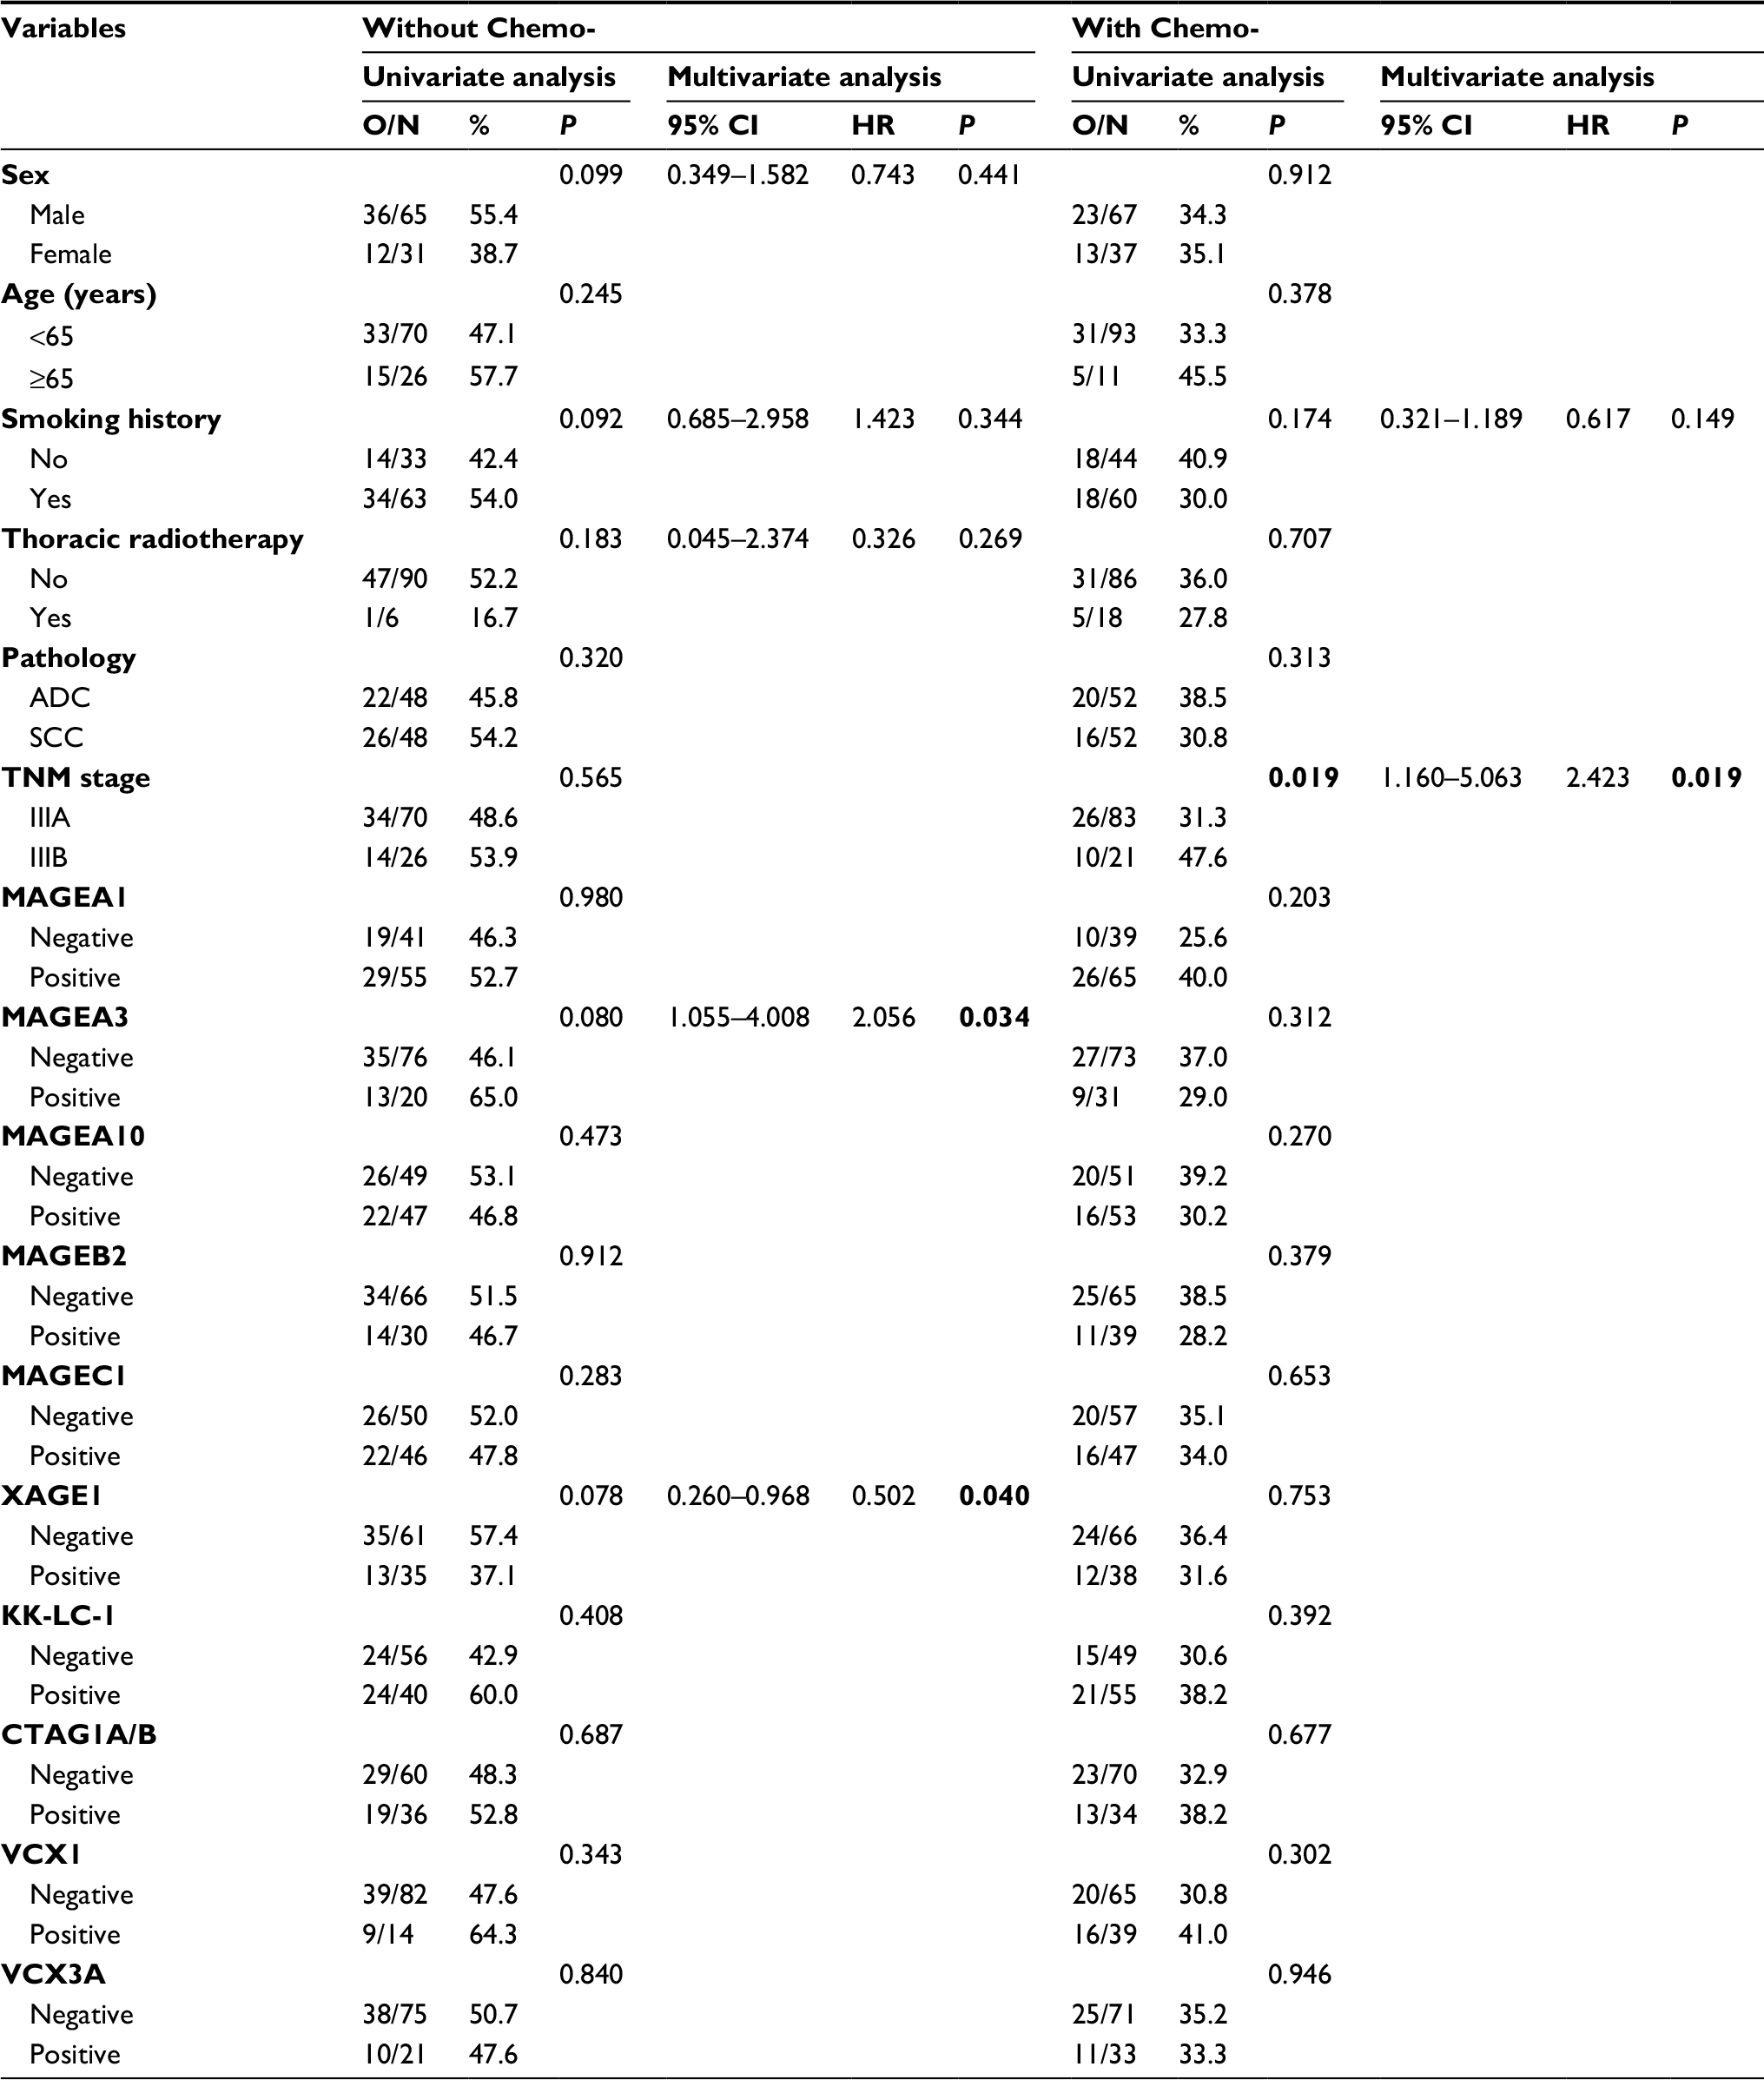 | Table 5 Subgroup analysis of CTA expression in patients treated with or without postoperative adjuvant chemotherapy Note: Only factors with a P-value <0.05 are labeled as bolded numbers. Abbreviations: CTA, cancer/testis antigen; Chemo-, chemotherapy; CI, confidence interval; HR, hazard ratio; ADC, adenocarcinoma; SCC, squamous cell carcinoma; O/N, observed death number/total patient number in each group. |
Analysis of the OS of patients expressing XAGE1 and MAGEA3
Based on the subgroup analysis results, we aimed to assess the combined prognostic roles of XAGE1 and MAGEA3 in patients treated without adjuvant chemotherapy. Patients with XAGE1-positive expression and MAGEA3-negative expression showed prolonged OS (Figure 7E, P=0.048). We clustered these patients based on XAGE1 and MAGEA3 expression: Cluster A was expected to have a poorer prognosis and included XAGE1-positive and MAGEA3-positive, XAGE1-negative with either MAGEA3-negative or positive cases (Figure 7F). Cluster B was expected to have a prolonged survival and included XAGE1-positive and MAGEA3-negative cases (P=0.010). We also examined the roles of XAGE1 and MAGEA3 in all 200 patients, and the results showed a similar trend. However, the P-value was not statistically significant (P=0.130).
CTA expression and EGFR mutant status
EGFR tyrosine kinase inhibitors were demonstrated to greatly improve the disease-free survival of resected stage II–IIIA EGFR-mutant lung cancer patients. In our study, we also evaluated the association between CTA expression and EGFR mutant status. Of all ADC patients, only 8 (8.0%) cases had definitive EGFR mutant and the rest 92 (92.0%) had no or unknown EGFR mutant status. Unfortunately, our results showed CTA expression had no significant correlations with EGFR mutant status (P>0.05): MAGEA1 (no or unknown mutant status vs mutant, 62.0% vs 87.5%, P=0.253), MAGEA3 (33.7% vs 37.5%, P=1.000), MAGEA10 (62.0% vs 50.0%, P=0.708), MAGEB2 (26.1% vs 37.5%, P=0.443), MAGEC1 (61.9% vs 75.0%, P=0.707), XAGE1 (47.8% vs 62.5%, P=0.483), KK-LC-1 (45.7% vs 75.0%, P=0.149), CTAG1A/B (50.0% vs 50.0%, P=1.000), VCX1 (23.9% vs 25.0%, P=1.000), and VCX3A (26.1% vs 0.0%, P=0.193). In addition, no significant difference was found between EGFR mutant status and age, sex, smoking history, and TNM stage (P>0.05). The relationship between CTA expression and EGFR mutant status remained to be studied.
Discussion
In this study, we comprehensively mapped CTA landscape in resected pathological stage III NSCLC based on CTA expression at protein level. Stratified analysis based on variable clinicopathological characteristics achieved the coverage of 92.3% with only 2 CTA combination in patients with features of male sex, positive smoking history, and ADC, compared with a 85.0% coverage for total cases when 10 CTAs were assessed. A maximum of ~90.0% coverage can also be reached by 3 or 4 CTA combination in patients with features of male/female sex, no smoking history, and ADC. The goal of the maximum CTA expression coverage with the least CTA combination was achieved. In addition, selected CTAs were identified to be associated with prognosis on subgroup analysis. All results are of great significance for further study of CTA-specific T-cell immunotherapy.
For some reason, the patients enrolled in our study are all at stage III. On one hand, stage III NSCLC represents a heterogeneous group ranging from apparently resectable tumors with minimal mediastinal involvement to unresectable, bulky or contralateral nodal involvement nodal disease.22,23 It shows a worse prognosis with a 5-year survival of 15%, compared with that of 76% and 46% in early stage I and II patients.23 On the other hand, stage IV patients are usually diagnosed by needle biopsy with limited tumor samples. Considering the poor prognosis as well as the assurance of enough surgical samples, we choose stage III patients for our present study. Interestingly, both stage IIIA and IIIB patients were included in our study. Our study was a retrospective study and patients were enrolled in 2012–2014, while we used the newest 8th Edition Lung Cancer Stage Classification to assess tumor stage, which resulted in a part of stage IIIA patients into IIIB.20 For example, patients with T (5 cm<T≤7 cm or T>7 cm) N2M0 belong to stage IIIA (T2/T3N2M0) in the 7th edition stage classification, while they are classified as stage IIIB (T3/T4N2M0) in the 8th edition stage classification.20,24
Most CTAs are co-expressed, and a previous study involving 90 CTAs demonstrated that only 5.5% of NSCLC cases do not express any CTA.11 In our study, 10 CTA combination can induce a frequency of 15.0% NSCLC patients expressing no CTA. Single CTA expression results in a maximum coverage of 60.0% in total cases, while 2, 3, and 4 CTAs can improve the frequency to 72.0%, 76.5% and 79.5%, respectively. In our group, CTA expression was closely associated with clinicopathological characteristics including histology, sex, and smoking history. Therefore, stratified analysis was performed to assess the best CTA profiling for patients with variable clinicopathological features. For patients with features of male sex, positive smoking history, and ADC, single MAGEA1 expression can cover 80.8% patients, while 2 CTA combination reaches the maximum coverage of 92.3%. This is a significant improvement compared with a coverage rate of 85.0% for total patients assessed by 10 CTAs in our study. For patients with features of female sex, no smoking history, and ADC, the combination of 3 CTAs can cover the widest range of 89.1% cases. For patients with features of male sex, no smoking history, and ADC, a combination of 4 CTAs can reach a maximum coverage of 87.5% cases. With the help of computer programming language, the goal of the maximum CTA expression coverage was reached by using the least CTA combination in patients with variable clinicopathological features. In selected patients, the examination of 2 or 3 CTAs may be enough, which can cover ~90.0% NSCLC cases. We can choose to examine different CTA combinations for patients with variable clinicopathological characteristics.
Our immunohistochemistry results reveal that half of CTAs have higher expression in ADC patients, while only MAGEB2 is highly expressed in SCC patients. In subgroup analysis, VCX1 is also demonstrated to be an independent negative prognostic factor in SCC patients. There are currently limited treatment options for SCC and the strategies remain unsatisfied. MAGEB2 and VCX1 may represent potential targets for SCC treatment. In addition, MAGEA10 is identified to be an independent favorable prognostic factor in ADC patients. These results provide a new direction in the further studies of lung cancer.
In subgroup analysis, MAGEA3 and XAGE1 are also demonstrated to be closely associated with OS. The negative role of MAGEA3 protein has been demonstrated in previous studies, and this is consistent with our results.10,25–29 MAGEA3 expression can significantly promote cell proliferation and tumor survival and suppress apoptosis, while silencing MAGEA3 can improve the chemotherapy sensitivity of tumor cells.30–32 The role of XAGE1 remains controversial at present. Previous study shows that the co-expression of XAGE1 antigen and MHC class I on tumor cells can contribute to a prolonged survival in NSCLC patients, while XAGE1 expression alone has no impact on OS.33 In other studies, XAGE1 antibody is found to be accompanied by XAGE1 antigen expression in half advanced ADC patients, leading to a better survival by eliciting CD4 and CD8 T-cell responses.18,34,35 In addition, patients can be grouped, based on the expression of MAGEA3 and XAGE1, into Cluster A, who had a poorer prognosis, and Cluster B, who had a prolonged survival.
In our study, no significant expression difference was found between stage IIIA and IIIB patients. In previous studies, it was found that CTA expression was closely correlated with tumor stage and advanced stage patients showed a higher CTAs expression.7,36 Only patients with stage III were enrolled in our study, while patients with early stage I–II were excluded. CTA expression difference may be more significant between patients with early stage I–II and locally advanced non-metastatic stage III. In addition, we are interested in whether CTAs expression has significant correlation with EGFR mutant status. Unfortunately, the result is negative. Due to the retrospective feature of our study and low EGFR mutant rate in SCC, only 8 lung ADC patients had definite EGFR mutant status results and we only evaluated the correlation between CTA expression and lung ADC. We will collect more samples to demonstrate their correlations in our further study.
In conclusion, CTAs are ideal candidates for CTA-specific T-cell immunotherapy. We have established a CTA profiling in resected pathological stage III NSCLC based on 10 CTAs. The goal of the maximum CTA expression coverage is reached by using the least CTA combination based on variable histology, sex, and smoking history. These results can provide more valuable evidences for further clinical usage of individualized CTA-specific T-cell immunotherapy.
Acknowledgments
We thank Huiying Li (Department of Pathology, Harbin Medical University Cancer Hospital, Harbin, People’s Republic of China), Ke Pan, and Cassian Yee (Departments of Melanoma Medical Oncology and Immunology, MD Anderson Cancer Center, Houston, TX, USA) for their direction in this project. This work was supported by National Natural Scientific Foundation of China (No: 81673007, 81572824, 81672931 and 81773133) and Postdoctoral Scientific Research Development Fund of Heilongjiang Province (LBH-Q16155).
Disclosure
The authors report no conflicts of interest in this work.
References
 © 2018 The Author(s). This work is published and licensed by Dove Medical Press Limited. The
full terms of this license are available at https://www.dovepress.com/terms
and incorporate the Creative Commons Attribution
- Non Commercial (unported, 3.0) License.
By accessing the work you hereby accept the Terms. Non-commercial uses of the work are permitted
without any further permission from Dove Medical Press Limited, provided the work is properly
attributed. For permission for commercial use of this work, please see paragraphs 4.2 and 5 of our Terms.
© 2018 The Author(s). This work is published and licensed by Dove Medical Press Limited. The
full terms of this license are available at https://www.dovepress.com/terms
and incorporate the Creative Commons Attribution
- Non Commercial (unported, 3.0) License.
By accessing the work you hereby accept the Terms. Non-commercial uses of the work are permitted
without any further permission from Dove Medical Press Limited, provided the work is properly
attributed. For permission for commercial use of this work, please see paragraphs 4.2 and 5 of our Terms.