Back to Journals » Diabetes, Metabolic Syndrome and Obesity » Volume 18
Establishment and Evaluation of HepG2 Cell Insulin Resistance Model
Authors Meng Z, Han Y, Ruan L, Xu C, Zhang M, Liu H
Received 19 February 2025
Accepted for publication 15 July 2025
Published 29 July 2025 Volume 2025:18 Pages 2573—2584
DOI https://doi.org/10.2147/DMSO.S523821
Checked for plagiarism Yes
Review by Single anonymous peer review
Peer reviewer comments 2
Editor who approved publication: Dr Rebecca Baqiyyah Conway
Zixuan Meng,1 Yuehua Han,1 Linda Ruan,1 Chenming Xu,1 Mengxiao Zhang,1,2 Hao Liu1,2
1School of Pharmacy, Bengbu Medical University, Bengbu, People’s Republic of China; 2Anhui Province Engineering Technology Research Center of Biochemical Pharmaceutical, Bengbu, Anhui Province, People’s Republic of China
Correspondence: Hao Liu, Email [email protected] Mengxiao Zhang, Email [email protected]
Objective: Establishing HepG2 cell insulin resistance models using glucosamine, high glucose with high insulin and palmitic acid and briefly evaluating them to provide reliable models for insulin resistance research.
Methods: Three methods were used to induce insulin resistance in HepG2 cells, and glucose uptake and consumption, glucose metabolism-related mRNA and p-AKT/AKT protein levels and RNA-seq were detected to compare the three induction methods.
Results: Glucose consumption capacity was reduced after glucosamine and palmitic acid induction and did not change significantly after high glucose with high insulin induction. Glucose uptake capacity was not significantly changed after glucosamine and high glucose with high insulin induction and was reduced after palmitic acid induction. After high insulin stimulation, p-AKT/AKT levels were elevated in glucosamine and high glucose with high insulin induction and did not change significantly in palmitic acid induction. G6pase, PC, and PCK1 were elevated after glucosamine and palmitic acid stimulation, and only PCK1 was elevated after high glucose with high insulin stimulation. The transcriptomes of cells induced by the three methods differed widely.
Conclusion: Treatment with 0.2 mM palmitic acid for 24 h is a simple and stable method to induce insulin resistance in HepG2 cells.
Keywords: HepG2 cells, insulin resistance model, palmitic acid
Introduction
Insulin resistance (IR), a state in which the body’s sensitivity to insulin decreases, reducing ability of body to absorb and utilize glucose, is the common pathological basis of diseases such as obesity, type 2 diabetes mellitus, and non-alcoholic fatty liver disease, and usually occurs before them. Therefore, improving insulin resistance is an important strategy for the treatment of related diseases and drug development, and a stable and reliable cell model of insulin resistance is a prerequisite for the successful development of related research.1
Through literature research, it is known that the most commonly used cells for in vitro study of the pathogenesis of insulin resistance, screening of hypoglycemic drugs and mechanism of action are HepG2 cells,2,3 because HepG2 cells are derived from human hepatoblastoma cells, which have metabolic functions similar to those of hepatocytes, and insulin resistance caused by these cells can mimic the insulin-resistant state that occurs in the human body.4 The establishment of cellular models of insulin resistance in the literature is not uniform, and the most common methods of inducing insulin resistance models include: glucosamine induced insulin resistance in HepG2 cells,5,6 high glucose combined with high insulin induced insulin resistance in HepG2 cells,7,8 and palmitic acid induced insulin resistance in HepG2 cells,9,10 and not only are the methods for inducing insulin resistance inconsistent, but even the concentration and duration of the induction conditions for the same method are inconsistent. In addition, it is not yet known whether there are differences between insulin resistance models induced by different methods. Therefore, in the present study, we used glucosamine, high glucose combined with high insulin, and palmitic acid to induce insulin resistance in HepG2 cells, and briefly evaluated the three methods, with the aim of providing a simple, stable, and reproducible cellular model for in vitro study of insulin resistance.
Materials and Methods
Materials
HepG2 cells (Wuhan Punosai Life Science and Technology Co., Ltd)., HepG2-specific medium (Wuhan Punosai Life Science and Technology Co., Ltd., Item No. CM-0103), glucosamine hydrochloride (MedChemExpress, Product No. S1635), recombinant human insulin (Shanghai Yuanye Biological Co., Ltd)., sodium palmitate (Xi’an Kunchuang Science and Technology Development Co. Ltd)., Sodium Palmitate (Xi’an Kunchuang Science and Technology Development Co., Ltd., product no. SYSJ-KJ002), 2-NBDG (MedChemExpress, product no. HY-116215), Glucose Detection Kit O-toluidine Method (Shanghai Biyuntian Bio-Technology Co., Ltd., product no. S0201M). p-AKT Antibody (Cell Signaling Technology, product no. 4060T), AKT antibody (Cell Signaling Technology, product no. 9272S). β actin (Proteintech Cat No.66009-1-lg), HRP-Goat Anti-Rabbit Recombinant Secondary Antibody (H+L) (Proteintech Cat No. RGAR001).
Cell Culture and Treatments
HepG2 cells were cultured in HepG2 cell-specific medium (Wuhan Punosai Life Science and Technology Co., Ltd., Item No. CM-0103) at 37°C with 5% CO2, and the culture medium was changed every 2~3 days, and the cells were passaged according to their growth. The cells were washed twice with phosphate buffered saline (PBS), digested with 0.25% trypsin for 3 min, then added with medium to terminate the digestion, and resuspended; the cells were collected into 10 mL centrifuge tubes, centrifuged at 900 rpm for 4 min, the supernatant was discarded, and added with medium to blow gently; the cell suspension was diluted to a cell density of 3.5×10⁵/mL and set aside. The cell suspension was diluted to a cell density of 3.5×10⁵/mL.
Establishment of Insulin Resistance Model
Configuration of glucosamine, high glucose with high insulin and palmitate: glucosamine and palmitate were dissolved in HepG2 cell-specific medium containing 1 g/L glucose and set aside, and recombinant human insulin was dissolved in DMEM medium containing 4.5 g/L and set aside. HepG2 cells were seeded in 48-well plates at a density of 8×10³ cells per well. To establish IR-HepG2 cell models, three distinct induction protocols were implemented: Glucosamine induction: Cells were treated with 9 mM, 18 mM, or 36 mM glucosamine for 12 h, 18 h, 24 h, 36 h, or 48 h; Insulin-glucose induction: Cells were exposed to 0.1 μM, 1 μM, or 10 μM insulin combined with 4.5 g/L glucose for 12 h, 24 h, 36 h, 48 h, or 72 h; Palmitic acid induction: Cells were incubated with 0.15 mM, 0.2 mM, or 0.25 mM palmitic acid for 12 h, 24 h, or 48 h.
Measurement of Cell Viability
HepG2 cells were inoculated into 48-well plates 80,000 cells per well and different concentrations of glucosamine, palmitic acid and insulin were added for different times. We use the CCK-8 method to detect cell viability, mix the CCK-8 solution with the culture medium at a 1:10 ratio and add it to the 48-well plate, with 200 μL per well. Place the 48-well plate in the incubator for approximately 20 minutes, then remove it. Use a microplate reader to measure the absorbance value at 450 nm for each well. The cell viability for each well is calculated using the following formula: Cell viability = [OD(drug) − OD(blank)]/[OD(no drug) − OD(blank)] × 100%, and OD(drug):the absorbance value of the well containing cells, medium, CCK-8 solution, and drug solution; OD (blank): the absorbance value of the well containing medium, CCK-8 solution, and no cells; OD (no drug): the absorbance value of the well containing cells, medium, CCK-8 solution, and no drug solution.
Determination of Glucose Consumption
Different conditions act on HepG2 cells, after the cells were washed with PBS to remove drug residues and metabolic wastes on the cell surface, fresh HepG2 cell-specific medium was added to each well and incubated for 6 hours at 37°C under 5% CO2 incubation, and the glucose content in the supernatant was measured using a glucose assay kit. Glucose consumption = glucose content in blank wells (cell-free) - glucose content per well.
Determination of Glucose Uptake
HepG2 cells were inoculated in 6-well plates, and after adding glucosamine, palmitic acid and insulin for different times, the medium was replaced with serum-free medium containing 50 μ M 2-NBDG and incubated for 60 min. The fluorescence intensity of the cells was detected by flow cytometry to reflect the glucose uptake ability of the cells. HepG2 cells were inoculated in confocal dishes, and after adding glucosamine, palmitic acid and insulin for different times, the medium was incubated for 60 min with serum-free medium containing 50 μ M 2-NBDG and then incubated for 60 min with 2-NBDG, and then the nuclei were stained with DAPI fluorescent staining solution, and then the cells were washed thoroughly with PBS, and the excess of the staining solution was removed, and then the fluorescence intensity of the cells was captured by confocal microscope to reflect the uptake capacity of the cells. The fluorescence intensity of the cells was photographed using confocal microscopy to reflect the cellular uptake of glucose.
Western Blot Assay
Add appropriate amount of lysate, scrape off the cells, lysed on ice for 30 min, centrifuged at 4 °C and 12000 rpm for 30 min, then separated the supernatant, and quantified the protein by BCA method, adjusted the protein concentration, added the sampling buffer, and boiled at 95 °C for 5 min. After SDS-PAGE electrophoresis, the proteins were transferred to PVDF membrane and incubated with primary antibody overnight (p-AKT Antibody (Cell Signaling Technology, product no. 4060T), AKT antibody (Cell Signaling Technology, product no. 9272S). β actin (Proteintech Cat No.66009-1-lg), dilution ratio of 1:2000 for primary antibody); on the next day, the secondary antibody was incubated first (HRP-Goat Anti-Rabbit Recombinant Secondary Antibody (H+L) (Proteintech Cat No. RGAR001), secondary antibody dilution ratio 1:2000), and then the bands were exposed and developed, scanned and photographed, and the grayscale values of the protein bands were analyzed by ImageJ software.
RT-qPCR to Detect the Expression Level of Gluconeogenesis Enzymes
HepG2 cells were inoculated into six-well plates, and after the cells were adhered to the wall, the cellular RNA was extracted and reverse transcribed into cDNA. According to the instruction manual of MonaBio qPCR kit, the following reaction system was added into 200 µL octuplex tubes: cDNA was diluted 10-fold and then 2 µL/well was added, water was added at 7.2 µL/well, the upstream primer was added at 0.4 µL/well, the downstream primer was added at 0.4 µL/well, SYBR Green 1 mix at 10 µL/well, and SYBR Green 1 mix was added at 0.4 µL/well. The reaction tubes were placed in the PCR instrument and the SYBR Green 1 mix was added 10 µL/well. The reaction tube was put into the PCR instrument, and the program was run according to the following parameters: the first step was 95 °C for 5 min, the second step was 95 °C for 10 sec, and 60 °C for 30 sec (40 cycles). The calculation method we used was ΔΔCt.
The primer sequences are shown in Table 1.
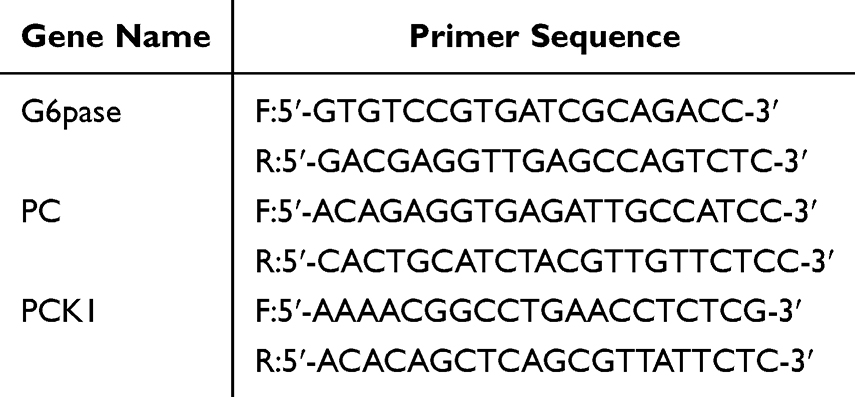 |
Table 1 Primer Sequences |
RNA-Seq
Cell sample preparation: At the end of cell treatment, the cells were washed twice with PBS (RNase-free water), and 1 mL of TRIzol reagent was added to 105~107 cells, and the cells were blown repeatedly until sufficient lysis was achieved, and all the TRIzol liquid was transferred to a sharp-bottomed centrifuge tube and quickly placed in a liquid nitrogen tank for quick freezing, and then transferred to −80°C for long-term storage. Total RNA was extracted from the samples and mRNA was enriched. Subsequently, the library was constructed and sequenced (The reading length of Illumina Novaseq 6000 is PE150, and the sequencing depth is 6g. The reference genome version is hg19) after quality control. After obtaining the raw sequenced reads, and in the presence of a reference genome, the analysis process was as described below: (1) Data quality control: the data obtained from the downstream machine were the original data, and the fastp software was used to de-join and filter the original data with low quality; (2) Comparison and quantification: HISAT2 was used to compare the filtered data with the reference genome sequences, and a reference genome was obtained for comparison. Stringtie software was used to count the expression of genes or transcripts; (3) differential expression analysis: under the condition of with or without biological replicates, DESeq2 (with biological replicates) or edgeR (without biological replicates) was used to analyze the differential expression. Differential expression analysis is performed using DESeq2 (for datasets with biological replicates) or edgeR (for datasets without replicates). The input data consists of read count expression values quantified by StringTie. The DESeq2 workflow comprises three main steps: (1) Normalization of raw read counts, primarily to correct for sequencing depth variations; (2) Statistical modeling to calculate hypothesis testing probabilities (p-values); (3) Multiple testing correction to obtain false discovery rate (FDR) values, with padj being the commonly used form. Standard criteria for screening differentially expressed genes (DEGs) are set as |log2(fold change) | > 1 combined with padj < 0.05. When the number of DEGs meeting these thresholds is insufficient, alternative criteria (|log2(fold change) | > 0.5 with p-value < 0.05) may be applied. Both approaches represent established screening methodologies, with the current project adopting the |log2(fold change) | > 1 and padj < 0.05 criteria as primary selection parameters. And finally, the relevant pathways were found through enrichment analysis (KEGG, GO). The cut-off values used for GO/KEGG analysis are all padj<0.05.
High glucose and high insulin sequencing data were obtained from the GEO database (GSE139929).
Statistical Analysis
The software we used for graphing was GraphPad Prism 8 and we used it for statistical analysis, and data were expressed as mean ± standard deviation (Mean ± SD), and statistics were obtained from three independently repeated experiments. Comparisons between the two groups were made using the t-test. p < 0. 05 indicates that the difference in results is statistically significant.
Result
Determination of Induction Conditions for IR-HepG2 Cells
Different concentrations of glucosamine were applied to HepG2 cells for 12 h, 18 h, 24 h, 36 h and 48 h, and the cell viability was measured using CCK-8 reagent (Figure 1A). Based on cell viability and relevant literature, there was no significant effect on cell viability at 18 h of 18 mM glucosamine action and there was a difference in glucose consumption of cells at this time. (Figure 1D). Cell viability was measured using CCK-8 reagent after 12 h, 24 h, 36 h, 48 h, and 72 h with 0.1 µM, 1 µM, and 10 µM insulin, respectively, and the results showed that high glucose in combination with high insulin had little or no effect on the viability of the cells (Figure 1B). Glucose consumption was detected by selecting different times of 1 μM insulin action according to CCK-8 results and related literature (Figure 1E). Palmitic acid was dissolved in HepG2 cell-specific medium, and 0.15 mM, 0.2 mM, 0.25 mM, palmitic acid was acted for different times, and the results showed that the concentration of 0.2 mM and below had no significant effect on the viability of cells (Figure 1C). According to the results of CCK-8 and related literature, 0.2 mM PA was selected for different time of action to detect Glucose consumption (Figure 1F). According to the results of cell viability and glucose consumption, the induction conditions of IR-HepG2 cells were initially determined: 18 mM glucosamine for 18 h, 1 μM insulin combined with high glucose for 24 h, and 0.2 mM PA for 24 h. After stimulating the cells with glucosamine (Figure 1H), high glucose and high insulin (Figure 1I), and palmitic acid, respectively (Figure 1J), there was no significant change in cell morphology compared with the control group (Figure 1G).
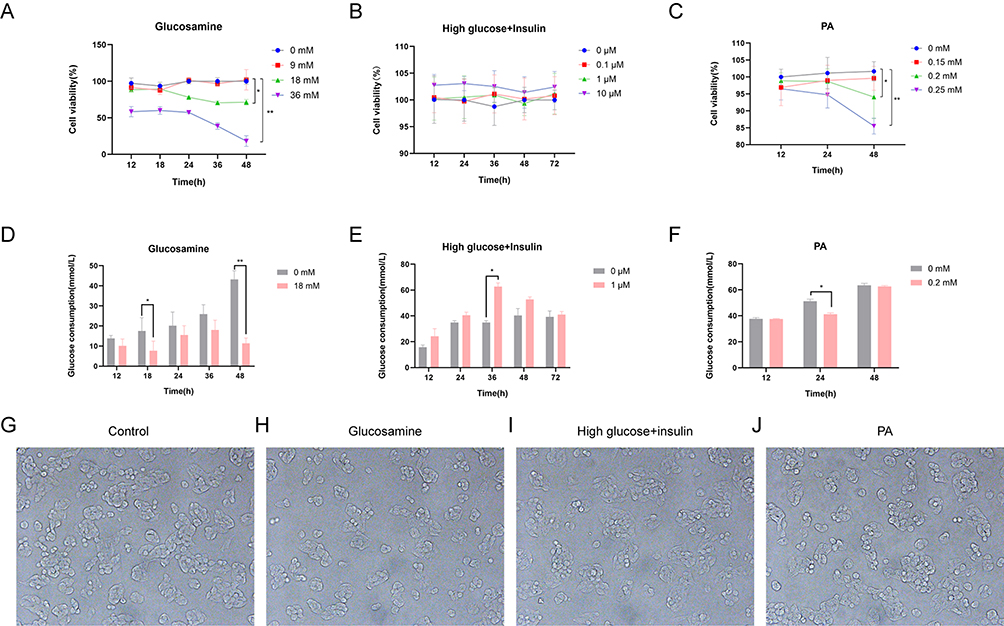 |
Figure 1 Determination of induction conditions for IR-HepG2 cells. (A) Different concentrations of glucosamine act different times cell viability. (B) Different concentrations of insulin act different time cell viability. (C) Different concentrations of palmitic acid act different times cell viability. (D) 18 mM glucosamine acts at different times of glucose consumption. (E) 1 μM insulin acts different time glucose consumption. (F) 0.20 mM PA acts at different times of glucose consumption. (G) Normal HepG2 cell morphology (200×). (H) Glucosamine-induced IR-HepG2 cell morphology (200×). (I) High glucose and high insulin induced IR-HepG2 cell morphology (200×). (J) Palmitic acid induced IR-HepG2 cell morphology (200×). * P < 0.05, ** P < 0.01. |
Effect of Three Induction Methods on Glucose Uptake Capacity
2-NBDG is a fluorescent D-glucose analog that is transported into cells via glucose transporters and is phosphorylated after entry into the cell and cannot be metabolized by the cell, so it can be used to monitor the glucose uptake in living cells. Cells were inoculated in confocal dishes, and 2-NBDG was dissolved in glucose-free MEM medium and incubated for 60 min before being photographed by fluorescence microscopy. After 18 h of induction with 18 mM glucosamine, the fluorescence intensity of IR-HepG2 cells was reduced compared to the control, indicating that the cells had a reduced ability to take up 2-NBDG (Figure 2A and B). The ability of HepG2 cells to take up glucose was assessed by flow cytometry, and Figure 2C and D show that the ability of the cells to take up glucose was reduced after glucosamine stimulation, but there was no significant difference.1 µM insulin was administered for 24 h. Figure 2E and F show that the ability of the HepG2 cells to take up 2-NBDG was enhanced by the stimulation of high-glucose and high-insulin. The fluorescence intensity of the cells was measured by flow cytometry, and Figure 2G and H showed that the uptake of 2-NBDG by HepG2 cells was stronger after the stimulation of drug administration, and Figure 2I and J showed that the uptake of 2-NBDG by HepG2 cells was reduced after the effect of 0.2 mM PA for 24 h. The fluorescence intensity of the cells was measured by flow cytometry. The changes in 2-NBDG uptake by flow cytometry were consistent with the fluorescence results, and the 2-NBDG uptake capacity of HepG2 cells stimulated with palmitic acid was weakened compared with that of the control group (Figure 2K and L).
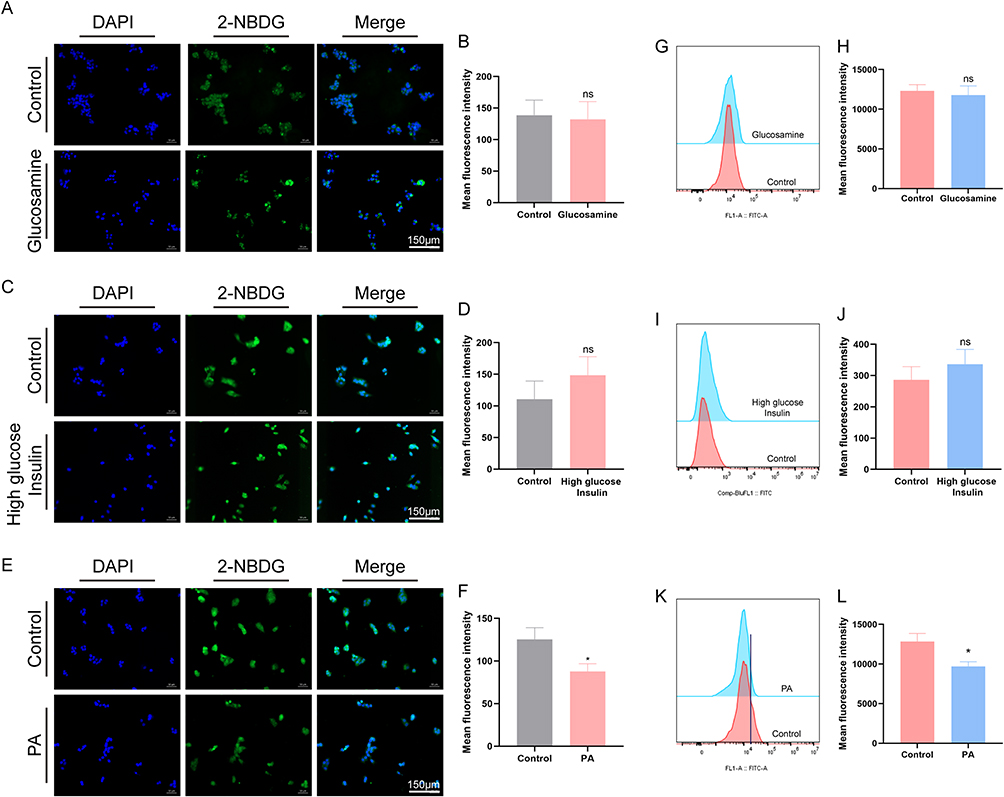 |
Figure 2 Effect of different induction conditions on cellular sugar uptake capacity. (A–D) 18 mM glucosamine acts for 18 h cellular glucose uptake. (E–H) 1 μM insulin acts for 24 h cellular glucose uptake. (I–L) 0.2 mM palmitic acid for 24 h cellular glucose uptake. * P < 0.05, vs control group. |
Effects of Three Induction Methods on p-AKT/AKT Levels
Impairment of PI3K/AKT signaling pathway is one of the manifestations of insulin resistance, and the level of p-AKT/AKT was decreased after insulin resistance. Western blot results showed that after stimulation with 100 nm insulin, p-AKT/AKT levels were significantly increased in the control group, indicating that the cells were sensitive to lower concentrations of insulin in the normal state and the insulin signaling pathway was activated. After glucosamine, high glucose combined with high insulin stimulation of cells with 100 nm insulin, p-AKT/AKT levels were increased. It indicates that the cells are sensitive to insulin. Whereas, after stimulating the cells with palmitic acid, there was no significant change in p-AKT/AKT levels after stimulating the cells using 100 nm insulin, indicating that the sensitivity of the cells to insulin was reduced (Figure 3A and B).
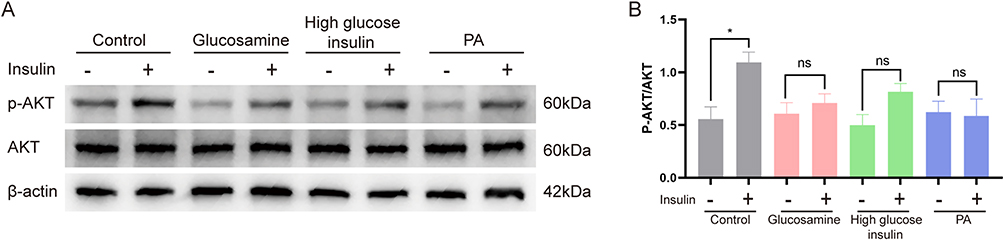 |
Figure 3 Effects of the three induction methods on p-AKT/AKT levels. (A) Glucosamine, high glucose high insulin, palmitic acid induced p-AKT, AKT protein expression levels in IR-HepG2 cells. (B) Glucosamine, high glucose high insulin, palmitic acid induced IR-HepG2 cells p-AKT, AKT protein expression level quantitatively. * P < 0.05. |
Effects of Three Induction Methods on mRNA Expression Levels of Cellular Gluconeogenesis-Related Enzymes
When cells become insulin resistant, decreased levels of AKT phosphorylation lead to increased levels of transcription of the downstream glycoheterotrophic enzymes Glucose-6-phosphatase (G6pase), pyruvate carboxylase (PC), and recombinant Phosphoenolpyruvate Carboxy kinase 1 (PCK1). Enhanced gluconeogenesis RT-qPCR results showed that compared with the control group, G6pase expression levels were elevated after glucosamine and palmitate stimulation, and did not change significantly after high glucose and high insulin stimulation (Figure 4A). PC expression levels were elevated after glucosamine and palmitate stimulation, and did not change significantly after high glucose and high insulin stimulation (Figure 4B). PCK1 expression was elevated after glucosamine, high glucose combined with high insulin and palmitate stimulation (Figure 4C).
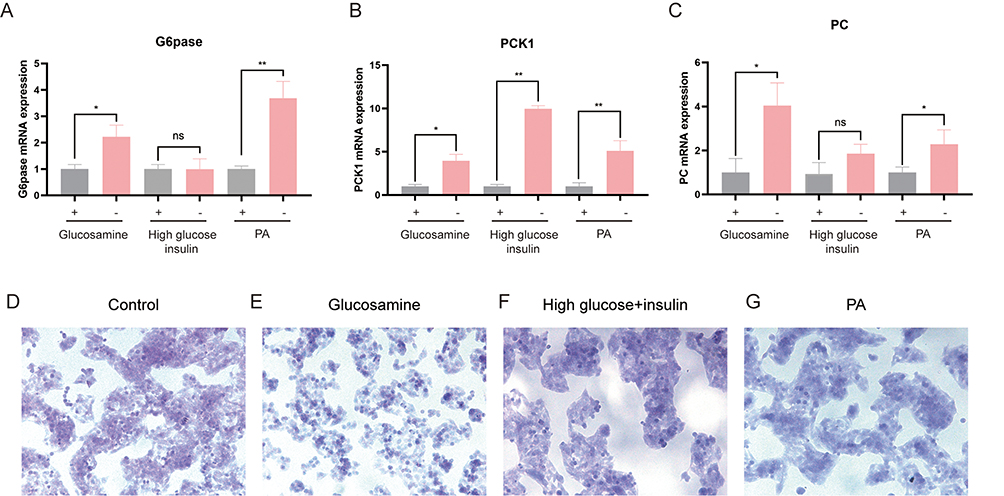 |
Figure 4 Effects of three induction methods on mRNA expression levels of cellular gluconeogenesis-related enzymes. (A–C) Changes in mRNA levels of cytosolic gluconeogenesis-associated enzymes at 18 h after 18 mM glucosamine, at 24 h after 1 μM insulin, and at 24 h after 0.2 mM palmitic acid. (D) PAS staining of normal HepG2 cells (200×). (E) Glucosamine induced PAS staining of IR-HepG2 cells (200×). (F) High glucose and high insulin induced PAS staining of IR-HepG2 cells (200×). (G) Palmitic acid induced PAS staining of IR-HepG2 cells (200×). * P < 0.05, ** P < 0.01. |
When insulin resistance occurs in the cells, glycogen synthase undergoes phosphorylation and inhibits glycogen synthesis. Compared with the control group (Figure 4D), glycogen content decreased after glucosamine stimulation was given (Figure 4E); glycogen content did not change significantly after high glucose-high insulin stimulation was given (Figure 4F); and glycogen content decreased after palmitic acid stimulation was given (Figure 4G).
RNA-Seq Analysis of Transcript Level Differences Among Three Induction Methods
In order to further investigate the effects of the three induction methods on the cells, the RNA-seq results of IR-HepG2 cells induced by different methods were analyzed in this experiment, which can be reflected from the heatmap that there is a consistency in the effects of glucosamine and palmitate on the three cell samples, and a lack of consistency in the effects of high glucose and high insulin on the cellular transcriptomes (Figure 5A–C). Figure 5D–F Volcano plot showing major genes in the insulin signaling pathway. The three methods produced different effects on the major genes of the insulin signaling pathway. The expression levels of PC, G6pase, insulin receptor substrate 1 (IRS1), insulin receptor substrate 2 (IRS2), SERBP1, SOCS3, and FOXO1 increased after glucosamine stimulation (Figure 5D). The expression levels of PCK1, IRS2, and SOCS3 increased after high glucose insulin stimulation (Figure 5E). The expression levels of GSK3A, PC, G6pase, and IRS1 increased after palmitate stimulation (Figure 5F). Figure 5G shows that the three methods resulted in 5 genes in the overlapping portion of the IR-HepG2 model, 79 genes in the overlapping portion of glucosamine and high-glucose high-insulin, 118 genes in the overlapping portion of glucosamine and palmitic acid, and 21 genes in the overlapping portion of high-glucose high-insulin and palmitic acid. Figure 5H–J Enrichment of the top fifteen KEGG signaling pathways, Glucosamine was not directly enriched to signaling pathways associated with glucolipid metabolism, and was enriched to signaling pathways associated with glucolipid metabolism using high glucose high insulin and palmitic acid.
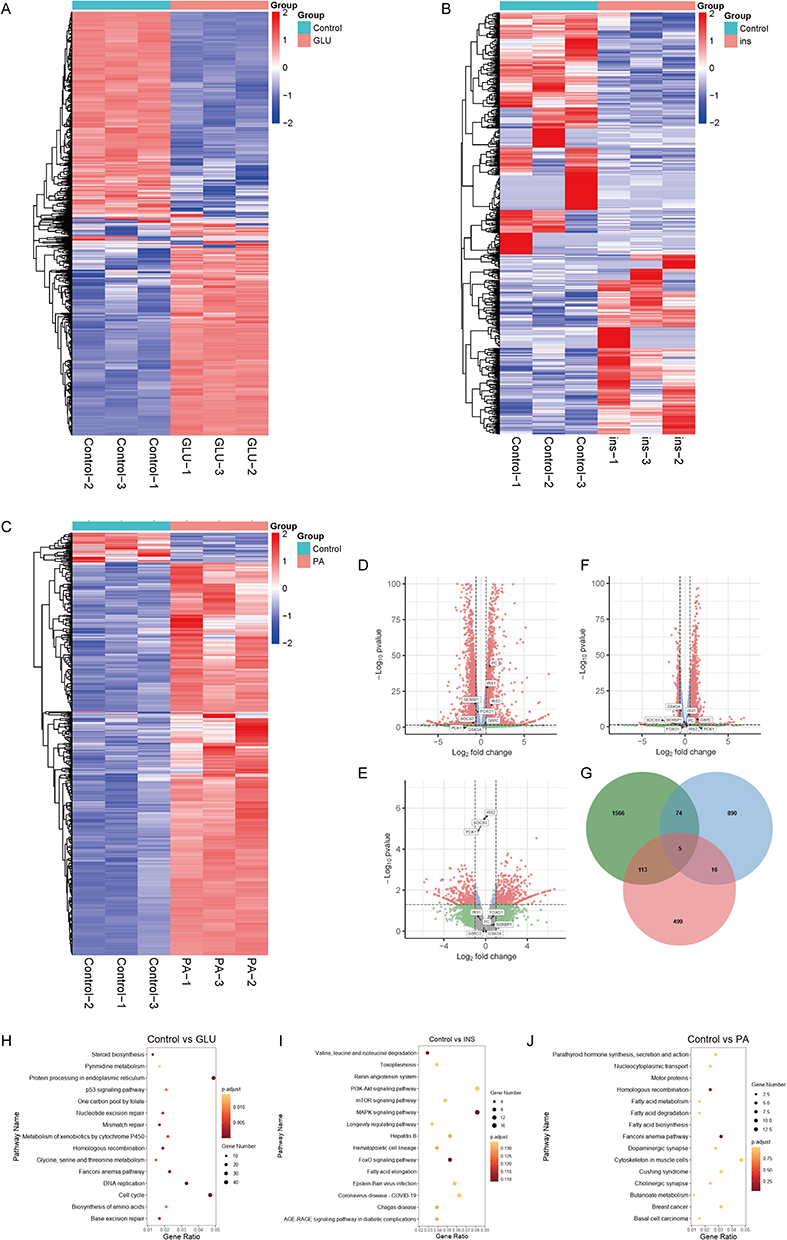 |
Figure 5 RNA-seq analysis of transcript level differences among three induction methods. (A) Glucosamine-induced IR-HepG2 cell mRNA sequencing of all differential gene heatmaps. (B) Heatmap of all differential genes in mRNA sequencing of high glucose and high insulin induced IR-HepG2 cells (data from GSE139929). (C) Heatmap of all differential genes in PA-induced cellular mRNA sequencing of IR-HepG2 cells. (D) Glucosamine-induced IR-HepG2 cell mRNA sequencing insulin signaling pathway-related gene volcano map. (E) High glucose and high insulin induced IR-HepG2 cells mRNA sequencing insulin signaling pathway related gene volcano map (data from GSE139929). (F) Volcano plot of genes related to insulin signaling pathway by mRNA sequencing in PA-induced IR-HepG2 cells. (G) Venn diagram of RNA-seq differential genes in glucosamine, high-glucose high-insulin (data from GSE139929), and palmitate-induced IR-HepG2 cells. (H) Glucosamine-induced KEGG pathway enrichment bubble plots in IR-HepG2 cells. (I) High glucose plus insulin induced KEGG pathway enrichment bubble graph of IR-HepG2 cells data from (GSE139929). (J) PA-induced KEGG pathway enrichment bubble diagram of IR-HepG2 cells. |
Discussion
Glucosamine, high glucose combined with high insulin, and palmitic acid have been widely recognized as inducers for the establishment of insulin-resistant cell models, but their induction concentrations and duration of action have been reported differently5,11 (Table 2).In the present study, based on reviewing a large number of literatures, we briefly compared the three methods by combining cell viability, cellular glucose consumption, glucose uptake, changes in p-AKT/AKT levels, and changes in the expression levels of gluconeogenesis enzymes, and analyzed the differences between the three methods at the transcriptional level by RNA-seq, with the aim of obtaining a simple and stable model of insulin resistance in vitro.12–14
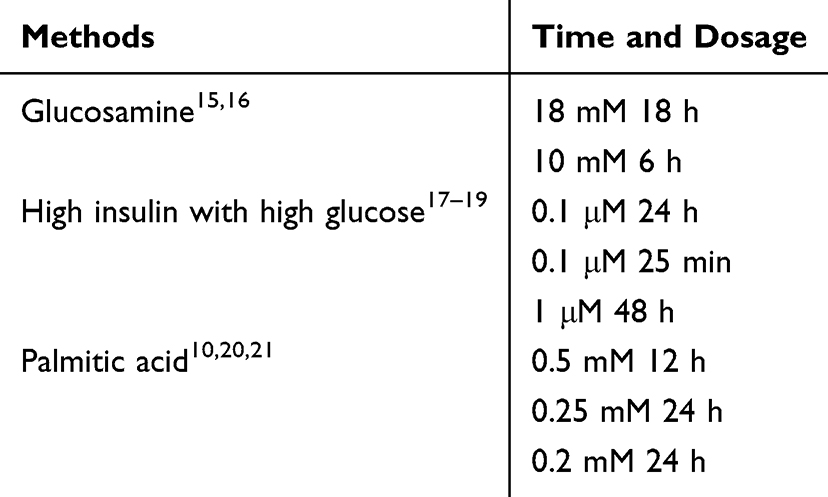 |
Table 2 Different Methods |
Glucosamine is a naturally occurring aminoglucose that is ubiquitous in the human body and is obtained by the amination of glucose. In previous studies, glucosamine may cause insulin resistance in HepG2 cells by affecting apolipoproteins,22 or it may cause insulin resistance due to inflammation induced by high glucose,23 in which the use of glucosamine induced decreased glucose consumption, decreased glucose uptake capacity, increased COX2 protein levels, and increased ROS levels in IR-HepG2 cells.15 The results of the present experiment showed that HepG2 cells were subjected to 18 mM glucosamine for 18 h. Glucose consumption was reduced, and glucose uptake was reduced, but there was no significant difference. The inconsistency in the pre-glucose uptake results could be attributed to the inconspicuous changes in cellular glucose uptake due to the long incubation time with 2-NBDG in the experimental process, and the cell source, the number of cell generations, glucose assay methods, and human error could all contribute to the changes in glucose uptake. The cell source, cell generation, glucose determination method and human error may cause the experimental results to vary.
Glucose transporter 4 (GLUT4) is a unique isoform of glucose transporter proteins that plays an important role in mediating insulin-dependent glucose uptake and maintaining glucose homeostasis.24 High glucose and high insulin may be the key factors affecting GLUT4 to induce IR-HepG2 cells. In the previous study, high glucose and high insulin induced IR-HepG2 cells to have lower glucose consumption, lower glucose uptake, and lower p-AKT/AKT expression levels,25,26 while the results of the present experiment showed that the glucose consumption of cells stimulated by insulin was greater than that of the blank group, and there was no significant difference in the glucose uptake ability and p-AKT/AKT changes, which was different from the results of the previous study. The reason for this analysis may be that the presence of high glucose and high insulin over-enhanced the utilization of glucose by cellular GLUT4, which resulted in an increase in glucose consumption compared to the blank group. The combination of high glucose and high insulin is to induce the insulin resistance model by virtue of the continuous stimulation of cells by insulin, and the continuous presence of insulin stimulation of cells due to the presence of 5–20 mg/L of insulin in the medium may be the reason why a stable insulin resistance model could not be obtained in this experiment.27
Palmitic acid is a saturated long-chain fatty acid, and insulin resistance induced by obesity is the main pathogenesis of type 2 diabetes mellitus, which is characterized by the blockage of insulin signaling.28 High concentrations of plasma free fatty acids (FFAs) are the main manifestation of obesity and the main etiology of insulin resistance, and also serve as a molecular basis for the induction of insulin resistance by FFAs as investigated in the human hepatocyte cell line HepG2.29 In the previous study, PA acts as an inflammatory factor, and its cause of insulin resistance may be to affect the JNK and NF-κB inflammatory pathways,30 in the previous study PA established the IR-HepG2 cell model, and a decrease in glucose consumption, glucose uptake, and glycogen content of the model cells was observed,31 and in the present experiments, cellular glucose consumption, glucose uptake, and glycogen content were decreased after induction of IR-HepG2 cells using PA, decreased glucose uptake, p-AKT/AKT expression level, and increased gluconeogenic enzyme expression level in IR-HepG2 cells induced with PA in this experiment, which was consistent with the previous study.32,33
RNA-seq sequencing results show that glucosamine, high glucose and high insulin, and palmitic acid affect cells differently. Glucosamine was not enriched in the top 15 signaling pathways enriched for pathways directly affecting glucose-lipid metabolism, but was enriched in the subsequent enrichment to p<0.05 for signaling pathways directly related to glucose-lipid metabolism and energy metabolism. The high glucose-high insulin and palmitic acid-induced insulin resistance models were enriched for signaling pathways directly related to glucolipid metabolism. Venn The overlapping portions of each method suggests that there may be similarities in the mechanisms by which glucosamine and palmitic acid cause insulin resistance, which are different from high glucose-high insulin. The three methods, although causing different cellular phenotypes, changes in protein levels, and other differences, have similarities in the signaling pathways that change.34
In patients with type 2 diabetes, insulin resistance involves various aspects of glucose regulation, including glycolysis, glycogen synthesis, and glucose oxidation. The phosphatidylinositol 3-kinase (PI3K)/AKT pathway has been recognized as an important signaling pathway mediating the metabolic effects of insulin, with Akt (serine/threonine protein kinase) as a key effector molecule. Insulin resistance occurs at multiple cellular levels, from the cell surface to the nucleus, and includes insulin receptor desensitization, inhibition of IRS proteins and function, and inhibition of the PI3K cascade. Experiments using glucosamine, high glucose and high insulin, and palmitic acid as inducing conditions for cells to produce insulin resistance inform the study of insulin resistance.35
Conclusion
In this study, three methods of inducing insulin resistance in HepG2 cells were investigated and briefly analyzed based on the experimental results, and there were large differences in the insulin resistance models of HepG2 cells induced by the three methods. In this experiment, we selected the simpler and more stable method among the three methods based on the comprehensive results, ie, the use of palmitic acid to stimulate HepG2 cells is simpler and more stable with good reproducibility, which provides a model reference for the research of insulin resistance.
Acknowledgments
We thank Sangerbox platform for providing data analysis and visualization support (http://sangerbox.com/index.html).
Funding
The work was supported by Excellent scientific research and innovation team of Anhui universities (2022AH010084); Anhui Engineering Technology Research Center of Biochemical Pharmaceutical Foundation (2023SYKFD06); The Key Projects of Outstanding Young Talents Support Program in Universities of Anhui Province (YQZD2024029).
Disclosure
The authors declared no potential conflicts of interest in this work.
References
1. Yudhani RD, Sari Y, Nugrahaningsih DAA, et al. In vitro insulin resistance model: a recent update. J Obesity. 2016;229(2):R57–66.
2. Yuasa T, Amo K, Ishikura S, et al. Development of in vitro model of insulin receptor cleavage induced by high glucose in HepG2 cells. Biochem Biophys Res Commun. 2014;445(1):236–243. doi:10.1016/j.bbrc.2014.01.187
3. Jian T, Wu Y, Ding X, et al. A novel sesquiterpene glycoside from Loquat leaf alleviates oleic acid-induced steatosis and oxidative stress in HepG2 cells. Biomed Pharmacother. 2018;97:1125–1130. doi:10.1016/j.biopha.2017.11.043
4. Mukherjee S, Chakraborty M, Msengi EN, et al. Ube4A maintains metabolic homeostasis and facilitates insulin signaling in vivo. Mol Metabol. 2023;75:101767. doi:10.1016/j.molmet.2023.101767
5. Yan J, Wang C, Jin Y, et al. Catalpol ameliorates hepatic insulin resistance in type 2 diabetes through acting on AMPK/NOX4/PI3K/AKT pathway. Pharmacol Res. 2018;130:466–480. doi:10.1016/j.phrs.2017.12.026
6. Chen Y, Li Q, Zhao S, et al. Berberine protects mice against type 2 diabetes by promoting PPARγ-FGF21-GLUT2-regulated insulin sensitivity and glucose/lipid homeostasis. Biochem Pharmacol. 2023;218:115928. doi:10.1016/j.bcp.2023.115928
7. Xiao H, Sun X, Lin Z, et al. Gentiopicroside targets PAQR3 to activate the PI3K/AKT signaling pathway and ameliorate disordered glucose and lipid metabolism. Acta Pharmaceutica Sinica B. 2022;12(6):2887–2904. doi:10.1016/j.apsb.2021.12.023
8. Yoo J, Jeong IK, Ahn KJ, et al. Fenofibrate, a PPARα agonist, reduces hepatic fat accumulation through the upregulation of TFEB-mediated lipophagy. Metabolism. 2021;120:154798. doi:10.1016/j.metabol.2021.154798
9. Weng SW, Wu JC, Shen FC, et al. Chaperonin counteracts diet-induced non-alcoholic fatty liver disease by aiding sirtuin 3 in the control of fatty acid oxidation. Diabetologia. 2023;66(5):913–930. doi:10.1007/s00125-023-05869-9
10. Sun Y, Wang J, Guo X, et al. Oleic acid and eicosapentaenoic acid reverse palmitic acid-induced insulin resistance in human HepG2 cells via the reactive oxygen species/JUN pathway. Genomics Proteomics Bioinform. 2021;19(5):754–771. doi:10.1016/j.gpb.2019.06.005
11. Gu L, Ding X, Wang Y, et al. Spexin alleviates insulin resistance and inhibits hepatic gluconeogenesis via the FoxO1/PGC-1α pathway in high-fat-diet-induced rats and insulin resistant cells. Int J Biol Sci. 2019;15(13):2815–2829. doi:10.7150/ijbs.31781
12. Xuguang H, Aofei T, Tao L, Longyan Z, Weijian B, Jiao G. Hesperidin ameliorates insulin resistance by regulating the IRS1-GLUT2 pathway via TLR4 in HepG2 cells. Phytother Res. 2019;33(6):1697–1705. doi:10.1002/ptr.6358
13. Zhang X, Liu AL, Zhang Y, et al. A diarylheptanoid compound from Alpinia Officinarum Hance ameliorates high glucose-induced insulin resistance by regulating Pi3K/AKT-Nrf2-GSK3βsignaling pathways in HepG2 cells. J Ethnopharmacol. 2022;295:115397. doi:10.1016/j.jep.2022.115397
14. Li Y, Tang Y, Shi S, et al. Tetrahedral Framework Nucleic Acids Ameliorate Insulin Resistance in Type 2 Diabetes Mellitus via the PI3K/Akt Pathway. ACS Appl Mater Interf. 2021;13(34):40354–40364. doi:10.1021/acsami.1c11468
15. Li D, Xiaoyu H, Fengsui L, et al. Regulation of insulin resistance by targeting the insulin‐like growth factor 1 receptor with microRNA‐122‐5p in hepatic cells. Cell Biol Int. 2019;43(5):553–564. doi:10.1002/cbin.11129
16. Chen CH, Cheng TL, Chang CF, et al. Raloxifene Ameliorates Glucosamine Induced Insulin Resistance in Ovariectomized Rats. Biomedicines. 2021;9(9):1114. doi:10.3390/biomedicines9091114
17. Manowsky J, Camargo RG, Kipp AP, Henkel J, Püschel GP. Insulin-induced cytokine production in macrophages causes insulin resistance in hepatocytes. Am J Physiol Endocrinol Metab. 2016;310(11):E938–46. doi:10.1152/ajpendo.00427.2015
18. Li P, Ding L, Cao S, et al. Curcumin metabolites contribute to the effect of curcumin on ameliorating insulin sensitivity in high-glucose-induced insulin-resistant HepG2 cells. J Ethnopharmacol. 2020;259:113015. doi:10.1016/j.jep.2020.113015
19. Yang Q, Zhu Z, Wang L, et al. The protective effect of silk fibroin on high glucose induced insulin resistance in HepG2 cells. Environ Toxicol Pharmacol. 2019;69:66–71. doi:10.1016/j.etap.2019.04.001
20. Song L, Li Y, Xu M. Exogenous nucleotides ameliorate insulin resistance induced by palmitic acid in HepG2 cells through the IRS-1/AKT/FOXO1 pathways. Nutrients. 2024;16(12):1801. doi:10.3390/nu16121801
21. Xue GM, Zhao CG, Xue JF, et al. Zhang WD.Germacranolide- and guaianolide-type sesquiterpenoids from Achillea alpina L. reduce insulin resistance in palmitic acid-treated HepG2 cells via inhibition of the NLRP3 inflammasome pathway. Phytochemistry. 2022;202:113297. doi:10.1016/j.phytochem.2022.113297
22. Salama AA, Luisa V, Raffaella S, et al. Circulating exosomes from metabolic syndrome patients induce insulin resistance in human hepatocytes but not in human endothelial cells. Arch Cardiovasc Dis Suppl. 2019;11(2):188. doi:10.1016/j.acvdsp.2019.02.015
23. Zhu D, Wang Y, Du Q, Liu Z, Liu X. Cichoric acid reverses insulin resistance and suppresses inflammatory responses in the glucosamine-induced HepG2 cells. J Agri Food Chem. 2015;63(51):10903–10913. doi:10.1021/acs.jafc.5b04533
24. Hiroshi S, Daisuke M, May W, et al. KARATE: PKA-induced KRAS4B-RHOA-mTORC2 supercomplex phosphorylates AKT in insulin signaling and glucose homeostasis. Mol Cell. 2021;81(22):4622–4634. doi:10.1016/j.molcel.2021.09.001
25. Lingchao M, Haolin Z, Meng Sam C, et al. Anti-diabetic potential of apigenin, luteolin, and baicalein via partially activating PI3K/Akt/Glut-4 signaling pathways in insulin-resistant HepG2 cells. Food Sci Human Wellness. 2023;12(6):1991–2000. doi:10.1016/j.fshw.2023.03.021
26. Wei H, Meng L, Wei S, et al. Hirsutine ameliorates hepatic and cardiac insulin resistance in high-fat diet-induced diabetic mice and in vitro models. Pharmacol Res. 2022;177:105917. doi:10.1016/j.phrs.2021.105917
27. Haijie Z, Shuai X, Marie-Didiée H, Buchmann P, Augusto T, Martin F. Tuning of cellular insulin release by music for real-time diabetes control. Lancet Diabetes Endocrinol. 2023;11(9):637–640. doi:10.1016/S2213-8587(23)00153-5
28. Bhama R, Elizabeth JH, Mickaël M, et al. Netrin-1 promotes adipose tissue macrophage retention and insulin resistance in obesity. Nat Med. 2014;20(4):377–384. doi:10.1038/nm.3467
29. Jian T, Ao X, Wu YX, et al. Total sesquiterpene glycosides from Loquat (Eriobotrya japonica) leaf alleviate high-fat diet induced non-alcoholic fatty liver disease through cytochrome P450 2E1 inhibition. Biomed Pharmacother. 2017;91:229–237. doi:10.1016/j.biopha.2017.04.056
30. Nie JR, Chang YN, Li Y, et al. Caffeic acid phenethyl ester (Propolis Extract) ameliorates insulin resistance by inhibiting JNK and NF-κB inflammatory pathways in diabetic mice and HepG2 cell models. J Agri Food Chem. 2017;65(41):9041–9053. doi:10.1021/acs.jafc.7b02880
31. Yan F, Dai G, Zheng X. Mulberry anthocyanin extract ameliorates insulin resistance by regulating PI3K/AKT pathway in HepG2 cells and db/db mice. J Nutri Biochem. 2016;36:68–80. doi:10.1016/j.jnutbio.2016.07.004
32. Xiaoya Z, Mengge Z, Cuihua J, et al. Triterpenic acids-enriched fraction from Cyclocarya paliurus attenuates insulin resistance and hepatic steatosis via PI3K/Akt/GSK3β pathway. Phytomedicine. 2020;66:153130. doi:10.1016/j.phymed.2019.153130
33. Chunjie J, Shanshan Z, Hongmei Z, et al. Impaired ferritinophagy induced hepatic insulin resistance via endoplasmic reticulum stress of high fat diet mice. Proc Nutri Soc. 2020;79(OCE2).
34. Jie M, Jiajia L, Dongmei C, Dandan L, Jing W. Integration of metabolomics and transcriptomics reveals major metabolic pathways and potential biomarkers involved in aging mice with type 2 diabetes mellitus. Chin Med J. 2021;135(2):247–249. doi:10.1097/CM9.0000000000001554
35. Xiaoke Z, Yingying K, Aozi F, et al. The mechanism by which amentoflavone improves insulin resistance in HepG2 cells. Molecules. 2016;21(5):624. doi:10.3390/molecules21050624
 © 2025 The Author(s). This work is published and licensed by Dove Medical Press Limited. The
full terms of this license are available at https://www.dovepress.com/terms
and incorporate the Creative Commons Attribution
- Non Commercial (unported, 4.0) License.
By accessing the work you hereby accept the Terms. Non-commercial uses of the work are permitted
without any further permission from Dove Medical Press Limited, provided the work is properly
attributed. For permission for commercial use of this work, please see paragraphs 4.2 and 5 of our Terms.
© 2025 The Author(s). This work is published and licensed by Dove Medical Press Limited. The
full terms of this license are available at https://www.dovepress.com/terms
and incorporate the Creative Commons Attribution
- Non Commercial (unported, 4.0) License.
By accessing the work you hereby accept the Terms. Non-commercial uses of the work are permitted
without any further permission from Dove Medical Press Limited, provided the work is properly
attributed. For permission for commercial use of this work, please see paragraphs 4.2 and 5 of our Terms.