
Back to Journals » Biologics: Targets and Therapy » Volume 19
Epigenetic Regulation of Sorbitol Dehydrogenase in Diabetic Retinopathy Patients: DNA Methylation, Histone Acetylation and microRNA-320
Authors Amin R  , Permana H, Kartasasmita AS, Hilmanto D, Hidayat R
Received 8 February 2025
Accepted for publication 20 April 2025
Published 28 April 2025 Volume 2025:19 Pages 251—264
DOI https://doi.org/10.2147/BTT.S521519
Checked for plagiarism Yes
Review by Single anonymous peer review
Peer reviewer comments 2
Editor who approved publication: Dr Shein-Chung Chow
Ramzi Amin,1,* Hikmat Permana,2,* Arief Sjamsulaksan Kartasasmita,3,* Dany Hilmanto,4,* Rachmat Hidayat5,*
1Department of Ophthalmology, Faculty of Medicine, Universitas Sriwijaya, Palembang, Indonesia; 2Department of Internal Medicine, Faculty of Medicine, Universitas Padjadjaran, Bandung, Indonesia; 3Department of Ophthalmology, Faculty of Medicine, Universitas Padjadjaran, Bandung, Indonesia; 4Department of Pediatrics, Faculty of Medicine, Universitas Padjadjaran, Bandung, Indonesia; 5Department of Medical Biology, Faculty of Medicine, Universitas Sriwijaya, Palembang, Indonesia
*These authors contributed equally to this work
Correspondence: Ramzi Amin, Department of Ophthalmology, Faculty of Medicine, Universitas Sriwijaya, Jl Dr Moh Ali KM 3.5, Palembang, South Sumatera, 30126, Indonesia, Tel +62 882 2505 3819, Email [email protected]
Purpose: This study aimed to investigate the correlation between epigenetic markers and sorbitol dehydrogenase (SDH) levels in patients with type 2 diabetes and diabetic retinopathy (DR).
Patients and Methods: We conducted a case control study on 40 patients with type 2 diabetes and DR and 40 patients with type 2 diabetes without DR. Clinical data and ophthalmological examinations were performed to confirm the presence or absence of DR. Blood samples were collected for the analysis of DNA methylation, histone acetylation, microRNA-320 levels, and SDH enzyme activity. The epigenetic markers were evaluated using enzyme linked immunosorbent modified assay. The data were analyzed using statistical tests, including Spearman correlation and multiple linear regression.
Results: In patients with DR, there was a significant negative correlation between microRNA-320 levels and SDH enzyme activity (r=− 0.968, p=0.000). No significant correlations were found between DNA methylation or histone acetylation and SDH activity. Multivariate analysis confirmed the strong negative correlation between microRNA-320 and SDH (r = − 0.727, p=0.000), with microRNA-320 explaining 58.1% of the variance in SDH levels.
Conclusion: The findings suggest that microRNA-320 plays a crucial role in regulating SDH enzyme activity in patients with type 2 diabetes and DR. The development of microRNA-320-based therapies, such as miRNA mimics or antagomirs, may offer a novel approach to modulating SDH activity and mitigating the detrimental effects of the polyol pathway in DR. Further researches are needed to validate the results and mechanism underlying the correlation between epigenetic regulation SDH in DR.
Keywords: case control studies, genetic, linear models, microRNAs, type 2 diabetes mellitus
Introduction
Diabetic retinopathy (DR) stands as a major microvascular complication of diabetes, significantly impacting the lives of millions worldwide.1 The prevalence of DR is expected to rise further, reaching 103.1 million by 2020 and 160.5 million by 2040, underscoring the urgent need for effective preventive and therapeutic strategies.2 The impact of DR extends beyond visual impairment, encompassing a significant socioeconomic burden due to decreased productivity, increased healthcare costs, and diminished quality of life for affected individuals.3,4
Chronic hyperglycemia, a hallmark of diabetes, triggers a cascade of biochemical and physiological alterations that culminate in retinal microvascular damage.5 The polyol pathway, a glucose metabolic pathway, has emerged as a key player in DR development. In hyperglycemia, the enzyme aldose reductase (AR) redirects excess glucose into the polyol pathway, where it transforms into sorbitol.6,7 Sorbitol dehydrogenase (SDH) further metabolizes sorbitol to fructose.7 When sorbitol and fructose build up in retinal cells, they cause osmotic stress, oxidative stress, and the production of advanced glycation end products (AGEs).8 The accumulation of AGEs further amplifies the inflammatory response and promotes microvascular dysfunction in retina.9
Chronic hyperglycemia can induce DNA methylation at specific CpG sites in the promoter region of miR-320. Epigenetic regulations, encompassing DNA methylation, histone modifications, and non-coding RNAs, have garnered increasing attention in recent years for their role in modulating gene expression without altering the underlying DNA sequence.10 MicroRNA-320 (miR-320) has emerged as a critical regulator in various biological processes, including cell proliferation, apoptosis, and inflammation.11 Studies have shown that microRNA-320a, a member of the microRNA-320 family, is downregulated in the retinas of diabetic animals and that its overexpression can attenuate retinal vascular leakage and inflammation.12–14 Furthermore, microRNA-320a has been shown to target VEGF, a potent angiogenic factor that plays a central role in the development of DR. By inhibiting VEGF expression, microRNA-320a may suppress angiogenesis and neovascularization, two pathological processes that contribute to vision loss in DR.15 Hyperglycemia can also alter histone acetylation patterns in the miR-320 promoter region.16 MicroRNA-320 was selected for this study due to its known role in regulating SDH expression.17,18 The downregulation of microRNA-320a has been observed in the retinas of diabetic animals and has been associated with increased SDH activity.
The present study aimed to delve into the epigenetic regulation of SDH in DR. Specifically, we sought to investigate the correlation between DNA methylation, histone acetylation, and microRNA-320 levels and SDH enzyme activity in patients with type 2 diabetes and DR. By investigating the correlation between DNA methylation, histone acetylation, and microRNA-320 levels and SDH enzyme activity in patients with type 2 diabetes and DR, this study aimed to provide novel insights into the epigenetic regulation of SDH in DR.
Materials and Methods
Ethics Statement
The studies involving humans were approved by Health Research Ethics Committee of the Faculty of Medicine, Universitas Padjadjaran, Bandung, Indonesia (approval document: 125/UN6.C1.3.2/KEPK/PN/2022). The study was conducted according to the standards set by the Declaration of Helsinki. All patients in this study had previously authorized their participation by signing the informed consent statement, having received clarification on the study to be performed.
Study Population
A case control and hospital-based study was conducted at ophthalmology outpatient clinic of Dr. Mohammad Hoesin General Hospital (Palembang, Indonesia) between November 2022 and October 2024. All adult patients older than 40 years of age presenting with type 2 diabetes mellitus were eligible for inclusion in the study. The inclusion criteria were as follows: diabetic retinopathy (DR) group: patients with type 2 diabetes, age ≥ 40 years, duration of diabetes ≥ 10 years, presence of DR, confirmed by funduscopy or fundus photography; non-diabetic retinopathy (non-DR) group: patients with type 2 diabetes; age ≥ 40 years; duration of diabetes ≥ 10 years; absence of DR, confirmed by funduscopy or fundus photography. The exclusion criteria excluded patients with leukemia retinopathy, retinitis pigmentosa and chorioretinitis. Forty DR patients and 40 non-DR patients were included in this study.
Data Collection
Data collection involved both clinical and laboratory assessments. Clinical data, including age, gender, duration of diabetes, and blood pressure, were obtained from the participants’ medical records and through direct interviews. Ophthalmological examinations, including funduscopy or fundus photography, were performed to confirm the presence or absence of DR. Laboratory assessments involved the collection and analysis of blood samples.
To facilitate the downstream molecular analyses, a 5 mL sample of venous blood was collected from each participant following informed consent. The collected blood was immediately dispensed into two separate sterile tubes to ensure optimal preservation for different analyses. One tube contained ethylenediaminetetraacetic acid (EDTA) as an anticoagulant, which is essential for the isolation of high-quality genomic DNA and total RNA from the blood cells. The second tube was a serum separator tube, containing no anticoagulant. Blood in this tube was allowed to clot naturally at room temperature. Subsequently, the clotted blood was centrifuged at a specific speed and duration (as per standard laboratory protocols) to separate the serum, which was then carefully aliquoted into cryovials and stored at an ultra-low temperature of −80°C until the analysis of Sorbitol Dehydrogenase (SDH) enzyme levels.
DNA Methylation
The assessment of DNA methylation levels in the participants’ blood samples was performed using a colorimetric-based Methylated DNA Quantification Kit (catalogue number 300110; QIAgen, Maryland, US). This method allows for the quantitative determination of the percentage of methylated DNA in a given sample. The procedure commenced with the preparation of a 1X wash buffer by diluting the provided 10X wash buffer concentrate with high-quality distilled water in a precise 1:10 ratio. To ensure the assay’s validity, a positive control was prepared by carefully diluting the kit’s positive control solution with 1X TE buffer to a final concentration of 5 mg/μL. Following this, 80 μL of the kit’s binding solution was added to each well of the assay plate. To assess the assay’s background and performance, 1 μL of the provided negative control was added to a designated well (typically A1), and 1 μL of the prepared positive control was added to another well (typically B1). Subsequently, 1 μL of each participant’s extracted DNA sample, containing 100 mg of DNA, was added to the remaining wells. The assay plate was then meticulously sealed with a plate seal and incubated at a controlled temperature of 37°C for 90 minutes to allow for efficient binding of the DNA to the well. After the incubation, the binding solution was carefully removed from each well, and the wells were thoroughly washed three times with the prepared 1X wash buffer to eliminate any unbound material. The next step involved the incubation with the capture antibody. The kit-provided captive antibody was diluted with the diluted wash buffer at a ratio of 1:1000. 50 μL of this diluted capture antibody was then added to each well, and the plate was resealed and incubated at room temperature for 60 minutes. Following this incubation, the diluted capture antibody was removed, and the wells were washed three times with the diluted wash buffer. Subsequently, the detection antibody, also provided with the kit, was diluted at a ratio of 1:2000 with the wash buffer. 50 μL of this diluted detection antibody was added to all wells, and the plate was sealed and incubated for 30 minutes at room temperature. After this incubation, the diluted detection antibody was discarded, and each well was washed four times with 150 μL of the diluted wash buffer. To enhance the signal, the kit’s enhancer solution was diluted with the wash buffer at a ratio of 1:5000, and 50 μL of this diluted solution was added to each well. The plate was then sealed and incubated for 30 minutes at room temperature. Following this incubation, the diluted enhancer solution was removed, and each well was washed five times with 150 μL of the diluted wash buffer. Finally, to develop the colorimetric signal, 100 μL of the kit’s developer solution was added to each well, and the plate was incubated at room temperature for 10 minutes. During this step, a blue color developed in wells containing sufficient methylated DNA. To stop the enzymatic reaction and stabilize the color, 50 μL of the kit’s stop solution was added to each well when the positive control turned light blue. This resulted in a color change to yellow. The absorbance of the solution in each well was then measured at 450 nm using a microplate reader. The obtained absorbance values were directly proportional to the amount of methylated DNA in the samples.
Histone Acetylation
The levels of histone acetylation in the participants blood samples were determined using a Histone H3 acetylation kit (catalogue number ab117128; Abcam, Cambridge, UK) that detects acetylated lysine residues on histone H3. The procedure involved several key steps; reagent preparation, histone extraction and assay procedure.
Several reagents were prepared according to the kit’s instructions. A 10X lysis buffer was diluted with distilled water (1:10). An extraction buffer was prepared by adding glycerol to the provided extraction buffer at a ratio of 1:10. A 10X wash buffer was diluted with distilled water (1:10). The capture antibody was diluted with the provided antibody buffer at a ratio of 1:10, and the detection antibody was diluted with the antibody buffer at a ratio of 1:100.
Histones were extracted from the blood samples. Initially, 10 μL of lysis buffer and 300 μL of extraction buffer were added to 100 μL of the blood sample. The mixture was thoroughly mixed by vortexing and then incubated on ice for 5 minutes, followed by centrifugation at 12,000 rpm for 5 minutes at 4°C. The supernatant was carefully collected and transferred to a new 1.5 mL tube. Subsequently, 100% trichloroacetic acid (TCA) was added to the supernatant at a ratio of 1:4, and the mixture was incubated on ice for 30 minutes. Following this incubation, the mixture was centrifuged at 12,000 rpm for 2 minutes at 4°C. The resulting pellet was washed with 1 mL of acetone and then centrifuged at 1200 rpm for 2 minutes at 4°C. The supernatant was discarded, and the pellet was allowed to air-dry for 5 minutes. Finally, the dried pellet containing the histones was resuspended in 10 μL of distilled water.
For the assay, 5 μL of each extracted histone sample was added to designated wells of the assay plate. Additionally, 5 μL of the kit’s positive control was added to control wells, and 5 μL of the provided histone buffer was added to blank wells. The plate was then heated at 37°C for 1.5 hours to dry the wells. After drying, 150 μL of blocking buffer was added to each well and incubated at 37°C for 30 minutes. The wells were then washed three times with 150 μL of wash buffer. Subsequently, 50 μL of the diluted capture antibody was added to each well, and the plate was incubated for 60 minutes on a shaker at a speed between 50 and 100 rpm. Following this incubation, the wells were washed four times with 150 μL of wash buffer. To develop the signal, 100 μL of developing solution was added to each well, and the plate was incubated at room temperature for 10 minutes. Finally, the reaction was stopped by adding 50 μL of stop solution to each well, and the absorbance was read at a wavelength of 450 nm using a microplate reader. The absorbance values obtained were directly correlated with the levels of histone acetylation in the samples.
MicroRNA-320 Analysis
The expression of microRNA-320 was quantified using RT-qPCR. The expression levels of microRNA 320 (miR-320) were determined using a reverse transcription-quantitative polymerase chain reaction (RT-qPCR) method. Total RNA, including microRNAs, was isolated from 100 μL of blood using an RNA isolation kit (catalogue number 203403; miRCURY LNA™, QIAgen, Maryland, US). The procedure involved the addition of 350 μL of lysis solution to the blood sample, followed by vortexing for 15 seconds. Then, 200 μL of 100% ethanol was added, and the mixture was vortexed for another 10 seconds. 600 μL of the resulting lysate was then transferred to a centrifuge column and centrifuged at 3500g for 1 minute. The column was washed by adding 400 μL of wash solution and centrifuging at 14000g for 1 minute. This washing step was repeated once more with another 400 μL of wash solution and centrifugation at 14000g for 1 minute. To ensure complete removal of residual wash buffer, the column was centrifuged again at 14000g for 2 minutes to activate the resin. Finally, the isolated RNA was eluted by adding 50 μL of elution buffer to the column and centrifuging at 14000g for 2 minutes.
The isolated RNA was then used for cDNA synthesis using a reverse transcription kit (miRCURY LNA cDNA, Exiqon, Maryland, US). Prior to use, all reagents were vortexed, briefly centrifuged, and kept on ice for 15 minutes. A cDNA master mix was prepared by combining 2 μL of 5x reaction buffer, 4.5 μL of nuclease-free water, 1 μL of enzyme mix, 0.5 μL of RNase inhibitor, and 2 μL of the isolated RNA sample, resulting in a total reaction volume of 10 μL. The reaction mixture was incubated at 42°C for 60 minutes for reverse transcription, followed by an incubation at 95°C for 5 minutes to inactivate the reverse transcriptase. The synthesized cDNA was then diluted with nuclease-free water at a ratio of 1:80 for subsequent qPCR analysis.
Real-time PCR was performed using a real-time PCR system. The PCR reaction was set up with appropriate primers specific for miR-320 and a suitable internal control (U6 snRNA). The amplification protocol consisted of an initial denaturation step at 95°C for 10 minutes, followed by 40 cycles of denaturation at 95°C for 10 seconds and annealing/extension at 60°C for 1 minute. The expression levels of miR-320 were normalized to the internal control, and the relative quantification of miR-320 expression was determined using the ΔΔCt method.
Sorbitol Dehydrogenase (SDH) Enzyme Activity
Serum levels of sorbitol dehydrogenase (SDH) enzyme were quantified using a commercially available ELISA kit (catalogue number 23049051; Sunlong Biotech, Hangzhou, China). To generate a standard curve, a series of standard solutions with known SDH concentrations were prepared through serial dilutions of the provided standard solution with the standard dilution buffer. Briefly, 100 μL of the standard solution was mixed with 50 μL of standard dilution buffer in well A1, and subsequent dilutions were performed by transferring 100 μL from the previous well to the next well containing 50 μL of standard dilution buffer, creating a concentration gradient across wells A1 to F1. For sample analysis, 40 μL of sample diluent was added to each sample well, followed by the addition of 10 μL of each serum sample. The plate was then covered and incubated for 30 minutes at 37°C. Following incubation, the washing buffer concentrate was diluted with distilled water at a ratio of 1:30. The plate cover was carefully removed, and the wells were washed five times with the diluted washing buffer using an automated plate washer. Subsequently, 50 μL of the HRP-Conjugate reagent was added to all wells except the control well. The plate was again covered and incubated for 30 minutes at 37°C. The washing procedure was repeated five times. For color development, 50 μL of Chromogen Solution A and 50 μL of Chromogen Solution B were added to each well, mixed gently, and incubated for 15 minutes at 37°C. The reaction was terminated by adding 50 μL of Stop Solution to each well, which resulted in a color change from blue to yellow. Finally, the absorbance (optical density) of the solution in each well was measured at 450 nm using a microplate reader. The SDH concentrations in the serum samples were then determined by interpolating their absorbance values against the generated standard curve.
Statistical Analysis
The collected data were analyzed using SPSS version 25.0 for Windows (IBM, Jakarta, Indonesia). In this study, the sample size for each group (diabetic retinopathy and no diabetic retinopathy) was calculated to be 40 participants, based on a power analysis that considered several key statistical parameters and the anticipated effect size for the primary outcome variable, sorbitol dehydrogenase (SDH) levels. Therefore, a sample size of 40 participants in each group was determined to be necessary to achieve a statistical power of 80% at a significance level of 0.05, allowing the study to have a high probability of detecting a true and clinically relevant difference in SDH levels between individuals with and without diabetic retinopathy.
Descriptive statistics were used to summarize the characteristics of the study participants and the levels of epigenetic markers and SDH activity. The normality of the data was assessed using the Kolmogorov–Smirnov test. Differences between the DR and non-DR groups were analyzed using the Mann–Whitney U-test or the independent t-test, as appropriate. Spearman correlation coefficient was used to assess the correlation between epigenetic markers and SDH activity. Multiple linear regression analysis was performed to evaluate the combined effect of DNA methylation, histone acetylation, and microRNA-320 on SDH activity. A p-value of less than 0.05 was considered statistically significant.
Results
Table 1 provide a descriptive overview of the baseline characteristics of the participants in both the diabetic retinopathy (DR) and non-diabetic retinopathy (non-DR) groups. The table includes information on age, gender, blood pressure and epigenetic markers from each group. Forty DR patients and 40 non-DR patients were included in this study. The mean age of participants in the DR group was 54.3 years, while in the non-DR group it was 56.9 years (p>0.05). The distribution of gender was similar in both groups, with 72.5% females and 27.5% males in each group (p>0.05). No significant difference found in age and gender distribution from each group (Table 1). Overall, Table 1 demonstrates that the DR and non-DR groups were well-matched in terms of age and gender. This enhances the internal validity of the study by minimizing the potential influence of these confounding factors on the primary outcome of interest, the correlation between epigenetic markers and SDH activity.
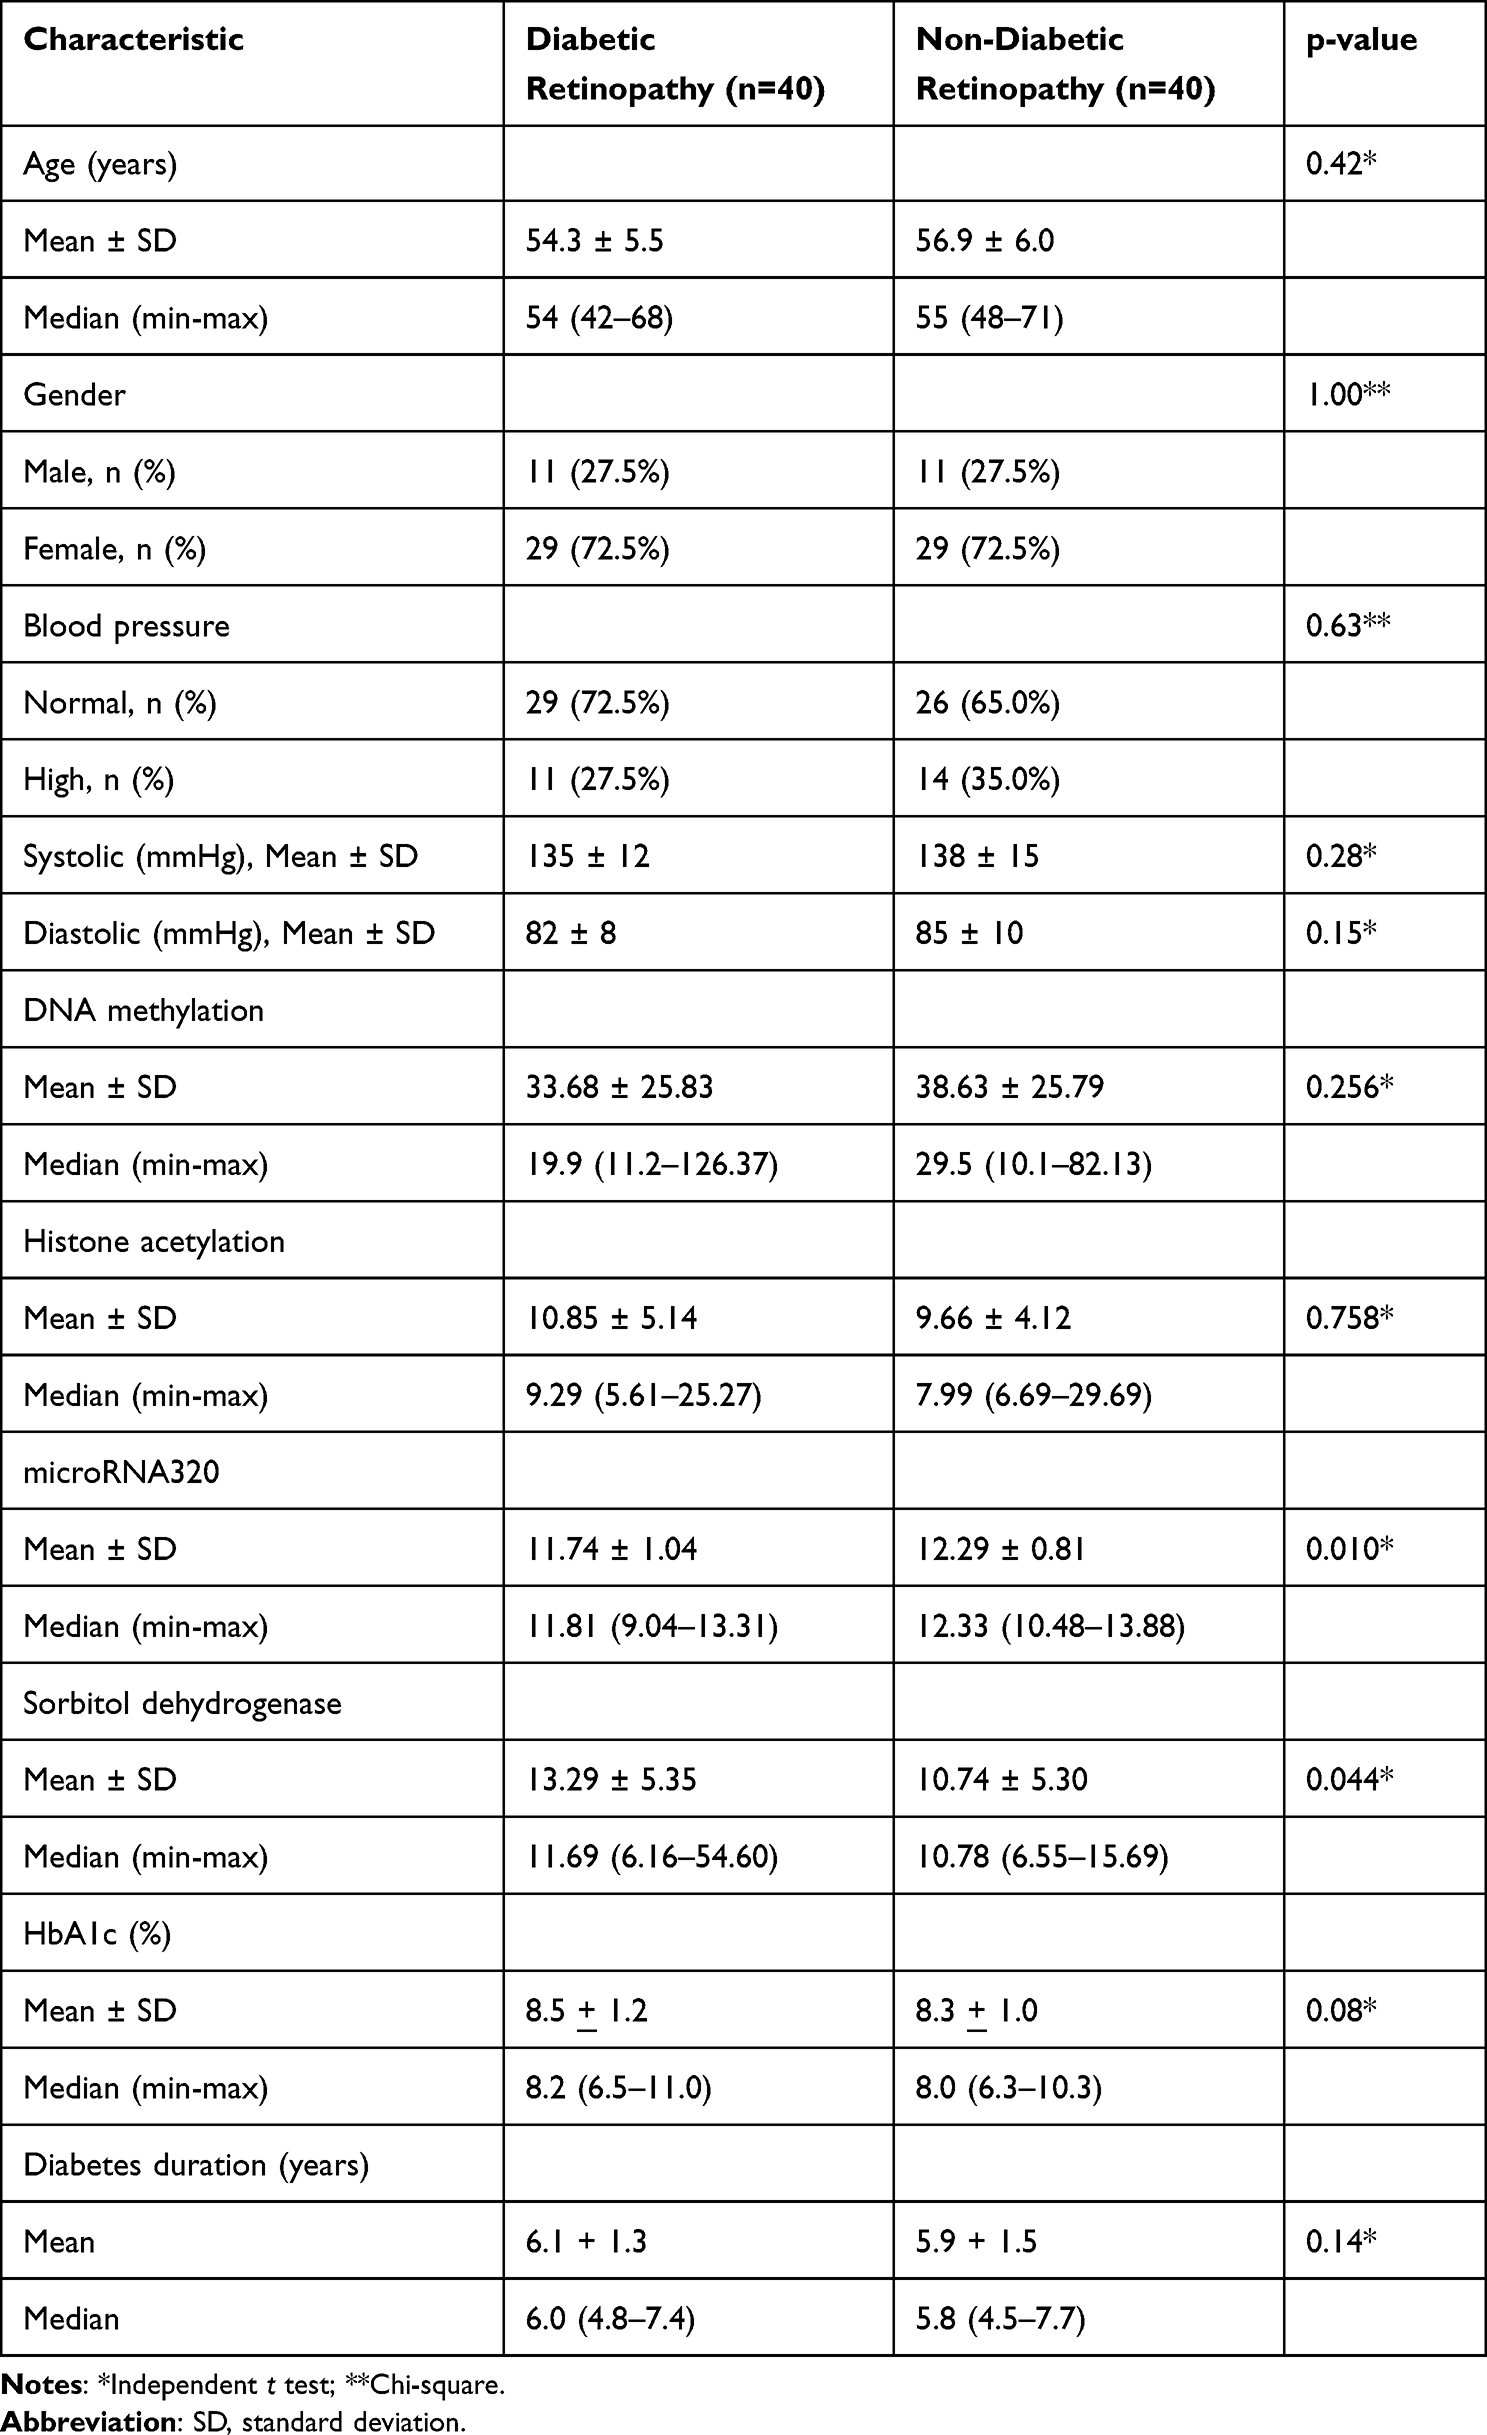 |
Table 1 Participant Characteristics |
Table 2 presents the results of the correlation analysis between the three epigenetic markers (DNA methylation, histone acetylation, and microRNA-320) and SDH enzyme activity in patients with diabetic retinopathy and non-diabetic retinopathy. The Spearman correlation coefficient (r) of 0.153 and the p-value of 0.345 indicate a very weak, non-significant positive correlation between DNA methylation and SDH activity. The correlation analysis reveals a very weak, non-significant negative correlation between histone acetylation and SDH activity (r = −0.139, p = 0.393). This suggests that DNA methylation and histone acetylation levels do not significantly influence SDH activity in diabetic retinopathy patients. The correlation analysis between epigenetic markers in non-DR patients also do not significantly associated with SDH activity. A strong negative correlation is observed between microRNA-320 levels and SDH activity (r = −0.968, p = 0.000). This highly significant correlation suggests that microRNA-320 plays a crucial role in regulating SDH activity. The negative correlation indicates that as microRNA-320 levels decrease, SDH activity increases, potentially contributing to the pathogenesis of diabetic retinopathy. The findings emphasize the potential importance of microRNA-320 as a therapeutic target for modulating SDH activity and mitigating the detrimental effects of the polyol pathway in diabetic retinopathy.
 |
Table 2 Epigenetic Markers and SDH Activity in Diabetic Retinopathy and Non-Diabetic Retinopathy Patients |
Figures 1A–C and 2A–C visually depicts the relationships between three epigenetic markers (DNA methylation, histone acetylation, and microRNA-320) and the activity of the sorbitol dehydrogenase (SDH) enzyme in patients diagnosed with diabetic retinopathy and non-diabetic retinopathy. Each scatter plot represents the correlation between one of the epigenetic markers and SDH activity, along with the corresponding Spearman correlation coefficient (r) and p-value. The plot shows a scattered distribution of points, suggesting a weak or no correlation. The calculated Spearman correlation coefficient (r = 0.153) and the high p-value (p = 0.345) confirm this, indicating no statistically significant association between DNA methylation levels and SDH activity in these patients. In simpler terms, changes in DNA methylation do not appear to directly influence the activity of the SDH enzyme in this context. Similar to the first plot, the points are scattered without a clear trend. The Spearman correlation coefficient (r = −0.139) is negative but very close to zero, and the p-value is again high (p = 0.393). This suggests that histone acetylation levels also do not have a statistically significant impact on SDH activity in diabetic retinopathy patients. In contrast to the previous two plots, this one shows a clear downward sloping trend, indicating a strong negative correlation. The high negative Spearman correlation coefficient (r = −0.968) and the very low p-value (p = 0.000) confirm a statistically significant and strong inverse relationship. This suggests that as the levels of microRNA-320 decrease, the activity of the SDH enzyme increases in these patients. This finding highlights a potential regulatory role of microRNA-320 in SDH activity, which could be relevant to the development or progression of diabetic retinopathy.
 |
Figure 1 Scatter plot correlation DNA methylation, histone acetylation, MicroRNA-320 and sorbitol dehydrogenase (SDH) in diabetic retinopathy patients; (A) Correlation between DNA methylation and SDH activity in DR patients; (B) Correlation between histone acetylation and SDH activity in DR patients; (C) Correlation between microRNA-320 and SDH activity in DR patients. |
 |
Figure 2 Scatter plot correlation epigenetic markers and SDH activity in non-diabetic retinopathy (non-DR) patients; (A) Correlation between microRNA-320 and SDH activity in non-DR patients. (B) Correlation between DNA methylation and SDH activity in non-DR patients; (C) Correlation between histone acetylation and SDH activity in non-DR patients. |
Table 3 displays the results of the multivariate analysis, which aimed to assess the combined influence of DNA methylation, histone acetylation, and microRNA-320 on SDH activity in diabetic retinopathy patients. The table presents the unstandardized and standardized coefficients (B and Beta, respectively), along with their 95% confidence intervals, t-values, and p-values for each predictor. The R-squared value for the model is also provided. The coefficient (B) for DNA methylation is 0.031, with a p-value of 0.359. This indicates that DNA methylation is not a statistically significant predictor of SDH activity in this model. The 95% confidence interval for the coefficient (−0.037 to 0.100) includes zero, further supporting the lack of a significant association. The standardized coefficient (Beta) of 0.104 also suggests a weak effect size. The coefficient for histone acetylation is −0.028, with a p-value of 0.871. This demonstrates that histone acetylation is also not a statistically significant predictor of SDH activity. The 95% confidence interval (−0.371 to 0.315) includes zero, and the standardized coefficient (Beta) of −0.018 indicates a negligible effect size. The coefficient for microRNA-320 is −5.440, with a p-value of 0.000. This reveals a statistically significant and strong negative association between microRNA-320 and SDH activity. The 95% confidence interval (−7.181 to −3.699) does not include zero, and the standardized coefficient (Beta) of −0.727 suggests a substantial effect size. This confirms the findings from the bivariate analysis, indicating that microRNA-320 is a significant predictor of SDH activity, with lower levels of microRNA-320 associated with higher SDH activity. The R-squared value of 0.581 signifies that the three predictors (DNA methylation, histone acetylation, and microRNA-320) together explain 58.1% of the variance in SDH activity. This suggests that while microRNA-320 is a strong predictor, other factors not included in the model may also contribute to SDH activity in diabetic retinopathy patients. Overall, Table 3 underscores the pivotal role of microRNA-320 in regulating SDH activity in the context of diabetic retinopathy. The multivariate analysis confirms the strong negative association between microRNA-320 and SDH, while also highlighting the lack of significant associations for DNA methylation and histone acetylation. In the context of DR, microRNA-320 has been shown to exert a protective effect by modulating the expression of key genes involved in the polyol pathway, inflammation, and angiogenesis. The downregulation of microRNA-320 observed in DR disrupts this delicate balance, leading to increased expression of its target genes. One such target gene is SDH, the enzyme responsible for converting sorbitol to fructose in the polyol pathway. The increased SDH activity resulting from microRNA-320 downregulation accelerates the flux through the polyol pathway, leading to the accumulation of sorbitol and fructose within retinal cells. This accumulation exacerbates osmotic stress, oxidative stress, and the generation of AGEs, ultimately contributing to retinal microvascular damage. The loss of pericytes, the contractile cells that support the integrity of capillaries, is a hallmark of early DR and is thought to be mediated, in part, by the detrimental effects of the polyol pathway. The loss of pericytes leads to capillary instability, microaneurysm formation, and breakdown of the blood-retinal barrier, resulting in vascular leakage, edema, and hemorrhage.
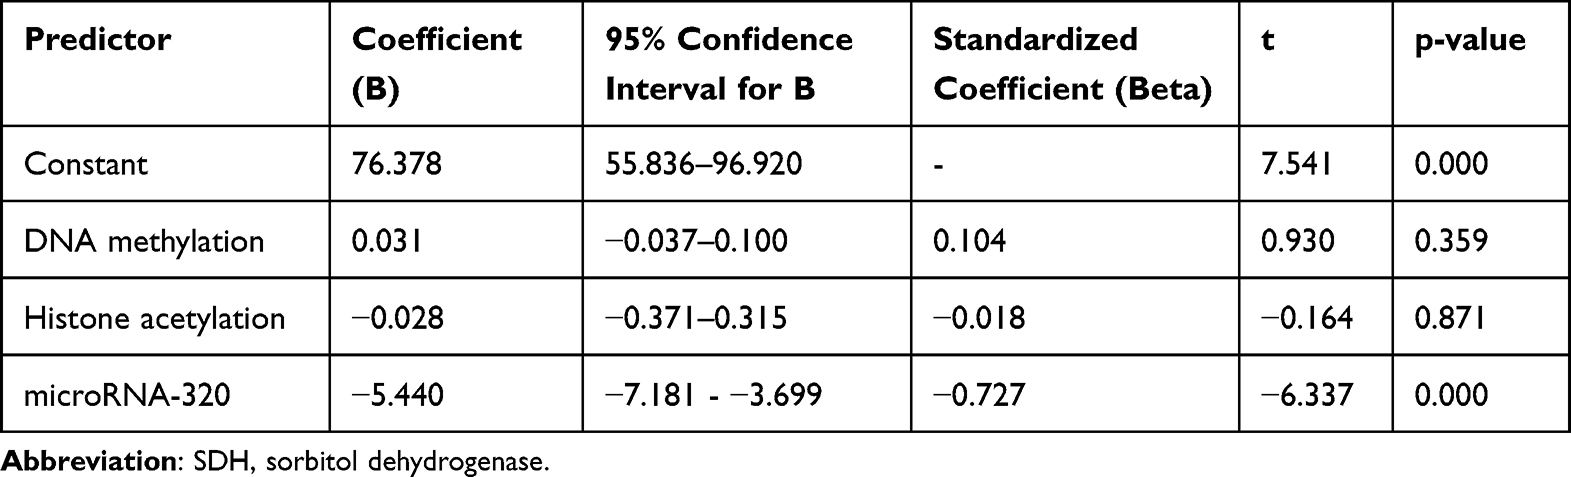 |
Table 3 Multivariate Analysis: Predictors of SDH Activity in Diabetic Retinopathy Patients |
The regression equation represents the results of the multivariate analysis, which aimed to assess the combined influence of DNA methylation, histone acetylation, and microRNA-320 on SDH activity in diabetic retinopathy patients. The equation is as follows:
is a statistical model that quantifies the relationship between the activity of the sorbitol dehydrogenase (SDH) enzyme and three epigenetic markers: DNA methylation, histone acetylation, and microRNA-320. SDH represents the activity of the SDH enzyme; 76.378: This is the intercept of the equation. It’s the predicted value of SDH activity when all the predictor variables (DNA methylation, histone acetylation, and microRNA-320) are zero. In practical terms, it may not have a direct biological interpretation, but it’s a necessary part of the model. 0.031(DNA methylation): This term represents the effect of DNA methylation on SDH activity. The coefficient 0.031 indicates that for every one-unit increase in DNA methylation, SDH activity is predicted to increase by 0.031 units, assuming the other two markers remain constant. The positive sign suggests a positive relationship, but as we know from the p-value, this relationship is not statistically significant. −0.028(histone acetylation): Similarly, this term shows the effect of histone acetylation on SDH activity. The coefficient −0.028 suggests that for every one-unit increase in histone acetylation, SDH activity is predicted to decrease by 0.028 units. The coefficient −5.440 indicates that for every one-unit increase in microRNA-320, SDH activity is predicted to decrease by 5.440 units. The negative sign and the low p-value confirm a strong, statistically significant inverse relationship between microRNA-320 and SDH activity. In essence, this equation shows that microRNA-320 is the only significant predictor of SDH activity among the three epigenetic markers examined. Higher levels of microRNA-320 are associated with lower SDH activity, and vice-versa. The R-squared value shows 58.1% of the variability observed in SDH activity. The remaining variability is likely due to other factors that were not included in this analysis. This model provides valuable insights into the potential role of microRNA-320 in the pathogenesis of diabetic retinopathy.
Discussion
The findings of this study provide novel insights into the epigenetic regulation of SDH in DR. The significant negative correlation between microRNA-320 levels and SDH enzyme activity suggests that microRNA-320 plays a crucial role in modulating SDH expression in patients with type 2 diabetes and DR. MicroRNA-320 has emerged as a key player in the pathogenesis of diabetic retinopathy (DR), a leading cause of blindness in adults.19
Studies have shown that microRNA-320a, a member of the microRNA-320 family, is downregulated in the retinas of diabetic animals and that its overexpression can attenuate retinal vascular leakage and inflammation.12,13 Furthermore, microRNA-320a has been shown to target VEGF, a potent angiogenic factor that plays a central role in the development of DR. By inhibiting VEGF expression, microRNA-320a may suppress angiogenesis and neovascularization, two pathological processes that contribute to vision loss in DR.14,20,21 These findings suggest that microRNA-320a may exert a protective effect against DR by modulating the expression of key genes involved in inflammation and angiogenesis. The downregulation of microRNA-320a in DR may lead to increased expression of these genes, contributing to the progression of the disease and lead to increased VEGF expression, promoting the growth of new blood vessels. These new vessels, however, are often fragile and leaky, leading to further hemorrhage and vision loss.21
The pathogenesis of DR is a complex interplay of metabolic, hemodynamic, and inflammatory pathways triggered by chronic hyperglycemia. In recent years, epigenetic mechanisms, including microRNAs, have emerged as crucial regulators of gene expression in DR. MiR-320, a small non-coding RNA molecule, has garnered significant attention due to its potential protective role in this disease. Several studies have investigated the role of miR-320 in DR, providing compelling evidence for its protective function.12,22 The downregulation of miR-320a in diabetes may contribute to the breakdown of the blood-retinal barrier and the subsequent development of retinal edema, a major cause of vision loss in DR.12 The ability of miR-320a to attenuate these pathological processes suggests its potential as a therapeutic target for DR. MiR-320 has been shown to regulate the expression of various genes involved in inflammation, oxidative stress, and apoptosis, all of which contribute to retinal damage in DR. For instance, miR-320 has been reported to target and suppress the expression of pro-inflammatory cytokines, such as interleukin-6 (IL-6) and tumor necrosis factor-alpha (TNF-α), thereby mitigating the inflammatory response in DR.12,13,22 Furthermore, miR-320 has been shown to regulate the expression of genes involved in oxidative stress, such as NADPH oxidase 4 (NOX4), protecting retinal cells from oxidative damage.
The polyol pathway, a glucose metabolic shunt, has long been recognized as a key player in the development of diabetic complications, including DR.6 Under normal glycemic conditions, only a small fraction of glucose is metabolized through this pathway. However, in the setting of chronic hyperglycemia, as seen in diabetes, excess glucose flux into the polyol pathway leads to a series of deleterious consequences. The first step in the polyol pathway involves the reduction of glucose to sorbitol, catalyzed by the enzyme aldose reductase (AR).7 Sorbitol, a sugar alcohol, is then further metabolized to fructose by sorbitol dehydrogenase (SDH). The accumulation of sorbitol and fructose within retinal cells, particularly those with limited or no sorbitol dehydrogenase activity, such as lens, retina, Schwann cells of peripheral nerves, and glomeruli of the kidney, sets in motion a cascade of pathological events. The osmotic stress induced by sorbitol and fructose accumulation leads to cellular swelling and dysfunction. The increased flux through the polyol pathway also depletes the cellular pool of NADPH, a crucial cofactor for antioxidant enzymes. This depletion impairs the cellular antioxidant defense mechanisms, rendering the retina vulnerable to oxidative stress. Furthermore, the metabolism of glucose through the polyol pathway generates reactive oxygen species (ROS), further exacerbating oxidative stress.23,24 Oxidative stress triggers a cascade of damaging events, including lipid peroxidation, protein oxidation, and DNA damage. These events can lead to cellular dysfunction, apoptosis, and inflammation, all of which contribute to the microvascular damage observed in DR. The accumulation of advanced glycation end products (AGEs), formed by the non-enzymatic glycation of proteins in the presence of high glucose levels, further amplifies the inflammatory response and promotes microvascular dysfunction.9
Epigenetic regulation is a dynamic and intricate process involving multiple layers of control.16 The interplay between DNA methylation, histone modifications, and non-coding RNAs creates a complex regulatory landscape that governs gene expression. The study focused on global levels of DNA methylation and histone acetylation, which may not fully capture the complexity of epigenetic regulation at specific gene loci. Site-specific epigenetic modifications, such as methylation or acetylation of specific CpG sites or histone residues within the SDH gene promoter or enhancer regions, could potentially influence SDH expression without affecting global levels.22 The absence of a significant correlation between global DNA methylation or histone acetylation and SDH activity does not necessarily rule out the involvement of these mechanisms in SDH regulation. However, previous study stated that epigenetic DNA methylation is associated with microvascular diabetes complication, including diabetic retinopathy.25 Future studies employing techniques such as chromatin immunoprecipitation (ChIP) or bisulfite sequencing, which allow for the assessment of site-specific epigenetic modifications, may reveal more subtle but crucial regulatory roles for DNA methylation and histone acetylation in SDH expression in DR. Epigenetic modifications are dynamic and can change in response to various environmental and metabolic cues. The cross-sectional design of the study provides a snapshot of epigenetic markers and SDH activity at a single point in time. It is possible that the observed lack of correlation between DNA methylation or histone acetylation and SDH activity reflects a transient state or a compensatory mechanism. Longitudinal studies that track changes in epigenetic markers and SDH activity over time in patients with diabetes, both with and without DR, would provide a more comprehensive understanding of the temporal dynamics of epigenetic regulation in DR pathogenesis.
Epigenetic mechanisms do not operate in isolation but rather interact with each other and with other regulatory factors to control gene expression. The study focused on three specific epigenetic markers, but other mechanisms, such as chromatin remodeling, histone variants, and long non-coding RNAs, could also contribute to SDH regulation in DR. The observed negative correlation between microRNA-320 and SDH activity may be part of a larger epigenetic network that involves other regulatory factors. Future studies should adopt a more integrative approach to investigate the complex interplay between various epigenetic mechanisms and their combined effect on SDH expression in DR.
Epigenetic modifications can vary between different cell types and tissues. The study analyzed epigenetic markers in blood samples, which may not fully reflect the epigenetic landscape in the retina, the primary site of DR pathology. Studies that directly examine epigenetic modifications in retinal tissue from patients with DR would provide more relevant insights into the role of these mechanisms in SDH regulation and disease pathogenesis. Despite the careful matching of the DR and non-DR groups in terms of age, gender, and blood pressure, other confounding factors may still influence the relationship between epigenetic markers and SDH activity.12,13 These could include factors such as duration of diabetes, glycemic control, other diabetes complications, medications, and lifestyle factors. Epigenetic changes are not like inherited genetic differences that stay the same throughout life. Instead, they are dynamic and change depending on the type of tissue and the presence of disease. However, once they are established, these changes can be fairly stable.26 Future studies should consider adjusting for these potential confounders in their analyses to obtain more accurate estimates of the associations between epigenetic markers and SDH activity.
The study primarily focused on correlational analyses between epigenetic markers and SDH activity. While these findings suggest a potential regulatory role for microRNA-320 in SDH expression, functional studies are needed to establish a causal relationship. Experimental manipulation of microRNA-320 levels in vitro or in vivo, followed by assessment of SDH activity and DR-related phenotypes, would provide more definitive evidence for its role in DR pathogenesis. The identification of microRNA-320 as a key regulator of SDH activity in DR has important clinical implications. It suggests that microRNA-320 may serve as a potential therapeutic target for preventing or delaying the progression of DR. The development of microRNA-320-based therapies, such as miRNA mimics or antagomirs, may offer a novel approach to modulating SDH activity and mitigating the detrimental effects of the polyol pathway in DR. Presently, epigenetic modification drugs functioning as DNMT inhibitors, including 5-azacytidine and 5-aza-2ʹ-deoxycytidine, have been utilized in the treatment of diabetic retinopathy. It is these DNAMT inhibitors that stop the genes that do the methylation of superoxide dismutase 2 (SOD2) and matrix metallopeptidase 9 (MMP-9). Conventional drug therapy with metformin has epigenetic effects on type 2 diabetes mellitus (T2DM) and improves disease outcomes when used with epigenetic agents like DNAMT and HDAC inhibitors. This suggests that epigenetic therapy could be a useful addition to drug therapy.27
This study has limitations, specifically a small sample size and it was conducted at a single center. Further investigation using larger sample sizes and multicenters is essential to enhance the validity and dependability of the findings. Further research is needed to explore the feasibility and efficacy of such therapeutic strategies.
Conclusion
This study demonstrates a significant negative correlation between microRNA-320 levels and SDH enzyme activity in patients with type 2 diabetes and DR. The findings suggest that microRNA-320 plays a crucial role in regulating SDH expression in DR and may serve as a potential therapeutic target for preventing or delaying the progression of DR. The study also highlights the importance of considering epigenetic mechanisms in the pathogenesis of DR and the need for further research to elucidate the complex interplay between genetic and epigenetic factors in this disease. Future research also should investigate the efficacy of epigenetic modification agents in the treatment of diabetic retinopathy, particularly focusing on miRNA-320a and its association with sorbitol dehydrogenase.
Acknowledgments
We thank to Dr Mohammad Hoesin General Hospital, Palembang, Indonesia for its contribution to this study, especially the dedicated participants and all research staff involved in this study.
Disclosure
The authors report no conflicts of interest in this work.
References
1. Sun L, Liu X, Zuo Z. Regulatory role of miRNA-23a in diabetic retinopathy. Exp Ther Med. 2021;22(6):1477. doi:10.3892/etm.2021.10912
2. Teo ZL, Tham Y-C, Yu M, et al. Global prevalence of diabetic retinopathy and projection of burden through 2045: systematic review and meta-analysis. Ophthalmol. 2021;128(11):1580–1591. doi:10.1016/j.ophtha.2021.04.027
3. Kropp M, Golubnitschaja O, Mazurakova A, et al. Diabetic retinopathy as the leading cause of blindness and early predictor of cascading complications-risk and mitigation. EPMA J. 2023;14(1):21–42. doi:10.1007/s13167-023-00314-8
4. Sivaprasad S, Sahasranamam VI, George S, et al. Burden of diabetic retinopathy amongst people with diabetes attending primary care in Kerala: nayanamritham project. J Clin Med. 2021;10(24):5903. doi:10.3390/jcm10245903
5. Li M, Tian M, Wang Y, et al. Updates on RPE cell damage in diabetic retinopathy (review). Mol Med Rep. 2023;28(4):185. doi:10.3892/mmr.2023.13072
6. Li W, Chen S, Mei Z, et al. Polymorphisms in sorbitol-aldose reductase (polyol) pathway genes and their influence on risk of diabetic retinopathy among Han Chinese. Med Sci Monit. 2019;25:7073–7078. doi:10.12659/MSM.917011
7. Yan L-J. Redox imbalance stress in diabetes mellitus: role of the polyol pathway. Animal Model Exp Med. 2018;1(1):7–13. doi:10.1002/ame2.12001
8. Amin R, Indiarsih TB, Sari PM, et al. Anti-RAGE (receptor advanced glycation end products) antibody improves diabetic retinopathy in rats via hypoglycemic and anti-inflammatory mechanism. Rep Biochem Mol Biol. 2022;11(3):394–399. doi:10.52547/rbmb.11.3.394
9. Duraisamy AJ, Mishra M, Kowluru A, et al. Epigenetics and regulation of oxidative stress in diabetic retinopathy. Invest Ophthalmol Vis Sci. 2018;59(12):4831–4840. doi:10.1167/iovs.18-24548
10. Kowluru RA, Mohammad G. Epigenetics and mitochondrial stability in the metabolic memory phenomenon associated with continues progression of diabetic retinopathy. Sci Rep. 2020;10(1):6655. doi:10.1038/s41598-020-63527-1
11. Liang Z, Gao KP, Wang YX, et al. RNA sequencing identified specific circulating miRNA biomarkers for early detection of diabetes retinopathy. Am J Physiol Endocrinol Metab. 2018;315(3):E374–E385. doi:10.1152/ajpendo.00021.2018
12. Prado MSG, Jesus ML, Goes TC, et al. Downregulation of circulating miR-320a and target gene prediction in patients with diabetic retinopathy. BMC Res Notes. 2020;13(1):155. doi:10.1186/s13104-020-05001-9
13. Smit-McBride Z, Morse LS. MicroRNA and diabetic retinopathy-biomarkers and novel therapeutics. Ann Transl Med. 2021;9(15):1280. doi:10.21037/atm-20-5189
14. Luo Y, Li C. Advances in research related to microRNA for diabetic retinopathy. J Diabetes Res. 2024;2024(1):8520489. doi:10.1155/2024/8520489
15. Liu C-H, Huang S, Britton WR, et al. MicroRNAs in vascular eye diseases. Int J Mol Sci. 2020;21(2):649. doi:10.3390/ijms21020649
16. Liu -D-D, Zhang C-Y, Zhang J-T, et al. Epigenetic modifications and metabolic memory in diabetic retinopathy. Neural Regen Res. 2023;18(7):1441–1449. doi:10.4103/1673-5374.361536
17. Kern BC, Podkrajsek KT, Kovac J, et al. The role of epigenetic modifications in late complications in type 1 diabetes. Genes. 2022;13(4):705. doi:10.3390/genes13040705
18. Kowluru RA, Mohammad G. Epigenetic modifications in diabetes. Metabolism. 2021;126:154920. doi:10.1016/j.metabol.2021.154920
19. Santovito D, Toto L, Nardis VD, et al. Plasma microRNA signature associated with retinopathy in patients with type 2 diabetes. Sci Rep. 2021;11(1):4136. doi:10.1038/s41598-021-83047-w
20. Mahajan N, Arora P, Sandhir R. Perturbed biochemical pathways and associated oxidative stress lead to vascular dysfunctions in diabetic retinopathy. Oxid Med Cell Longev. 2019;2019:8458472. doi:10.1155/2019/8458472
21. Simo-Servat O, Hernandez C, Simo R. Pathogenesis aspect of microvascular complications in diabetic retinopathy: narrative literature review. Archives Med Case Rep. 2022;3(2):267–271. doi:10.37275/amcr.v3i2.197
22. Zhao X, Ling F, Zhang GW, et al. The correlation between microRNAs and diabetic retinopathy. Front Immunol. 2022;13:941982. doi:10.3389/fimmu.2022.941982
23. Singh M, Kapoor A, Bhatnagar A. Physiological and pathological roles of aldose reductase. Metabolites. 2021;11(10):655. doi:10.3390/metabo11100655
24. Danilla A-I, Ghenciu LA, Stoicescu ER, et al. Aldose reductase as a key target in the prevention and treatment of diabetic retinopathy: a comprehensive review. Biomedicines. 2024;12(4):747. doi:10.3390/biomedicines12040747
25. Chen Z, Miao F, Paterson AD, et al. Epigenomic profiling reveals an association between persistence of DNA methylation and metabolic memory in the DCCT/EDIC type 1 diabetes cohort. Proc Natl Acad Sci U S A. 2016;113(21):E3002–E3011. doi:10.1073/pnas.1603712113
26. Kowluru RA, Kowluru A, Mishra M, et al. Oxidative stress and epigenetic modifications in the pathogenesis of diabetic retinopathy. Prog Retin Eye Res. 2015;48:40–61. doi:10.1016/j.preteyeres.2015.05.001
27. Odimegwu CL, Uwaezuoke SN, Chikani UN, et al. Targeting the epigenetic marks in type 2 diabetes mellitus: will epigenetic therapy be a valuable adjunct to pharmacotherapy? Diabetes Met Synd Obes. 2024;2024(17):3557–3576. doi:10.2147/DMSO.S479077
 © 2025 The Author(s). This work is published and licensed by Dove Medical Press Limited. The
full terms of this license are available at https://www.dovepress.com/terms
and incorporate the Creative Commons Attribution
- Non Commercial (unported, 4.0) License.
By accessing the work you hereby accept the Terms. Non-commercial uses of the work are permitted
without any further permission from Dove Medical Press Limited, provided the work is properly
attributed. For permission for commercial use of this work, please see paragraphs 4.2 and 5 of our Terms.
© 2025 The Author(s). This work is published and licensed by Dove Medical Press Limited. The
full terms of this license are available at https://www.dovepress.com/terms
and incorporate the Creative Commons Attribution
- Non Commercial (unported, 4.0) License.
By accessing the work you hereby accept the Terms. Non-commercial uses of the work are permitted
without any further permission from Dove Medical Press Limited, provided the work is properly
attributed. For permission for commercial use of this work, please see paragraphs 4.2 and 5 of our Terms.