Back to Journals » Infection and Drug Resistance » Volume 19
Epidemiological Characteristics and Spatiotemporal Clustering of Varicella in the Border City of Baise, Southwest China, 2010–2024
Authors Tian H, Liang D ![]() , Nong Z, Huang S, Li Y, Qi G
, Nong Z, Huang S, Li Y, Qi G
Received 17 October 2025
Accepted for publication 6 February 2026
Published 24 February 2026 Volume 2026:19 567936
DOI https://doi.org/10.2147/IDR.S567936
Checked for plagiarism Yes
Review by Single anonymous peer review
Peer reviewer comments 3
Editor who approved publication: Dr Oliver Planz
Hongyan Tian,1,2,* Danjie Liang,1,* Zhi Nong,2 Siyi Huang,2 Yang Li,1 Guangzi Qi1,3,4
1School of Public Health, Youjiang Medical University for Nationalities, Baise, Guangxi, People’s Republic of China; 2Department of Disease Control, Baise Centre for Disease Control and Prevention, Baise, Guangxi, People’s Republic of China; 3Key Laboratory of Environmental and Population Health Research, Ecological Aluminum Industrial Base of Guangxi Universities, Baise, Guangxi, People’s Republic of China; 4Key Laboratory for Environmental Pollution and Health Risk Assessment, Youjiang Medical University for Nationalities, Baise, Guangxi, People’s Republic of China
*These authors contributed equally to this work
Correspondence: Yang Li, School of Public Health, Youjiang Medical University for Nationalities, Baise, Guangxi, People’s Republic of China, Email [email protected] Guangzi Qi, School of Public Health, Youjiang Medical University for Nationalities, Baise, Guangxi, People’s Republic of China, Email [email protected]
Objective: We analyzed the epidemiological trends and spatio-temporal distribution characteristics of varicella incidence in Baise City from 2010 to 2024 to provide a basis for its prevention and control.
Methods: This study describes the epidemiological characteristics of varicella from population, temporal and spatial perspectives by using data from the National Infectious Disease Reporting System. Trend and spatial autocorrelation analyses and spatiotemporal scanning statistics were employed to determine the spatial clustering and spatiotemporal dynamics for the incidence of varicella.
Results: About 54,969 cases of varicella were reported during the study period, with an annual incidence rate of 102.30 per 100,000, and an annual percentage change of 10.05% (95% CI: 1.10% to 19.79%; P = 0.027). The male-to-female ratio was 1.23:1, with the peak incidence occurring among in the 5– 9 age group and the 10– 19 age group showed an upward trend in incidence. People under 20 years old had the highest incidence rates of varicella and students accounted for more than half of the cases (55.46%), and 45.19% of townships had an average annual incidence rate exceeding the city’s average level. There was a Positive spatial autocorrelation was observed in the varicella incidence across different townships, with a pattern of high-value clustering. Local spatial autocorrelation analysis identified a total of 117 hot spots. Spatiotemporal scanning identified five significant clusters, these included a Most likely cluster of 27 towns in the Youjiang River Valley and secondary clusters in the northwestern mountainous regions of Baise.
Conclusion: The reported incidence rate of varicella in Baise was on the rise, exhibiting distinct spatio-temporal clustering characteristics. Hotspots were aligned with the spatio-temporal clustering zones. Strengthening prevention and control measures in local areas where clusters and hotspots of varicella occur can be an effective strategy to decrease its incidence in a city.
Keywords: varicella, epidemiological characteristics, epidemic trends, spatial autocorrelation, spatiotemporal clustering
Introduction
Varicella (chickenpox) is an acute infectious disease caused by the varicella-zoster virus (VZV) and it is primarily transmitted through respiratory droplets and direct contact.1 The disease is widespread globally, with developing countries that tend to have low vaccination coverage, bearing a heavier disease burden.2,3 According to data from the World Health Organization (WHO), there are approximately 140 million cases of varicella worldwide each year, with approximately 4.2 million patients developing severe complications.4 Due to its tendency to break out in collective settings such as childcare facilities and schools,5 it has become an important public health issue threatening the health of children and adolescents.6 In China, although varicella has not been included in the list of legally notifiable infectious diseases, it has been incorporated into the infectious disease surveillance system for routine monitoring since 2005,7 and some provinces have classified it as a Category C infectious disease for enhanced surveillance.8 Due to multiple factors such as regional economic development levels, vaccination strategies and population immunity status, the incidence of varicella in China exhibits significant spatial and temporal heterogeneity, with notable differences in prevention and control effectiveness across different regions.9 In Baise, Guangxi, the varicella vaccine is currently not included in the National Immunization Program and remains voluntary and self-paid. While the out-of-pocket costs pose a significant barrier for many families—particularly those in socio-economically disadvantaged groups or remote border regions. This voluntary status often results in lower vaccination coverage compared to routine mandatory vaccines. Current research on varicella in China primarily focuses on national-level and the eastern developed regions, with limited systematic studies on the long-term spatial and temporal evolution patterns in the border areas of Guangxi, which is inhabited by ethnic minorities. Given the high reported incidence rate, rapid growth and frequent outbreaks of varicella in Guangxi,10,11 Baise—the region’s largest city situated along the Sino-Vietnamese border—presents a critical yet challenging focal point for public health intervention. As a strategic multi-ethnic hub for the Zhuang, Yao, Miao, Yi, Gelao, and Hui peoples, Baise possesses a complex socio-ecological landscape. The interplay of unique cultural customs, diverse geographical environments, and language barriers has posed significant hurdles to the prevention and control of infectious diseases. In recent years, spatio-temporal epidemiological methods have demonstrated significant value in identifying infectious disease hotspots and analyzing transmission mechanisms.12 Given that varicella transmission exhibits typical spatio-temporal clustering characteristics and its epidemic process is closely associated with factors such as population density, climatic conditions and vaccination coverage.13 This study employed spatio-temporal epidemiological methods to conduct a systematic analysis based on varicella surveillance data from Baise between 2010 and 2024, aiming to provide scientific evidence for optimizing regional prevention and control strategies.
Material and Methods
Data Sources
Data on varicella cases reported in Baise from 2010 to 2024 were obtained from the China Information System for Disease Control and Prevention (CISDCP). The main variables included gender, age, occupation, date of onset and place of residence. The inclusion criteria for this study were: onset date between January 1, 2010, and December 31, 2024; infectious disease report card review status as “final review completed”; disease name as “varicella” but excluding “shingles”; and exclusion of invalid cards and suspected case reports, resulting in a total of 54,969 cases retained, including those clinically diagnosed and laboratory-confirmed ones. The vaccination histories of the study participants were retrieved by cross-referencing their names and national identification (ID) numbers with the Guangxi Immunization Program Information Management System to obtain the number of doses and the specific dates of vaccination. Population data were gathered from the Basic Information System of CISDCP and the Baise Statistical Yearbook.
Research Methods
Descriptive Analysis
Descriptive epidemiological methods were employed to analyze the distribution of varicella cases reported in Baise from 2010 to 2024, focusing on factors such as age, gender, occupation and region. The annual and monthly incidence rates were calculated and epidemic curves were plotted to reveal the epidemiological characteristics of the disease. We created visual maps to describe the distribution of varicella cases in Baise by linking the incidence rates of varicella in each county (city, district) with geographic information based on administrative division codes. A case information database was established in Excel 2016, and the count data were analyzed using IBM SPSS 24.0 for chi-square tests, with P < 0.05 indicating a significant difference.
Trend Analysis
Trend analysis was performed using Joinpoint Regression Program (Version 5.2.0).14 Annual incidence rates were calculated based on the data collected from January 1st to December 31st of each calendar year to ensure the standardization of annual statistical periods. This study selected a log-linear model with the Annual Percentage Change (APC), Average Annual Percentage Change (AAPC), and their corresponding 95% confidence intervals (CI) were calculated to evaluate temporal trends in incidence. APC was used to assess the trend within a “specific time segment”—an independent observation interval identified by the joinpoints, during which the trend remains relatively consistent. The APC is calculated based on the slope (β) of the log-linear regression model using the formula: 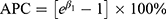 . AAPC provides a summary measure of the overall average change over the entire study period, encompassing multiple segments. It is calculated as a weighted average of the APCs, where the weights (wi) correspond to the length of each time segment:
 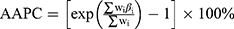 . The “joinpoints” (inflection points) represent the specific years when the trend of varicella incidence significantly changes its slope, as determined by the Monte Carlo permutation test. When the number of joinpoints is 0, APC = AAPC, indicating a monotonic increase (APC > 0) or decrease (APC < 0) in incidence throughout the study period. If joinpoints are present, the APC for each specific segment is described separately.
Spatial Autocorrelation Analysis
Spatial autocorrelation statistics are used to measure the degree of interdependence between the data obtained at a location and the data from neighboring units. They were divided into global spatial and local spatial autocorrelation. Utilizing ArcGIS 10.6, this study conducts the analysis at the township/sub-district level from both global and local dimensions. Global spatial autocorrelation aims to determine the existence of spatial clustering within the study area, identifying the overall distribution characteristics from a macro perspective. First, the Global Moran’s index [−1, 1] is used to measure the average degree of clustering, and its standardized statistic Z(I) is introduced for significance testing. Z(I) > 1.96 (corresponding to P < 0.05) indicates that the spatial distribution exhibits significant positive correlation clustering. Building on this, the Getis-Ord General G and its standardized statistic Z(G) are further applied to distinguish specific clustering patterns: a Z(G) > 1.96 denotes high-value clustering, while a Z(G) < −1.96 denotes low-value clustering. Local spatial autocorrelation is then used for the precise localization of clusters, compensating for the limitations of global analysis in masking local details. By calculating the local G index (Getis-Ord  ) and its corresponding standardized statistic Z(
 ), hot and cold spot areas are identified. A Z(
 ) > 1.96 with P < 0.05 identifies the area as a hot spot (clustering of high values), whereas Z(
 ) < −1.96 with P < 0.05 identifies it as a cold spot (clustering of low values).15
Spatiotemporal Scan Analysis
SaTScan 10.2 software was used to perform spatiotemporal scan analysis by a particular township/street on an annual basis to detect possible spatial clusters of varicella incidence. The Log-Likelihood Ratio (LLR) was employed as the test statistic to evaluate the clustering intensity, calculated by comparing the observed and expected cases inside versus outside the scanning window; a higher LLR indicates a greater probability of clustering. Additionally, Relative Risk (RR) was used to measure the risk within the cluster relative to the risk outside the window. The identified clusters were categorized based on their LLR values: Most likely Cluster (Type I Cluster) represents the region with the highest LLR value, indicating the most probable cluster; Secondary Clusters (Type II Clusters) refer to other significant clusters (P < 0.05) with lower LLR values. The maximum spatial scanning size was set to 30% of the population at risk, and the maximum temporal scanning window was set to 50% of the study period.16,17 Statistical significance was tested using the Monte Carlo method, with P < 0.05 indicating a significant difference.
Results
Overall Overview
A total of 54,969 cases of varicella were reported in Baise from 2010 to 2024 with an average annual incidence rate of 102.30 per 100,000. The incidence rate rose from 25.13 per 100,000 (936 cases) in 2010 to 151.99 per 100,000 (5577 cases) in 2019 when it reached its peak. From 2020 to 2023, the incidence rate fluctuated downward, but increased again in 2024 (151.75 per 100,000, 5325 cases), second only to 2019. There were statistically significant differences in incidence rates between different years (χ2 = 6, 601.206, P < 0.001) (Figure 1).
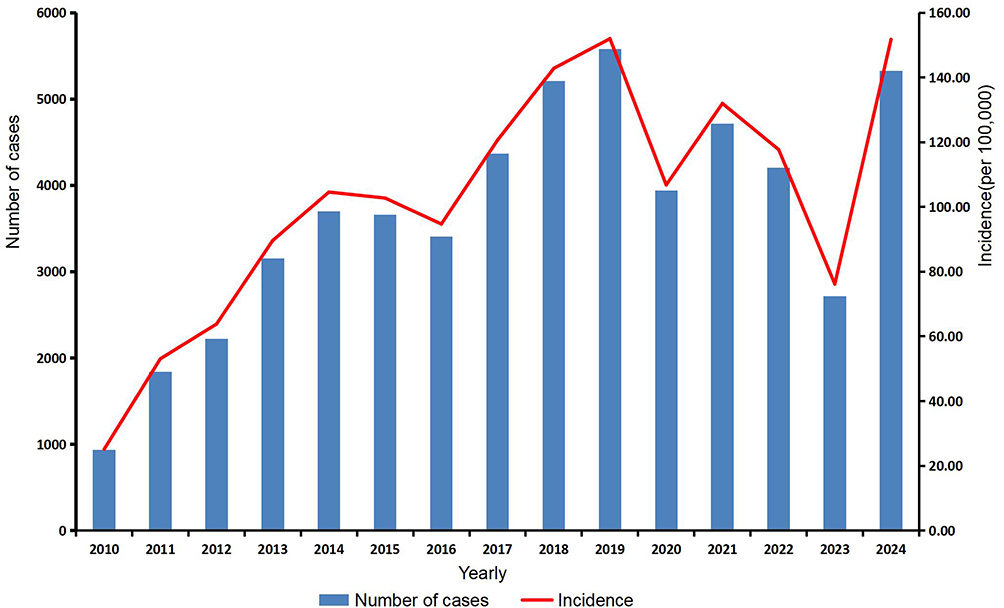 |
Figure 1 Temporal trends in the number of cases and incidence of varicella in Baise from 2010 to 2024. |
Epidemiological Characteristics
Seasonal Distribution
The varicella epidemics exhibited “double peak distributions” with distinct seasonal characteristics with peaks occurring annually in December and June, while the troughs of the epidemic are observed in March and September (Figure 2).
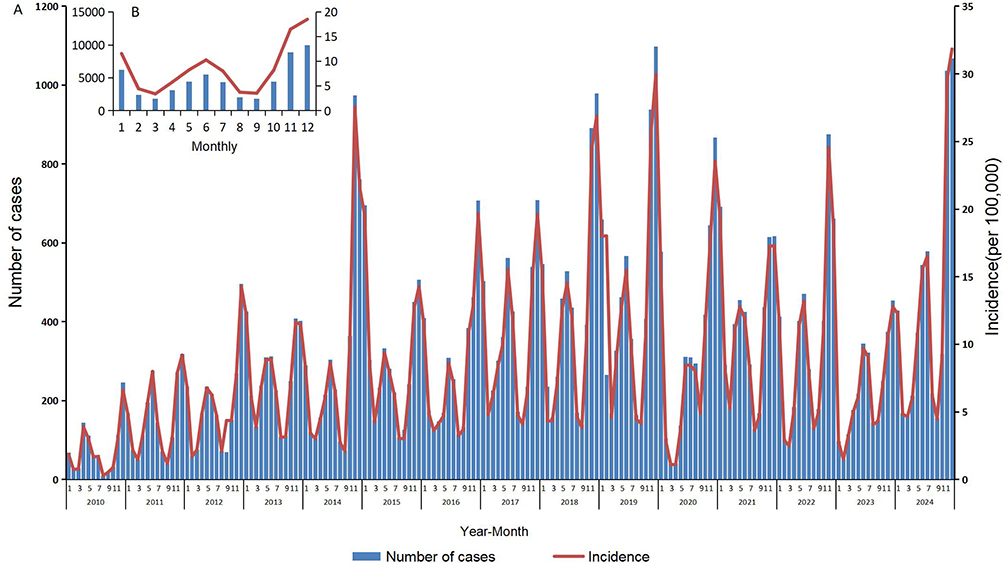 |
Figure 2 Temporal trends of varicella incidence in Baise from 2010 to 2024. (A) Monthly number of cases and incidence over the 15-year period. (B) Aggregated monthly distribution of the total cases and average incidence across all years. |
Population Characteristics
During the study period, a total of 30,330 male cases were reported (accounting for 55.12%, with an annual incidence rate of 109.66 per 100,000) and 24,669 female cases (accounting for 44.88%, with an annual incidence rate of 94.53 per 100,000). The male-to-female ratio was 1.23:1, with statistically significant differences in gender distribution (χ2 = 53.146, P < 0.001). The majority of reported cases were in the under 20 years old age group, accounting for 88.37% (48,575/54,969), with the 5–9 years old age group having the highest proportion at 37.30% (20,503/54,969), followed by the 0–4 years old age group (19.22%, 10,565/54,969), and the 10–14 years old age group (23.36%, 12,842/54,969). The incidence rates showed an increasing trend in the 10–14 years old and 15–19 years old age groups, with significant differences in the composition between different age groups (χ2 = 2992.303, P < 0.001). In terms of occupational distribution, the majority were students, kindergarten children and scattered children, accounting for 87.94% (48,337/54,969), followed by farmers (8.17%), with other occupations accounting for less than 1.00%. There were significant differences in the composition of different occupations (χ2 = 2051.336, P < 0.001) (Table 1).
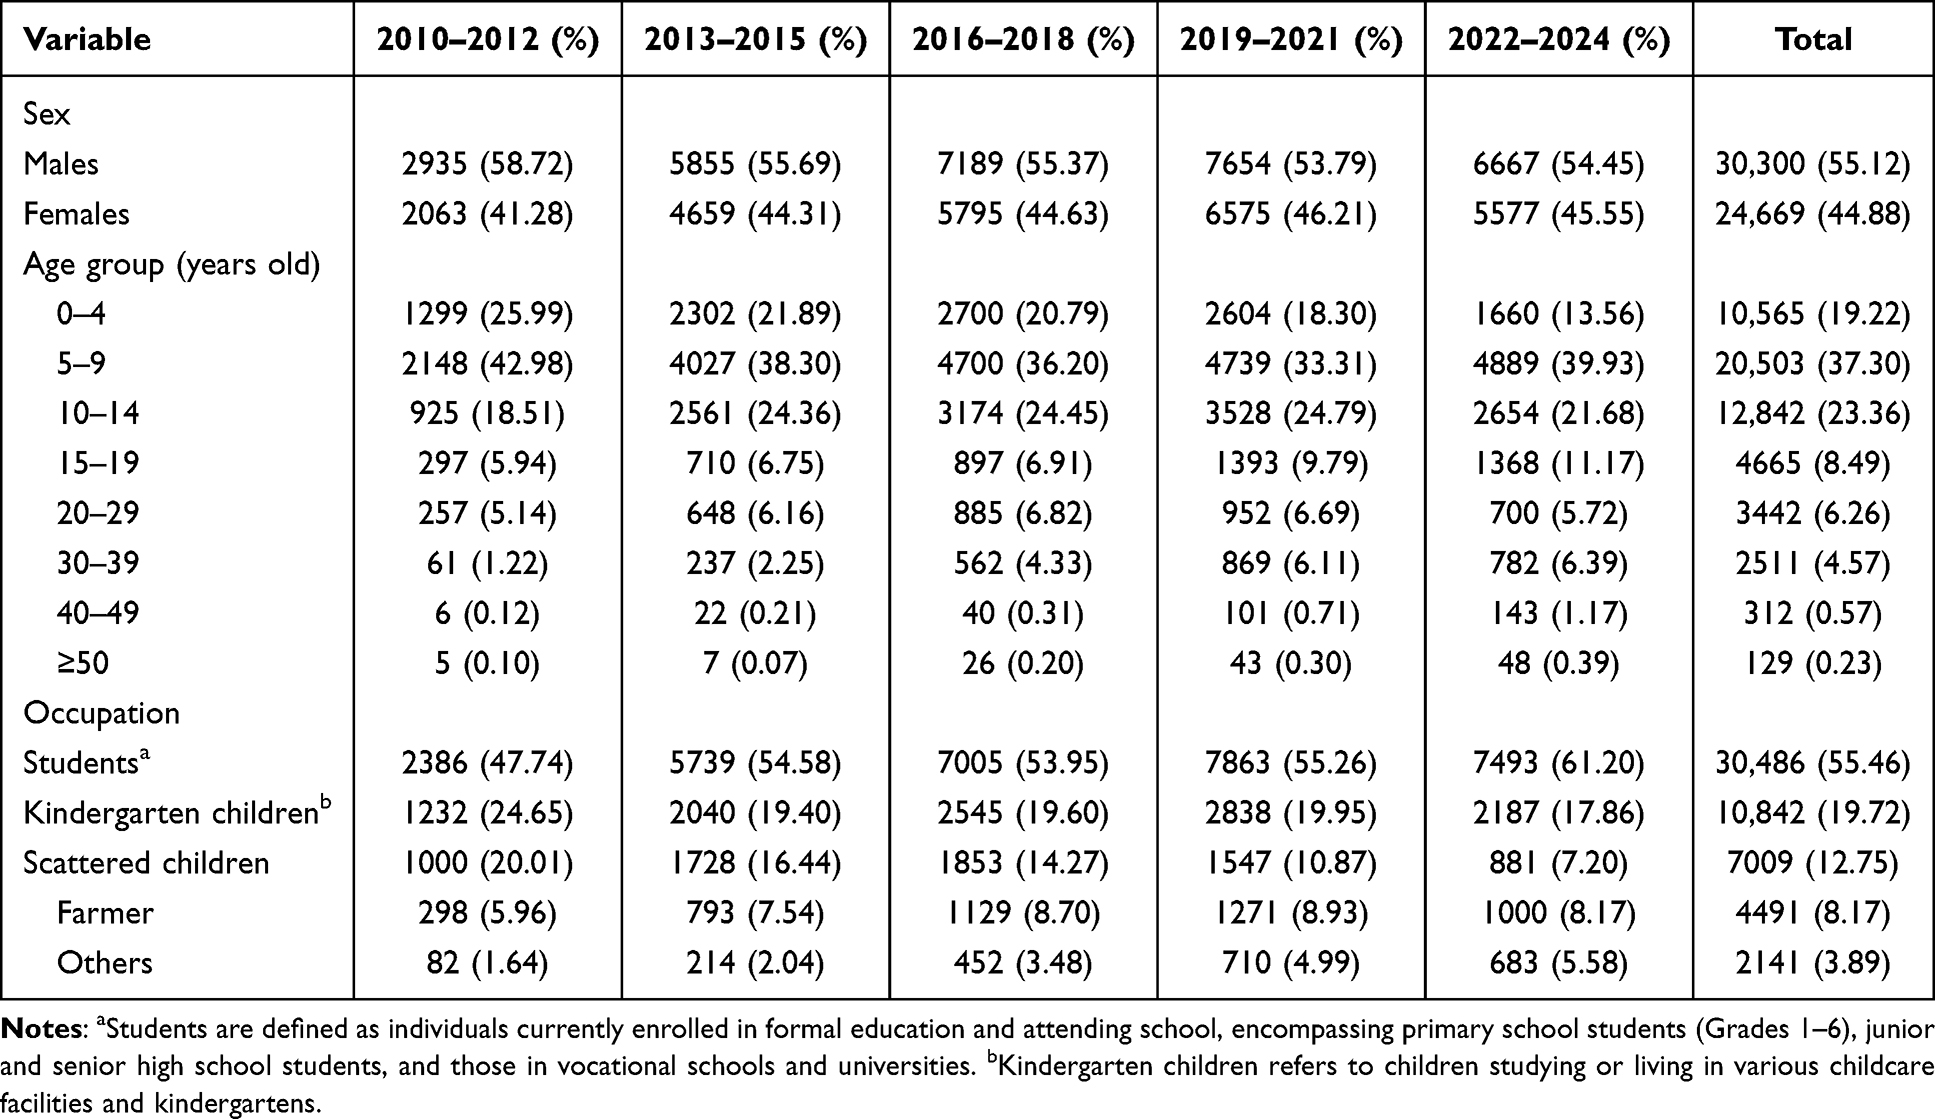 |
Table 1 Sociodemographic Characteristics and Distribution of Varicella Cases in Baise, China, 2010–2024 (N = 54,969) |
Regional Distribution
Varicella cases were reported in all counties (cities and districts), with incidence rates showing a overall upward trend exhibited significant geographical heterogeneity. As illustrated in Figure 3, the rise in varicella incidence was primarily characterized by the geographical expansion and intensified intensity of high-incidence clusters. The top five counties with the highest average annual reported incidence rates (per 100,000) were Lingyun (148.75), Tianlin (132.17), Napo (129.59), Pingguo (121.93), and Xilin (117.80). Furthermore, 45.19% (61/135) of the townships/sub-districts reported incidence rates exceeding the city-wide average.
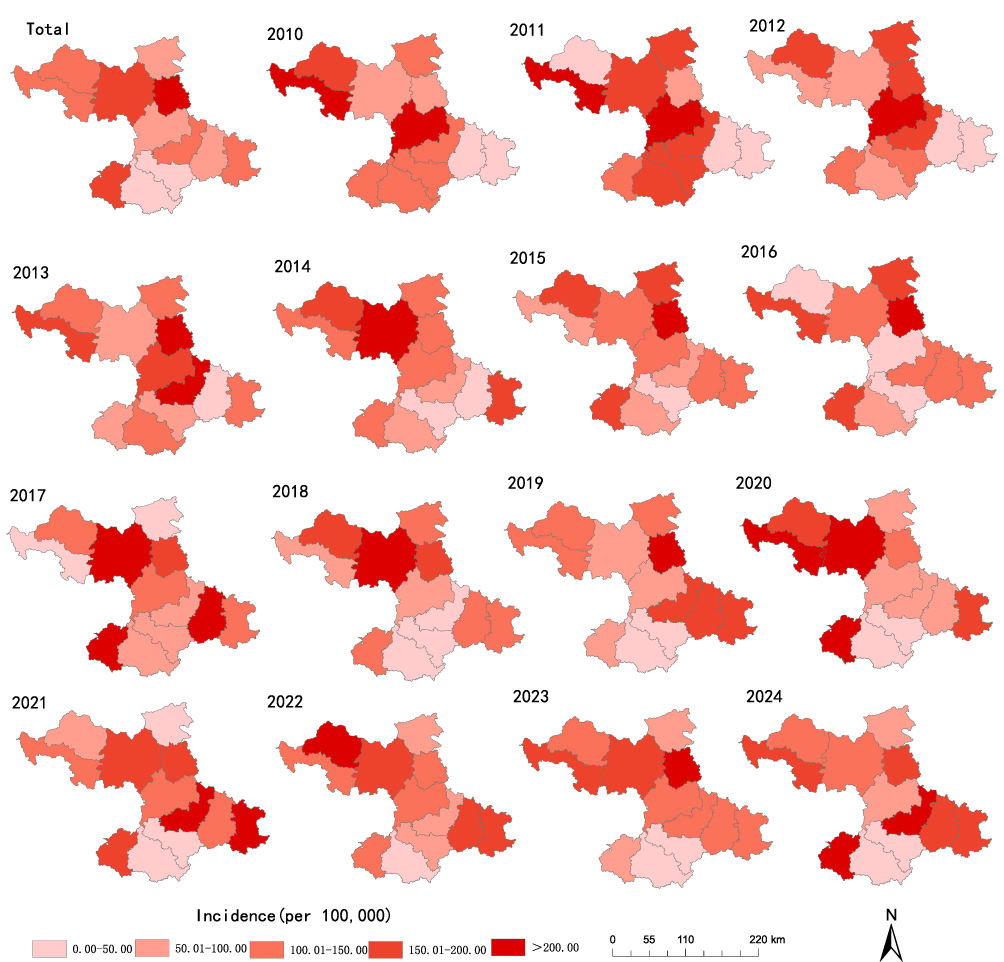 |
Figure 3 Spatiotemporal distribution of varicella incidence rates at the county level in Baise, 2010–2024. |
Trend Analysis
The results of the joinpoint regression analysis indicated that the reported incidence rate of varicella in Baise was on an overall upward trend, increasing at an annual rate of 10.05% (AAPC = 10.05%, 95% CI: 1.10%–19.79%, P = 0.027). During the study period, a turning point occurred in 2014. From 2010 to 2014, the reported incidence rate showed a rapid increase, with an APC of 34.83% (95% CI: −1.40% to 84.39%, P = 0.059). From 2014 to 2024, the incidence rate stabilized, with an APC of 1.46% (95% CI: −3.53 to 6.71%, P = 0.535) (Figure 4).
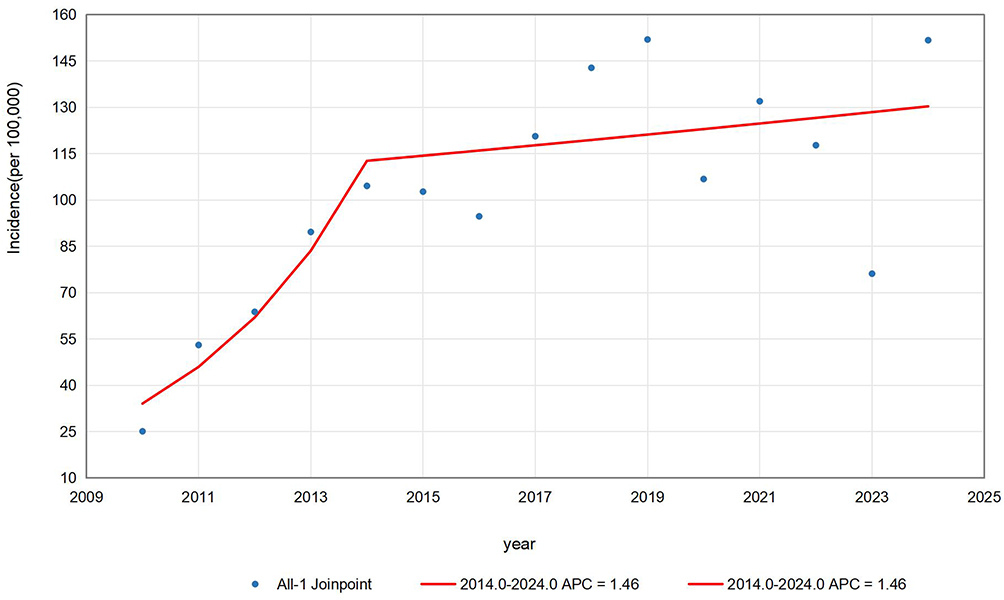 |
Figure 4 Joinpoint regression analysis of varicella incidence trends in Baise, 2010–2024. |
Spatial Autocorrelation Analysis
A global spatial correlation analysis was conducted using data from the townships/subdistricts as the smallest units. The Moran’s I values for each year from 2010 to 2024 ranged from 0.104 to 0.488, and all were positive and statistically significant, indicating that there was a positive spatial correlation in the distribution of varicella across all regions of Baise. With the exception of 2013, when the distribution was spatially random (Z(G) < 1.96, P > 0.05), all other years exhibited a high-value clustering patterns (Table 2). Local spatial autocorrelation analysis results showed that from 2010 to 2013, the hotspots were primarily concentrated in the central urban area. After 2014, they gradually expanded to the right bank of the Li River valley, including Pingguo City, Tiandong County and Tiangyang District, as well as the northwestern mountainous region, including Longlin County, Tianlin County and Lingyun County. Cold spots were mainly distributed in the southern border areas, including Jingxi City and Debao County (Figure 5).
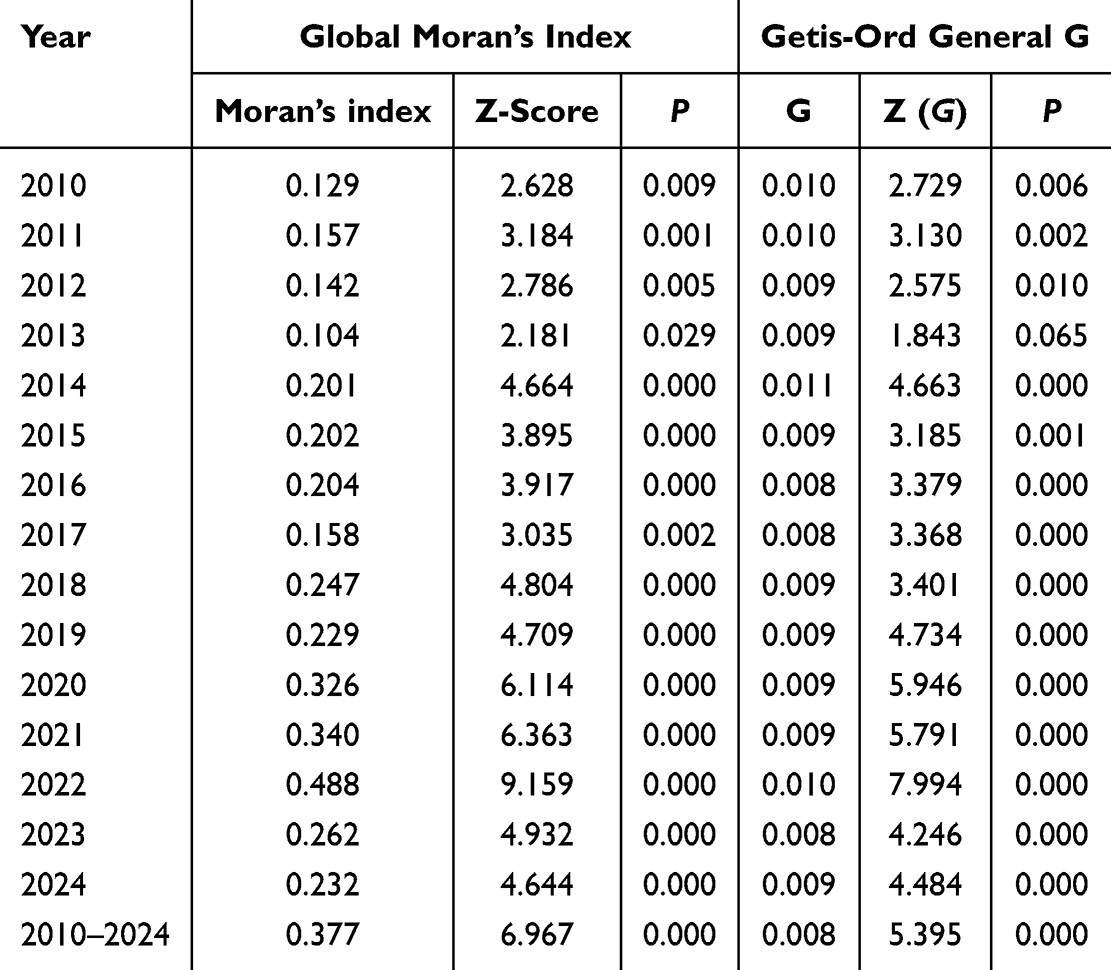 |
Table 2 Annual Global Spatial Autocorrelation Analysis of Varicella Incidence in Baise, China, 2010–2024 |
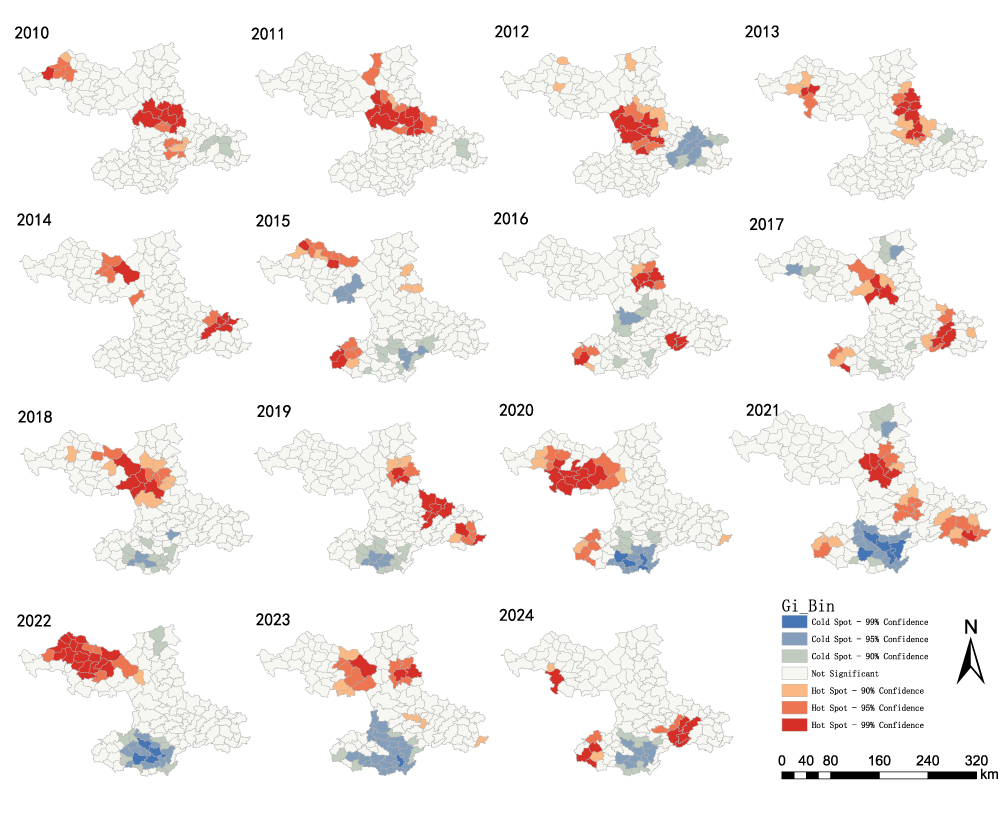 |
Figure 5 Spatial hotspots of varicella incidence at the township level in Baise, 2010–2024. |
Spatial-Temporal Scan Analysis
A spatial-temporal scan was conducted annually from 2010 to 2024 for the reported incidence rates of varicella in all townships/subdistricts of Baise, and this revealed significant spatial and temporal clustering. A total of five statistically significant clustering areas were identified, including one Type I and four Type II clustering areas (Table 3). The most likely cluster area (i.e., the area most likely to experience clustering) encompassed 27 townships (subdistricts) on the right bank of the Jiang River valley, including Pingguo City, Tiandong County and Tianyang District, with clustering occurring from 2018 to 2024 and reported incidence rates ranging from 40.97 to 207.64 per 100,000. The secondary cluster areas were primarily distributed in the northwestern mountainous regions, including Longlin, Tianlin and Lingyun Counties (Figure 6).
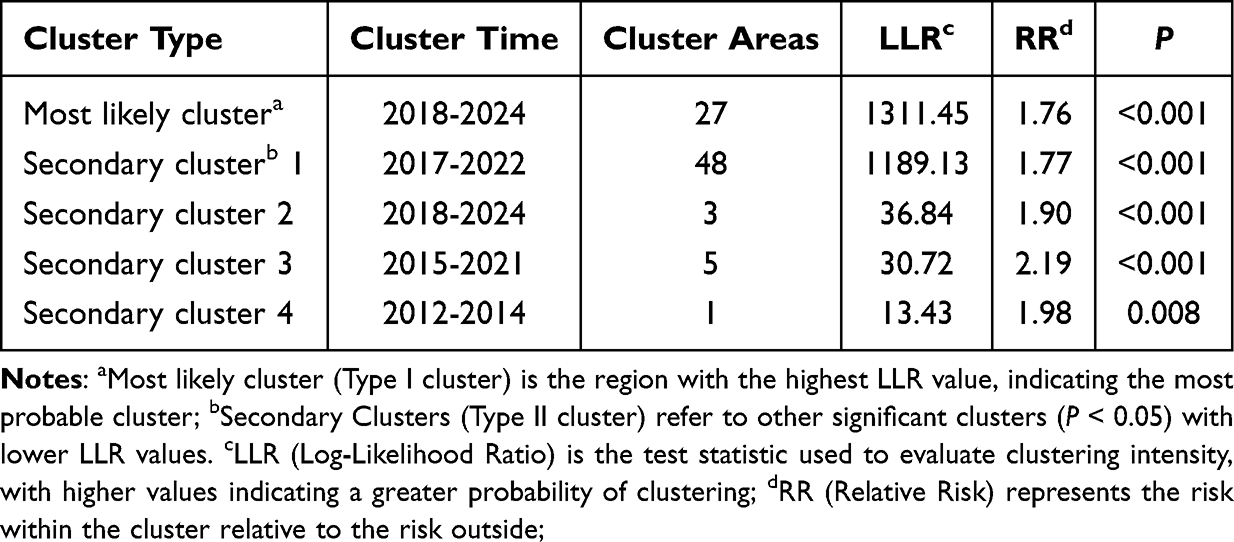 |
Table 3 Spatio-Temporal Scan Clustering Analysis of Varicella Cases in Baise, 2010–2024 |
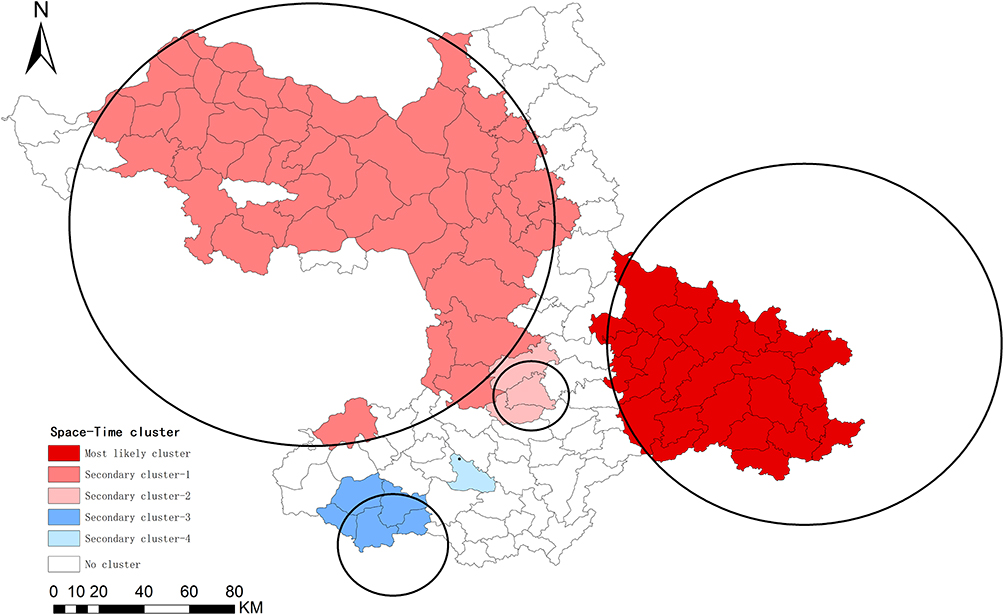 |
Figure 6 Spatiotemporal clusters of varicella incidence at the township level in Baise, 2010–2024. |
Overview of Varicella Vaccination Status
Among the 54,969 reported varicella cases, 40,653 were confirmed to have registered records in the Guangxi Immunization Program Information Management System, while the vaccination history for the remaining 14,316 cases was unknown. Documented varicella vaccination records were identified for 6257 cases. Specifically, 13.80% (5609/40,653) of the registered cases had received only a single dose of the vaccine, and 1.59% (648/40,653) had completed a two-dose regimen. Additionally, 591 cases experienced disease onset prior to vaccination, and 5666 cases occurred after vaccination.
Discussion
In this study, we conducted a systematic analysis of the epidemiological characteristics of varicella outbreaks in Baise from 2010 to 2024 and, for the first time, systematically analyzed the spatiotemporal distribution patterns of varicella outbreaks at the township/subdistrict level. The results showed that the annual average reported incidence rate of varicella in Baise from 2010 to 2024 was 102.30 per 100,000, which is significantly higher than the national average and the incidence levels of neighboring cities.7,18,19 This suggests that the regional specificity of a border mountainous area, lagging economic development, subtropical monsoon climate conditions and insufficient medical resources have synergistically influenced disease transmission.
The varicella incidence trends in this city from 2010 to 2024 exhibited distinct staged characteristics. Trend analysis showed that the annual incidence of varicella in Baise increased by an average of 10.05% during the study period, with an annual growth rate as high as 34.83% from 2010 to 2014. This rapid surge may be directly linked to low vaccination coverage in Guangxi that requires residents to pay for varicella vaccines out-of-pocket. Insufficient vaccine coverage combined with limited immune durability weakened long-term protection, making it difficult to establish a robust herd immunity barrier and leading to a sharp rise in the epidemic.20 This finding is consistent with research conclusions from other regions in Guangxi.21,22 The growth rate of the varicella epidemic slowed after 2014, which may be related to the gradual increase in residents’ willingness to vaccinate and the rise in breakthrough infection cases leading to significantly reduced infectivity; these factors may have, to some extent, moderated the growth speed of the epidemic, though further validation is required.23 Furthermore, this study found a high proportion of breakthrough cases among individuals with a history of vaccination. This suggests that the immune barrier established by a single-dose vaccination regimen is not robust and provides preliminary evidence of the natural waning of varicella-zoster virus (VZV) antibody titers over time. From 2020 to 2023, influenced by COVID-19 prevention and control measures (eg, restricted gatherings and online teaching), the incidence rate experienced a temporary decline. This trend aligns with findings from Yunnan and Shaanxi,24,25 confirming that social distancing measures significantly inhibit varicella transmission.26,27 However, the incidence rate in 2024 rebounded to pre-pandemic levels, reflecting the combined impact of increased social contact following the relaxation of control measures and the accumulation of susceptible populations during the preceding years.28 This suggests that in the post-pandemic era, vigilance against the risk of varicella resurgence is essential, and prevention and control measures must be strengthened to address the potential increase in public health workload.
The study found a distinct “bimodal distribution” pattern. This seasonal variation in incidence is closely related to meteorological factors and also highly coincides with the school semester cycle when people gather for activities,29,30 which is consistent with research findings in Thailand and South Korea.31,32 The central peak of varicella incidence may also be related to the low temperature and dry climate in winter, which is conducive to virus survival, and the high concentration of students in schools, leading to increased risk of contact transmission. The secondary peak may be related to factors such as student gatherings after the start of the spring semester. This suggests that crowded areas, especially schools, are important venues for varicella transmission, requiring enhanced surveillance, while also paying attention to local climate changes and to constantly remind residents to take preventive measures against varicella virus transmission. From the perspective of population distribution of varicella cases, similar to previous studies, the infected population in this study was mainly composed of students, kindergarten children, which also confirms the conclusion that schools are core venues for outbreaks.33–35 It is noteworthy that the farmer cannot be overlooked. This may stem from the generally low varicella vaccination rates in rural areas. Furthermore, as the primary caregivers for their infected children or grandchildren, they are highly susceptible to intra-family cross-infection through daily contact. Additionally, the relatively weak healthcare infrastructure in rural regions has further facilitated the regional transmission of the virus. At the same time, the study also found that the incidence rate in males was higher than in females, which may be related to more frequent group activities and more contact opportunities among male children and students. As a vaccine-preventable infectious disease, after some provinces implemented free varicella vaccination policies, the incidence rates among children in childcare institutions and scattered living children showed a significant downward trend, providing direct evidence for the protective efficacy of its vaccine.36,37 However, in contrast, the incidence rate among students showed an upward trend year by year, especially the continuous increase in the proportion of the 10–19 years old group, indicating an evident phenomenon of “age shift” in incidence.25,38 This further corroborates the waning immune durability of the varicella vaccine; as time progresses, the protective efficacy of the single dose administered during early childhood declines, creating an immunity gap. This phenomenon of immune decay and the subsequent breakthrough infections underscore the necessity of implementing a second booster dose to consolidate the herd immunity barrier. Although the incidence rate among people over 20 years old remained low, vigilance is needed regarding the risk of herpes zoster that this group may face due to age-related immune function decline. This requires the establishment of a hierarchical management system for prevention and control strategies, focusing on strengthening active surveillance in crowded places such as schools, while establishing a mechanism for adolescent vaccine catch-up vaccination, and building a long-term serological surveillance and vaccine immune effect evaluation system.
In terms of the regional distribution of varicella incidence, there are significant differences in incidence rates among the counties and districts in Baise. The average annual incidence rates are highest in Lingyun County, Tianlin County, and other areas, which may be related to factors such as population density, vaccination rates and uneven distribution of medical resources in these regions. Nearly 50% of townships/sub-districts have incidence rates higher than the city average, indicating the presence of transmission hotspots in local areas. Similar studies have pointed out that economically underdeveloped regions and areas with low population density are more likely to experience clustered outbreaks.39
Spatial autocorrelation analysis showed that the incidence of varicella in Baise presented significant spatial clustering. Hotspot areas gradually expanded from the central urban area to the northwestern mountainous areas and the Youjiang River Valley belt over time, which was consistent with the results of the spatiotemporal cluster scanning analysis. Notably, the Youjiang River Valley belt, as a persistent high-risk cluster area, correlates with high population mobility, convenient transportation, and high economic activity.34 In contrast, the northwestern mountainous areas, due to weak disease prevention awareness among multi-ethnic communities and low economic income, have hindered the distribution of voluntary self-funded vaccines, suggesting that differentiated prevention and control strategies need to be formulated for different geographical units. The study also found that the disease burden in cold-spot areas may be underestimated. Against the background of generally high reporting rates of varicella in China, the actual incidence in these areas may far exceed existing analysis results. This spatial heterogeneity suggests that a dynamic monitoring mechanism needs to be established, focusing on the spatiotemporal evolution trends of cluster areas. Also, the differentiated strategies should be formulated based on the socioeconomic characteristics of different geographical units (such as focusing on improving medical accessibility in northwestern mountainous areas and strengthening prevention and control in densely populated places in the southeast). In addition, with respect to potential regional differences in reporting quality, more in-depth epidemiological investigations will need to be conducted to reveal the true driving factors of incidence differences between hot- and cold-spot areas.
This study had some limitations. Firstly, due to differences in monitoring sensitivity, underreporting and diagnostic bias, the actual incidence levels of varicella may have been underestimated. Secondly, vaccination records for many cases were either inconsistent or incomplete over the study period. Consequently, we were unable to perform an individual-level analysis of vaccination status for each reported case, this precluded a granular investigation into the association between vaccination status and infection at the individual level. Finally, the incidence of varicella was influenced by multiple factors. Future studies should integrate active surveillance, serological surveys and multi-source data fusion to further elucidate the impact of socioeconomic, climatic and behavioral factors on disease transmission.
Conclusion
The incidence rate of varicella in Baise has shown a steady upward trend since 2010, with significant seasonal variations. Children and students under the age of 20 years old are the primary inhabitants affected, and the disease exhibits pronounced spatial clustering, primarily concentrated in the Youjiang River Valley and the northwestern mountainous regions. This study revealed the unique characteristics of varicella epidemics in the western border regions and ethnic minority-populated areas of Guangxi. It is necessary to develop tailored prevention and control measures based on local conditions in order to better control the epidemic and reduce the disease burden.
Data Sharing Statement
The datasets used and analyzed during the current study are available from the corresponding author on reasonable request.
Ethical Approval
The study was approved by the Ethics Committee of Youjiang Medical College for Nationalities on January 5, 2025 (No.2025010503). The research adhered to the principles of the Declaration of Helsinki and followed ethical standards to ensure the confidentiality and privacy of participants throughout the study.
Acknowledgments
The authors are grateful to Dr. Dev Sooranna, Imperial College London, for English language edits of the manuscript and Baise Centre for Disease Control and Prevention for sharing the valuable data.
Author Contributions
All authors made a significant contribution to the work reported, whether that is in the conception, study design, execution, acquisition of data, analysis and interpretation, or in all these areas; took part in drafting, revising or critically reviewing the article; gave final approval of the version to be published; have agreed on the journal to which the article has been submitted; and agree to be accountable for all aspects of the work.
Funding
No funding was received for this study.
Disclosure
The authors declare that they have no known competing financial interests or personal relationships that could have appeared to influence the work reported in this paper.
References
1. National Health Commission of the People’s Republic of China, National Administration of Traditional Chinese Medicine. Guidelines for the diagnosis and treatment of Varicella (2023 Edition). Int J Epidemiol Infect Dis. 2024;51(1):4–13.
2. Halik R, Paradowska-Stankiewicz I, Trochonowicz A, Dittmer S. Burden of chickenpox complications in Poland, 2006 to 2021: a comprehensive registry-based study. Euro Surveill. 2024;29(9):2300355. doi:10.2807/1560-7917.ES.2024.29.9.2300355
3. Wang M, Hu Y, You M, et al. Epidemiological characteristics of varicella outbreaks in China from 2006 to 2021. Chin J Epidemiol. 2023;44(12):1893–1898.
4. Xuan K, Zhang N, Li T, et al. Epidemiological characteristics of varicella in Anhui Province, China, 2012-2021: surveillance study. JMIR Public Health Surveill. 2024;10:e50673. doi:10.2196/50673
5. Wang M, Li X, You M, et al. Epidemiological characteristics of varicella outbreaks - China, 2006-2022. China CDC Wkly. 2023;5(52):1161–1166. doi:10.46234/ccdcw2023.218
6. Wang M, Zeng X, Zhang Y. Epidemiological characteristics of varicella outbreaks in China from 2007 to 2021. Chin J Vaccin Immun. 2023;29(3):274–279.
7. Dong P, Wang M, Liu Y. Epidemiological characteristics of chickenpox in China, 2016–2019. Chin J Vaccin Immun. 2020;26(4):403–406.
8. Ma T, Ding S, Chen C, et al. Epidemiological characteristics of varicella in Nanjing under Category C management and vaccination strategies. Chin J Dis Control Prev. 2024;28(4):393–401.
9. Sui H, Guo Y, Wang B, Su J. Global immunization strategies and research progress for varicella vaccines in children. Chin J Viral Dis. 2023;13(04):294–298.
10. Fu Z, Cai F, Han S, et al. Monitoring and analysis of chickenpox epidemics in Guangxi from 2011 to 2015. South China J Prev Med. 2017;43(01):43–46.
11. Xu Y, Fu Z, Zhou J, et al. Spatial and temporal distribution characteristics of varicella epidemics in Guangxi Zhuang Autonomous Region, 2014–2016. Chin J Epidemiol. 2017;38(10):1390–1393.
12. Xiong S. Epidemiological Characteristics and Spatial Clustering of Chickenpox in Jilin Province, 2009–2018. Jilin University; 2020.
13. Li X. Spatial and Temporal Distribution Characteristics of Chickenpox in Anhui Province and Its Environmental Influencing Factors. Anhui Medical University; 2024.
14. Zeng S, Li Y, Liu J, et al. Joinpoint regression model method and application for comparing trend changes in two sets of sequential data. Chin J Health Stat. 2021;38(02):307–311.
15. Tang X. Research on the Application of GIS Spatial Analysis Technology in the Spatial Heterogeneity Distribution of Diseases. Guangxi Medical University; 2009.
16. Liu T, Yao M, Chen H, et al. Parameter selection of spatiotemporal scan statistics in the study of hand, foot, and mouth disease clusters. J Pub Health Prev Med. 2020;31(5):49–52.
17. Tang X, Li Q, Qiu X, et al. Scale selection of the maximum spatial scan window in scan statistics. Chin J Dis Control Prev. 2015;19(3):316–317,320.
18. Wang J, Wei B, Pan Z. Analysis of the epidemiological characteristics of chickenpox in Du’an Yao Autonomous County, Guangxi, from 2014 to 2023. Appl Prev Med. 2024;30(06):480–483.
19. Lv C, He S, Fu C. Epidemiological characteristics of varicella in Qinzhou City, Guangxi, 2013–2022. Youjiang Med J. 2024;52(6):553–558.
20. Zhang X. Cost-Effectiveness Analysis of the Protective Efficacy of Varicella Vaccine and Vaccine Immunization Strategies. Anhui Medical University; 2024.
21. Jia R. Epidemiological analysis of chickenpox in Rongshui County from 2006 to 2015. Strait J Prev Med. 2017;23(03):38–40.
22. Wei N, Yang L, Cui C, et al. Analysis of the epidemiological characteristics of varicella in Jiangnan District, Nanning City, Guangxi Province, 2007–2016. J Guangxi Med Univ. 2018;35(11):1581–1584.
23. Zhang L, Ma W, Liu Y, et al. Analysis of sero-epidemiological characteristics of varicella in healthy children in Jiangsu Province. China BMC Infect Dis. 2018;18(1):563. doi:10.1186/s12879-018-3496-8
24. Wang S, Zhang J, Li X, et al. Epidemiological characteristics and spatio-temporal clustering analysis of varicella in Diqing Tibetan Autonomous Prefecture, Yunnan Province, 2014–2023. Dis Surveill. 2025;2025:1–11
25. Zhu N, Yang G, Wang S, Li X. Analysis of the epidemiological trends and spatial clustering characteristics of varicella in Shaanxi Province from 2016 to 2023. Chin J Sch Health. 2025;46(02):272–275.
26. Qiu H. Spatial-Temporal Distribution and Prediction Model of Chickenpox in Chongqing From 2014 to 2020. Chongqing Medical University; 2022.
27. Wu T, Gao S, Zhou W. Epidemiological characteristics of varicella cases in schools in Fangshan District, Beijing, 2017–2021. Int J Virol. 2023;30(4):325–329.
28. Suzuki A, Nishiura H. Reconstructing the transmission dynamics of varicella in Japan: an elevation of age at infection. Peer J. 2022;10:e12767. doi:10.7717/peerj.12767
29. Li X, Wei X, Zhang W, Sun H. Research progress on the epidemiological characteristics and influencing factors of varicella. Dis Surveill. 2023;38(7):878–883.
30. Luan G, Zhang W, Liu S, et al. Research progress on the influence of environmental factors on the incidence of chickenpox. Chin J Dis Control Prev. 2024;28(1):101–107.
31. Bakker KM, Eisenberg MC, Woods R, Martinez ME. Exploring the seasonal drivers of varicella zoster virus transmission and reactivation. Am J Epidemiol. 2021;190(9):1814–1820.
32. Kim EY, Park C, Lee G, Jeong S, Song J, Lee DH. Epidemiological characteristics of varicella outbreaks in the Republic of Korea, 2016-2020. Osong Public Health Res Perspect. 2022;13(2):133–141. doi:10.24171/j.phrp.2022.0087
33. Liu X, Wang M, You M, et al. Analysis of the characteristics and socioeconomic impact factors of varicella outbreaks in the Beijing-Tianjin-Hebei region from 2006 to 2021. Chin J Prev Med. 2024;58(12):1999–2004.
34. Liang X, Liang C, Xu B, et al. Epidemiological characteristics and related factors of varicella outbreaks in primary schools in Nanning City, 2014–2023. Chin J Dis Control Prev. 2024;28(11):1287–1294.
35. Zhang R, Hong J, Chen L, et al. Analysis of the epidemiological characteristics of chickenpox in schools in Yunnan Province from 2018 to 2020. J Pub Health Prev Med. 2023;34(4):55–58.
36. Lu J, Zhu T, Chen M, Shi L. The impact of incorporating the varicella vaccine into the immunization program on the epidemiological characteristics of varicella. Pract Prev Med. 2024;31(10):1181–1185.
37. Gu R, Wu R, Ding S, et al. Analysis of the impact of a free varicella vaccination strategy on the epidemiological characteristics of varicella in Nanjing City. Occup Health. 2023;39(15):2059–2063.
38. Wang L, Wang MM, Xu CD, et al. Spatial dynamics of chickenpox outbreaks in rapidly developing regions: implications for global public health. Biomed Environ Sci. 2024;37(7):687–697. doi:10.3967/bes2024.068
39. Lee YH, Choe YJ, Hwang SS, Cho SI. Spatiotemporal distribution of varicella in the Republic of Korea. J Med Virol. 2022;94(2):703–712. doi:10.1002/jmv.27434
 © 2026 The Author(s). This work is published and licensed by Dove Medical Press Limited. The
full terms of this license are available at https://www.dovepress.com/terms
and incorporate the Creative Commons Attribution
- Non Commercial (unported, 4.0) License.
By accessing the work you hereby accept the Terms. Non-commercial uses of the work are permitted
without any further permission from Dove Medical Press Limited, provided the work is properly
attributed. For permission for commercial use of this work, please see paragraphs 4.2 and 5 of our Terms.
© 2026 The Author(s). This work is published and licensed by Dove Medical Press Limited. The
full terms of this license are available at https://www.dovepress.com/terms
and incorporate the Creative Commons Attribution
- Non Commercial (unported, 4.0) License.
By accessing the work you hereby accept the Terms. Non-commercial uses of the work are permitted
without any further permission from Dove Medical Press Limited, provided the work is properly
attributed. For permission for commercial use of this work, please see paragraphs 4.2 and 5 of our Terms.