Back to Journals » OncoTargets and Therapy » Volume 12
EP3 receptor antagonist L798,106 reduces proliferation and migration of SK-BR-3 breast cancer cells
Authors Hester A, Salzmann B, Rahmeh M, Kolben T ![]() , Czogalla B
, Czogalla B ![]() , Ditsch N
, Ditsch N ![]() , Mahner S, Jeschke U
, Mahner S, Jeschke U ![]() , Kolben TM
, Kolben TM ![]()
Received 11 February 2019
Accepted for publication 11 April 2019
Published 29 July 2019 Volume 2019:12 Pages 6053—6068
DOI https://doi.org/10.2147/OTT.S204919
Checked for plagiarism Yes
Review by Single anonymous peer review
Peer reviewer comments 2
Editor who approved publication: Prof. Dr. Takuya Aoki
Anna Hester,* Barbara Salzmann,* Martina Rahmeh, Thomas Kolben, Bastian Czogalla, Nina Ditsch, Sven Mahner, Udo Jeschke, Theresa Maria Kolben
Department of Obstetrics and Gynecology, University Hospital, LMU Munich, Munich, Germany
*These authors contributed equally to this work
Purpose: COX-2 overexpression and elevated levels of prostaglandin E2 (PGE2) play an important role in breast cancer carcinogenesis. Recently, expression of the PGE2 receptor EP3 has been shown to be a positive prognostic factor in breast cancer. This study analyzes the functional aspects of targeting EP3 in breast cancer cell lines.
Material and methods: EP3 and EP1 expressions were determined in five breast cancer cell lines on the mRNA- and the protein-level. The selected cell lines were subsequently stimulated for 24–72 hrs with 10–1,000 nM of PGE2, the EP1/EP3 agonist sulprostone and the EP3 antagonist L798,106. Cell proliferation was determined via BrdU-assay, migration via scratch assay, EP3, Gi-protein and p-ERK1/2 expressions via Western blot and cAMP concentrations via ELISA. The Mann–Whitney-U-test was used to test for statistical significance.
Results: The cell lines T-47D (EP3 expression 77.7%) and SK-BR-3 (EP3 expression 48.7%) were chosen. EP3 antagonism reduced its expression on SK-BR-3 significantly, while no effect was observed on T-47D. The proliferation and migration of SK-BR-3 cells were significantly reduced due to treatment with the EP1/3 agonist, the EP3 antagonist or a combination of both. Neither agonism nor antagonism influenced cell proliferation or migration in T-47D. In SK-BR-3, EP3 antagonism showed a significant decrease in Gi-protein levels, an increase in cAMP levels, and no significant change in p-ERK1/2 expression.
Conclusion: Antagonism of the EP3 receptor results in a reduced proliferation and migration of SK-BR-3 breast cancer cells, potentially mediated via a Gi-protein-cAMP pathway. The results suggest that EP3 plays a role in tumorigenesis. This is in accordance with the cell culture data of other gynecological tumors, but it is conflicting in so far, as positive EP3 expression is clinically a positive prognostic marker in breast cancer. Therefore, other factors may be important in explaining this contradiction.
Keywords: carcinoma of the breast, prostaglandin E2 receptor 3, cell growth, cell traffic, signal transduction, in vitro experiments
Introduction
Breast cancer represents the most common malignancy in women worldwide. In the United States, 268,600 newly diagnosed cases of breast cancer and 41,760 deaths are estimated for 2019.1 Despite advances in the treatment of early-stage breast cancer, 10–15% of breast cancer patients develop distant metastases within 3 years after the detection of the primary tumor.2 A French observation cohort found that within the past decade the overall survival in metastatic breast cancer has ranged around 37 months.3 Known negative prognostic factors in breast cancer include positive axillary lymph nodes,4 negativity for estrogen or progesterone receptor,5 a high tumor proliferation rate measured by Ki-67,6 and the amplification of the Her-2 oncogene. Her-2 is a protein that promotes growth and proliferation of tumor cells leading to an impaired prognosis for patients with Her-2 enriched tumors.7 However, due to the innovation of specific Her-2-targeting drugs, the prognosis of Her-2 positive patients has changed dramatically. In fact, patients with metastatic Her-2 positive disease are now showing the best survival rates of all metastatic breast cancer subtypes.3,8,9 Nevertheless, especially for the triple negative subtype that has the worst prognosis of all breast cancer subtypes,3,9 targeted therapies are still lacking. The search for targetable prognostic factors is ongoing.
In different kinds of cancer, chronic inflammation represented by cyclooxygenase (COX)-2 overexpression and by elevated levels of prostaglandin E2 (PGE2) has been associated with tumor development and progression.10 Prostaglandins belong to the group of eicosanoids. These are tissue hormones with essential functions in several physiological processes as well as in inflammatory processes and in tumor development.10 The prostaglandin synthesis is dependent on COX-enzymes which catalyze the conversion of arachidonic acid to prostaglandin G2; the precursor molecule for the synthesis of PGE2 and other eicosanoids. While the COX-1 enzyme is expressed constitutively, the COX-2 expression is induced by various cytokines and growth factors.11
Chronic inflammation marked by elevated levels of PGE2 has been shown in breast cancer. Overexpression of COX-2 was observed in 40% of invasive breast cancer cases.11,12 An elevated COX-2 expression has been associated with impaired disease-free survival. Furthermore, the tumor biology of COX-2 elevated tumors is more aggressive, demonstrated by a higher grading, and a higher proliferation rate identified by Ki-67.13 The importance of the COX-2-PGE2 axis has been confirmed in several studies. The inhibition of the COX-2 enzyme with selective COX-2 inhibitors (COXibs) – in experimental mouse models14 as well as in a case-control patient study15 – has been successful in reducing tumor progression or the risk of breast cancer development. However, the clinical use of COXibs is limited, due to their associated cardiovascular side effects, like thrombosis and embolism. These are probably caused by an imbalance of pro- and anti-aggregatory agents due to the selective depression of the prostacyclin synthesis via COX-2 while the thromboxane synthesis via COX-1 is maintained.12
PGE2 exerts its effects by signaling via the G protein-coupled PGE2-receptors EP1–4.16 Concerning their role in breast cancer, EP2 and EP4 are the best evaluated receptors and are mainly assumed to be negative prognostic factors in breast cancer.17–19 The role of EP1 in breast cancer is less well understood. Some authors discuss divergent effects in tumor development and progression: EP1 has been shown to be tumor promoting concerning primary breast cancers in rats.20 In contrast, it did also show suppressing effects on breast cancer metastases.21 The EP3 receptor is the least well-understood receptor in breast cancer. We were recently able to demonstrate that EP3 expression in primary sporadic breast cancer is associated with improved progression-free survival and improved overall survival.22 This is surprising since a high EP3 expression has been associated with an impaired prognosis in other gynecological tumors, like cervical cancer23 or endometrial cancer.24 Endometrial cancer cells showed a reduced proliferation and migration due to EP3 antagonism.24
EP3 exists in various isoforms generated by alternative mRNA splicing.11 This could partly explain different effects of EP3 in different tumors, but tumor-type specific EP3-functions could play an important role as well. Several signaling pathways downstream of EP3 have been identified.25 It is assumed that some specific EP3 isoforms couple to a Gs protein and increase cyclic adenosine monophosphate (cAMP) levels via adenylate cyclase (AC) induction.26 Other EP3-isoforms couple to a Gi-protein and decrease cAMP levels.27 Furthermore, the EP3-receptor can signal via phosphatidylinositol 3-kinase (PI3K) and via the phosphorylation of extracellular signal-regulated kinases 1/2 (ERK1/2).28
As described above, we could recently demonstrate the positive prognostic effect of a high EP3-expression in breast cancer patients, while the underlying mechanisms remain unclear.22 The present study now aims to elucidate the functions of the EP3 receptor in breast cancer using a breast cancer cell culture model.
Materials and methods
Cell culture and drugs
The breast cancer cell lines used in this study were obtained from the American Type Culture Collection (Manassas, VA, USA) and are listed in Table 1.
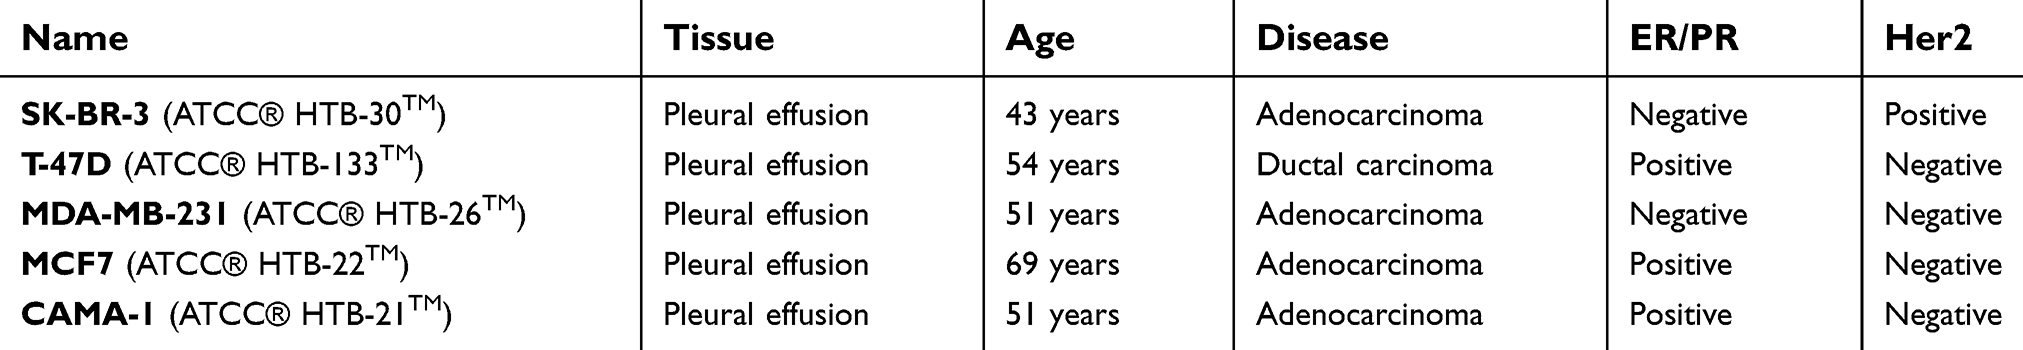 |
Table 1 Breast cancer cell lines used in this study: The breast cancer cell lines used in this study including their biological characteristics are listed |
The cells were maintained in RPMI 1640 Medium+GlutaMAX (Thermo Fisher, Waltham, MA, USA) complemented with 10% FBS (Thermo Fisher, USA). The cells were incubated at 37°C and 5% CO2 saturation. As preparation for each experiment, the cells were counted using Neubauer cell chambers, seeded in 6–96 well plates and incubated overnight. After 24 hrs, the cell culture medium was replaced by fresh RPMI 1640 medium+GlutaMAX, containing dimethylsulfoxide (DMSO, 0.1%) as a vehicle control or 10–1,000 nM of PGE2 (Tocris Bioscience, Ellisville, MI, USA), sulprostone (Tocris Bioscience) or L798,106 (Tocris Bioscience). L798,106 is a selective EP3 antagonist whereas sulprostone is described as a dual EP1/EP3 agonist.29 The selective EP3 agonist ONO-AE-248 was not available (not in stock anymore).30
mRNA expression
The EP1 receptor expression and the EP3 receptor expression on mRNA-level in MDA-MB-231, SK-BR-3, T-47D, MCF-7 and CAMA-1 breast cancer cells lines were determined using quantitative real-time-(RT)-PCR. The RNeasy Mini Kit (Qiagen, Hilden, Germany) was used to obtain the total RNA from cultured cells. The RNA was converted to cDNA with an MMLV Reverse Transcriptase First-Strand cDNA synthesis kit (epicenter, Madison, Wisconsin, USA) according to manufacturer’s instructions. For the RT-PCR, 20 µL reaction mixture (1 µL TaqMan® Gene Expression Assay 20×[Applied Biosystems, target ACTB, Nr. Hs99999903_m1, target PTGER3, Nr. Hs00168755_m1, or target PTGER1, Nr. Hs00168752_m1, primer sequences are not available due to the use of a commercial assay], 10 µL TaqMan® Fast Universal PCR Master Mix 2×[Applied Biosystems], 1 µL cDNA template and 8 µL RNase free water) per sample were given on a 96-well plate (Applied Biosystems) and were covered by an optical adhesive film. A 7500 Fast Real-time PCR system (Applied Biosystems) was used to run the PCRs. Initially, for the enzyme activation, heating to 95°C for 20 s was performed, followed by 40 qPCR-cycles of 3 s of denaturation at 95°C and annealing for 30 s at 60°C. The comparative 2−ΔΔCT method was used to analyze the results. β-actin was used as an endogenous control for ΔCT-values and the results are means of triplicates in two independent measurements.
Western blot
Western blot analyses were performed to analyze protein expression levels. The EP1 and the EP3 expression were analyzed in unstimulated SK-BR-3 and T-47D cells, the EP3 expression was analyzed in unstimulated MDA-MB-231 cells. In T-47D cells, the EP3 expression was also analyzed after stimulation as described below. After stimulation (as described below) of SK-BR-3 cells, the expression of EP3, Gi-protein and p-ERK1/2 was measured. SK-BR-3 and T-47D cells were treated with 10, 100 or 1,000 nM of PGE2, sulprostone or L798,106 for 1–24 hrs (1 hr for p-ERK1/2-expression; 24 hrs for EP3- and Gi-protein-expression). A cell sample incubated with DMSO (0.1%) served as a vehicle control. After stimulation, 200 µL of RIPA buffer (Sigma-Aldrich, R0278-50ML) were added and the samples were kept at −20°C for 10 mins to create protein samples. The protein aliquots were prepared in 4×Laemmli loading buffer. The samples were loaded on a 10% polyacrylamide gel (SDS-Page) and separated at a constant voltage of 70 V for 2 hrs. Afterward, the proteins were transferred to a polyvinylidene fluoride membrane (Bio-Rad, USA) for 75 mins at 145 mV and 4°C. The membrane was blocked in 5% milk powder (diluted in sodium Tris-buffer) for 1 hr and then incubated with the primary antibody overnight at room temperature. The primary antibody concentrations were used as in the following: mouse monoclonal anti β-actin antibody (1:1,000; Sigma, A5441), rabbit polyclonal anti EP3-antibody (1:2000; ab117998, Abcam), rabbit polyclonal anti p-ERK1/2 antibody (1:500; Abcam, ab47339) and rabbit polyclonal anti Gi1-protein antibody (1:500; Novus Biologicals, NBP2-16558). After washing the membranes three times for 10 mins in TBS/Tween, the samples were incubated with the secondary antibody (Goat-anti-rabbit/mouse, 1:1,000, Jackson Immuno Research, UK) for 1 hr at room temperature. Followed by another washing step (3x10 min), the bands were dyed using the color development substrate 5-bromo-4-chloro-3-indolyle phosphate/nitroblue-tetrazolium chloride (BCIP/NBT, Promega) in 0.1-M Tris–HCl, 0.15-M NaCl for 10–30 mins. The blots were scanned and analyzed using the GelScan V6.0 1D Analysis Software (SERVA, Electrophoresis GmbH, Heidelberg, Germany). The differential integrated density (absolute density minus background density) of the target protein bands was normalized to the intensity of the housekeeping protein bands of β-actin. The protein expression in each stimulation group was normalized to the expression in the unstimulated control groups. Every blot was repeated three times.
BrdU-assay
SK-BR-3 and T-47D-cells were seeded in 96-well plates at a density of 5×10³ per well. After 24 hrs, the cell culture medium was replaced by fresh medium containing 10, 100 or 1,000 nM of PGE2, of sulprostone, of L798,106, of both sulprostone and L798,106 or DSMO 0.1% as a vehicle control. After 72 hrs of incubation, the BrdU assay (11647229001, Roche) was performed in accordance with the manufacturer’s protocol. An Elx800 universal microplate reader was used to measure the optical density at 450 nm, which is proportional to the cell proliferation rate. Every experiment was repeated three times and the readings were taken in triplicates for each concentration/control. The proliferation rate in each stimulation group was normalized to the proliferation rate of the unstimulated control group.
Scratch (wound healing) assay
To study the cell migration in vitro, 1.4×10⁵ SK-BR-3 cells per well were seeded in 48-well plates and incubated overnight to create a consistent monolayer. After 16 hrs, a 200 μL pipette tip was used to create an artificial gap (“scratch”). The cells were washed three times with 1.5 mL DPBS (Gibco,USA). Afterward, 1 mL RPMI medium+GlutaMAX containing 100 nM or 1,000 nM of PGE2, of sulprostone, of L798,106 or of both sulprostone and L798,106 were added to each well. DMSO 0.1% served as a vehicle control. An inverse phase contrast microscope (Leica Dmi1, Leica, Wetzlar, Germany) with an integrated camera (LEICA MC120 HD, Leica, Wetzlar, Germany) was used to capture images at 0, 24 and 48 hrs to monitor the cell migration. The wound closure area was measured using the software ImageJ and normalized to the wound closure area in the unstimulated control group.
ELISA
The cAMP levels in SK-BR-3 cell lysates were measured using an enzyme-linked immunosorbent assay kit (R&D system, KGE012B, Minneapolis, USA). Each lysate contained 6×10⁶ cells. The assay was performed following the protocol provided by the manufacturer. The results were converted into ng/mL. The cAMP-levels in each stimulation group were then normalized to the cAMP-levels in the control group.
Statistics
The data analysis was performed using Microsoft Excel and SPSS software. The figures were created with SPSS software and Microsoft PowerPoint. The data were analyzed for statistical significance using the Mann–Whitney-U-test, p-values≤0.05 were considered statistically significant and are marked with asterisks (*) in the figures. The figures in this manuscript show means of at least three independent experiments (except for mRNA-levels, mean of two experiments) plus the standard error of the mean.
Results
EP1 and EP3 receptor expression on breast cancer cell lines
Recently, we observed that EP3 receptor expression is a positive prognostic marker in sporadic breast cancer.22 In this study, we evaluated the EP3 expression on breast cancer cell lines to find an adequate cell culture model for the analysis of EP3 receptor-related functions. Five different breast cancer cell lines were screened on the mRNA-level for their EP3 expression (Figure 1A). Based on the mRNA EP3-levels, we chose the T-47D cell line as a cell culture model for tumors with high EP3 expression. The mean protein expression of EP3 on T-47D cells was 77.7% (normalized to β-actin as a loading control, Figure 1B).
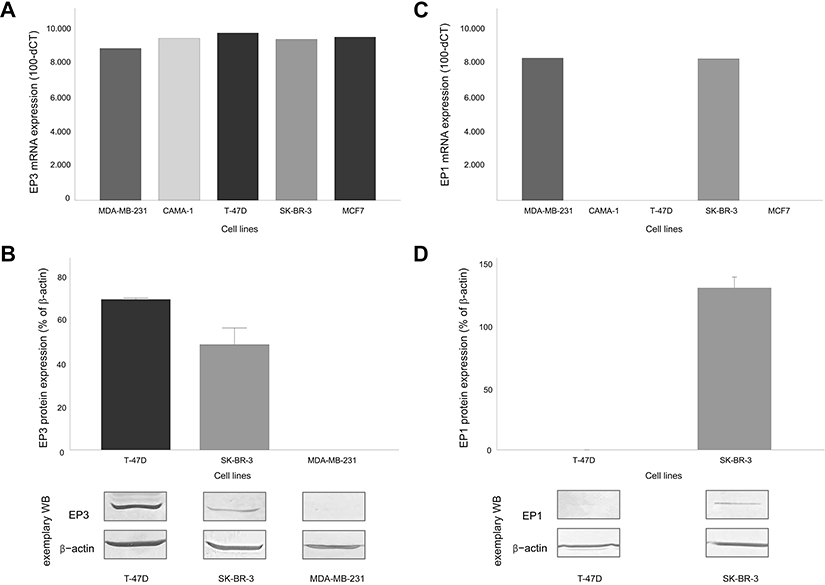 |
Figure 1 EP1 and EP3 receptor expression in breast cancer cell lines. (A) EP3 mRNA-levels in the breast cancer cell lines MDA-MB-231, CAMA-1, T-47D, SK-BR-3 and MCF7, n=2. (B) Relative EP3 protein-levels in the breast cancer cell lines T-47D, SK-BR-3 and MDA-MB-231. Top: mean+SEM, n=3, normalized on β-actin. Bottom: representative Western blots of EP3 and β-actin. T-47D shows high, SK-BR-3 low, MDA-MB-231 no detectable EP3 protein expression. (C) EP1 mRNA-levels in the breast cancer cell lines MDA-MB-231, CAMA-1, T-47D, SK-BR-3 and MCF7. (D) Relative EP1 protein-levels in the breast cancer cell lines T-47D and SK-BR-3. Top: mean + SEM, n=3, normalized on β-actin. Bottom: representative Western blots of EP1 and β-actin. SK-BR-3 shows high, T-47D no detectable EP1 protein expression. |
MCF-7 cells showed the second highest mRNA EP3-level. As we had excluded MCF-7 from further experiments during the project due to the lacking EP1 expression, we did not test the protein EP3 expression on MCF-7 cells. MDA-MB-231 cells showed the lowest EP3 expression on mRNA level, however, on protein level, an expression of EP3 could be not detected. Therefore, we chose SK-BR-3 cells as a cell culture model for tumors with low EP3 expression. On protein level, the mean EP3 expression on SK-BR-3 cells was 48.7% (normalized to β-actin as a loading control, Figure 1B).
For stimulation, we used PGE2 as the physiological, unspecific agonist to the EP3 receptor and to the other EP receptors and the specific EP3 antagonist L798,106. As a specific EP3 agonist was not available, we worked with the not highly selective EP1/3 agonist sulprostone. To evaluate which sulprostone-induced effects might be mediated via the EP1 receptor, we analyzed EP1 expression on the selected cell lines. On mRNA-level, SK-BR-3 and MDA-MB-231 cells showed a positive EP1 expression (Figure 1C). On protein level, SK-BR-3 cells showed a mean EP1 expression of 132% (normalized to β-actin as a loading control). As we had excluded the MDA-MB-231 cell line from further experiments due to the lacking protein EP3 expression, we did not test the protein EP1 expression on MDA-MB-231 cells. T-47D and MCF-7 cells did not express EP1 on mRNA level (Figure 1C). T-47D cells did also not express EP1 on protein level (Figure 1D). We did not test protein EP1 expression on MCF-7 cells, as we had excluded this cell line from further experiments as described above.
EP3 antagonist significantly reduced EP3 expression on SK-BR-3 cells
Initially, we evaluated the feedback of targeting EP3 on its expression. Hence, we measured protein EP3 expression on SK-BR-3 and T-47D cells treated with 10, 100 or 100 nM of PGE2, of the EP1/3 agonist sulprostone or of the EP3 antagonist L798,106. Both PGE2 (mean EP3 expression 111%, p=0.487 for all conditions) and sulprostone (mean EP3 expression 102%, p=0.487 for all conditions) did not significan tly influence the EP3 expression on SK-BR-3 cells. L798,106 treatment significantly reduced the EP3 expression on SK-BR-3 cells (Figure 2). 10 nM of L798,106 reduced the EP3 expression to 75% (p=0.037), 100 nM to 73% (p=0.487) and 1,000 nM to 68% (p=0.037). All p-values reflect the comparison with the EP3 expression of the unstimulated control group (Figure 2).
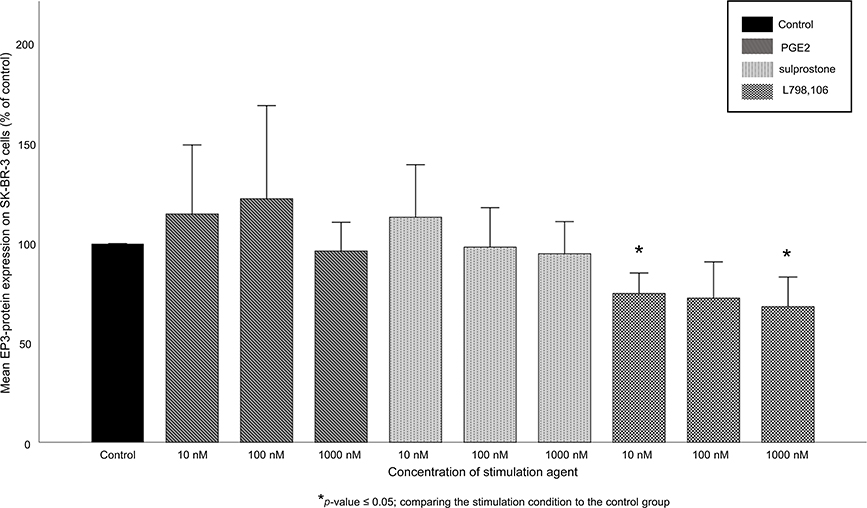 |
Figure 2 EP3 receptor expression in SK-BR-3 cells after stimulation. Mean relative EP3 protein expression (n=3)+SEM in SK-BR-3 cells after stimulation with 10, 100 or 1,000 nM of PGE2, sulprostone and L798,106 is shown. Relative expression is normalized to β-actin and to the expression of the control group. *p≤0.05, comparing each stimulation condition to the control group. EP3-antagonism causes a significant reduction of the EP3-expression compared to the control group. |
On T-47D cells, no alterations of EP3 expression after targeting EP3 could be shown at all. Under all conditions (PGE2, sulprostone, L798,106), the EP3 expression ranged between 81% and 134% without any significant differences (Figure S1).
EP1/3 agonist, EP3 antagonist and the combination of both significantly reduced the proliferation of SK-BR-3 cells
The BrdU-assay was used to assess the cell proliferation rate of SK-BR-3 and T-47D cells after stimulation with 10, 100 or 1,000 nM of PGE2, of the EP1/3 agonist sulprostone, of the EP3 antagonist L798,106 or of the combination of both agonist and antagonist. In SK-BR-3 cells, PGE2 treatment did not show consistent effects on the proliferation (at 10 nM, proliferation 100%, p=0.48, at 100 nM: 96%, p=0.034, at 1,000 nM: 99%, p=0.487). Treatment with sulprostone, L798,106 or the combination of both significantly reduced the cell proliferation of SK-BR-3 cells (Figure 3). 10 nM of sulprostone decreased the proliferation of SK-BR-3 cells to 90% (p=0.037), 100 nM to 88% (p=0.037) and 1,000 nM to 88% as well (p=0.037). 10 nM of L798,106 reduced the proliferation to 88% (p=0.037), 100 nM to 86% (p=0.034) and 1,000 nM to 91% (p=0.037). 10 nM of both sulprostone and L798,106 reduced the proliferation of SK-BR-3 cells to 92% (p=0.037), 100 nM to 94% (p=0.037) and 1,000 nM to 96% (p=0.053). All p-values reflect the comparison with the proliferation rate of the unstimulated control group.
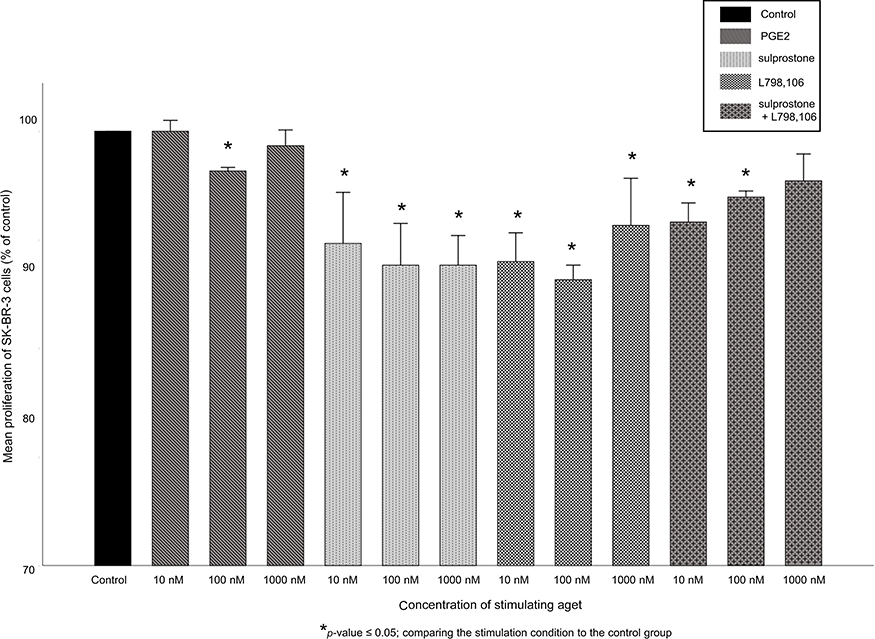 |
Figure 3 Proliferation of SK-BR-3 cells after stimulation. Mean relative proliferation (n=3)+SEM of SK-BR-3 cells after stimulation with 10, 100 or 1,000 nM of PGE2, sulprostone, L798,106 or both sulprostone and L798,106 is shown. Proliferation rate is normalized to the proliferation rate of the control group. *p≤0.05, comparing each stimulation condition to the control group. EP3 antagonism, EP1/3 agonism and the combination of both all cause a significant reduction of the cell proliferation compared to the control group. |
The combined treatment with both the EP1/3 agonist and the EP3 antagonist did not cause significantly different proliferation rates than the treatment with either the agonist or the antagonist alone (exception: the treatment with 100 nM of both sulprostone and L798,106 resulted in a slightly, but significantly higher proliferation rate than the treatment with 100 nM of L798,106 alone, p=0.046).
In T-47D cells, the treatment with PGE2, sulprostone or L798,106 did not result in significant changes in the cell proliferation rate. The cell proliferation ranged from 91% to 103% without any significant differences (exception: the treatment with 1,000 nM sulprostone lead to a proliferation rate of 91% which was significantly lower than in the control group; p=0.037, see Figure S2).
EP1/3 agonist, EP3 antagonist and the combination of both significantly reduced the migration of SK-BR-3 cells
Since EP3 targeting resulted in a significant reduction of the cell proliferation of SK-BR-3 cells, we investigated their migration ability using a functional wound healing assay. SK-BR-3 cells were treated with 100 or 1,000 nM of PGE2, of sulprostone, of L798,106 or of a combination of both agonist and antagonist for 24 or 48 hrs. PGE2 treatment did not result in a significantly changed cell migration (mean migration rate after the treatment 91%, p=0.487 for both concentrations). The treatment with sulprostone, L798,106 or the combination of both significantly reduced the SK-BR-3 cell migration (Figure 4). After 24 hrs, 100 nM of sulprostone reduced the migration rate to 48% (p=0.037) and 1,000 nM to 49% (p=0.037). 100 nM of L798,106 reduced the migration rate to 54% (p=0.037) and 1,000 nM to 41% (p=0.037). 100 nM of both sulprostone and L798,106 reduced the migration rate of SK-BR-3 cells to 65% (p=0.037) and 1,000 nM of both to 55% (p=0.037). All p-values reflect the comparison with the migration rate of the unstimulated control group.
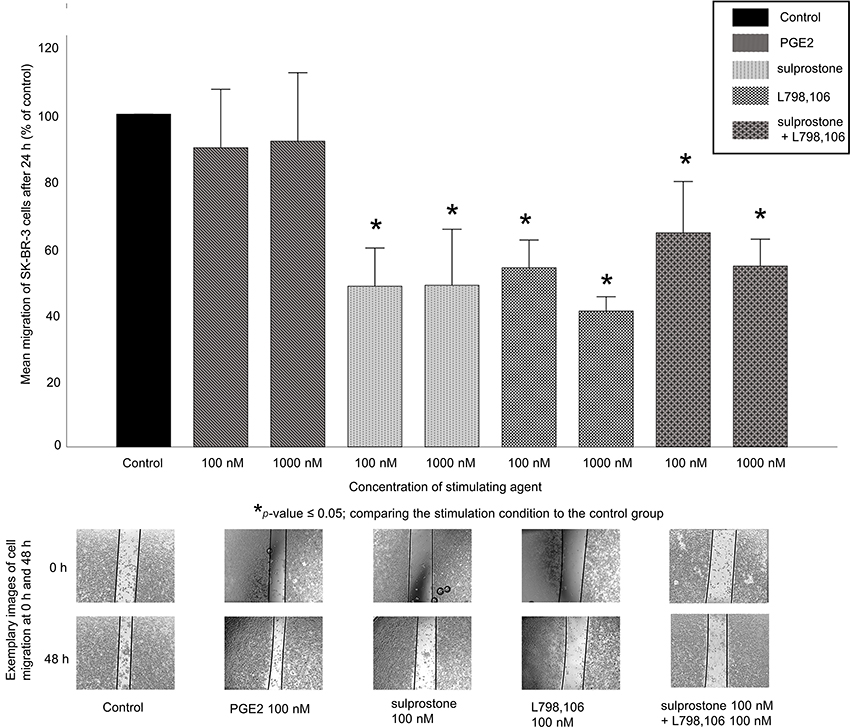 |
Figure 4 Migration of SK-BR-3 cells after stimulation. Top: mean relative migration (n=3)+SEM of SK-BR-3 cells after stimulation with 100 or 1,000 nM of PGE2, sulprostone, L798,106 or both sulprostone and L798,106 for 24 hrs is shown. Migration rate is normalized to the migration rate of the control group. *p≤0.05 comparing each stimulation condition to the control group. Bottom: representative images show SK-BR-3 cell migration into the scratched area after stimulation with 100 nM PGE2, sulprostone, L798,106 or both sulprostone and L798,106 for 48 hrs compared to before stimulation (0 hr). EP3 antagonism, EP1/3 agonism and the combination of both all cause a significant reduction of cell migration compared to the control group. |
The combined treatment with the EP1/3 agonist and the EP3 antagonist did not cause significantly different migration rates than the treatment with either the agonist or the antagonist alone.
Due to the lacking ability of T-47D cells to migrate into a mechanically created scratch area, the migration assay could not be performed for T-47D cells. As T-47D cells had not reacted functionally on EP3 targeting in the proliferation assay and furthermore, T-47D cells were also lacking EP1 expression, we decided not to test T-47D in the following experiment.
As the combined treatment with the EP1/3 agonist and the EP3 antagonist had not led to different results than the treatment with either one alone, we also decided not to test the combination in the following experiment.
EP1/3 agonist and EP3 antagonist decreased Gi-protein expression and increased cAMP levels in SK-BR-3 cells
Known EP3-related pathways include the signaling via a Gi-protein-AC-cAMP pathway, but also the phosphorylation of ERK1/2 to phosphorylated ERK1/2 (p-ERK1/2). We therefore investigated whether the previously described functional effects might be accompanied by variations in the expression levels of these signaling molecules. We analyzed Gi-protein and p-ERK1/2 expression levels in SK-BR-3 cells treated with 10, 100 or 1,000 nM of PGE2, of the EP1/3 agonist sulprostone or of the EP3 antagonist L798,106. We also determined the cAMP concentrations in the respective cell culture supernatants.
The Gi-protein expression in SK-BR-3 cells was not significantly changed by PGE2 treatment (mean expression 106%, p=0.487 for all concentrations). The treatment with sulprostone or with L798,106 reduced the Gi-protein expression in SK-BR-3 cells significantly (Figure 5A). 10 nM of sulprostone reduced the Gi-protein expression to 71% (p=0.037), 100 nM to 69% (p=0.037) and 1,000 nM to 57% (p=0.037). 10 nM of L798,106 reduced the Gi-protein expression to 70% (p=0.037), 100 nM to 80% (p=0.037) and 1,000 nM to 77% (p=0.037). All p-values reflect the comparison with the Gi-protein expression in the unstimulated control group.
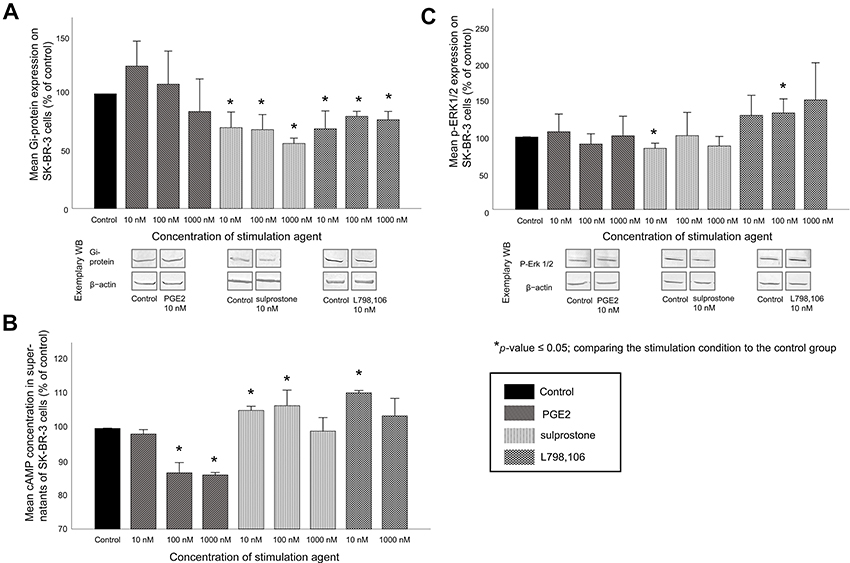 |
Figure 5 EP3 signaling-related molecules in SK-BR-3 cells after stimulation: mean relative protein expression/relative concentration levels (n=3)+SEM in SK-BR-3 cells after stimulation with 10, 100 or 1,000 nM of PGE2, sulprostone and L798,106 are shown. (A) Top: rRelative Gi-protein expression, normalized to β-actin and the to the Gi-protein expression in the control group: EP3 antagonism and EP1/3 agonism cause a significant reduction of Gi-protein expression. Bottom: exemplary Western blots (WB) of Gi-protein and β-actin in the control group and after stimulation with 10 nM of PGE2, sulprostone or L798,106 (B) Relative cAMP-concentration, normalized to the cAMP-concentration in the control group: EP3 antagonism and EP1/3 agonism show a trend to elevated cAMP levels, PGE2 reduces cAMP levels. Stimulation with 100 nM L798,106 is not shown due to technical issues with this sample. (C) Top: relative p-ERK1/2-expression, normalized to β-actin and to the p-ERK1/2 expression in the control group: EP3 antagonism shows a trend to induced pERK-1/2 expression. Bottom: representative Western blots of p-ERK-1/2 and β-actin in the control group and after stimulation with 10 nM of PGE2, sulprostone and L798,106. |
The cAMP concentrations in SK-BR-3 cell culture supernatants were partly reduced by PGE2 treatment (Figure 5B; 10 nM of PGE2: cAMP level 98%, p=0.48. 100 nM of PGE2: 87%, p=0.037. 1,000 nM of PGE2: 86%, p=0.037). The treatment with sulprostone or with L798,106 increased the cAMP levels produced by SK-BR-3 cells significantly. 10 nM of sulprostone increased the cAMP level to 105% (p=0.037) and 100 nM to 107% (p=0.037, no significant increase by treatment with 1,000 nM of sulprostone, cAMP level 99%, p=0.487). 10 nM of L798,106 increased the cAMP concentration significantly to 111% (p=0.037) and 1,000 nM not significantly to 104% (p=0.487). The results of the stimulation with 100 nM of L798,106 are not shown due to technical issues with this sample. All p-values reflect the comparison with the cAMP concentration in the supernatants of the unstimulated control cells.
The p-ERK1/2 expression in SK-BR-3 cells was not significantly changed by PGE2 treatment (mean expression 99.7%, p=0.487 for all concentrations, Figure 5C). The treatment with 10 nM of sulprostone reduced the p-ERK1/2 expression to 84% (p=0.037), but the other concentrations of sulprostone did not change the p-ERK1/2 expression significantly (100 nM of sulprostone: p-ERK1/2 expression 102%, p=0.487, 1,000 nM of sulprostone: 88%, p=0.487). Treatment with 100 nM of L798,106 increased the p-ERK1/2 expression significantly to 133% (p=0.037); 10 and 1,000 nM not significantly to 130% (p=0.487) and 151% (p=0.317), respectively. All p-values reflect the comparison with the p-ERK1/2 expression in the unstimulated control group.
Discussion
Elevated levels of PGE2 caused by COX-2 overexpression are known important factors in breast cancer carcinogenesis. However, studies concerning the role of the EP receptors 1–4 are still rare and the results are conflicting. A recent study of our group showed that EP3 receptor expression in sporadic breast cancer is a positive prognostic factor regarding progression-free and overall survival.22 This present study aimed to find explanations for the observed positive prognostic effect of high EP3 receptor expression by analyzing functional aspects of breast cancer cells after targeting EP3.
To find adequate cell culture models that represent EP3 positive and negative breast tumors, we screened five different breast cancer cell lines for their EP3 expression on mRNA-level and on protein-level. T-47D cells showed the highest EP3 expression on both mRNA- and protein-level. MDA-MB-231 cells showed the lowest mRNA EP3 expression, but a protein EP3 expression could not be detected. The antibody we used detects a specific isoform of EP3. As discussed below, EP3 exists in different isoforms created by alternative splicing31 and the MDA-MB-231 cell line might express an isoform we could not detect by the antibody we used. Therefore, we chose the SK-BR-3 cell line, that showed both the second lowest mRNA EP3 expression and a low EP3 protein-level, for our functional analysis.
We initially aimed to target the EP3 receptor with a specific EP3 agonist to analyze EP3 related cell functions. However, a specific EP3 agonist was not available. Therefore, we chose to stimulate the breast cancer cells with the physiological PGE2, with a specific EP3 antagonist named L796,106 and with the dual EP1/EP3 agonist sulprostone. Since we treated cells with a dual EP1/EP3 agonist, we evaluated the EP1 receptor expression on our selected cell culture models SK-BR-3 and T-47D prior to our functional experiments. This was essential to determine whether sulprostone-related effects might be not only due to EP3 but also due to EP1 signaling. T-47D cells did not express EP1 at all, while in SK-BR-3 cells an EP1 expression could be shown on both the mRNA- and the protein-level.
To evaluate the feedback of targeting EP3 on its expression, we analyzed the EP3 expression on SK-BR-3 and T-47D cells after stimulation with the predefined agents. No feedback regulation on the EP3 expression could be seen on T-47D cells and on SK-BR-3 cells treated with agonists (PGE2, sulprostone). However, EP3 antagonism did significantly reduce the EP3 expression on SK-BR-3 cells. We could not find a demonstration of this negative feedback mechanism in previously published studies.
The main analysis of this study was the evaluation of functional alterations after targeting the EP3 receptor in breast cancer cell lines. The T-47D cell line did not react functionally on EP3 targeting. Therefore, in T-47D cells – even if the EP3 expression was high – the EP3 pathway might not have a significant role in tumor cell biology. This might be caused by the differential expression of various EP3 isoforms in different tumor cell lines, as discussed below.
In the SK-BR-3 cell line, however, EP3 antagonism led to significantly reduced proliferation and migration rates compared to unstimulated cells. This suggests that the EP3 receptor might be a receptor that contributes to tumor growth and metastasis after being stimulated. Concerning these effects, SK-BR-3 breast cancer cells were biologically similar to other gynecological tumor cells like endometrial carcinoma cells. EP3 antagonism has already been shown to reduce cell proliferation and migration of endometrial carcinoma cells.24 But in endometrial carcinoma patients, a high EP3 expression was clinically associated with impaired overall survival as well,24 while EP3 expression was a positive prognostic factor in breast cancer.22 SK-BR-3 is a breast cancer cell line that overexpresses the Her-2 protein. In our previous clinical study concerning the prognostic relevance of EP3 in breast cancer, we could not observe a correlation between Her-2 overexpression and EP3-positivity.22 EP3 positivity was a significant prognostic factor for improved overall survival in both the overall and the Her-2-negative cohort. However, it did not show significant prognostic relevance in the Her-2-positive cohort. This might explain why the biologically tumor-promoting effects of EP3 in SK-BR-3 cells could be contrary to our previously observed clinical effect of high EP3 expression as a positive prognostic factor in breast cancer.
Similar tumor-promoting effects of the EP3 receptor have been demonstrated in other tumor entities. In squamous carcinoma cells, the treatment with an EP3 antagonist (ONO-AE-240) reduced the cell growth.32 A group investigating EP3 linked effects on lung cancer tumorigenesis showed that injection of Lewis lung carcinoma cells in EP3-knockout mice compared to EP3-wildtype mice led to a reduced colony formation of carcinoma cells,33 a reduced angiogenesis,34 lymphangiogenesis35 and a reduced tumor growth.34,35 EP3 inhibition in a non-small cell lung cancer cell line reduced the migration, the invasion and the viability and EP3 silencing in mice strongly reduced the tumor growth, the tumor volume and the tumor metastasis of non-small cell lung cancer.36 Consistent with this data, tumor angiogenesis could be induced by treatment of Lewis lung carcinoma cells with the selective EP3 agonist ONO-AE-248.34 Demonstrated mechanisms of EP3 signaling include the upregulation of matrix metalloproteinase-9 and of vascular endothelial growth factor.33,35 In accordance with our results, all these studies suggest a tumorigenic ability of EP3 and consequentially an anti-tumorigenic effect when inhibited.
In contrast, one further study showed that treatment of breast cancer cells with an EP3 antagonist before injecting them into mice did not have any effect on tumor metastasis.37 In prostate cancer, EP3 antagonism increased tumor growth in vitro, indicating a protective effect of EP3 signaling.38 Consistent with this data, the overexpression of EP3 in prostate cancer cells decreased the tumor growth in vitro and sulprostone seemed to enhance this inhibitory effect.39 However, regarding this study, the non-selective binding of sulprostone to both the EP1 and the EP3 receptor has to be considered. EP3 agonism also reduced the ability of inflammatory breast cancer cells to undergo vasculogenic mimicry, a characteristic of very aggressive tumors.40
In summary, the published EP3-related effects vary and seem to be tissue and cell type specific. Different intracellular pathways might be activated, as discussed below.
As described, EP3 antagonism significantly reduced the cell proliferation and migration of SK-BR-3 cells. However, the treatment with the EP1/3 agonist sulprostone led to a similar result, with a decrease in proliferation and migration rates, as well. Sulprostone is a non-selective EP3 agonist, it is in fact a dual EP1/3 receptor agonist.29 Consequentially, sulprostone-related effects may occur due to EP1 or due to EP3 agonism. Our data suggest that sulprostone’s effects on breast cancer cells are stronger related to EP1 than to EP3 signaling, suggesting an anti-tumorigenic effect of EP1 signaling. In contrast to EP3, the EP1 receptor acts through phospholipase C/inositol triphosphate signaling, leading to increased intracellular calcium levels.16
However, data about the effect of EP1 signaling regarding carcinogenesis are contradictory. A tumorigenic potential of the EP1 receptor could be shown for breast, colon and skin cancer.20,41,42 In contrast to these findings and in accordance with our data, the treatment of breast cancer cells with an EP1 antagonist or silencing EP1 in these cells before injecting them into a murine model, led to an increased amount of lung colonies. This suggests an important effect of EP1 in preventing metastasis.21 The same group showed an impaired overall survival of breast cancer in women lacking nuclear EP1 expression.21 However, possible varying effects of EP1 signaling in the primary tumor and in metastases need to be considered.
To clarify if a combination of the EP3 antagonist with the EP1/3 agonist would further impair SK-BR-3 cell functions, we also treated SK-BR-3 cells with a combination of both agents. We could demonstrate that the combined treatment with both the agonist and the antagonist also reduced cell proliferation and migration of SK-BR-3 cells. However, no further impairment of the proliferation and the migration compared to the treatment with the single agents could be seen. We suppose that when combining both agents, negative feedback or interaction mechanisms might be activated that prevent the further impairment of cell functions. Further studies using gene silencing strategies will contribute to improve our understanding of these mechanisms.
It seems that EP3 (and EP1) related effects are tissue and cell type specific. Contrarieties of these effects may also be due to varying expression of EP3 isoforms. The human EP3 gene consists of ten exons and nine introns that form at least eight isoforms via alternative mRNA splicing.31 These splice variants are characterized by different cytoplasmic C terminal tails. As a result, the EP3 receptor is capable of signaling via decreasing or increasing cAMP levels by activating stimulatory or inhibitory G proteins.43 Data from the literature suggest that EP3 mainly signals via an inhibitory G-protein followed by decreased cAMP levels. However, the tissue distribution of the EP3 isoforms is still unknown.44 This might partly explain the contradictory results of the abovenamed studies targeting EP3.
Besides the Gi-protein coupled pathway, EP3 is also capable to signal via PI3K and ERK.28
To examine which pathway seemed to be influenced the most in SK-BR-3 cells and could possibly explain the reduced proliferation and migration rates shown in our study, we examined Gi-protein expression, cAMP levels and p-ERK1/2 protein expression. After treatment of SK-BR-3 cells with the EP3 antagonist, we could see a significant reduction of the Gi-protein expression and a trend to increased cAMP levels. This suggests that the functional effects measured in our previous experiments might be mainly due to signaling via the Gi protein-AC/cAMP coupled pathway. Signaling via p-ERK1/2 seems to be less relevant as no significant changes, but only a small trend to induced p-ERK1/2 levels could be shown.
Contradictory our findings, Ma et al did not see any cAMP level changes in the murine mammary tumor cells lines 410.4, 410 and 66.1 after stimulation with a specific EP3 antagonist (ONO-AE-208).37 Stimulating MDA-MB-231 cells with a cAMP analog has been shown to inhibit cell migration.45 Similar results could be shown for pancreatic cancer cells, indicating a protective potential of cAMP regarding cell motility and invasiveness.46 In MCF-7 breast cancer cells, cAMP increases estrogen-receptor (ER) beta expression which inhibits estradiol-induced proliferation and migration of breast cancer cells.47 So, the reduced proliferation and migration of SK-BR-3 cells observed in this study - in combination with a Gi-protein decrease an induction of cAMP - might be caused by cAMP-mediated effects like ER beta induction. Similarly, in cervical cancer cells, a cAMP-dependent increase of ER-beta transcription has been described. However, further studies using gene silencing strategies and inhibitors to the Gi/cAMP-pathway will have to clarify these mechanisms.
Taken together, we could demonstrate a significant reduction of SK-BR-3-cell proliferation and migration due to EP3 antagonism, as summarized in Figure 6. This might be caused by a decrease of Gi-protein expression and an increase in cAMP levels. Clearly, our study provides only a preliminary insight into the EP3 signaling in the SK-BR-3 breast cancer cell line and further experiments are necessary to confirm the signaling pathway.
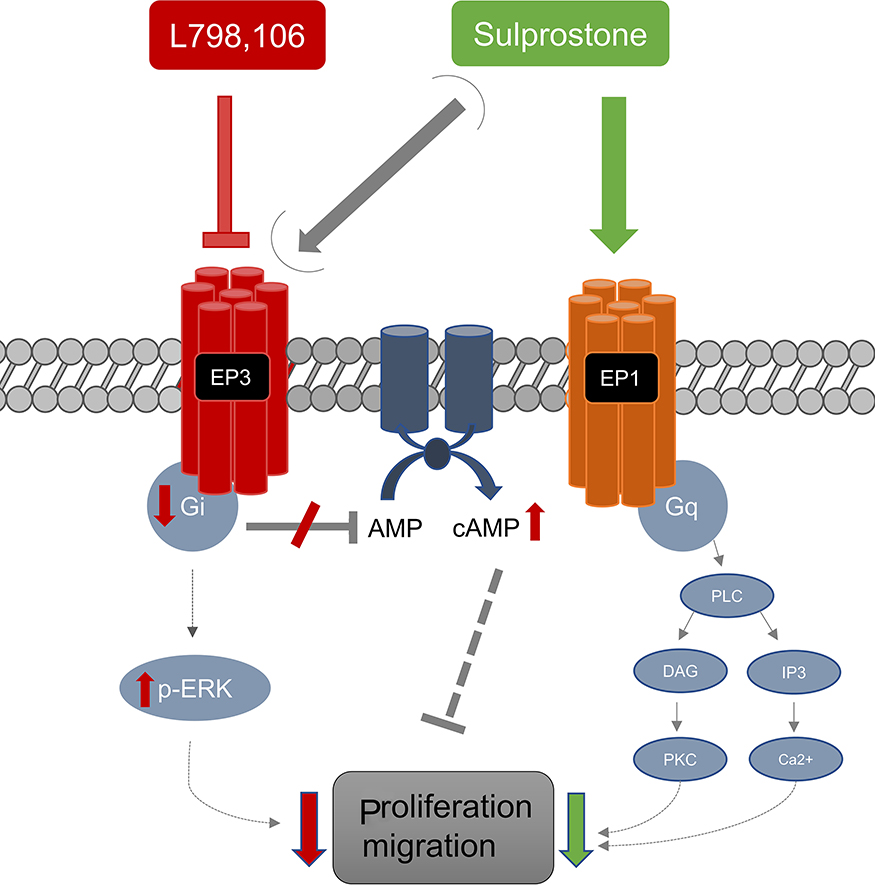 |
Figure 6 EP3-related effects in SK-BR-3 cells. The proposed functional effects and mechanisms shown in this study are summarized. The EP3-antagonist L798,106 reduces cell proliferation and migration of SK-BR-3 cells possibly by reducing the Gi-protein expression and consecutively elevating cAMP. A phosphorylation of ERK1/2 to p-ERK1/2 might play a role as well. Sulprostone (EP1/3-agonist) related effects are possibly more related to EP1-signaling. |
Conclusion
We observed that even if EP3 expression is a clinically positive prognostic factor in breast cancer patients, this cannot be explained by EP3-related effects in tumor cell biology. In accordance with other gynecological tumor entities, eg, endometrial carcinoma cells,24 EP3 antagonism in breast cancer cells leads to decreased proliferation and migration, possibly due to an Gi-protein-cAMP pathway. This suggests that the positive prognostic effect of EP3 might not be explained by tumor cell biology, but by other aspects, like immunological factors in the tumor environment. Our further studies aim to identify these factors to clarify the potential of EP3 as prognostic and therapeutic target in breast cancer.
Data availability
All data are available from the corresponding author on reasonable request.
Acknowledgments
We thank the “Walter-Schulz-Stiftung” for financially supporting this study. We thank Simone Hofmann for excellent technical support as well as Michael Semmlinger and Heather Mullikin for proof-reading of the manuscript for language issues. This study was funded by the Walter-Schulz-Stiftung.
Author contributions
All authors made substantial contributions to conception and design, acquisition of data, or analysis and interpretation of data; took part in drafting the article or revising it critically for important intellectual content; gave final approval of the version to be published; and agree to be accountable for all aspects of the work.
Disclosure
AH reports research grants from Walter-Schulz-Stiftung, during the conduct of the study; grants from Walter-Schulz-Stiftung, personal fees, non-financial support from Roche, personal fees, non-financial support from Pfizer Oncology, outside the submitted work. AH is a speaker and advisory board honorarium for Roche, Germany and honorarium for a symposium from Pfizer Oncology. TK reports grants from Walter-Schulz-Stiftung, during the conduct of the study; and a relative is employed by Roche AG. ND reports grants from MSD, Roche, Astrazeneca, Omniamed, TEVA, and Mentor, outside the submitted work. SM received research support, advisory board, honoraria and travel expenses from AstraZeneca, Clovis, Medac, Novartis, MSD, Olympus Europa, PharmaMar, Roche, Sensor Kinesis, Tesaro and Teva. TMK was employed at Roche at the time of manuscript submission and reports personal fees from Roche, outside the submitted work. All authors report no other conflicts of interest in this work.
References
1. Feng Y, Spezia M, Huang S, et al. Breast cancer development and progression: risk factors, cancer stem cells, signaling pathways, genomics, and molecular pathogenesis. Genes Dis. 2018;5(2):77–106. doi:10.1016/j.gendis.2018.05.001
2. Gobbini E, Ezzalfani M, Dieras V, et al. Time trends of overall survival among metastatic breast cancer patients in the real-life ESME cohort. Eur J Cancer (Oxford, England: 1990). 2018;96:17–24. doi:10.1016/j.ejca.2018.03.015
3. Fisher B, Bauer M, Wickerham DL, et al. Relation of number of positive axillary nodes to the prognosis of patients with primary breast cancer. An NSABP update. Cancer. 1983;52(9):1551–1557.
4. Hilsenbeck SG, Ravdin PM, de Moor CA, Chamness GC, Osborne CK, Clark GM. Time-dependence of hazard ratios for prognostic factors in primary breast cancer. Breast Cancer Res Treat. 1998;52(1–3):227–237.
5. Brown RW, Allred CD, Clark GM, Osborne CK, Hilsenbeck SG. Prognostic value of Ki-67 compared to S-phase fraction in axillary node-negative breast cancer. Clin Cancer Res. 1996;2(3):585–592.
6. Yarden Y. Biology of HER2 and its importance in breast cancer. Oncology. 2001;61(Suppl 2):1–13. doi:10.1159/000055396
7. Escriva-de-Romani S, Arumi M, Bellet M, Saura C. HER2-positive breast cancer: current and new therapeutic strategies. Breast. 2018;39:80–88. doi:10.1016/j.breast.2018.03.006
8. Lobbezoo DJ, van Kampen RJ, Voogd AC, et al. Prognosis of metastatic breast cancer subtypes: the hormone receptor/HER2-positive subtype is associated with the most favorable outcome. Breast Cancer Res Treat. 2013;141(3):507–514. doi:10.1007/s10549-013-2711-y
9. Williams CS, Mann M, DuBois RN. The role of cyclooxygenases in inflammation, cancer, and development. Oncogene. 1999;18(55):7908–7916. doi:10.1038/sj.onc.1203286
10. Reader J, Holt D, Fulton A. Prostaglandin E2 EP receptors as therapeutic targets in breast cancer. Cancer Metastasis Rev. 2011;30(3–4):449–463. doi:10.1007/s10555-011-9303-2
11. Howe LR. Inflammation and breast cancer. Cyclooxygenase/prostaglandin signaling and breast cancer. Breast Cancer Res. 2007;9(4):210. doi:10.1186/bcr1678
12. Ristimaki A, Sivula A, Lundin J, et al. Prognostic significance of elevated cyclooxygenase-2 expression in breast cancer. Cancer Res. 2002;62(3):632–635.
13. Rozic JG, Chakraborty C, Lala PK. Cyclooxygenase inhibitors retard murine mammary tumor progression by reducing tumor cell migration, invasiveness and angiogenesis. Int J Cancer. 2001;93(4):497–506.
14. Harris RE, Beebe-Donk J, Alshafie GA. Reduction in the risk of human breast cancer by selective cyclooxygenase-2 (COX-2) inhibitors. BMC Cancer. 2006;6:27. doi:10.1186/1471-2407-6-27
15. Sugimoto Y, Narumiya S. Prostaglandin E receptors. J Biol Chem. 2007;282(16):11613–11617. doi:10.1074/jbc.R600038200
16. Majumder M, Xin X, Liu L, Girish GV, Lala PK. Prostaglandin E2 receptor EP4 as the common target on cancer cells and macrophages to abolish angiogenesis, lymphangiogenesis, metastasis, and stem-like cell functions. Cancer Sci. 2014;105(9):1142–1151. doi:10.1111/cas.2014.105.issue-9
17. Majumder M, Nandi P, Omar A, Ugwuagbo KC, Lala PK. EP4 as a therapeutic target for aggressive human breast cancer. Int J Mol Sci. 2018;19:4. doi:10.3390/ijms19041019
18. Cheuk IW, Shin VY, Siu MT, et al. Association of EP2 receptor and SLC19A3 in regulating breast cancer metastasis. Am J Cancer Res. 2015;5(11):3389–3399.
19. Kawamori T, Uchiya N, Nakatsugi S, et al. Chemopreventive effects of ONO-8711, a selective prostaglandin E receptor EP(1) antagonist, on breast cancer development. Carcinogenesis. 2001;22(12):2001–2004.
20. Ma X, Kundu N, Ioffe OB, et al. Prostaglandin E receptor EP1 suppresses breast cancer metastasis and is linked to survival differences and cancer disparities. Mol Cancer Res. 2010;8(10):1310–1318. doi:10.1158/1541-7786.MCR-10-0003
21. Semmlinger A, von Schoenfeldt V, Wolf V, et al. EP3 (prostaglandin E2 receptor 3) expression is a prognostic factor for progression-free and overall survival in sporadic breast cancer. BMC Cancer. 2018;18(1):431. doi:10.1186/s12885-018-4242-8
22. Heidegger H, Dietlmeier S, Ye Y, et al. The prostaglandin EP3 receptor is an independent negative prognostic factor for cervical cancer patients. Int J Mol Sci. 2017;18:7. doi:10.3390/ijms18071571
23. Zhu J, Trillsch F, Mayr D, et al. Prostaglandin receptor EP3 regulates cell proliferation and migration with impact on survival of endometrial cancer patients. Oncotarget. 2018;9(1):982–994. doi:10.18632/oncotarget.23140
24. Kim SO, Dozier BL, Kerry JA, Duffy DM. EP3 receptor isoforms are differentially expressed in subpopulations of primate granulosa cells and couple to unique G-proteins. Reproduction. 2013;146(6):625–635. doi:10.1530/REP-13-0274
25. Ma J, Chen M, Xia SK, et al. Prostaglandin E2 promotes liver cancer cell growth by the upregulation of FUSE-binding protein 1 expression. Int J Oncol. 2013;42(3):1093–1104. doi:10.3892/ijo.2013.1782
26. Orie NN, Clapp LH. Role of prostanoid IP and EP receptors in mediating vasorelaxant responses to PGI2 analogues in rat tail artery: evidence for Gi/o modulation via EP3 receptors. Eur J Pharmacol. 2011;654(3):258–265. doi:10.1016/j.ejphar.2010.12.005
27. Fujino H, Toyomura K, Chen X-B, Regan JW, Murayama T. Prostaglandin E(2) regulates cellular migration via induction of vascular endothelial growth factor receptor-1 in HCA-7 human colon cancer cells. Biochem Pharmacol. 2011;81(3):379–387. doi:10.1016/j.bcp.2010.11.001
28. Narumiya S, Sugimoto Y, Ushikubi F. Prostanoid receptors: structures, properties, and functions. Physiol Rev. 1999;79(4):1193–1226. doi:10.1152/physrev.1999.79.4.1193
29. ONO-AE-248 [webpage on the Internet]. Morrisville, NC: MedKoo Biosciences, Inc. Available from: https://medkoo.com/products/14256 . Accessed March 19, 2018.
30. Kotani M, Tanaka I, Ogawa Y, et al. Structural organization of the human prostaglandin EP3 receptor subtype gene (PTGER3). Genomics. 1997;40(3):425–434. doi:10.1006/geno.1996.4585
31. Hoshikawa H, Goto R, Mori T, Mitani T, Mori N. Expression of prostaglandin E2 receptors in oral squamous cell carcinomas and growth inhibitory effects of an EP3 selective antagonist, ONO-AE3-240. Int J Oncol. 2009;34(3):847–852.
32. Amano H, Ito Y, Suzuki T, et al. Roles of a prostaglandin E-type receptor, EP3, in upregulation of matrix metalloproteinase-9 and vascular endothelial growth factor during enhancement of tumor metastasis. Cancer Sci. 2009;100(12):2318–2324. doi:10.1111/j.1349-7006.2009.01322.x
33. Amano H, Hayashi I, Endo H, et al. Host prostaglandin E(2)-EP3 signaling regulates tumor-associated angiogenesis and tumor growth. J Exp Med. 2003;197(2):221–232.
34. Kubo H, Hosono K, Suzuki T, et al. Host prostaglandin EP3 receptor signaling relevant to tumor-associated lymphangiogenesis. Biomed Pharmacother. 2010;64(2):101–106. doi:10.1016/j.biopha.2009.04.039
35. Li L, Lv Y, Yan D. Inhibition of Ep3 attenuates migration and promotes apoptosis of non-small cell lung cancer cells via suppression of TGF-beta/Smad signaling. Oncol Lett. 2018;16(5):5645–5654. doi:10.3892/ol.2018.9391
36. Ma X, Kundu N, Rifat S, Walser T, Fulton AM. Prostaglandin E receptor EP4 antagonism inhibits breast cancer metastasis. Cancer Res. 2006;66(6):2923–2927. doi:10.1158/0008-5472.CAN-05-4348
37. Kashiwagi E, Shiota M, Yokomizo A, et al. Prostaglandin receptor EP3 mediates growth inhibitory effect of aspirin through androgen receptor and contributes to castration resistance in prostate cancer cells. Endocr Relat Cancer. 2013;20(3):431–441. doi:10.1530/ERC-12-0344
38. Huang HF, Shu P, Murphy TF, Aisner S, Fitzhugh VA, Jordan ML. Significance of divergent expression of prostaglandin EP4 and EP3 receptors in human prostate cancer. Mol Cancer Res. 2013;11(4):427–439. doi:10.1158/1541-7786.MCR-12-0464
39. Robertson FM, Simeone AM, Lucci A, McMurray JS, Ghosh S, Cristofanilli M. Differential regulation of the aggressive phenotype of inflammatory breast cancer cells by prostanoid receptors EP3 and EP4. Cancer. 2010;116(11 Suppl):2806–2814. doi:10.1002/cncr.25167
40. Watanabe K, Kawamori T, Nakatsugi S, et al. Role of the prostaglandin E receptor subtype EP1 in colon carcinogenesis. Cancer Res. 1999;59(20):5093–5096.
41. Thompson EJ, Gupta A, Vielhauer GA, Regan JW, Bowden GT. The growth of malignant keratinocytes depends on signaling through the PGE(2) receptor EP1. Neoplasia (New York, NY). 2001;3(5):402–410. doi:10.1038/sj.neo.7900182
42. Woodward DF, Jones RL, Narumiya S. International union of basic and clinical pharmacology. LXXXIII: classification of prostanoid receptors, updating 15 years of progress. Pharmacol Rev. 2011;63(3):471–538. doi:10.1124/pr.110.003517
43. Breyer RM, Bagdassarian CK, Myers SA, Breyer MD. Prostanoid receptors: subtypes and signaling. Annu Rev Pharmacol Toxicol. 2001;41:661–690. doi:10.1146/annurev.pharmtox.41.1.661
44. Dong H, Claffey KP, Brocke S, Epstein PM. Inhibition of breast cancer cell migration by activation of cAMP signaling. Breast Cancer Res Treat. 2015;152(1):17–28. doi:10.1007/s10549-015-3445-9
45. Zimmerman NP, Roy I, Hauser AD, Wilson JM, Williams CL, Dwinell MB. Cyclic AMP regulates the migration and invasion potential of human pancreatic cancer cells. Mol Carcinog. 2015;54(3):203–215. doi:10.1002/mc.22091
46. Ma L, Liu Y, Geng C, Qi X, Jiang J. [Corrigendum] Estrogen receptor beta inhibits estradiol-induced proliferation and migration of MCF-7 cells through regulation of mitofusin 2. Int J Oncol. 2016;49(5):2187.
47. Coleman KM, Dutertre M, El-Gharbawy A, Rowan BG, Weigel NL, Smith CL. Mechanistic differences in the activation of estrogen receptor-alpha (ER alpha)- and ER beta-dependent gene expression by cAMP signaling pathway(s). J Biol Chem. 2003;278(15):12834–12845. doi:10.1074/jbc.M212312200
Supplementary material
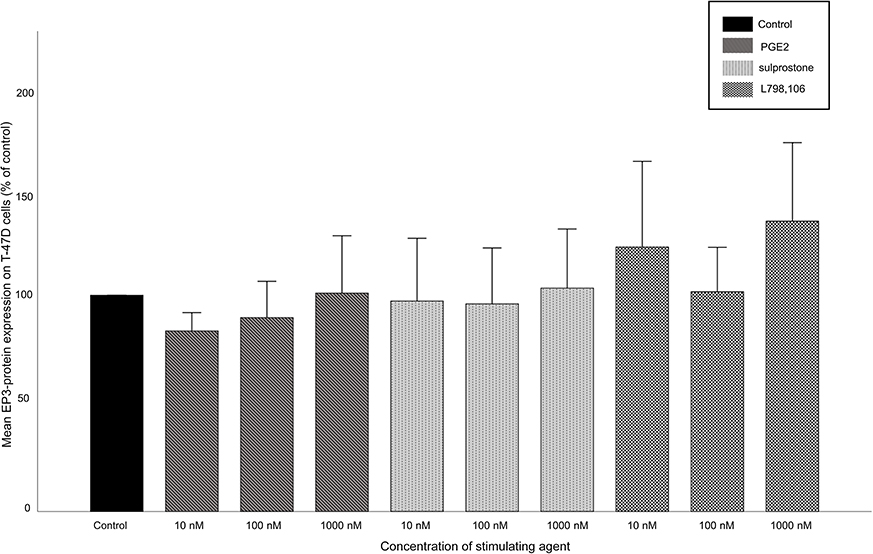 |
Figure S1 EP3 expression on T-47D cells after stimulation. Mean relative EP3 expression (n=3)+SEM in T-47D cells after stimulation with 10, 100 or 1,000 nM of PGE2, sulprostone or L798,106 is shown. Relative expression is normalized to β-actin and to the EP3 expression in the control group. The EP3 expression is not significantly influenced by any stimulation condition. |
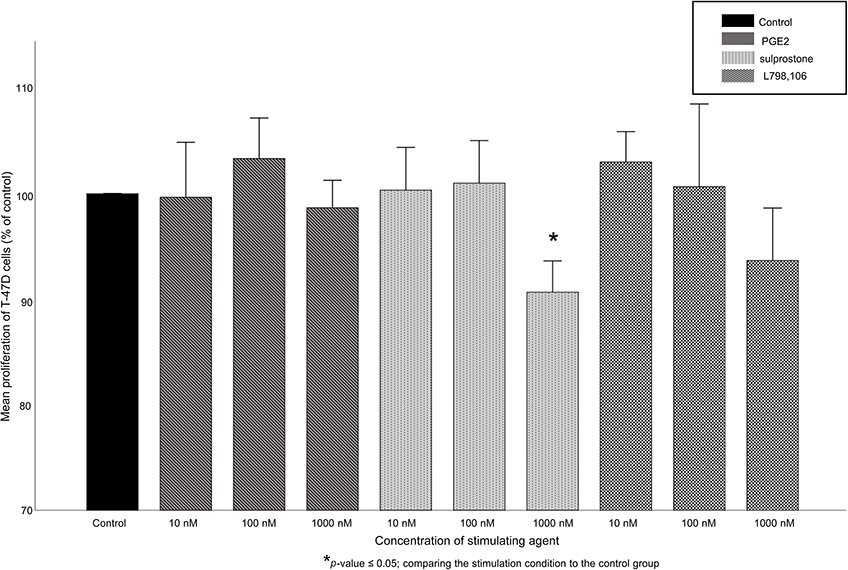 |
Figure S2 Proliferation of T-47D cells after stimulation. Mean relative proliferation (n=3)+SEM of T-47D cells after stimulation with 10, 100 or 1,000 nM of PGE2, sulprostone or L798,106 is shown. Proliferation rate is normalized to the proliferation rate of the control group. *p≤0.05, comparing each stimulation condition to the control group. Proliferation is not clearly influenced by stimulation. |
 © 2019 The Author(s). This work is published and licensed by Dove Medical Press Limited. The
full terms of this license are available at https://www.dovepress.com/terms
and incorporate the Creative Commons Attribution
- Non Commercial (unported, 3.0) License.
By accessing the work you hereby accept the Terms. Non-commercial uses of the work are permitted
without any further permission from Dove Medical Press Limited, provided the work is properly
attributed. For permission for commercial use of this work, please see paragraphs 4.2 and 5 of our Terms.
© 2019 The Author(s). This work is published and licensed by Dove Medical Press Limited. The
full terms of this license are available at https://www.dovepress.com/terms
and incorporate the Creative Commons Attribution
- Non Commercial (unported, 3.0) License.
By accessing the work you hereby accept the Terms. Non-commercial uses of the work are permitted
without any further permission from Dove Medical Press Limited, provided the work is properly
attributed. For permission for commercial use of this work, please see paragraphs 4.2 and 5 of our Terms.