Back to Journals » International Journal of Chronic Obstructive Pulmonary Disease » Volume 13
Eosinophil counts in first COPD hospitalizations: a 1-year cost analysis in Quebec, Canada
Authors Poder TG ![]() , Carrier N, Bélanger M, Couillard S, Courteau J, Larivée P, Vanasse A
, Carrier N, Bélanger M, Couillard S, Courteau J, Larivée P, Vanasse A
Received 11 April 2018
Accepted for publication 5 August 2018
Published 8 October 2018 Volume 2018:13 Pages 3065—3076
DOI https://doi.org/10.2147/COPD.S170747
Checked for plagiarism Yes
Review by Single anonymous peer review
Peer reviewer comments 6
Editor who approved publication: Prof. Dr. Richard Russell
Thomas G Poder1–3 Nathalie Carrier,1 Maryse Bélanger,1,4 Simon Couillard,1,4 Josiane Courteau,1 Pierre Larivée,1,4 Alain Vanasse1,3
1Research Center, Centre Hospitalier Universitaire de Sherbrooke, Sherbrooke, QC, Canada; 2Health Technology Assessment Unit, UETMIS, CIUSSS de l’Estrie – CHUS, Sherbrooke, QC, Canada; 3Department of Family Medicine and Emergency Medicine, Faculty of Medicine and Health Sciences, Université de Sherbrooke, Sherbrooke, QC, Canada; 4Respirology Service Department of Medicine, Faculty of Medicine and Health Sciences, Université de Sherbrooke, Sherbrooke, QC, Canada
Background: Exacerbations explain much of the cost of COPD. Higher blood eosinophil cell counts at admission for acute exacerbation of COPD increase the risk of subsequent exacerbations and hospitalizations. However, there is no literature on the economic burden of patients with this inflammatory profile. The objective of this study is to assess the cost of health-care service utilization according to different counts of blood eosinophils.
Methods: The observational retrospective cohort included all first hospitalizations for COPD exacerbation between April 2006 and March 2013. The eosinophilic group was defined by blood eosinophil counts on admission ≥200 cells/µL and/or ≥2% of the total white blood cell count. Study outcomes were: total costs (2016 Canadian dollars) (index hospitalization and 1-year follow-up), total index hospitalization costs, total 1-year costs (all-cause readmissions, ambulatory and emergency service use), and 1-year COPD-related costs (only cost for COPD after initial discharge). Sensitivity analyses were conducted to evaluate the impact of different eosinophil cut-offs on outcomes.
Results: In total, 479 patients were included, 173 in the eosinophilic group (92 in the higher cut-off). The average total cost was $18,263 ($6,706 for the index hospitalization), without significant difference between groups (P=0.3). The average 1-year COPD-related cost was higher in the eosinophilic group ($3,667 vs $2,472, P=0.006), with an adjusted mean difference of $1,416. Analysis of data using the higher cut-off of ≥400 cells or ≥3% was associated with a slightly larger difference in 1-year COPD-related costs between groups ($4,060 vs $2,629, P=0.003), with an adjusted mean difference of $1,640.
Conclusion: A higher blood eosinophil cell count at admission for a first hospitalization is associated with an increase in total 1-year COPD-related costs.
Keywords: chronic obstructive pulmonary disease, exacerbations, health-care utilization, cohort study, Canada, Quebec
Introduction
Patients with COPD have a high social (eg, health-related quality of life) and economic impact for society.1 In Canada, COPD accounts for the highest rates of hospitalization and highest number of readmissions.2 Inpatient readmissions within 30 days of discharge cost approximately $1.8 billion (Canadian dollars [CAD]) to the Canadian health-care system and readmissions account for 8.5% of all hospitalizations.2 In the USA, in 2008, costs for hospital stays with COPD as a principal diagnosis were $6.1 billion (US dollars [USD]) (including $3.8 billion USD for COPD with acute exacerbation), with an average cost per stay of $7,500 USD.3 The annual cost of COPD per patient varies between $2,000 and $16,000 USD depending on the severity of the disease.4 Exacerbations increase medical visits and hospitalizations, explaining 35%–70% of the cost of health-care services for COPD.5–7 A review by Toy et al in 2010 demonstrated large differences in cost per exacerbation, ranging from $88 to $7,757 USD.8 In Canada, Mittmann et al estimated that the overall burden of exacerbations was in the range of $646 million to $736 million CAD per annum.9 The largest cost of COPD exacerbation is explained by hospitalizations7–12 and the cost is highly correlated with the severity of exacerbation.7–10,13
To our knowledge, there is no literature on the economic burden of eosinophilic COPD patients. However, some authors have shown that eosinophilic patients are at greater risk of exacerbations and readmissions.14,15 Couillard et al found that blood eosinophil counts can be used as a biomarker in severe COPD exacerbations for predicting higher readmission rates, especially COPD-related readmissions.14 In their review in 2017, Bafadhel et al also concluded that higher eosinophil cell counts are predictive of an increased risk of COPD exacerbations.15
Considering that higher eosinophil counts are associated with an increased risk of exacerbations and readmissions, our hypothesis is that higher blood eosinophil counts will be associated with greater costs in COPD patients. Thus, the main objective of this study was to assess the cost of health-care service utilization according to different blood eosinophil counts.
Material and methods
Study design and data sources
This was a non-interventional observational cohort study using linked real-world clinical and medical administrative data. The cohort was extracted from the Centre Informatisé de Recherche Évaluative en Services et Soins de Santé (CIRESSS) system of the Centre Hospitalier Universitaire de Sherbrooke (CHUS) in the province of Quebec, Canada.
The cohort included all patients hospitalized at the CHUS between April 2006 and March 2013 with a main diagnosis of COPD and discharged alive. Data were linked to the provincial administrative data coming from the Régie de l’assurance maladie du Québec (RAMQ) and the Ministère de la santé et des services sociaux (MSSS) to obtain all health-care services used and outcomes in the year following the index hospitalization.
The CIRESSS system manages clinical and pathological data obtained from the computerized records of patients in the Eastern Townships in Quebec. The RAMQ owns and manages health administrative databases including a hospital discharge register (MED-ECHO), patients’ demographic information, physicians’ services, and the provincial drug insurance plan. MED-ECHO contains information on dates of acute-care hospitalizations, interventions, and main and secondary diagnoses encountered during hospitalizations. Using a unique encrypted identifier, patient files from different sources were linked to provide demographic characteristics, medical, and clinical information.
A manual extraction was performed to collect: smoking status; home oxygen use; baseline pulmonary function test (PFT) results up to 1 year following index hospitalization (PFT used, in order of priority: most recent PFT <5 years prior to admission, PFT >1 year after discharge, and PFT between 1998 and <5 years prior); baseline and discharge inhaler therapy; corticosteroid use within 48 hours before index admission, according to patients’ outpatient medication list and medical notes; inpatient definitive treatment components, such as corticosteroids and/or antimicrobial agents; and date and time of the first corticosteroid dose.
Calculation of the time lapse between systemic corticosteroid administration and phlebotomy for complete blood count (CBC) was established by manual extraction of data (exact time of administration of medications in nursing files or medical/pharmaceutical histories indicating ambulatory use of corticosteroid), coupled with electronic data regarding time of venipuncture. Dates of deaths were identified in the hospital database and in the RAMQ database.
Study population
Inclusion criteria
The inclusion criteria were: all patients 40–84 years old hospitalized for COPD (main diagnosis ICD-10: J40–J44, COPD according to spirometry results, and current or former smokers with at least 10 pack-years) at the CHUS between April 2006 and March 2013, discharged alive, without a previous hospitalization for asthma in the past 5 years. As done previously, the choice to include only patients treated with at least two respiratory drugs during hospitalization was made to increase the likelihood of a correct COPD diagnosis.16,17
Exclusion criteria
Further exclusion criteria were defined as follows: pneumonia, absence of obstructive pattern on PFT results, absence of a valid PFT result any time between 1998 and 1 year after the index hospitalization, COPD without exacerbation, and subjects mislabeled as asthmatic (never-smokers with obstructive spirometry results and no mention of COPD in medical records). These exclusion criteria were applied to increase the specificity of the diagnosis. Patients purely labeled as asthmatics were excluded, but we included patients with asthma–COPD overlap (ACO). Unfortunately, we could not accurately identify ACO patients owing to the lack of a definition of this entity in the years of our retrospective study. In order to select only patients with a “first” COPD hospitalization, patients hospitalized for COPD in the previous 5 years before the index hospitalization were excluded. Patients who were not “corticosteroid free” at the time of blood sampling (defined as systemic corticosteroid use between 1 and 48 hours before venipuncture) were also excluded to insure the validity of blood eosinophil cell counts. Each patient was followed for the first year (365 days) after being discharged alive from the index hospitalization.
Study outcomes and calculation method
The perspective of analysis was for the Quebec health-care network. Costs were calculated considering index hospitalization and health-care service utilizations during the 1-year follow-up period (readmission, ambulatory, and emergency costs). Study outcomes were total costs (those of the index hospitalization and those incurred during the 1-year follow-up), total index hospitalization costs, total 1-year all-cause costs, and total 1-year COPD-related costs. Unless otherwise specified, all costs were expressed in 2016 CAD. The details of the calculations are provided in Table S1. When appropriate, an exchange rate in USD was considered in July 2016 (1 CAD=1.303 USD) to facilitate comparison with existing literature.
Hospitalization costs
The hospitalization costs were calculated with an index reflecting the relative intensity level of resources used (niveau d’intensité relative des ressources utilisées [NIRRU]). The MSSS established that a NIRRU corresponded to $5,464.83 (including direct and indirect costs) for the budget year 2015–2016 for the CHUS. The NIRRU does not include the cost of emergency visits or physicians’ fees, and does not entirely reflect the cost of intensive care. The physician’s fee at hospitalization was estimated as the sum of a base of $150 and $104.10 by day of hospitalization. For each hospitalization, if the patient has stayed in an intensive care unit (ICU), regardless of the duration, an amount of $309.25 was added. Except for the NIRRU, these data are derived from a previous study about hospitalization costs for COPD patients in Quebec.18
Ambulatory costs
For each ambulatory medical service, the data provided by the RAMQ included procedure codes to calculate physicians’ fees. We used the unit cost for each different procedure code in the billing manuals for general practitioners and specialist physicians produced by the RAMQ and adjusted in for the year 2015–2016.19–21 We excluded emergency procedures. The ambulatory cost was the sum of all costs for each procedure code by patient.
Emergency costs
Unless specified otherwise, the cost of an emergency visit was set at $425.61, considering a running cost of $257.71 and a physician’s fee of $167.90. The running cost for an emergency was drawn from Poder et al18 and the physician’s fee from the billing manuals for general practitioners and specialist physicians produced by the RAMQ and adjusted for the year 2015–2016. We considered that each patient went through the emergency department before being admitted for the index hospitalization, as is our practice in Canada. For readmissions occurring during the 1-year follow-up period, we evaluated whether the date of readmission coincided with an emergency procedure. In these cases, the exact physician’s fee incurred by the RAMQ was added to the aforementioned aggregate running cost of $257.71. For visits that did not coincide (about 20%), patients were likely to move from an outpatient clinic to hospitalization or patients were transferred from another center. As this information could not be verified, an amount of $15 (operating cost excluding physician’s fee) was used, considering that they arrived from an outpatient clinic.
Total index hospitalization cost
For the index hospitalization, we assumed that each patient went through the emergency department before hospitalization. The total cost was the sum of costs for hospitalization, considering the resources used (NIRRU), the physicians’ fees, the emergency costs, and, if applicable, additional costs related to the ICU stay.
Total 1-year costs (all-cause and COPD-related)
The total 1-year all-cause cost was the sum of costs incurred during 1-year follow-up, including readmissions, emergency and ambulatory medical services (excluding the index hospitalization). The total 1-year COPD-related costs included these same components only if the visit or physician’s diagnosis was related to COPD (ICD-9: 491, 492, 496; ICD-10: J40–J44).
Total cost
The total cost was the sum of the total index hospitalization cost and the total 1-year all-cause cost.
Independent variable
The main independent variable was a blood eosinophil cell count ≥200 cells/mL and/or ≥2% of the total white blood cell (WBC) count on the first inpatient CBC available during the index hospitalization (including emergency department care). This threshold has previously shown high sensitivity for predicting sputum eosinophilia and was thus considered to indicate an “eosinophilic COPD patient”.22,23 According to the sensitivity analyses conducted on our data, a threshold of blood eosinophil cell count ≥400 cells/mL and/or ≥3% of the total WBC count was also chosen. This will show whether costs increase with a higher threshold.
Covariables
Other variables considered in statistical models included: age, gender, smoking status (ex-smoker, current smoker), WBC count at admission, FEV1, FEV1/FVC ratio, Global Initiative for Chronic Obstructive Lung Disease (GOLD) stage (according to FEV1), home oxygen use, ICU stay (yes/no), intubation and mechanical ventilation (yes/no), baseline and discharge COPD-related medication, index hospital length of stay, intensity of used care index (NIRRU), Charlson Comorbidity Index (CCI), and specific comorbidities (cardiovascular disease [CVD], diabetes, asthma, mental disorders). Respiratory drugs, short-acting beta antagonist (SABA), long-acting β-agonist (LABA), long-acting muscarinic antagonist (LAMA), inhaled corticosteroid (ICS), and theophylline, were evaluated during the index hospitalization and at hospital discharge. These variables were selected because they may influence the main outcome. The D’Hoore et al version of the CCI was calculated using diagnoses reported during a hospitalization or during a physician’s visit in the year prior to and including the index hospitalization.24
Statistical analyses
Patients’ characteristics were compared between groups using the chi-squared test for categorical variables and the Student’s t-test or Mann–Whitney U test for continuous data. Costs are presented with means and 95% CIs and were compared between groups with the Mann–Whitney U test, considering that costs had non-normal distributions. Costs were categorized to better evaluate the distribution of data, and then compared among groups using a chi-squared test. Multivariate models were computed to estimate adjusted costs according to eosinophilic groups and other covariables. All covariables were compared to all costs and only variables with a P-value <0.1 were introduced in multivariate models. Eosinophils were included even if the P-value was not significant to evaluate the adjusted effect of eosinophils on costs. Each adjusted cost was the estimate for eosinophils obtained in the multivariate model corresponding to the difference in cost for the eosinophilic compared to the non-eosinophilic group, adjusted for other covariables in the model. A general linear model with log link and gamma distribution was used when individual patient costs were known.25 For costs including a large number of zeros, which is the case for variables at 1 year post-index, the Tobit model was used to estimate adjusted costs.26 Analyses were performed with SAS (version 9.4; SAS Institute Inc, Cary, NC, USA) and IBM SPSS Statistics version 24 (IBM Corp., Armonk, NY, USA). A P-value ≤0.05 was considered as a significant difference.
Ethical approval
This project was approved by the institutional ethics committee (Comité d’éthique de la recherche of the CIUSSS de l’Estrie; CHUS #2014-696, 13-181).
Results
Between April 2006 and March 2013, 1,440 patients aged 40–84 years were hospitalized for a severe COPD exacerbation. Of them, 1,129 patients (78.4%) had a “first” COPD hospitalization (ie, no previous hospitalization over the 5 years before the index hospitalization). After applying other exclusion criteria, 479 patients (42.4%) were retained (Figure 1). Considering a threshold of blood eosinophil cell count ≥200 cells/mL and/or ≥2% of the total WBC count, 173 patients (36.1%) were eosinophilic and characteristics were similar between groups (Table 1).
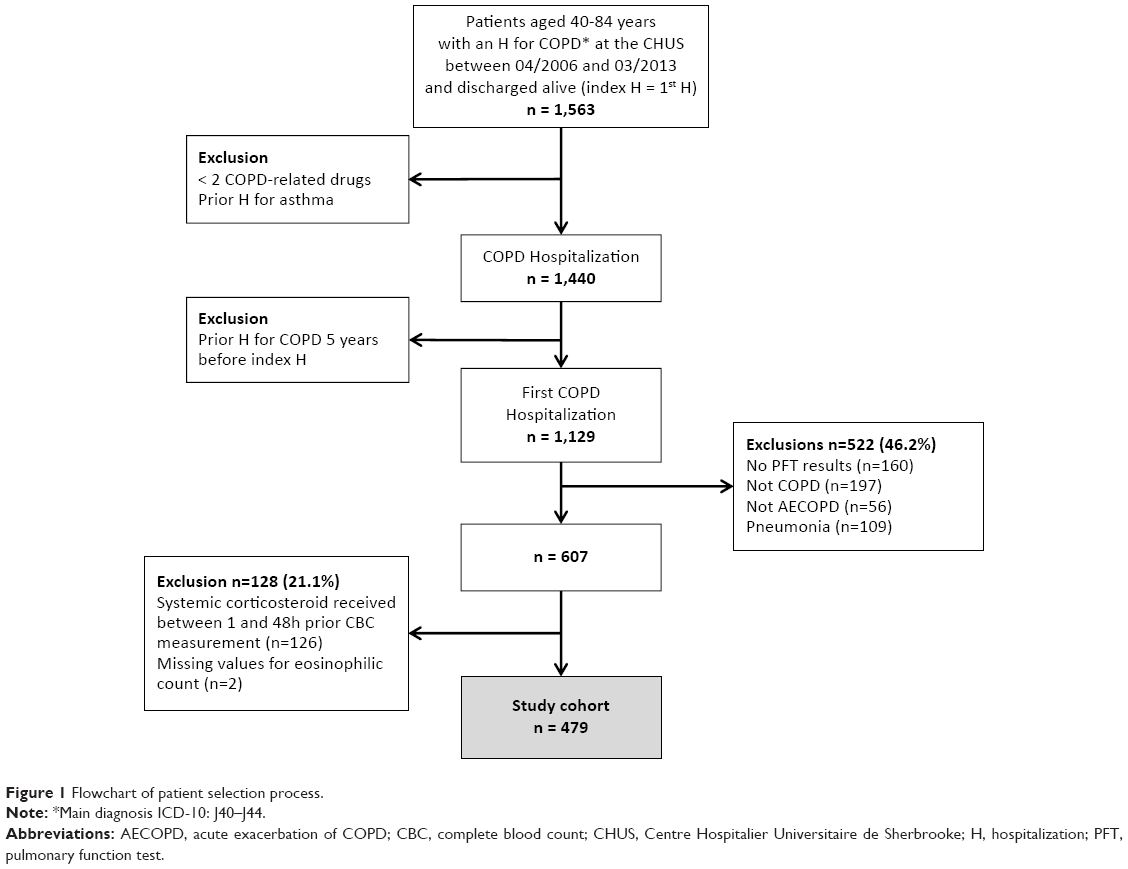 | Figure 1 Flowchart of patient selection process. |
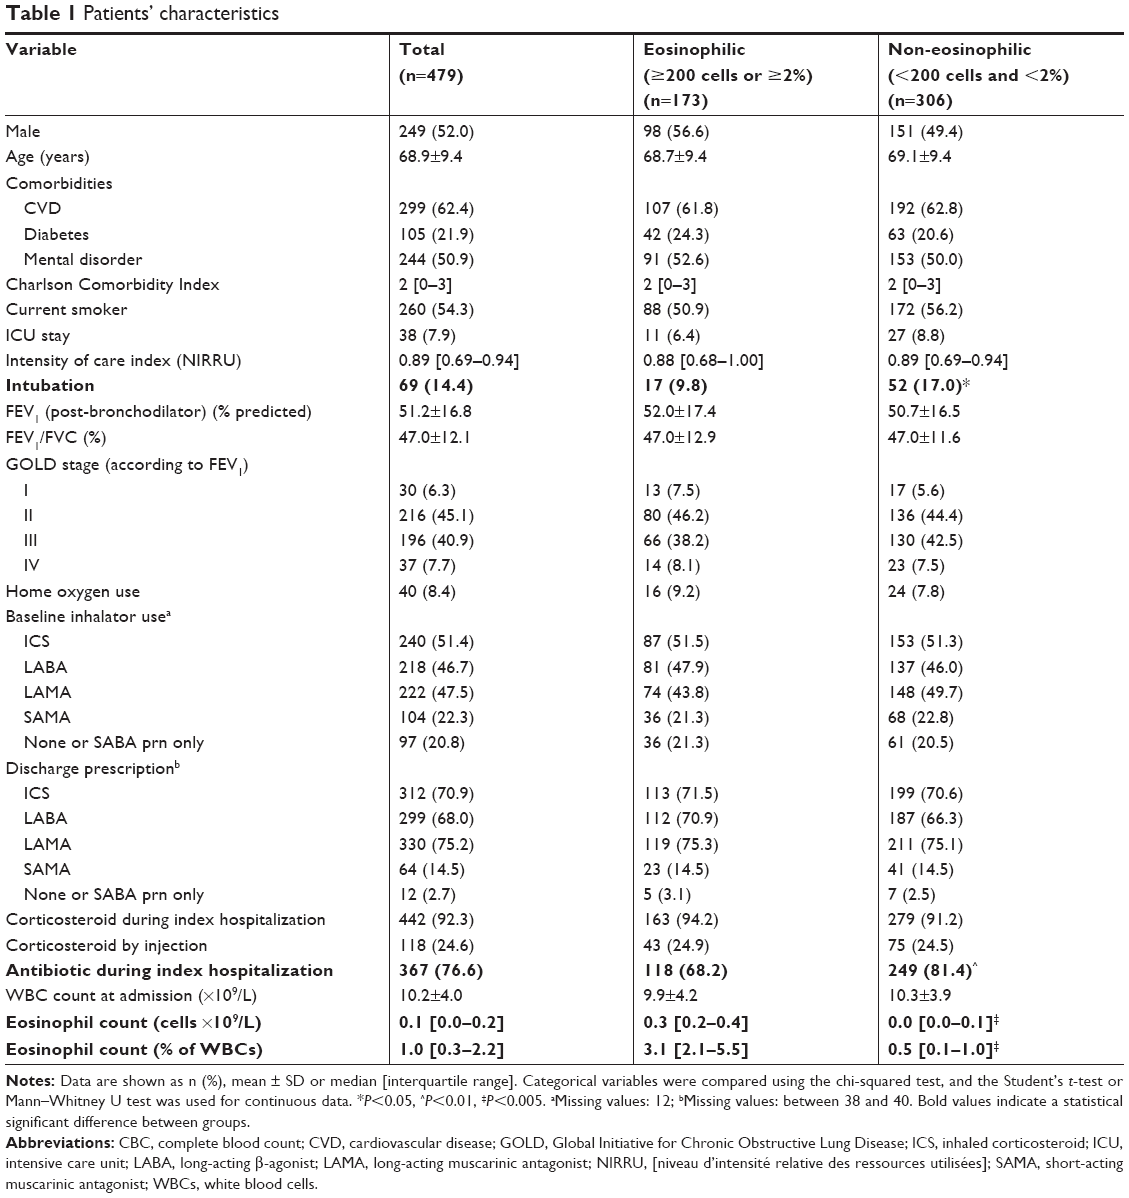 | Table 1 Patients’ characteristics |
The average total cost was $18,264, including $6,706 for the index hospitalization and $11,558 for the 1-year follow-up (Table 2 and Figure 2). The equivalent costs in USD were $23,798 for the total cost, $8,738 for the index hospitalization, and $15,060 for the 1-year follow-up. The last was mainly attributed to hospitalizations ($10,344), with 258 patients (53.9%) being readmitted, 119 of them once and 139 more than once (range one to eight times). For the total 1-year all-cause cost and the total 1-year COPD-related cost, regardless of eosinophil cell counts, 90% of the cost was explained by hospitalizations, 7% by emergency visits, and 3% by ambulatory medical services. Nearly one-third of patients had total costs of over $20,000 (32.4% vs 26.8% for eosinophilic and non-eosinophilic patients, respectively, P=0.196) (Table S2). Considering only the index hospitalization, almost half had a cost between $5,000 and $6,500. There was no significant difference between groups considering total, index, or 1-year costs.
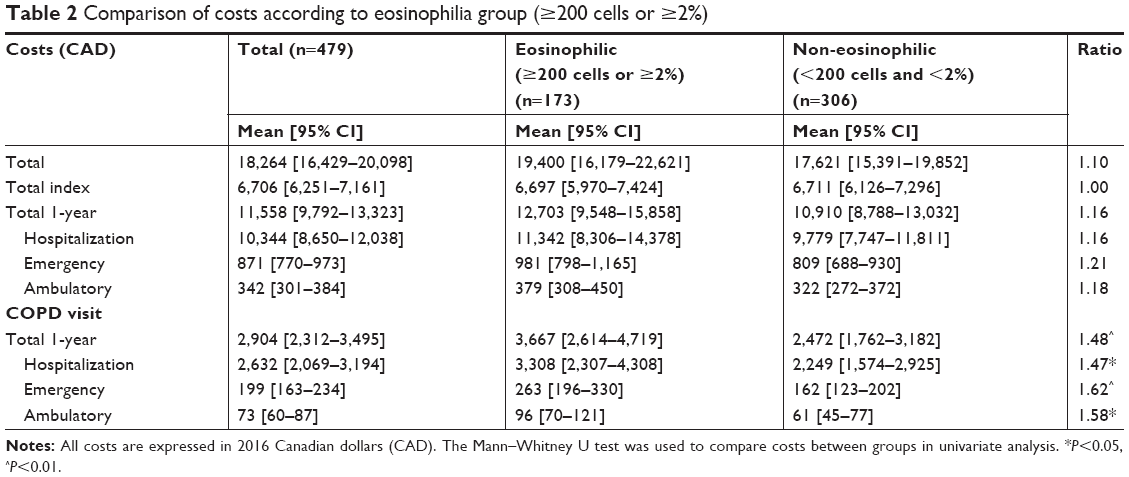 | Table 2 Comparison of costs according to eosinophilia group (≥200 cells or ≥2%) |
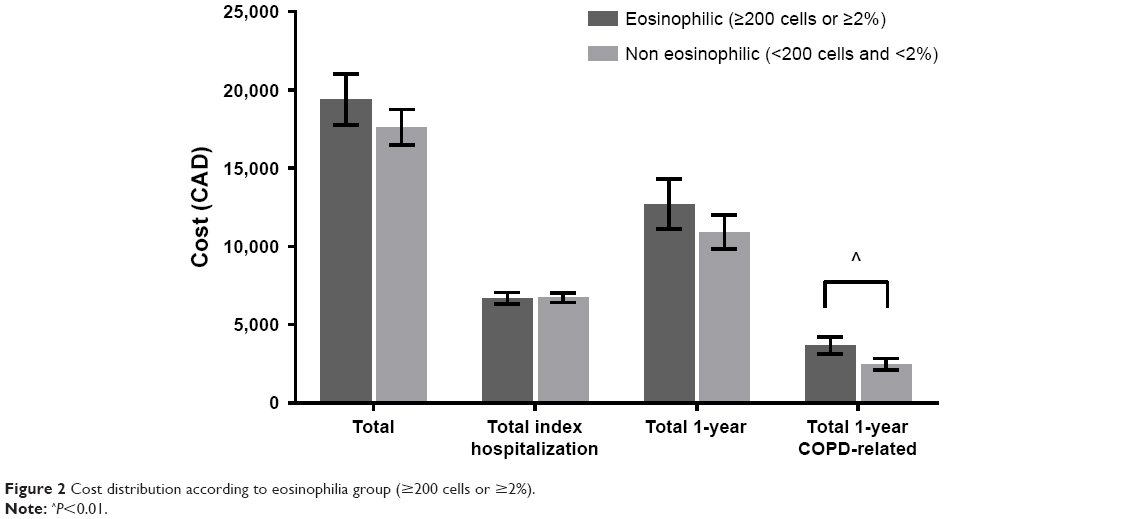 | Figure 2 Cost distribution according to eosinophilia group (≥200 cells or ≥2%). |
Of the 320 patients with all-cause 1-year follow-up health-care use (readmissions, emergency, or ambulatory visits), only 168 (52.5%) had a COPD-related use. The average total 1-year COPD-related cost was $2,904 ($3,784 USD), 25% of the total 1-year all-cause cost. This amount was higher in eosinophilic patients, with a mean difference of $1,195 (P<0.01) (Table 2). Significant mean differences were observed for 1-year COPD-related readmissions ($1,059, P<0.05), and emergency ($101, P<0.01) and ambulatory ($35, P<0.05) service use. When using the higher eosinophil cut-off of ≥400 cells or ≥3%, the difference was slightly increased, with a mean difference of $1,431 ($1,865 USD) by patient for the annual cost after the first hospitalization instead of $1,195 ($1,557 USD), a difference of $237 (Table 3).
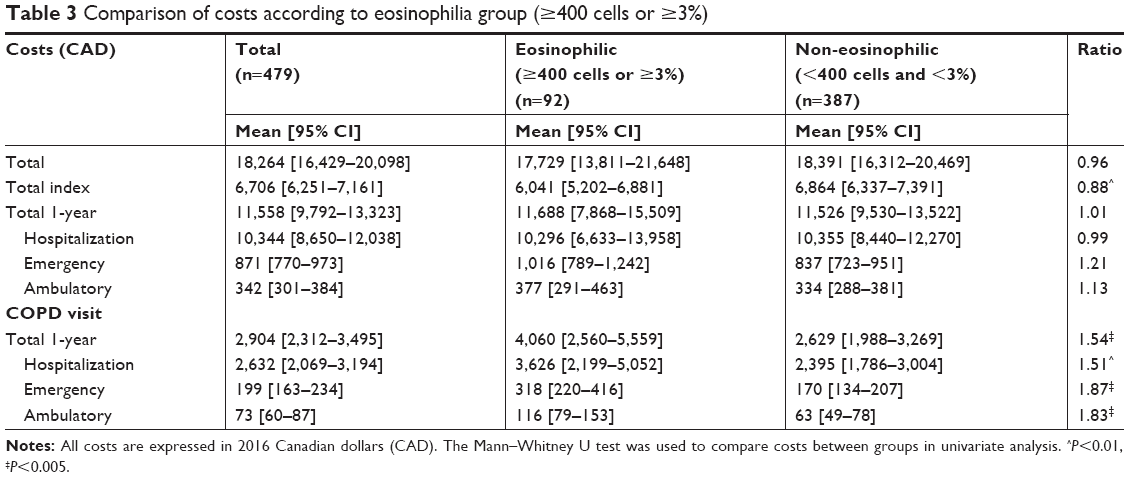 | Table 3 Comparison of costs according to eosinophilia group (≥400 cells or ≥3%) |
The adjusted results were very close to the non-adjusted results (Table 4). The results for total cost, total index hospitalization cost, and total 1-year all-cause cost remained non-significant. For the 1-year COPD-related cost, the adjusted results remained significantly higher for eosinophilic patients and the differences were increased. The adjusted mean difference for 1-year post-index and 1-year hospitalization increased on average by $200 for the eosinophilic groups compared with the non-adjusted difference. The difference between the two eosinophil cut-offs for adjusted mean difference was $224 ($292 USD) for 1-year post-index and $254 ($331 USD) for 1-year hospitalization.
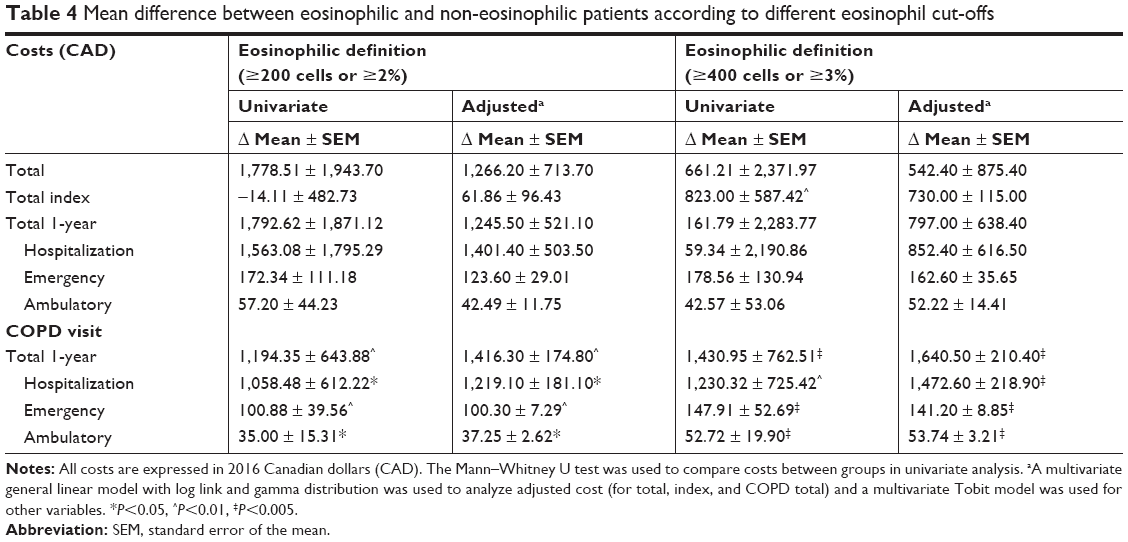 | Table 4 Mean difference between eosinophilic and non-eosinophilic patients according to different eosinophil cut-offs |
Discussion
Our results demonstrate that higher blood eosinophil cell counts at admission for a first severe COPD exacerbation are associated with higher COPD-related costs in the following year, including readmissions, emergency visits, and ambulatory medical services. The adjusted mean increase of more than $1,400 ($1,800 USD) was significant. To our knowledge, this is the first proof of an economic burden associated with an eosinophil inflammatory profile.
Of note, although the eosinophilic group had an almost $1,800 ($2,300 USD) increment in total all-cause costs during the 1-year follow-up, this 16% increase was not statistically significant. Likewise, there was no difference in the index hospitalization costs between groups. One can infer a few points from these observations. First, the total 1-year COPD-related cost explained only 25% of the total 1-year all-cause cost. The remaining costs could probably be explained by other comorbidities of these patients, considering that the CCI is high, with a median of 2. Second, we must consider that in selecting a first hospitalization for COPD exacerbation, we may have isolated COPD patients who are less prone to readmissions. This translates into a lower COPD-related readmission rate in this sample than in a previous report.14 Finally, the lack of difference in index hospitalization costs between the two groups may be due to survival bias, insofar as included patients had to be discharged alive from this first hospitalization. As clearly indicated by the Dyspnoea, Eosinopenia, Consolidation, Acidaemia and atrial Fibrillation (DECAF) score for predicting in-hospital mortality in COPD exacerbations27 and other studies,28–31 eosinopenic patients are at increased risk of adverse outcomes as inpatients. The few negative findings of this study highlight the plurality of factors that affect health-care utilization by COPD patients.
In the extant literature, there is considerable variability in costs per exacerbation, ranging from $88 to $7,757 (USD), since the severity of exacerbations was not the same between studies.8 In our study, the index cost was $6,700 ($8,730 USD), compared to the Canadian study of Mittmann et al,9 with a hospitalization cost of $9,557 ($12,453 USD) in Ontario. This difference can be explained by the facts that we selected first COPD hospitalizations only, that we excluded patients who died on the index hospitalization (exponential costs at end of life),32 and that they included additional costs such as transportation and medication changes. In addition, care costs in Quebec are lower than in Ontario. Previous studies demonstrated that the more severe an exacerbation, the greater the health-care utilization and costs.7–10 Our study demonstrates that, regarding severe COPD exacerbations, even a first episode of hospitalization is of comparable economic importance to that which was previously reported in a Canadian general COPD patient sample.9 In addition, the total cost was mainly explained by hospitalizations,7–12 which was also observed in several studies.
One limitation of our study is that some values were not available in our hospital (ie, running cost for emergency visits, the fee for ICU use, and remuneration of physicians during hospitalization) and were taken from a previous study and calculated from the data of the Quebec Heart and Lung Institute.18 However, we are confident that we would have similar fees since this hospital is in the same province, and has a very similar cost structure and comparable protocols of care. In addition, the NIRRU represents an estimate of the relative intensity level of resource utilization (diagnostic, therapeutic, or maintenance interventions) during hospitalization and is an aggregation of data based on the average patient for 1 year.33 On the other hand, the NIRRU is based on real data from our hospital, so the data still reflect the cost of the resources used. Another limitation is that we did not have access to drugs claimed in the community pharmacies, which biased our cost calculations downward. However, according to Mittman et al,9 drugs claimed in the community pharmacies and hospitals represent less than 1% of total cost in resource uses for moderate and acute exacerbations. Thus, this limitation may have a negligible impact on our results. A further limitation was associated with the difficulty in finding a good estimator for costs with a large number of zero values. The presence of many zeros can lead to a number of econometric problems when using ordinary least squares to estimate the unknown parameters of a regression model.26 A multivariate linear regression model with bootstrapping was also used to correct for potential uncertainty surrounding the data (not shown), and the results were similar and went in the same direction. Also, in order to follow patients for 1 year, we excluded patients who died during the index hospitalization, which may significantly impact the relative costs in our studied groups, especially since the non-eosinophilic group was much more frequently intubated. Finally, we must underline that this was a retrospective observational study, and the usual biases of these designs must be considered.
Although the current study focused exclusively on the economic aspect of increased readmissions in COPD patients with higher eosinophilic counts, it may have certain clinical and research implications. Indeed, international and certain national guidelines now support the consideration of blood eosinophil counts in certain therapeutic decisions.34–36 Moreover, monoclonal antibody therapy specifically aimed at eosinophil cell inflammation is beginning to be studied in the context of COPD, although results have been somewhat contradictory. We suggest that further research regarding tailored therapy could be combined with cost-analysis studies of monoclonal vs tailored inhaled vs regular therapy in these patients.
Conclusion
This study demonstrates that higher blood eosinophil cell counts at admission for a first severe COPD exacerbation are associated with an adjusted average increase in COPD-related costs of $1,416–1,641 ($1,845–2,138 USD) per patient in the following year. This financial weight was not significant when compared with all-cause health-care utilization by patients. With a mean cost of $6,700 ($8,731 USD) for the index hospitalization of those discharged alive, the economic burden of COPD is heavy, even when considering a first severe exacerbation. Our analyses highlight that this burden can only be alleviated by addressing the patient holistically. Whether specifically addressing the eosinophil inflammatory profile in COPD is financially worthwhile remains to be shown, but this may be plausible if COPD exacerbations weigh heavily in total health-care utilization, such as in the frequent exacerbator. Additional research on this subject is needed.
Acknowledgment
This study was conducted with funding support from AstraZeneca Canada Inc.
Disclosure
AV and TGP report grants from AstraZeneca Canada Inc, during the conduct of the study; PL reports grants and personal fees from AstraZeneca, Boehringer Ingelheim, and Novartis, grants from Sanofi, and personal fees from Merck, outside the submitted work. The authors report no other conflicts of interest in this work.
References
GBD 2015 Chronic Respiratory Disease Collaborators. Global, regional, and national deaths, prevalence, disability-adjusted life years, and years lived with disability for chronic obstructive pulmonary disease and asthma, 1990–2015: a systematic analysis for the Global Burden of Disease Study 2015. Lancet Respir Med. 2017;5(9):691–706. | ||
Canadian Institute for Health Information. All-Cause Readmission to Acute Care and Return to the Emergency Department. Ottawa, Ont.: CIHI; 2012. | ||
Wier LM, Elixhauser A, Pfuntner A, Au DH. Overview of Hospitalizations among Patients with COPD, 2008. HCUP Statistical Brief #106. February 2011. Rockville, MD: Agency for Healthcare Research and Quality. Available from: http://www.hcup-us.ahrq.gov/reports/statbriefs/sb106.pdf. Accessed September 10, 2018. | ||
Mannino DM, Braman S. The epidemiology and economics of chronic obstructive pulmonary disease. Proc Am Thorac Soc. 2007;4(7):502–506. | ||
Hilleman DE, Dewan N, Malesker M, Friedman M. Pharmacoeconomic evaluation of COPD. Chest. 2000;118(5):1278–1285. | ||
Celli BR, MacNee W, Agusti A, ATS/ERS Task Force. Standards for the diagnosis and treatment of patients with COPD: a summary of the ATS/ERS position paper. Eur Respir J. 2004;23(6):932–946. | ||
Andersson F, Borg S, Jansson SA, et al. The costs of exacerbations in chronic obstructive pulmonary disease (COPD). Respir Med. 2002;96(9):700–708. | ||
Toy EL, Gallagher KF, Stanley EL, Swensen AR, Duh MS. The economic impact of exacerbations of chronic obstructive pulmonary disease and exacerbation definition: a review. COPD. 2010;7(3):214–228. | ||
Mittmann N, Kuramoto L, Seung SJ, Haddon JM, Bradley-Kennedy C, Fitzgerald JM. The cost of moderate and severe COPD exacerbations to the Canadian healthcare system. Respir Med. 2008;102(3):413–421. | ||
Pasquale MK, Sun SX, Song F, Hartnett HJ, Stemkowski SA. Impact of exacerbations on health care cost and resource utilization in chronic obstructive pulmonary disease patients with chronic bronchitis from a predominantly Medicare population. Int J Chron Obstruct Pulmon Dis. 2012;7:757–764. | ||
Dalal AA, Christensen L, Liu F, Riedel AA. Direct costs of chronic obstructive pulmonary disease among managed care patients. Int J Chron Obstruct Pulmon Dis. 2010;5:341–349. | ||
Miravitlles M, Murio C, Guerrero T, Gisbert R, DAFNE Study Group. Decisiones sobre Antibioticoterapia y Farmacoeconomía en la EPOC. Pharmacoeconomic evaluation of acute exacerbations of chronic bronchitis and COPD. Chest. 2002;121(5):1449–1455. | ||
Schermer TR, Saris CG, van den Bosch WJ, et al. Exacerbations and associated healthcare cost in patients with COPD in general practice. Monaldi Arch Chest Dis. 2006;65(3):133–140. | ||
Couillard S, Larivée P, Courteau J, Vanasse A. Eosinophils in COPD Exacerbations Are Associated With Increased Readmissions. Chest. 2017;151(2):366–373. | ||
Bafadhel M, Pavord ID, Russell REK. Eosinophils in COPD: just another biomarker? Lancet Respir Med. 2017;5(9):747–759. | ||
Suissa S, dell’aniello S, Ernst P. Long-term natural history of chronic obstructive pulmonary disease: severe exacerbations and mortality. Thorax. 2012;67(11):957–963. | ||
Ho TW, Tsai YJ, et al; HINT Study Group, et al. In-hospital and one-year mortality and their predictors in patients hospitalized for first-ever chronic obstructive pulmonary disease exacerbations: a nationwide population-based study. PLoS One. 2014;9(12):e114866. | ||
Poder TG, Kouakou CRC, Bouchard PA, et al. Cost-effectiveness of FreeO2 in patients with chronic obstructive pulmonary disease hospitalised for acute exacerbations: analysis of a pilot study in Quebec. BMJ Open. 2018;8(1):e018835. | ||
Régie de l’assurance maladie du Québec. Manuel des médecins omnipraticiens (no 100); 2015. Available from: http://www.ramq.gouv.qc.ca/SiteCollectionDocuments/professionnels/manuels/100-facturation-omnipraticiens/000_complet_acte_omni.pdf | ||
Régie de l’assurance maladie du Québec. Manuel des médecins spécialistes (no 150); 2016. Available from: http://www.ramq.gouv.qc.ca/SiteCollectionDocuments/professionnels/manuels/150-facturation-specialistes/000_complet_acte_spec.pdf. | ||
Régie de l’assurance maladie du Québec. Manuel des médecins spécialistes services de laboratoire en établissement (no 170); 2016. Available from: http://www.ramq.gouv.qc.ca/SiteCollectionDocuments/professionnels/manuels/170-sle-specialistes/000_manuel_complet_sle_spec.pdf | ||
Singh D, Kolsum U, Brightling CE, Locantore N, Agusti A, Tal-Singer R, ECLIPSE investigators. Eosinophilic inflammation in COPD: prevalence and clinical characteristics. Eur Respir J. 2014;44(6):1697–1700. | ||
Vedel-Krogh S, Nielsen SF, Lange P, Vestbo J, Nordestgaard BG. Blood Eosinophils and Exacerbations in Chronic Obstructive Pulmonary Disease. The Copenhagen General Population Study. Am J Respir Crit Care Med. 2016;193(9):965–974. | ||
D’Hoore W, Bouckaert A, Tilquin C. Practical considerations on the use of the Charlson comorbidity index with administrative data bases. J Clin Epidemiol. 1996;49(12):1429–1433. | ||
Blough DK, Ramsey SD. Using Generalized Linear Models to Assess Medical Care Costs. Health Serv Outcomes Res Methodol. 2000;1(2):185–202. | ||
Humphreys BR. Dealing With Zeros in Economic Data. University of Alberta, Department of Economics; 2013. Available from: https://pdfs.semanticscholar.org/35c3/8229c8f7393acffc93b4a83120661df1f02c.pdf. Accessed September 10, 2018. | ||
Steer J, Gibson J, Bourke SC. The DECAF Score: predicting hospital mortality in exacerbations of chronic obstructive pulmonary disease. Thorax. 2012;67(11):970–976. | ||
Bafadhel M, Greening NJ, Harvey-Dunstan TC, et al. Blood Eosinophils and Outcomes in Severe Hospitalized Exacerbations of COPD. Chest. 2016;150(2):320–328. | ||
Prins HJ, Duijkers R, Lutter R, et al. Blood eosinophilia as a marker of early and late treatment failure in severe acute exacerbations of COPD. Respir Med. 2017;131:118–124. | ||
Duman D, Aksoy E, Agca MC, et al. The utility of inflammatory markers to predict readmissions and mortality in COPD cases with or without eosinophilia. Int J Chron Obstruct Pulmon Dis. 2015;10:2469–2478. | ||
Serafino-Agrusa L, Scichilone N, Spatafora M, Battaglia S. Blood eosinophils and treatment response in hospitalized exacerbations of chronic obstructive pulmonary disease: A case-control study. Pulm Pharmacol Ther. 2016;37:89–94. | ||
Yang Z, Norton EC, Stearns SC. Longevity and health care expenditures: the real reasons older people spend more. J Gerontol B Psychol Sci Soc Sci. 2003;58(1):S2–S10. | ||
Daneault S, Fournier J. Gravité clinique, niveau d’accès et NIRRU. Longueuil: Agence de la santé et des services sociaux de la Montérégie; 2014. Available from: http://extranet.santemonteregie.qc.ca/depot/document/3612/Gravit%C3%A9_niveau_acces_NIRRU_APR-DRG_2014-04-04.pdf. Accessed September 10, 2018. | ||
Global Strategy for the Diagnosis, Management and Prevention of COPD. Global Initiative for Chronic Obstructive Lung Disease (GOLD). 2018. Available from: https://goldcopd.org. | ||
Bourbeau J, Bhutani M, Hernandez P, et al. CTS position statement: Pharmacotherapy in patients with COPD – An update. Canadian J Respir Crit Care Sleep Med. 2017;1(4):222–241. | ||
Miravitlles M, Soler-Cataluña JJ, Calle M, et al. Spanish COPD Guidelines (GesEPOC) 2017. Pharmacological Treatment of Stable Chronic Obstructive Pulmonary Disease. Archivos de Bronconeumología (English Edition). 2017;53(6):324–335. |
Supplementary materials
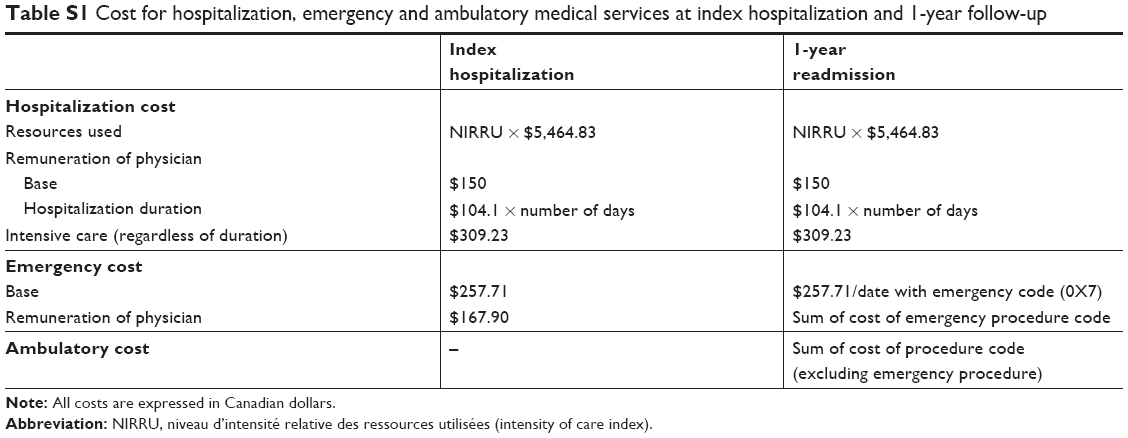 | Table S1 Cost for hospitalization, emergency and ambulatory medical services at index hospitalization and 1-year follow-up |
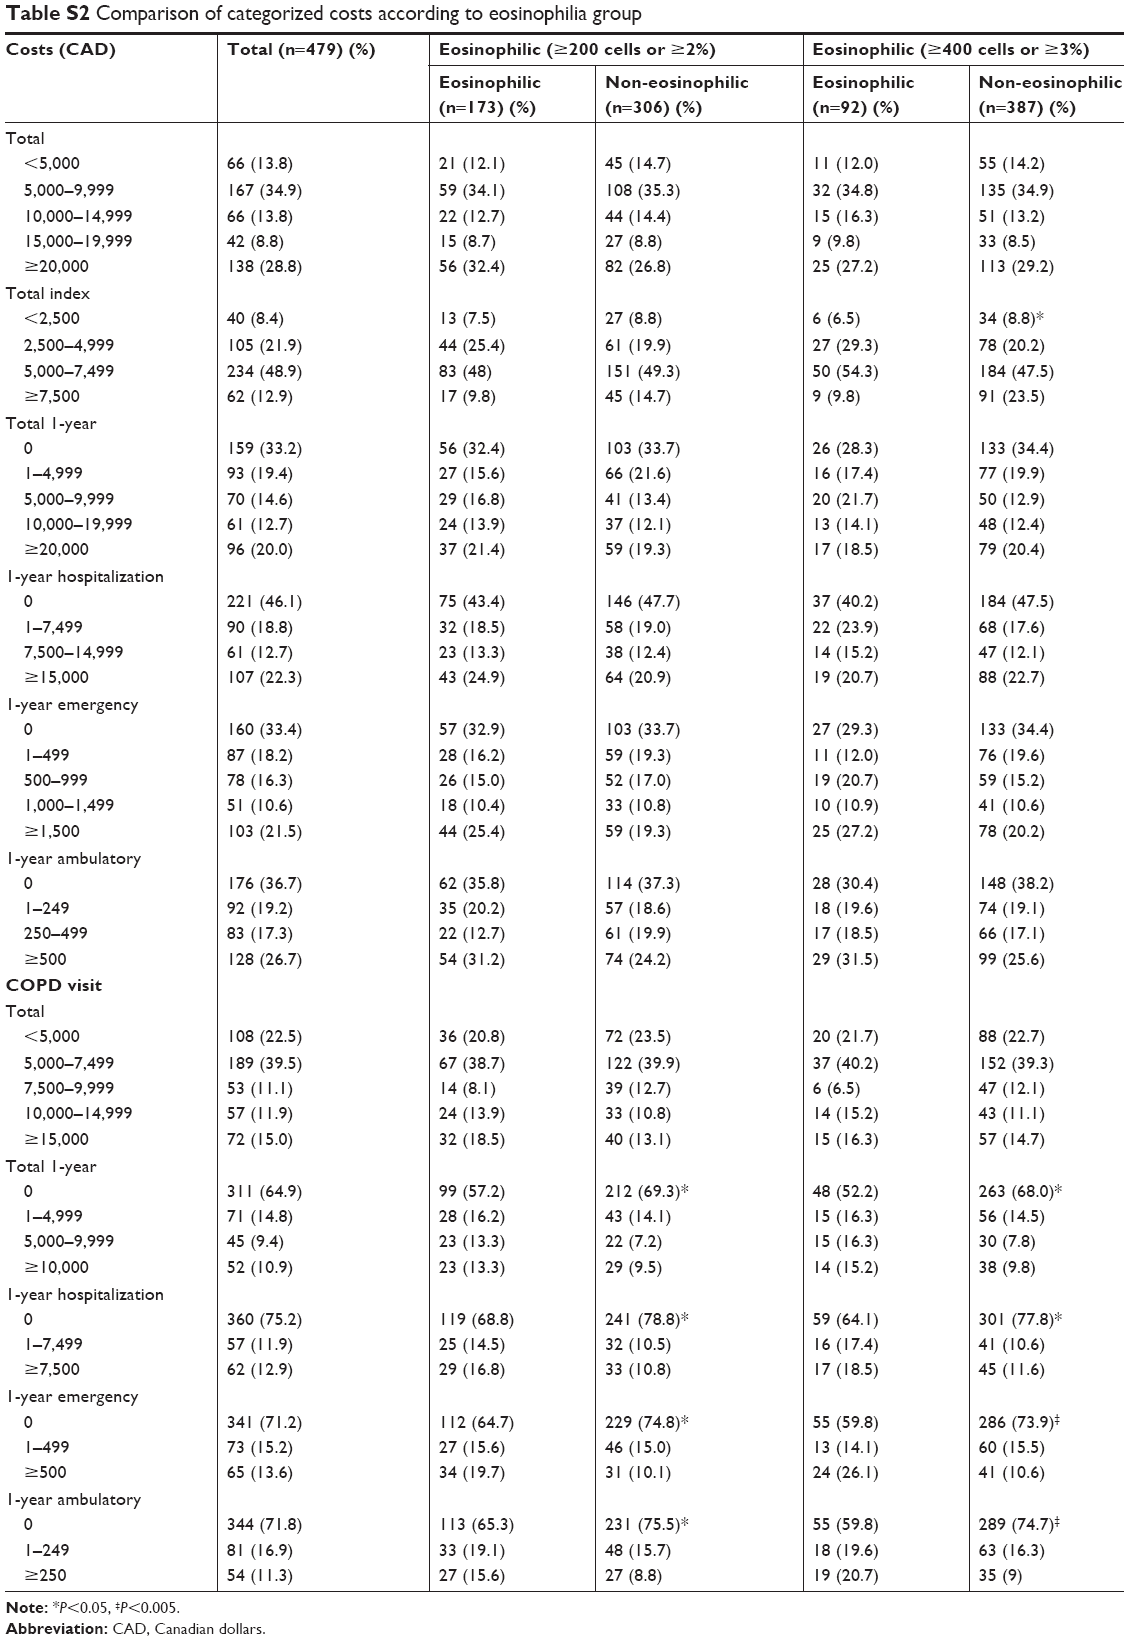 | Table S2 Comparison of categorized costs according to eosinophilia group |
 © 2018 The Author(s). This work is published and licensed by Dove Medical Press Limited. The
full terms of this license are available at https://www.dovepress.com/terms
and incorporate the Creative Commons Attribution
- Non Commercial (unported, 3.0) License.
By accessing the work you hereby accept the Terms. Non-commercial uses of the work are permitted
without any further permission from Dove Medical Press Limited, provided the work is properly
attributed. For permission for commercial use of this work, please see paragraphs 4.2 and 5 of our Terms.
© 2018 The Author(s). This work is published and licensed by Dove Medical Press Limited. The
full terms of this license are available at https://www.dovepress.com/terms
and incorporate the Creative Commons Attribution
- Non Commercial (unported, 3.0) License.
By accessing the work you hereby accept the Terms. Non-commercial uses of the work are permitted
without any further permission from Dove Medical Press Limited, provided the work is properly
attributed. For permission for commercial use of this work, please see paragraphs 4.2 and 5 of our Terms.